
Submitted:
20 July 2026
Posted:
22 July 2026
You are already at the latest version
Abstract
This study examines whether renewable energy production is capable of covering energy costs in European Union family farms and identifies the determinants of the Energy Cost Coverage Ratio across different economic size classes. The analysis was based on Farm Sustainability Data Network (FSDN) data for 2014-2023 and combined descriptive statistics with panel data models. The results indicate that the Energy Cost Coverage Ratio remained relatively stable, fluctuating between 30.9% and 39.2%, despite a substantial increase in renewable energy production from €1594 to €2999 per farm. This limited improvement resulted from a simultaneous rise in energy costs, which increased from €5162 to €8465 per farm over the analysed period. Considerable differences in the Energy Cost Coverage Ratio were observed between economic size classes, while panel data models showed that its determinants vary across farm classes, with no single factor being significant for all classes. The findings suggest that renewable energy has strengthened the economic resilience of European farms, but its contribution remains insufficient to fully offset rising energy expenditures, highlighting the need for farm-size-specific policy support.
Keywords:
energy costs
; energy production
; European Union
; family farm
; renewable energy
1. Introduction
The transition towards a low-carbon economy has become one of the central objectives of European Union policy [1,2]. Increasing the share of renewable energy sources is expected not only to reduce greenhouse gas emissions and dependence on fossil fuels but also to improve energy security and the long-term sustainability of economic activities [3,4,5,6,7,8]. Agriculture occupies a special position in this process because it is simultaneously a consumer and a potential producer of energy. As energy is required throughout the food production chain, fluctuations in energy prices directly affect production costs, farm profitability, and food security [9,10,11,12].
From the perspective of sustainable development, the ability of farms to generate renewable energy may contribute not only to environmental goals but also to economic resilience. Renewable energy production can reduce dependence on external energy supplies, mitigate the effects of rising energy prices, and create an additional source of income for farm households [13,14,15]. However, despite the growing importance of renewable energy in European agriculture, relatively little is known about its actual economic significance at the farm level and, in particular, about its capacity to offset energy costs incurred by agricultural producers.
Therefore, this study examines whether renewable energy production and related activities are capable of covering energy costs in European family farms. Particular attention is paid to differences between farm size classes and to the factors affecting the degree of energy cost coverage. By focusing on the economic dimension of the energy transition, the study contributes to the discussion on the sustainability and resilience of European agriculture under conditions of increasing energy market uncertainty.
2. Related Studies
Agriculture is highly dependent on energy inputs and remains one of the sectors most exposed to changes in energy availability and prices. The growing global population and the need to increase food production place additional pressure on agricultural systems, which must maintain productivity while using resources more efficiently [16]. Energy is required throughout the food supply chain, including agricultural production, processing, storage, packaging and distribution of food products [17,18]. Moreover, both direct energy inputs used on farms and indirect energy embodied in fertilizers, seeds, machinery and other production factors contribute to the overall energy requirements of food production systems [19,20,21,22].
Over recent decades, the intensification of agricultural production and the increasing complexity of food supply chains have strengthened the dependence of agriculture on external energy sources, particularly fossil fuels [23,24,25]. Energy plays a crucial role in maintaining agricultural productivity [26], while food processing is regarded as one of the most energy-intensive stages of the food chain [27]. Previous studies have also highlighted the importance of technological progress and innovation in reducing energy use and improving production efficiency [28,29,30,31,32]. Nevertheless, the adoption of modern technologies often requires substantial investments, which may create additional challenges for farms, especially in less-developed regions.
As a result, the economic consequences of energy use have become increasingly important for the long-term viability of agricultural holdings. While numerous studies have examined energy consumption, energy efficiency and energy structures in agriculture and national economies [33,34,35,36,37], considerably less attention has been paid to the relationship between farm-generated energy and the energy costs incurred by agricultural producers. In particular, there is limited evidence on the extent to which renewable energy production and related on-farm activities can compensate for rising energy expenditures. This issue appears especially relevant in the European Union, where farms operate under diverse production conditions and face growing pressure to improve both their economic resilience and resource-use efficiency.
3. Materials and Methods
The empirical analysis is based on data obtained from the Farm Sustainability Data Network (FSDN), which provides harmonised economic and financial information on commercial farms across the European Union. The database enables comprehensive analyses of production, financial performance, and farm management over the period 2004–2023. Currently (as of July 30, 2026), the database does not contain complete data for 2023, and lacks information for Malta. Also, United Kingdom data is excluded after 2020.
The study focuses on Energy Cost Coverage Ratio, calculated as the ratio of SE730 to SE345 (SEnumber is a name a variable in FSDN database). This indicator reflects the extent to which revenues generated from renewable energy and related activities correspond to farm expenditure on motor fuels, lubricants, electricity, and heating fuels.
Despite the acknowledged limitations of these indicators, they constitute the only currently available and harmonised data published by the European Commission within the FSDN database. Consequently, they were adopted for the present analysis, as the collection of primary data from FSDN farms through a separate survey is not feasible given the methodological framework and confidentiality requirements of the FSDN system. This limitation results from the structure of the FSDN database and the way in which non-agricultural activities are aggregated. Nevertheless, SE730 currently represents the only internationally comparable source of information available for all European Union Member States that allows renewable energy-related activities to be analysed at the farm level.
This study is an attempt to address the questions listed below:
- To what extent does renewable energy production contribute to covering on-farm energy costs in European agriculture?
- How does the Energy Cost Coverage Ratio differ across economic size classes of European farms?
- Which farm characteristics are associated with Energy Cost Coverage Ratio?
Average information was retrieved from the FADN in order to answer the questions 1 and 2. To answer question 3, the Gretl software was used. The panel models based on 1094 individual FSDN observations were estimated.
In its general form, the panel data model can be expressed as follows [38]:
where:
yi,t = αi + X’i,t β + ui,t +εi,t
- − i (i = 1, ..., N) means individuals,
- − t (t = 1, ..., T) means time intervals,
- − -X’i,t is the observation of K explanatory variables (in country i at time t),
- − αi is a time-invariant parameter accounting for any effects that are specific to the individual concerned and are not covered by the regression equation.
Panel data models may be estimated using either Fixed Effects (FEM) or Random Effects (REM) specifications, depending on the assumptions regarding individual effects [39]. The appropriate model was selected using the Hausman test, supported by the characteristics of the analysed data and the substantive interpretation of the results, rather than relying solely on statistical significance tests [40,41,42].
The FSDN database contains aggregated observations representing groups of at least 15 farms rather than individual farm records. Consequently, the appropriate panel specification (FEM or REM) was selected separately for each estimated model based on the Hausman test and the statistical characteristics of the data.
The empirical analysis was based on a set of explanatory variables describing the production, economic, and financial performance of agricultural farms. These variables were selected to capture the key characteristics that may influence renewable energy-related activities and were obtained directly from the FSDN database. The dependent and independent variables included in the analysis are listed below:
- Y01: Energy Cost Coverage Ratio (SE730/SE345, %),
- X01: Labor Inputs (SE010, Annual Work Units),
- X02: Utilized Agricultural Area (SE025, ha),
- X03: Total Output (SE131, €),
- X04: Total Inputs (SE270, €),
- X05: Depreciation (SE360, €),
- X06: Taxes (SE390, €),
- X07: Balance Subsidies and Taxes on Investments (SE405, €),
- X08: Family Farm Income (SE420, €),
- X09: Assets (SE436, €),
- X10: Liabilities (SE485, €),
- X11:Net worth (SE501, €),
- X12: Gross Investment (SE516, €),
- X13: Net Investment (SE521, €),
- X14: Cash Flow (SE526, €),
- X15: Total Subsidies without on Investments (SE605, €).
4. Results
Table 1 presents the evolution of renewable energy-related activities and selected economic indicators of European Union farms during the period 2014–2023. Over the study period, the average value of renewable energy production (SE730) increased from €1594 to €2999 per farm, while average energy costs rose from €5162 to €8465 per farm. Despite these substantial increases in absolute values, the Energy Cost Coverage Ratio remained relatively stable, fluctuating from 30.9% to 35.4%, with the highest value recorded in 2015 (39.2%) (Table 1; Figure 1).
The share of renewable energy production in total farm output remained remarkably stable throughout the analysed period, varying between 2.0% and 2.6%. Similarly, the share of energy costs in total farm inputs fluctuated around 6.7-8.4%, reaching its highest level (8.42%) in 2022, when energy prices increased considerably across Europe (Figure 2). At the same time, the economic performance of European farms improved substantially. Average total output increased from €70960 to €126838 per farm, while farm net income rose from €17452 in 2014 to €30780 in 2023, despite reaching a temporary peak of €41160 in 2022. The average utilised agricultural area also expanded from 33.9 to 41.8 hectares per farm, indicating the continuing structural consolidation of agricultural holdings within the European Union (Table 1; Figure 2).
Overall, the results suggest that although renewable energy production generated progressively higher revenues in absolute terms, their relative importance within total farm production changed only marginally. Likewise, the increase in energy production revenues was accompanied by a comparable rise in energy costs, resulting in a relatively stable level of energy cost coverage throughout the analysed period.
In the following section, the Energy Cost Coverage Ratio, energy production and energy costs and selected additional farm characteristics are analysed according to the economic size of European Union farms (Table 2 and Table 3). Due to the extensive amount of available data, four reference years were selected to provide equal intervals and ensure a clear presentation of long-term trends: 2014, 2017, 2020 and 2023 (Table 2 and Table 3). This approach allows for a consistent comparison of changes over time while limiting the influence of short-term market disturbances. In particular, the exclusion of 2022 reduces the impact of exceptional energy price fluctuations and market instability associated with the geopolitical crisis following the outbreak of the war in Ukraine.
Table 2 presents the Energy Cost Coverage Ratio, energy production, and energy costs of the European Union farms according to economic size classes in 2023, with reference values for the years 2014, 2017, and 2020. The results indicate substantial differences between economic size classes, confirming that the scale of the farm is an important factor differentiating both the level of Energy Production and the ability to cover energy costs.
* Excluding Malta. Source: own calculations based on 2026 FADN data.
The highest values of energy production were consistently observed in the largest farms (class 6, very large). In this group, energy production increased from €33279 per farm in 2014 to €57446 per farm in 2023. At the same time, these farms also recorded the highest energy costs, which increased from €74274 to €88698 per farm over the analysed period. Despite the high level of energy expenditure, the Energy Cost Coverage Ratio in this group was the highest among all economic size classes, reaching 64.77% in 2023 (Table 2). Also large farms (class 5) showed higher levels of energy production compared with smaller farms, increasing from €3768 per farm in 2014 to €4497 in 2023. However, the Energy Cost Coverage Ratio remained considerably lower than in very large farms, reaching 24.14% in 2023 (Table 2).
Medium-sized farms (classes 3 and 4) showed moderate levels of energy production and energy costs, with a gradual decline or limited changes in the Energy Cost Coverage Ratio during the analysed period (Table 2).
The smallest farms demonstrated substantially lower values of energy production and energy costs. In very small farms (class 1), energy production increased from €17 per farm in 2014 to €159 per farm in 2023. However, energy costs also increased, resulting in a relatively low Energy Cost Coverage Ratio of 16.79% in 2023 (Table 2). Small farms (class 2) recorded the lowest Energy Cost Coverage Ratio in 2023 (5.64%), despite higher energy production compared with the smallest farms (Table 2).
Overall, the results show that energy production increases with farm economic size, but the relationship between production and the ability to cover energy costs is not proportional across all classes. The highest Energy Cost Coverage Ratio was observed in very large farms, suggesting that larger farms benefit from greater capacity to generate energy in relation to their energy expenditure.
Table 3 presents selected economic characteristics of European Union farms according to economic size classes, including the share of energy production in total output, the share of energy costs in total inputs, total output, total inputs, total utilised agricultural area, and farm net income. The results demonstrate clear differences between farm size classes and confirm the strong relationship between economic size and the overall scale of farm activity.
The smallest farms (class 1, very small) recorded the lowest values of total output, total inputs, utilised agricultural area, and farm net income. Between 2014 and 2023, total output increased from €6881 to €9602 per farm, while farm net income remained relatively stable, changing from €2756 to €2468. Although energy production increased considerably in relative terms, the share of energy production in total output remained limited, reaching 1.66% in 2023. At the same time, the share of energy costs in total inputs remained relatively high (10.69%), indicating the significant importance of energy expenditure for the smallest farms (Table 3).
Small farms (class 2) showed moderate growth in economic indicators, with total output increasing from €19623 to €21969 per farm between 2014 and 2023. However, the share of energy production in total output declined from 2.05% to 0.54%, while the share of energy costs in total inputs remained above 11% in 2023. Farm net income also remained relatively stable over the analysed period (Table 3).
Medium-small and Medium-large farms (classes 3 and 4) represented intermediate levels of economic activity. In both groups, total output and farm net income increased between 2014 and 2023. For medium-small farms, total output rose from €42898 to €49883 per farm, while farm net income increased from €15305 to €17396. Medium-large farms recorded a stronger increase, with total output growing from €81858 to €94746 and farm net income from €26,084 to €31,153. The contribution of energy production to total output decreased slightly in these classes, reaching 1.88% and 1.47% in 2023, respectively (Table 3).
Large farms (class 5) demonstrated substantially higher levels of production and income. Between 2014 and 2023, total output increased from €237057 to €285777 per farm, while farm net income increased from €54928 to €69867. Despite the increase in energy production, its share in total output remained stable at approximately 1.5-1.6%. The share of energy costs in total inputs also remained relatively low compared with smaller farms, reaching 7.38% in 2023 (Table 3).
The largest farms (class 6, very large) differed markedly from all other groups. In 2023, these farms achieved a total output of €1568367 per farm and farm net income of €282736, accompanied by the largest utilised agricultural area (261.8 ha/farm). They also recorded the highest share of energy production in total output, increasing from 3.00% in 2014 to 3.66% in 2023. At the same time, the share of energy costs in total inputs remained the lowest among all classes (6.46% in 2023) (Table 3).
Overall, the results indicate that larger farms operate at a substantially higher economic scale and generate higher absolute values of energy production. However, the relative importance of energy production differs between farm size classes. While very large farms achieved the highest contribution of energy production to total output, smaller farms faced a considerably higher relative burden of energy costs within their input structure (Table 3).
The models estimated for the Energy Cost Coverage Ratio indicate differences in the determinants of this indicator across farm size classes (Table 4). Total assets had a significant impact in most farm classes and generally showed a negative relationship with the Energy Cost Coverage Ratio. The exception was very large farms, where the relationship was positive. In medium-small, large, and very large farms, an increase in utilised agricultural area reduced the level of energy cost coverage, whereas a positive effect of total output was observed only in small farms. Total inputs had a positive effect in very small and medium-small farms, while in medium-large farms a significant positive impact of total liabilities was identified (Table 4).
The results indicate that the ability of farms to cover energy costs is determined by different factors depending on their economic size. At the same time, the absence of a single variable that was statistically significant across all farm classes suggests that the development of energy-related activities is highly differentiated and depends on the specific characteristics of individual farm groups (Table 4).
5. Discussion
The results obtained in this study indicate that although energy production in European Union farms increased during the analysed period, energy costs also rose substantially. Consequently, improvements in the Energy Cost Coverage Ratio were relatively limited, suggesting that the expansion of on-farm energy production has not been sufficient to offset the growing costs of energy consumption. These findings confirm that increasing energy production alone does not automatically improve the economic resilience of agricultural holdings.
The growing importance of renewable energy in agriculture has been emphasized in numerous studies. Modern farming requires considerable amounts of energy for crop production, livestock management, irrigation, machinery operation and post-harvest processing. Therefore, the transition towards renewable energy sources is increasingly recognised as an important element of sustainable agricultural development and climate policy. However, this transition remains a complex process requiring technological progress, financial support and long-term policy commitment [43].
The present results are consistent with previous studies showing that the development of renewable energy on farms depends not only on the willingness of farmers to invest but also on institutional conditions and regulatory frameworks. In many European countries, administrative procedures, investment costs and different support schemes continue to influence the pace of renewable energy adoption [44]. Consequently, the economic benefits of Energy Production may differ considerably between farms and regions.
Agriculture possesses substantial potential for renewable energy generation because agricultural land and biomass resources can contribute to diversified energy production systems. Nevertheless, renewable energy generated on farms should be regarded as a complementary component of agricultural activity rather than a complete substitute for conventional energy sources. As pointed out in earlier studies, the technical and biological limitations of agricultural production set natural boundaries for the amount of energy that can realistically be produced by farms [45].
The observed increase in Energy Production is also consistent with the long-term priorities of the European Union. Financial instruments implemented under the Common Agricultural Policy and Horizon 2020 have supported investments in innovation, renewable energy technologies and sustainable rural development [46]. Such support has contributed to improving investment opportunities for farms, although access to these instruments remains uneven across regions and farm types.
The results further demonstrate that the role of energy production differs substantially according to the economic size of farms. Larger farms generally generated considerably higher energy production values and achieved higher Energy Cost Coverage Ratios than smaller holdings. The panel data models presented in this study complement these descriptive findings by demonstrating that the determinants of the Energy Cost Coverage Ratio vary across economic size classes. No single explanatory variable remained statistically significant for all farm groups, suggesting that the ability to cover energy costs depends on different combinations of production, financial and structural characteristics. This heterogeneity indicates that the mechanisms shaping farm energy performance cannot be explained by one universal model.
At the farm level, investments in renewable energy frequently require changes in production organisation and long-term planning. Introducing new technologies often involves adjustments in farm management, financial decision-making and investment strategies [47]. Therefore, improvements in Energy Cost Coverage Ratio should be considered as a gradual process rather than an immediate outcome of energy investments.
Previous studies also indicate that the transition towards more sustainable production systems requires not only technological innovation but also changes in business models and resource management. Circular economy concepts, resource efficiency and environmentally oriented innovation are increasingly recognised as important directions for agricultural development [48,49,50]. The relatively modest improvements observed in the Energy Cost Coverage Ratio suggest that these broader transformations are still underway in many European farms.
Overall, the results indicate that renewable energy production has become an increasingly important element of farm development across the European Union. Nevertheless, its economic effectiveness remains strongly differentiated between economic size classes, while rising energy costs continue to limit improvements in energy self-sufficiency. These findings suggest that future support measures should not rely on a uniform approach. Instead, policies promoting renewable energy in agriculture should account for differences in farm economic size, as the determinants of Energy Cost Coverage Ratio vary considerably between farm classes.
6. Conclusions
The main objective of this study was to examine whether renewable energy production and related activities are capable of covering energy costs in European family farms and to identify the factors influencing this relationship across different economic size classes.
The first research question asked to what extent renewable energy production contributes to covering on-farm energy costs in European agriculture. The results indicate that renewable energy revenues covered approximately one-third of average energy costs over the analysed period. Although renewable energy production increased considerably in absolute terms, rising energy expenditures limited improvements in the Energy Cost Coverage Ratio.
The second research question concerned differences in the Energy Cost Coverage Ratio across economic size classes. The findings show substantial variation between farm groups. Very large farms achieved by far the highest Energy Cost Coverage Ratio and generated the greatest renewable energy revenues, whereas small and very small farms exhibited much lower coverage levels and faced a relatively greater burden of energy costs.
The third research question addressed the determinants of the Energy Cost Coverage Ratio. The panel data models demonstrated that the factors influencing energy cost coverage differ across farm size classes. No single explanatory variable was statistically significant for all groups, suggesting that the mechanisms shaping renewable energy performance are heterogeneous and depend on the structural and economic characteristics of farms.
This study has several limitations. First, the analysis relies on aggregated FSDN data rather than individual farm observations. Second, the SE730 indicator combines renewable energy production with other gainful activities, making it impossible to isolate revenues generated exclusively from renewable energy technologies. Although the SE730 variable includes revenues from other gainful activities, renewable energy production accounts for the vast majority of this category, whereas the remaining activities constitute only a negligible proportion. Finally, the study focuses on the European Union as a whole and does not account for country-specific institutional, regulatory, or technological differences.
Future research should use farm-level microdata where available and distinguish between different renewable energy technologies, such as biogas, photovoltaics, and wind energy. Further studies could also investigate the effects of national policy instruments, investment support schemes, and technological innovations on farm energy self-sufficiency and economic resilience.
Author Contributions
Not applicable.
Funding
The publication was financed by ….
Data Availability Statement
FSDN – Farm Sustainability Data Network (Public Database SO) at https://agridata.ec.europa.eu/extensions/FSDNPublicDatabase/FSDNPublicDatabase.html (accessed on June 22, 2026).
Acknowledgments
Not applicable.
Conflicts of Interest
The author declare no conflict of interest.
References
- Biobased economy. What is biobased economy? 2026. Available online: https://www.biobasedeconomy.eu (accessed on 22 June 2026).
- European Commission. Commission proposes strategy for sustainable bioeconomy in Europe. 2012. Available online: http://europa.eu/rapid/press-release_IP-12-124_en.htm (accessed on 22 June 2026).
- Aydoğan, B.; Vardar, G. Evaluating the role of renewable energy. economic growth and agriculture on CO2 emission in E7 countries. Int. J. Sustain. Energy 2020, 39(4), 335–348. [Google Scholar] [CrossRef]
- Chow, J.; Kopp, R. J.; Portney, P. Energy resources and global development. Science 2003, 302(5650), 1528–1531. [Google Scholar] [CrossRef] [PubMed]
- Dehghani-sanij, A.; Sayigh, A. Cisterns: Sustainable Development, Architecture and Energy; River Publisher: New York, USA, 2016. [Google Scholar] [CrossRef]
- Mardiana, A.; Riffat, S. B. Building energy consumption and carbon dioxide emissions: Threat to climate change. J. Earth Sci. Clim. Chang. 2015, S3, 1–3. [Google Scholar] [CrossRef]
- Mohammed, S.; Alsafadi, K.; Takács, I.; Harsányi, E. Contemporary changes of greenhouse gases emission from the agricultural sector in the EU-27. Geol. Ecol. Landsc. 2020, 4(4), 282–287. [Google Scholar] [CrossRef]
- Waheed, R.; Sarwar, S.; Chen, W. The survey of economic growth, energy consumption and carbon emission. Energy Rep. 2019, 5, 1103–1115. [Google Scholar] [CrossRef]
- Canning, P.; Charles, A.; Huang; Polenske, S.; Waters, K. R. Energy Use in the U.S. Food System. United States Department of Agriculture Economic Research Raport 2010, 94, March. Available online: https://web.mit.edu/dusp/dusp_extension_unsec/reports/polenske_ag_energy.pdf (accessed on 23 June 2026).
- Monforti-Ferrario, F.; Dallemand, J.; Pinedo Pascua, I.; Motola, V.; Banja, M.; Scarlat, N.; Medarac, H.; Castellazzi, L.; Labanca, N.; Bertoldi, P.; Pennington, D.; Goralczyk, M.; Schau, E.; Saouter, E.; Sala, S.; Notarnicola, B.; Tassielli, G.; Renzulli, P. Energy use in the EU food sector: State of play and opportunities for improvement. (JRC96121); Publications Office of the European Union: Luxembourg, 2015. [Google Scholar] [CrossRef] [PubMed]
- Pimentel, D.; Pimentel, M. H. Food Energy and Society. 3rd Edition; CRC Press: Boca Raton, FL, USA, 2007. [Google Scholar] [CrossRef]
- Woods, J.; Williams, A.; Hughes, J. K.; Black, M.; Murphy, R. Energy and the food system. Philos. Trans. R. Soc. Lond. Ser. B Biol. Sci. 2010, 365(1554), 2991–3006. [Google Scholar] [CrossRef] [PubMed]
- Abbas, A.; Waseem, M.; Yang, M. An ensemble approach for assessment of energy efficiency of agriculture system in Pakistan. Energy Effic. 2020, 13(3), 1–14. [Google Scholar] [CrossRef]
- Florea, N. M.; Bădîrcea, R. M.; Pîrvu, R.C.; Manta, A. G.; Doran, M. D.; Jianu, E. The impact of agriculture and renewable energy on climate change in Central and East European Countries. Agric. Econ. 2020, 66(10), 444–457. [Google Scholar] [CrossRef]
- Rokicki, T.; Perkowska, A.; Klepacki, B.; Bórawski, P.; Bełdycka-Bórawska, A.; Michalski, K. Changes in Energy Consumption in Agriculture in the EU Countries. Energies 2021, 14(6), 1570. [Google Scholar] [CrossRef]
- Falcone, G.; Stillitano, T.; De Luca, A.I.; Di Vita, G.; Iofrida, N.; Strano, A.; Gulisano, G.; Pecorino, B.; D’Amico, M. Energetic and Economic Analyses for Agricultural Management Models: The Calabria PGI Clementine Case Study. Energies 2020, 13, 1289. [Google Scholar] [CrossRef]
- FAO State of Food and Agriculture 2016; Food and Agriculture Organization of the United Nations: Rome, Italy, 2016; Available online: https://openknowledge.fao.org/server/api/core/bitstreams/07bc7c6e-72e5-488d-b2f7-3c1499d098fb/content (accessed on 23 June 2026).
- Pelletier, N.; Audsley, E.; Brodt, S.; Garnett, T.; Henriksson, P.; Kendall, A.; Kramer, K. J.; Murphy, D.; Nemecek, T.; Troell, M. Energy intensity of agriculture and food systems. Annu. Rev. Environ. Resour. 2011, 36(1), 223–246. [Google Scholar] [CrossRef]
- Banaeian, N.; Zangeneh, M. Study on energy efficiency in corn production of Iran. Energy 2011, 36(8), 5394–5402. [Google Scholar] [CrossRef]
- Grönroos, J.; Seppälä, J.; Voutilainen, P.; Seuri, P.; Koikkalainen, K. Energy use in conventional and organic milk and rye bread production in Finland. Agric. Ecosyst. Environ. 2006, 117, 2-3. 109-118. [Google Scholar] [CrossRef]
- Robertson, G. P.; Paul, E. A.; Harwood, R. R. Greenhouse gases in intensive agriculture: contributions of individual gases to the radiative forcing of the atmosphere. Science 2000, 289(5486), 1922–1925. [Google Scholar] [CrossRef] [PubMed]
- West, T. O.; Marland, G. A synthesis of carbon sequestration, carbon emissions, and net carbon flux in agriculture: Comparing tillage practices in the United States. Agric. Ecosyst. Environ. 2002, 91(1-3), 217–232. [Google Scholar] [CrossRef]
- Arizpe, N.; Giampietro, M.; Ramos-Martin, J. Food security and fossil energy dependence: An international comparison of the use of fossil energy in agriculture (1991–2003). Crit. Rev. Plant Sci. 2011, 30(1-2), 45–63. [Google Scholar] [CrossRef]
- Markussen, M. V.; Østergård, H. Energy analysis of the Danish food production system: Food-EROI and fossil fuel dependency. Energies 2013, 6(8), 4170–4186. [Google Scholar] [CrossRef]
- Parcerisas, L.; Dupras, J. From mixed farming to intensive agriculture: energy profiles of agriculture in Quebec, Canada, 1871-2011. Reg. Environ. Chang. 2018, 18, 1047–1057. [Google Scholar] [CrossRef]
- Campiotti, C.A.; Latini, A.; Scoccianti, M.; Biagiotti, D.; Giagnacovo, G.; Viola, C. Energy efficiency in Italian fruit and vegetables processing industries in the EU agro-food sector context. Riv. Studi Sulla Sostenibilita 2014, 2, 159–174. [Google Scholar] [CrossRef]
- Smil, V. Energy in Nature and Society: General Energetics of Complex Systems; MIT Press: London, UK, 2008. [Google Scholar] [CrossRef]
- Burfoot, D.; Reavell, S.; Wilkinson, D.; Duke, N. Localised air delivery to reduce energy use in the food industry. J. Food Eng. 2004, 62, 23–28. [Google Scholar] [CrossRef]
- Degerli, B.; Nazir, S.; Sorgüven, E.; Hitzmann, B.; Özilgen, M. Assessment of the energy and exergy efficiencies of farm to fork rain cultivation and bread making processes in Turkey and Germany. Energy 2015, 93, 421–434. [Google Scholar] [CrossRef]
- Fritzson, A.; Berntsson, T. Efficient energy use in a slaughter and meat processing plant—opportunities for process integration. J. Food Eng. 2006, 76, 594–604. [Google Scholar] [CrossRef]
- Mirza, S. Reduction of energy consumption in process plants using nanofiltration and reverse osmosis. Desalination 2008, 224, 132–142. [Google Scholar] [CrossRef]
- Wang, L. Energy efficiency technologies for sustainable food processing. Energy Effic. 2014, 7, 791–810. [Google Scholar] [CrossRef]
- Briam, R.; Walker, M.E.; Masanet, E. A comparison of product-based energy intensity metrics for cheese and whey processing. J. Food Eng. 2015, 151, 25–33. [Google Scholar] [CrossRef]
- García-Álvarez, M. T.; Moreno Cuartas, B.; Soares, I. Analyzing the sustainable energy development in the EU-15 by an aggregated synthetic index. Ecol. Indic. 2016, 60, 996–1007. [Google Scholar] [CrossRef]
- Kasperowicz, R.; Štreimikiené, D. Economic growth and energy consumption: comparative analysis of V4 and the “old” EU countries. J. Int. Stud. 2016, 9(2), 181–194. [Google Scholar] [CrossRef]
- Rokicki, T.; Perkowska, A. Changes in Energy Supplies in the Countries of the Visegrad Group. Sustainability 2020, 12(19), 7916. [Google Scholar] [CrossRef]
- Wu, Y. Energy intensity and its determinants in China’s regional economies. Energy Policy 2012, 41, 703–711. [Google Scholar] [CrossRef]
- Wooldridge, J. M. Econometric Analysis of Cross Section and Panel Data; The MIT Press: Cambridge-London, UK, 2002. [Google Scholar]
- Arbia, G.; Piras, G. Convergence in Per-Capita GDP Across European Regions Using Panel Data Models Extended to Spatial Autocorrelation Effects. Ist. Di Studi E Anal. Econ. Working Pap. Available online. 2005, 51. (accessed on 22 July 2026). [Google Scholar] [CrossRef]
- Wooldridge, J. M. Introductory Econometrics. A Modern Approach, 5th ed.; South-Western Cengage Learning: Mason, OH, USA, 2013. [Google Scholar]
- Dańska-Borsiak, B. Dynamiczne modele panelowe w badaniach ekonomicznych; Wydawnictwo Uniwersytetu Łódzkiego: Łódź, Poland, 2011. [Google Scholar]
- Adkins, L.C. Using GRETL for Principles of Econometrics, 4th ed.; Oklahoma State University: Oklahoma, OK, USA, 7 April.
- Rahman, M.M.; Khan, I.; Field, D.L.; Techato, K.; Alameh, K. Powering agriculture: Present status, future potential, and challenges of renewable energy applications. Renew. Energy 2022, 188, 731–749. [Google Scholar] [CrossRef]
- EIP-AGRI. Minipaper: Business Models and Financial Alternatives for On-Farm Renewable Energy Projects. 2018. Available online: https://ec.europa.eu/eip/agriculture/sites/default/files/fg28_mp_businessmodels_2018_en.pdf (accessed on 29 June 2026).
- Ali, S.M.; Dash, N.; Pradhan, A. Role of Renewable Energy on Agriculture. Int. J. Eng. Sci. Emerg. Technol. 2012, 4, 51–57. [Google Scholar]
- European Parliament Resolution of 2 July 2013 on the Contribution of Cooperatives to Overcoming the Crisis (2012/2321(INI)) (2016/C 075/05), Official Journal of the European Union C75/34. Available online: https://eur-lex.europa.eu/legal-content/EN/TXT/PDF/?uri=CELEX:52013IP0301&rid=7 (accessed on 10 July 2026).
- Bigliardi, B.; Filippelli, S. Investigating circular business model innovation through keywords analysis. Sustainability 2021, 13, 5036. [Google Scholar] [CrossRef]
- Linder, M.; Williander, M. Circular Business Model Innovation: Inherent Uncertainties. Bus. Strategy Environ. 2017, 26, 182–196. [Google Scholar] [CrossRef]
- Bocken, N.; Strupeit, L.; Whalen, K.; Nußholz, J. A Review and Evaluation of Circular Business Model Innovation Tools. Sustainability 2019, 11, 2210. [Google Scholar] [CrossRef]
- Sili, M.; Dürr, J. Bioeconomic Entrepreneurship and Key Factors of Development: Lessons from Argentina. Sustainability 2022, 14, 2447. [Google Scholar] [CrossRef]
Figure 1.
Energy Cost Coverage Ratio (%), Energy Production and Costs (€/farm) of the European Union* farms in 2014–2023. Source: own compilation based on Table 1.
Figure 1.
Energy Cost Coverage Ratio (%), Energy Production and Costs (€/farm) of the European Union* farms in 2014–2023. Source: own compilation based on Table 1.
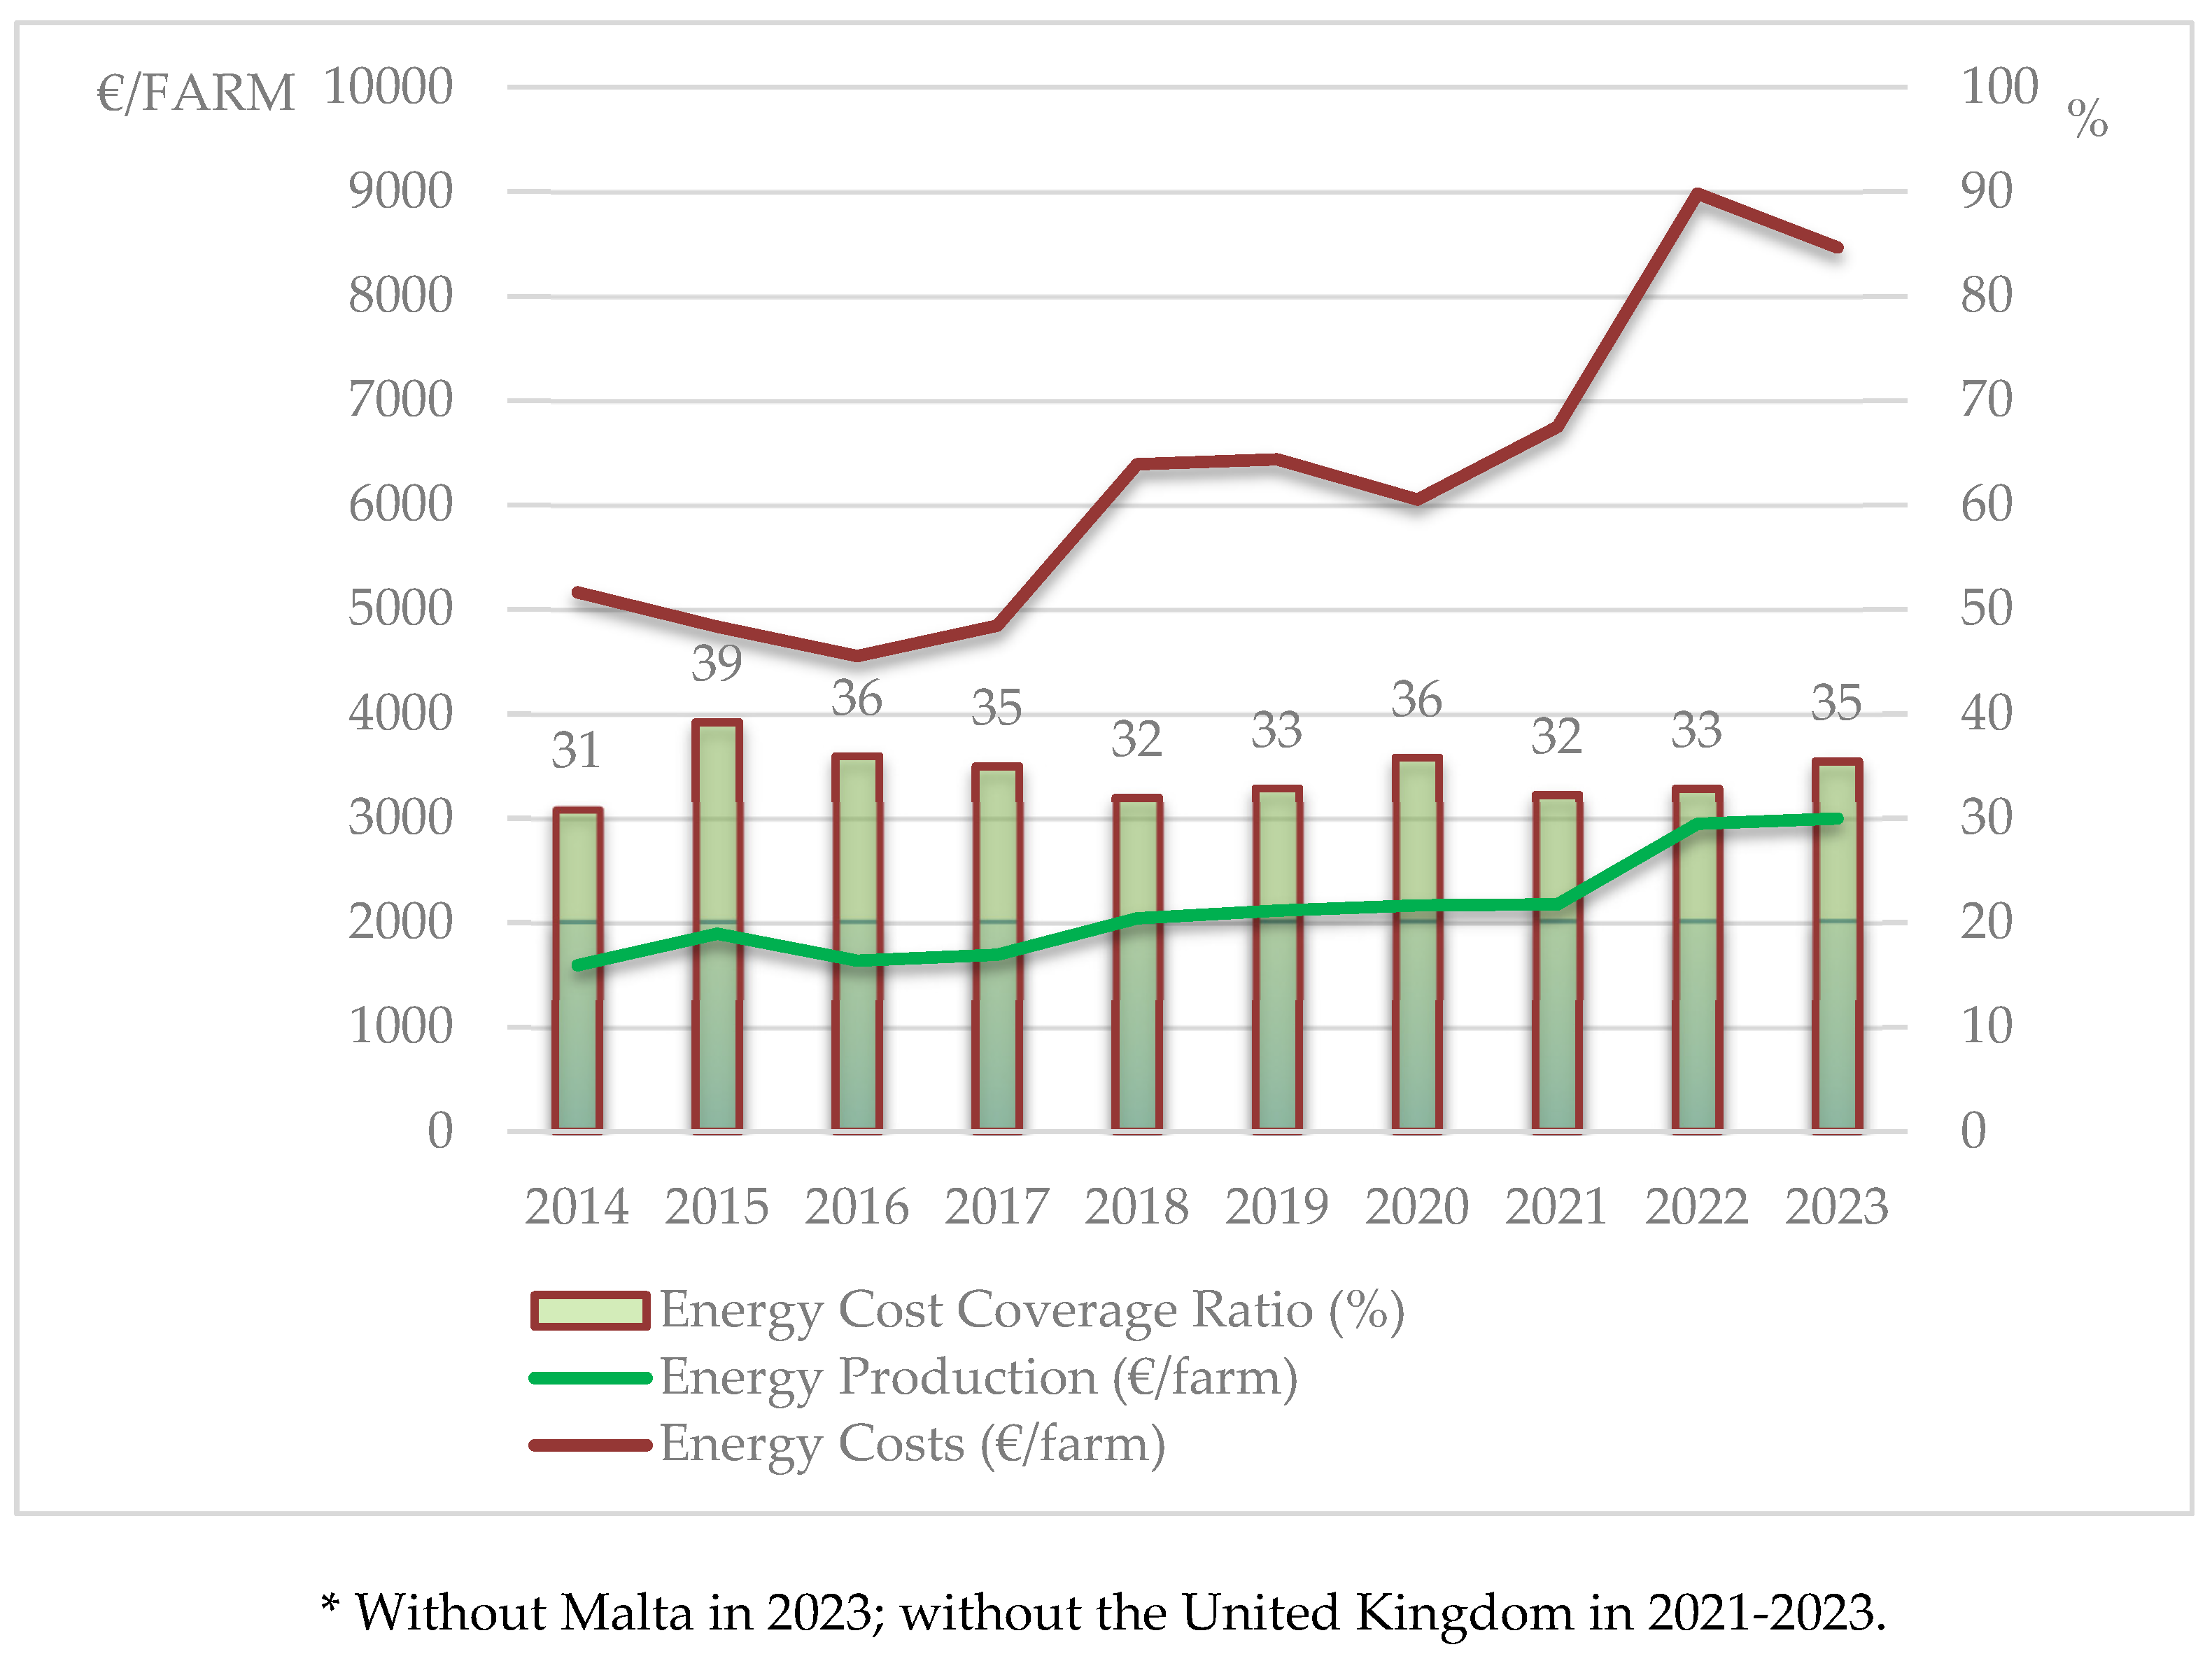
Figure 2.
Share of Energy Production in Total Output (%), Share of Energy Costs in Total Inputs (%), Total Output (€/farm) and Total Inputs (€/farm) in the European Union* in 2014-2023. Source: own compilation based on Table 1.
Figure 2.
Share of Energy Production in Total Output (%), Share of Energy Costs in Total Inputs (%), Total Output (€/farm) and Total Inputs (€/farm) in the European Union* in 2014-2023. Source: own compilation based on Table 1.
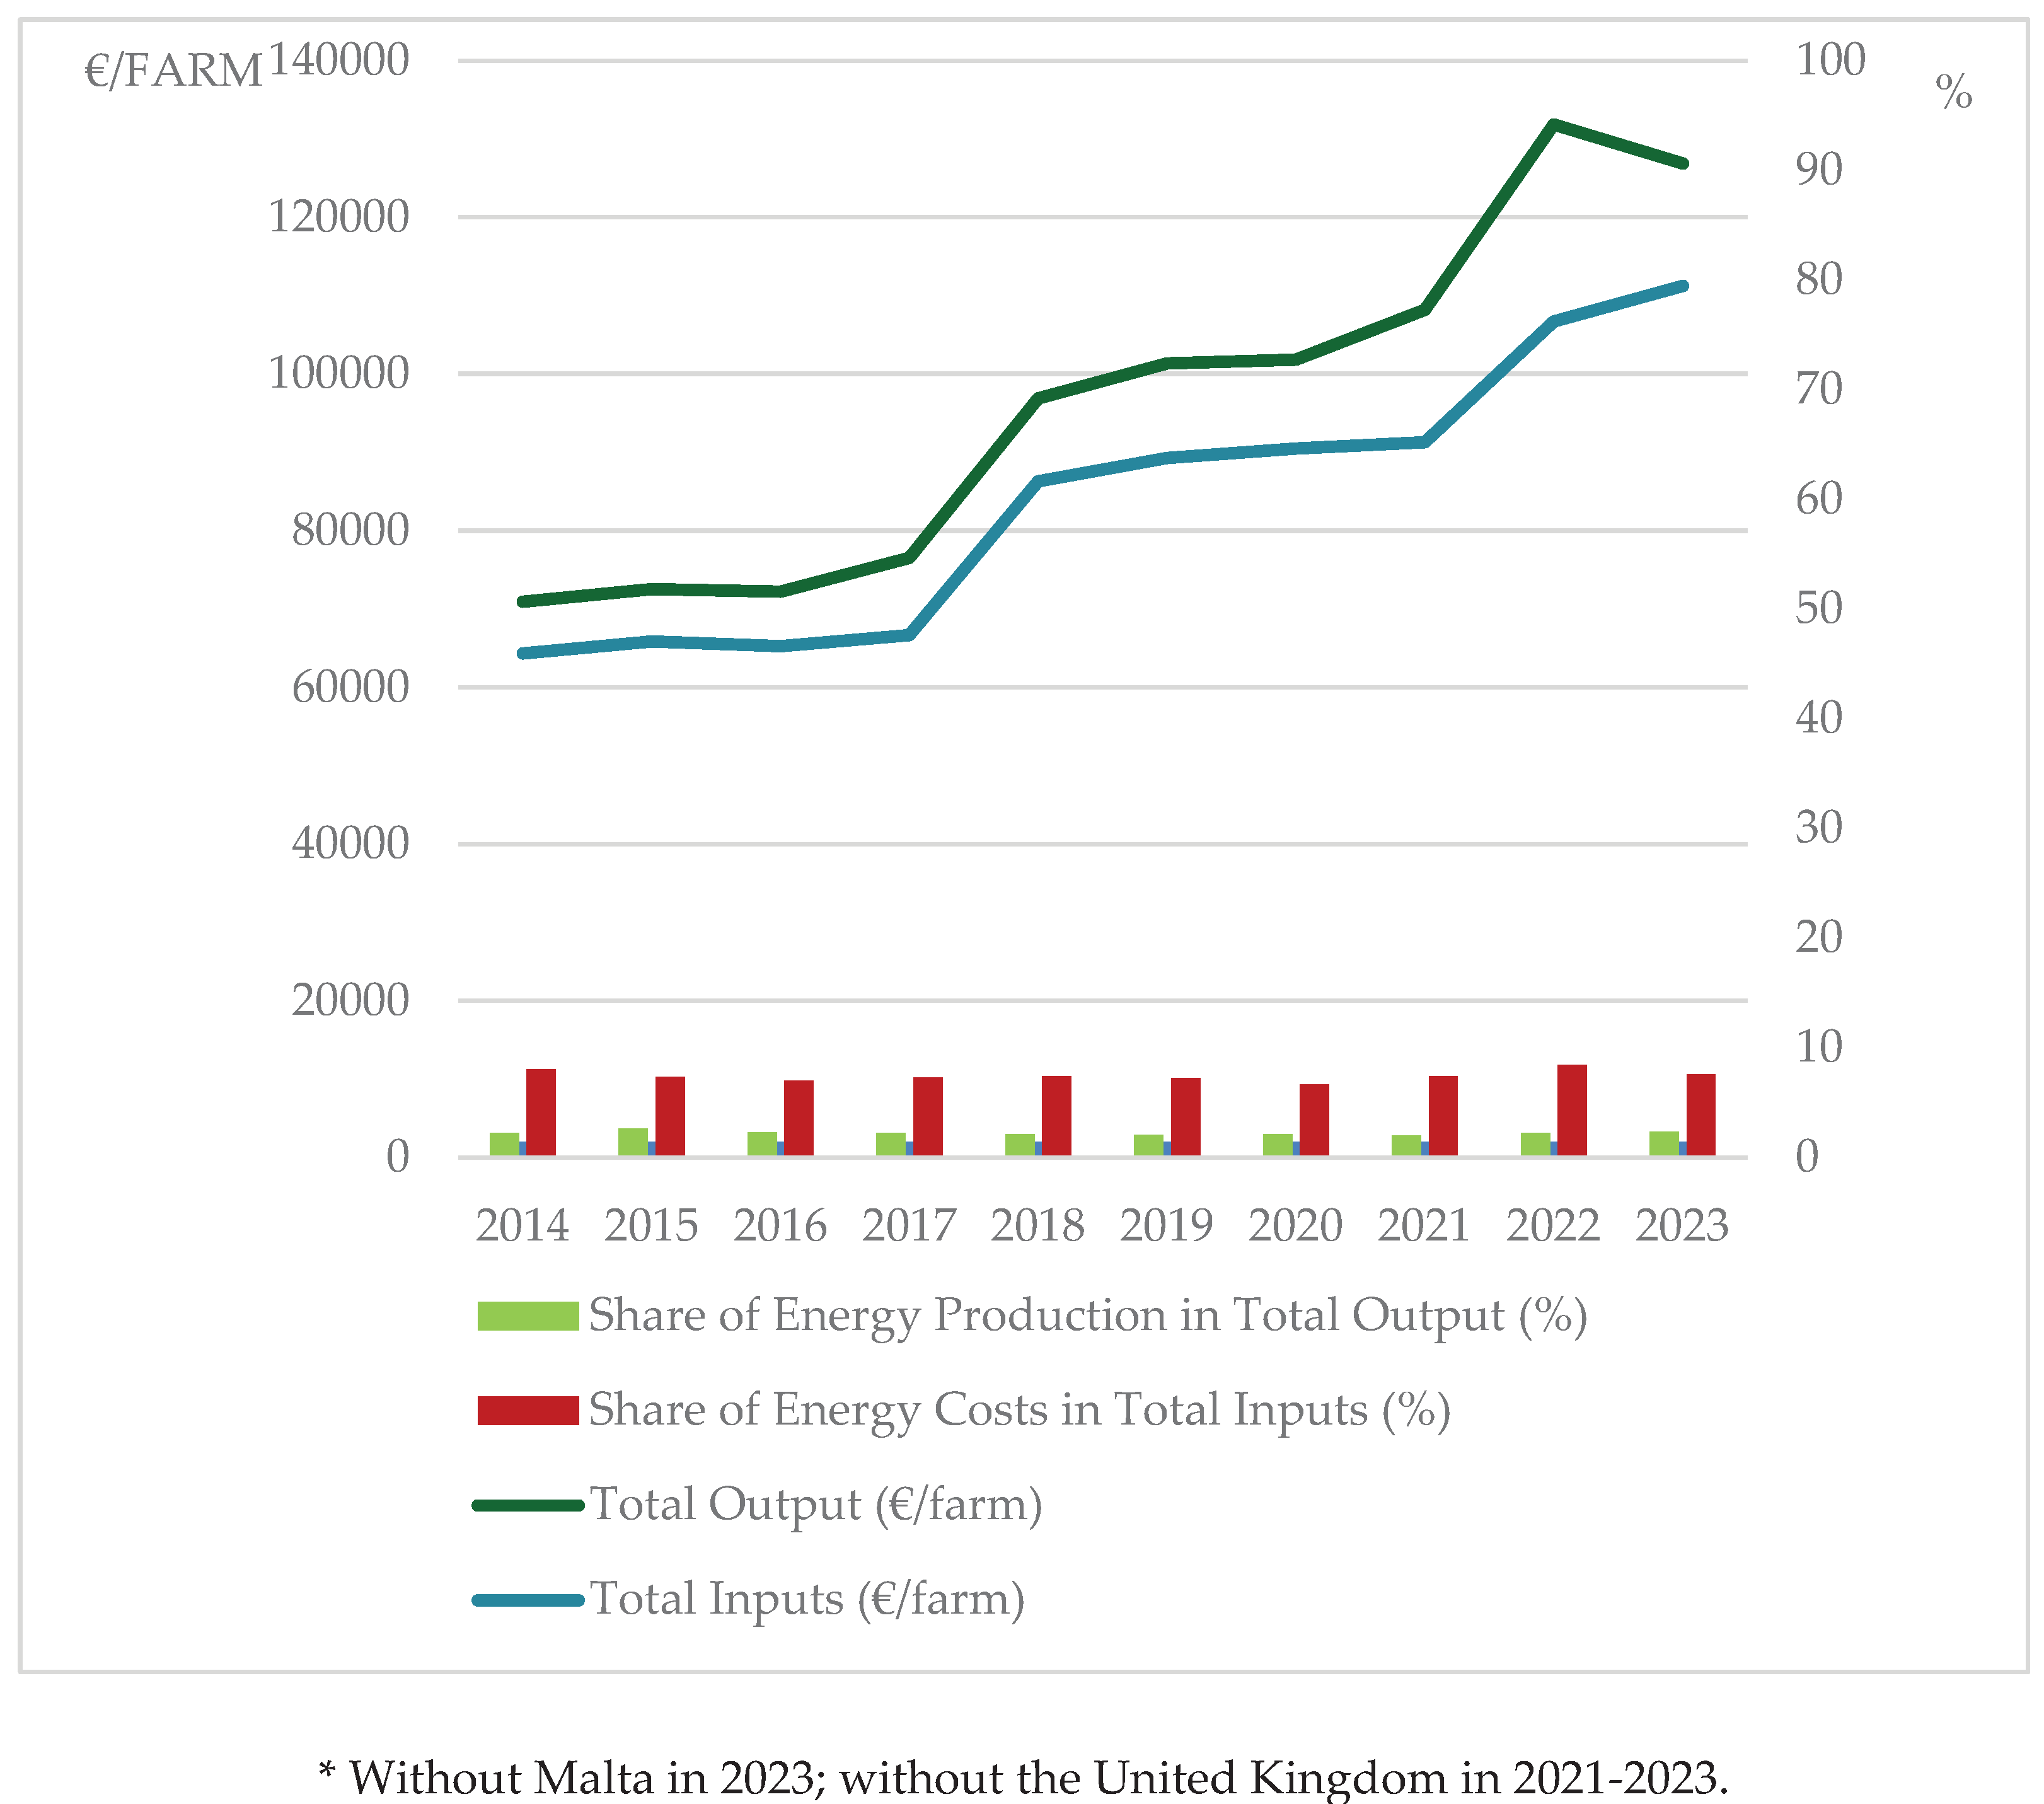

Table 1.
Energy production and costs and other financial details about European Union* farms in 2014–2023.
Table 1.
Energy production and costs and other financial details about European Union* farms in 2014–2023.
| Year | Energy Cost Coverage Ratio (%) | Energy Production (€/farm) | Energy Costs (€/farm) | Share of Energy Production in Total Output (%) | Share of Energy Costs in Total Inputs (%) | Total Output (€/farm) | Total Inputs (€/farm) | Total Utilised Agricultural Area (ha/farm) | Farm Net Income (€/farm) |
| 2014 | 30.88 | 1 594 | 5 162 | 2.25 | 8.02 | 70 960 | 64 362 | 33.9 | 17 452 |
| 2015 | 39.19 | 1 894 | 4 833 | 2.61 | 7.34 | 72 545 | 65 849 | 34.4 | 17 619 |
| 2016 | 35.94 | 1 637 | 4 555 | 2.27 | 6.98 | 72 216 | 65 271 | 34.6 | 18 362 |
| 2017 | 34.97 | 1 694 | 4 844 | 2.21 | 7.27 | 76 539 | 66 661 | 35.1 | 21 613 |
| 2018 | 31.95 | 2 042 | 6 391 | 2.11 | 7.40 | 96 862 | 86 316 | 43.4 | 25 373 |
| 2019 | 32.85 | 2 114 | 6 435 | 2.09 | 7.21 | 101 358 | 89 263 | 43.4 | 27 234 |
| 2020 | 35.80 | 2 166 | 6 051 | 2.13 | 6.69 | 101 810 | 90 468 | 43.5 | 26 968 |
| 2021 | 32.23 | 2 175 | 6 749 | 2.01 | 7.39 | 108 183 | 91 271 | 40.4 | 32 229 |
| 2022 | 32.82 | 2 948 | 8 981 | 2.24 | 8.42 | 131 854 | 106 693 | 41.2 | 41 160 |
| 2023 | 35.43 | 2 999 | 8 465 | 2.36 | 7.61 | 126 838 | 111 277 | 41.8 | 30 780 |
* Without Malta in 2023; without the United Kingdom in 2021-2023. Source: own calculations based on 2026 FSDN data.
Table 2.
Energy Cost Coverage Ratio (%), Energy Production and Costs (€/farm) of the European Union* farms by economic size class in 2023.
Table 2.
Energy Cost Coverage Ratio (%), Energy Production and Costs (€/farm) of the European Union* farms by economic size class in 2023.
| Details | Economic size classes | ||||||
| 1. €2 000 ≤ €8 000 Very Small |
2. €8 000 ≤ €25 000 Small |
3. €25 000 ≤ €50 000 Medium-Small |
4. €50 000 ≤ €100 000 Medium-Large |
5. €100 000 ≤ €500 000 Large |
6. ≥ €500 000 Very Large |
||
| Energy Cost Coverage Ratio (%) | 2014 | 2.64 | 22.14 | 41.41 | 30.47 | 24.02 | 44.81 |
| 2017 | 2.19 | 12.14 | 31.35 | 34.74 | 27.01 | 57.68 | |
| 2020 | 3.55 | 9.13 | 31.03 | 26.51 | 27.74 | 56.54 | |
| 2023 | 16.79 | 5.64 | 21.32 | 18.72 | 24.14 | 64.77 | |
| Energy Production (€/farm) | 2014 | 17 | 402 | 1 576 | 1 981 | 3 768 | 33 279 |
| 2017 | 14 | 191 | 1 015 | 1 885 | 3 538 | 34 131 | |
| 2020 | 25 | 138 | 943 | 1 375 | 3 586 | 34 349 | |
| 2023 | 159 | 119 | 940 | 1 395 | 4 497 | 57 446 | |
| Energy Costs (€/farm) | 2014 | 645 | 1 816 | 3 806 | 6 502 | 15 687 | 74 274 |
| 2017 | 638 | 1 573 | 3 238 | 5 426 | 13 098 | 59 170 | |
| 2020 | 705 | 1 512 | 3 039 | 5 187 | 12 929 | 60 750 | |
| 2023 | 947 | 2 111 | 4 409 | 7 453 | 18 631 | 88 698 | |
* Excluding Malta. Source: own calculations based on 2026 FADN data.
Table 3.
Energy production and costs and other financial details about European Union* farms by economic size class in 2023.
Table 3.
Energy production and costs and other financial details about European Union* farms by economic size class in 2023.
| Details | Economic size classes | ||||||
| 1. €2 000 ≤ €8 000 Very Small |
2. €8 000 ≤ €25 000 Small |
3. €25 000 ≤ €50 000 Medium-Small |
4. €50 000 ≤ €100 000 Medium-Large |
5. €100 000 ≤ €500 000 Large |
6. ≥ €500 000 Very Large |
||
| Share of Energy Production in Total Output (%) | 2014 | 0.25 | 2.05 | 3.67 | 2.42 | 1.59 | 3.00 |
| 2017 | 0.22 | 1.03 | 2.47 | 2.47 | 1.61 | 3.16 | |
| 2020 | 0.35 | 0.75 | 2.35 | 1.80 | 1.58 | 2.96 | |
| 2023 | 1.66 | 0.54 | 1.88 | 1.47 | 1.57 | 3.66 | |
| Share of Energy Costs in Total Inputs (%) | 2014 | 11.93 | 11.23 | 9.93 | 8.84 | 7.29 | 7.04 |
| 2017 | 12.18 | 10.84 | 9.19 | 8.19 | 6.78 | 6.15 | |
| 2020 | 10.77 | 10.32 | 8.72 | 7.84 | 6.38 | 5.78 | |
| 2023 | 10.69 | 11.39 | 9.96 | 9.00 | 7.38 | 6.46 | |
| Total Output (€/farm) | 2014 | 6 881 | 19 623 | 42 898 | 81 858 | 237 057 | 1 109 612 |
| 2017 | 6 403 | 18 619 | 41 029 | 76 470 | 220 288 | 1 078 852 | |
| 2020 | 7 070 | 18 317 | 40 099 | 76 470 | 226 825 | 1 161 919 | |
| 2023 | 9 602 | 21 969 | 49 883 | 94 746 | 285 777 | 1 568 367 | |
| Total Inputs (€/farm) | 2014 | 5 408 | 16 169 | 38 335 | 73 561 | 215 222 | 1 054 464 |
| 2017 | 5 239 | 14 512 | 35 239 | 66 291 | 193 166 | 961 667 | |
| 2020 | 6 547 | 14 654 | 34 850 | 66 156 | 202 807 | 1 051 452 | |
| 2023 | 8 859 | 18 535 | 44 248 | 82 787 | 252 331 | 1 372 635 | |
| Total Utilised Agricultural Area (ha/farm) | 2014 | 5.2 | 15.4 | 30.5 | 56.7 | 103.6 | 295.7 |
| 2017 | 4.8 | 14.3 | 28.2 | 53.6 | 100.8 | 269.6 | |
| 2020 | 6.2 | 14.0 | 28.4 | 52.6 | 103.7 | 258.0 | |
| 2023 | 6.2 | 14.0 | 28.5 | 50.2 | 100.7 | 261.8 | |
| Farm Net Income (€/farm) | 2014 | 2 756 | 8 583 | 15 305 | 26 084 | 54 928 | 149 566 |
| 2017 | 2 424 | 9 258 | 16 409 | 28 039 | 60 203 | 205 131 | |
| 2020 | 2 401 | 8 869 | 16 725 | 29 444 | 59 947 | 203 581 | |
| 2023 | 2 468 | 8 763 | 17 396 | 31 153 | 69 867 | 282 736 | |
* Excluding Malta. Source: own calculations based on 2026 FADN data.
Table 4.
Panel data models for the Energy Cost Coverage Ratio of European Union* farms by economic size class in 2014–2023.
Table 4.
Panel data models for the Energy Cost Coverage Ratio of European Union* farms by economic size class in 2014–2023.
| Details** | Economic size classes | |||||
| 1. €2 000 ≤ €8 000 Very Small |
2. €8 000 ≤ €25 000 Small |
3. €25 000 ≤ €50 000 Medium-Small |
4. €50 000 ≤ €100 000 Medium-Large |
5. €100 000 ≤ €500 000 Large |
6. ≥ €50 0000 Very Large |
|
| Number of farms | 128 | 220 | 267 | 275 | 275 | 227 |
| Type of model | REM | FEM | FEM | FEM | REM | FEM |
| LSDV R2/Theta | 0.6313 | 0.8678 | 0.8601 | 0.7134 | 0.8944 | 0.8815 |
| Within R2/ corr(y.yhat)^2 | 0.1453 | 0.1443 | 0.3475 | 0.0930 | 0.0000 | 0.1193 |
| const | -0.0846 (0.3598) |
1.2198 (0.0012) |
2.9716 (0.0000) |
1.6614 (0.0131) |
0.5945 (0.0035) |
0.8691 (0.0000) |
| X02: Utilized Agricultural Area | - | - | -0.0668 (0.0004) |
- | -0.0019 (0.0616) |
-0.0012 (0.0000) |
| X03: Total Output | - | 0.00004 (0.0000) |
- | - | - | - |
| X04: Total Inputs | 0.00002 (0.0283) |
- | 0.0001 (0.0000) |
- | - | - |
| X09: Assets | - | -0.00001 (0.0000) |
-0.00001 (0.0000) |
-0.00001 (0.0006) |
- | 0.0000001 (0.0184) |
| X10: Liabilities | 0.00002 (0.0000) |
- | - | |||
| Hausman Test | χ2 (1) = 0.7670 (0.3812) |
χ2 (2) = 12.7478 (0.0017) | χ2 (3) = 17.7099 (0.0005) |
χ2 (2) = 7.5746 (0.0227) |
χ2 (1) = 3.7867 (0.0517) |
χ2 (2) = 7.1654 (0.0278) |
* Without Malta in 2023; without the United Kingdom in 2021-2023. **The significance level is specified in parentheses. Source: own compilation based on 2026 FADN data.
Disclaimer/Publisher’s Note: The statements, opinions and data contained in all publications are solely those of the individual author(s) and contributor(s) and not of MDPI and/or the editor(s). MDPI and/or the editor(s) disclaim responsibility for any injury to people or property resulting from any ideas, methods, instructions or products referred to in the content. |
© 2026 by the authors. Licensee MDPI, Basel, Switzerland. This article is an open access article distributed under the terms and conditions of the Creative Commons Attribution (CC BY) license (http://creativecommons.org/licenses/by/4.0/).
Copyright: This open access article is published under a Creative Commons CC BY 4.0 license, which permit the free download, distribution, and reuse, provided that the author and preprint are cited in any reuse.


