

Submitted:
16 July 2026
Posted:
20 July 2026
You are already at the latest version
Abstract
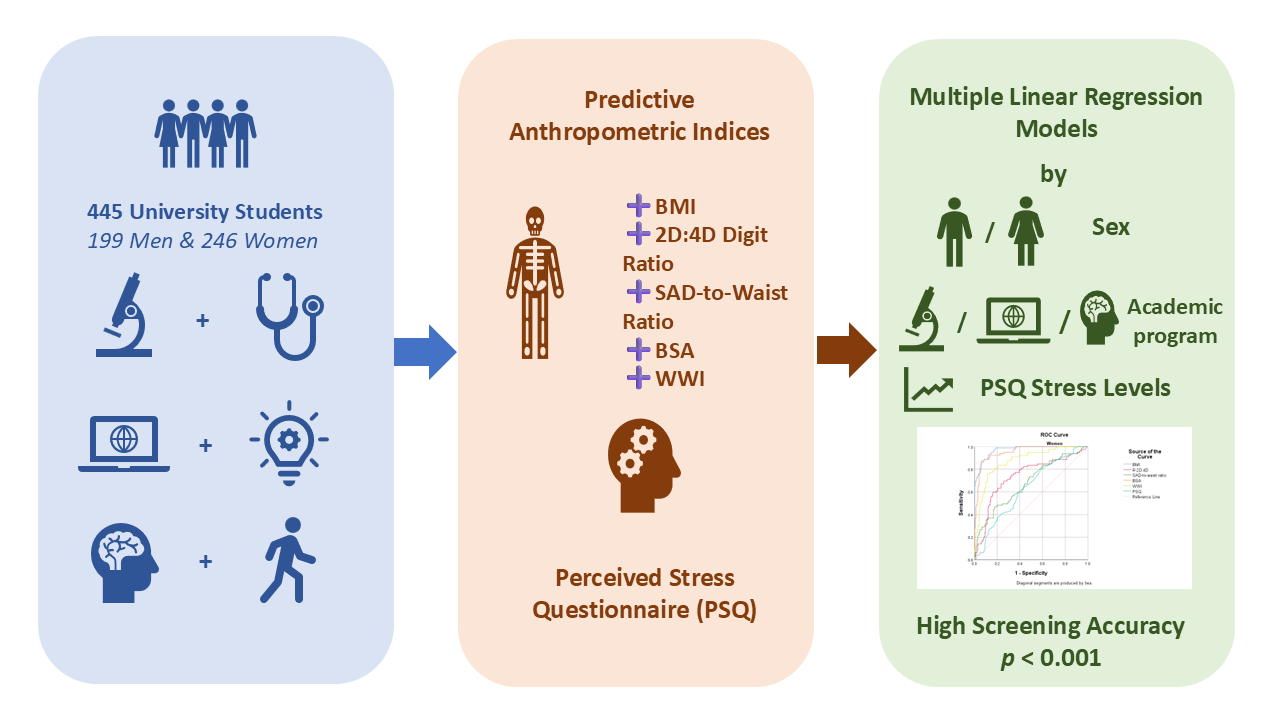
Background: The Adiposity Volume Index (AVI) is a modern geometric tool for tracking central body fat. However, how it interacts with prenatal markers (2D:4D ratio), advanced anthropometric indexes, and psychological factors across different academic disciplines remains largely unexplored. This study evaluates the sex-specific predictive power and screening capacity of these parameters in healthy university students. Methods: A cross-sectional study was conducted on 445 students (199 men and 246 women) from Biomedical Sciences (BS), Computer Science and Engineering (CSE), and Social Sciences and Physiotherapy (SSP) academic programs. Anthropometric indicators (Body Mass Index - BMI, Body Surface Area - BSA, Weight-adjusted Waist Index - WWI, Sagittal Abdominal Diameter-to-Waist circumference Ratio - SAD-to-Waist Ratio), the right-hand digital 2D:4D ratio (R-2D:4D), and Perceived Stress Questionnaire scores (PSQ) were assessed. Data were analyzed using multi-layered linear regression and ROC curve analysis. Results: In male students, BMI, BSA and WWI consistently predicted AVI across all academic programs (R² > .978, p < .001). In contrast, a major psychosomatic interaction emerged in female students. Among stressed BS students, the predictive model collapsed (R² = .313, lost significance), and the prenatal R-2D:4D ratio became a strong negative predictor (B = -87.780, p = .019). ROC analysis revealed that optimal BMI cut-offs for elevated AVI fell below the traditional overweight threshold for both men (22.93 kg/m², AUC = .942) and women (23.64 kg/m², AUC = .971). Notably, perceived stress was a significant diagnostic marker only for female students (AUC = .631, p = .001, cut-off = 66.50). Conclusions: Academic stress alters body fat distribution pattern exclusively in female biomedical students, unmasking latent prenatal endocrine programming. Furthermore, AVI-driven screening demonstrates that metabolic risk in young adults accumulates well within the conventional normal-weight BMI range, emphasizing the need for sex-tailored clinical assessments.
Keywords:
abdominal adiposity volume
; anthropometric indices
; predictors
; 2D:4D digit ratio
; perceived stress
; non-invasive screening
; university students
1. Introduction
Overweight and obesity are the most prevalent metabolic disorders in developed countries. The prevalence of obesity has increased tremendously in recent decades [1]. Obesity is a major risk factor for the development of multimorbidity, and the prevalence of obesity continues to rise worldwide [2]. Obesity refers to an excessive or abnormal accumulation of body fat, which adversely affects health [3]. Obesity ranks as the sixth most significant risk factor contributing to the global burden of illness [4]. Abdominal obesity (central or visceral) is an important risk factor for cardiovascular diseases, diabetes, and cancer, playing a critical role in the so-called metabolic syndrome [1]. The obese phenotype is highly complex, and in certain cases, patients do not display obvious cardiometabolic symptoms. Consequently, in these instances, obesity—particularly abdominal obesity, whether central or visceral—induces or even exacerbates insulin resistance. This insulin resistance, in turn, triggers various metabolic imbalances that culminate in the development of the clinical entity known as metabolic syndrome [5].
Obesity is typically diagnosed based on the Body Mass Index (BMI), and the incidence of numerous chronic diseases, such as hypertension, diabetes, dyslipidemia, and metabolic syndrome, increases substantially with a higher BMI [6,7]. However, the simple anthropometric indicator BMI cannot provide nuanced insights, particularly regarding fat distribution. Thus, an individual may present a BMI value within normal limits while simultaneously exhibiting central or visceral obesity. For this reason, multiple anthropometric indices, or even a strategic combination thereof, must be utilized in clinical diagnosis [8]. Because these anthropometric indices can be effectively deployed for identification, targeted intervention, or health impact evaluation, they have been designated as anthropometric health indicators [1]. A large study involving 177,792 participants suggests that, though remaining undetected in BMI-based screening, normal weight obesity increases the prevalence of cardiometabolic risk factors [9].
The weight-adjusted waist index (WWI), defined as waist circumference (WC) divided by the square root of body weight in kilograms, has been shown to be a strong predictor of several chronic diseases, including hypertension, diabetes, cardiovascular diseases, chronic kidney disease, and albuminuria, as well as a predictor of mortality [10,11,12]. WWI, as a promising new indicator, utilizes WC measurement and proves to be a more reliable predictive factor than BMI, especially in the case of central obesity [13]. An increase in WWI indicates a condition characterized by excessive accumulation of body fat and increased loss of muscle mass, which can directly and concretely assess central obesity [14].
The SAD-to-Waist Ratio combines two clinical measurements: the Sagittal Abdominal Diameter (SAD), which represents the anteroposterior diameter of the abdomen, and the Waist Circumference (WC). This metric is specifically utilized to estimate visceral adipose tissue—the intra-abdominal fat surrounding vital organs—which serves as a primary driver of cardiovascular disease and insulin resistance [15,16].
The precise evaluation of body composition and the early identification of metabolic risks represent both a major challenge and a critical priority in contemporary public health management. Among young populations, the transition from adolescence to young adulthood frequently coincides with the onset of university life. This critical developmental stage is characterized by drastic and often unfavorable changes in lifestyle habits.
Traditionally, screening for weight status and obesity-related risks has relied heavily on the Body Mass Index (BMI) [17,18]. Although its epidemiological utility remains undeniable due to its simplicity, its geometric and biological limitations are increasingly criticized in modern medical literature. BMI exhibits a structural inability to differentiate muscle mass from adipose tissue [19,20]. Furthermore, it fails entirely to reflect the regional distribution of body fat. From a pathophysiological perspective, metabolic dysfunction is driven not merely by total fat mass, but specifically by its accumulation within the abdominal region—namely ectopic and visceral fat—which is recognized for its highly pro-inflammatory secretory profile [17].
To overcome these limitations, cutting-edge research has shifted toward advanced anthropometric indices and three-dimensional mathematical volume models. Among these, the Adiposity Volume Index (AVI) and the Weight-Adjusted Waist Index (WWI) have demonstrated superior statistical accuracy in estimating intra-abdominal fat. While WWI successfully isolates waist circumference from the variability of total body weight, AVI provides a much more stable volumetric assessment of the trunk region. Concurrently, parameters such as total Body Surface Area (BSA) and sagittal abdominal diameter (reflected in the SAD-to-waist circumference ratio) complement the clinical picture, offering a refined geometric perspective on how the young organism reconfigures its somatic architecture without relying on expensive or irradiating imaging techniques. All these indices mentioned above are critical in defining an individual's cardiometabolic risk. Waist girth and BMI are commonly used as markers of cardiometabolic risk [21]. Accumulating data however suggest that sagittal abdominal diameter (SAD) or “abdominal height” may be a better marker of intra-abdominal adiposity and cardiometabolic risk [21].
One non-invasive biomarker is the second-to-fourth digit ratio (2D:4D), which has been proposed as an indicator of prenatal androgen and estrogen exposure [22]. This ratio is established early in gestation and is reported to remain largely stable throughout life, suggesting its potential to bridge early developmental processes with physiological and pathological outcomes in adulthood [23,24]. Accordingly, 2D:4D ratio has been linked to athletic performance, cognitive function, handedness, reproductive parameters, personality traits, and various cardiometabolic risk indicators [25].
The adult phenotype and the predisposition toward a specific pattern of adipose tissue distribution are not merely the result of current lifestyle choices; they exhibit a profound biological determinism established during the intrauterine period. In this context, the 2D:4D digit ratio serves as a stable anatomical marker that reflects the balance between fetal exposure to testosterone and estrogens during the first trimester of pregnancy. A lower 2D:4D ratio indicates a high prenatal androgen exposure, whereas a higher ratio is associated with a prominent estrogenic imprint [26,27].
Recent research suggests that this early hormonal programming modulates the subsequent sensitivity of receptors within regional adipose tissue [28]. For this reason, integrating a prenatal marker (R-2D:4D) alongside current anthropometric indices offers a unique opportunity to understand whether the metabolic vulnerability of young adults is a purely behavioral acquisition or if it possesses a pre-existing genetic and hormonal constitutional root, all achieved through a simple, non-invasive measurement of the index and ring fingers.
University students frequently encounter severe disruptions in dietary behavior—characterized by skipping main meals and an increased consumption of ultra-processed and fast-food products—alongside heightened physical inactivity induced by prolonged periods of sedentary study and chronic sleep deprivation. The accumulation of these environmental factors acts as a catalyst for the early onset of metabolic syndrome, insulin resistance, and latent cardiovascular pathologies, effectively transforming a population universally presumed to be "healthy" into a cohort carrying a substantial, long-term epidemiological risk.
One of the fundamental pillars justifying the present study resides in the urgent need to develop assessment tools tailored to current socio-economic and psychological realities. In the contemporary medical context, large-scale monitoring of cardiometabolic risk through traditional clinical methods faces significant logistical and financial barriers. Although laboratory biochemical analyses represent the gold standard, they entail high operational costs, the consumption of medical supplies, and the necessity of a specialized infrastructure, making them difficult to implement as mass screening strategies within student communities. Furthermore, the psychological component of the young population plays an often under estimated role: a considerable percentage of young adults exhibit a profound aversion, fear, or even severe anxiety toward invasive medical procedures, particularly those involving venous blood sampling. This emotional barrier leads to the avoidance of preventive check-ups and the postponement of medical consultations, thereby masking latent risks.
Consequently, it becomes imperative to identify and validate entirely non-invasive, safe, rapid, and highly cost-effective methodologies that are universally accessible to any student, regardless of financial resources. Utilizing indices calculated strictly on mathematical foundations and surface measurements completely eliminates needle-related anxiety, demystifies the notion of restrictive medical check-ups, and allows for an excellent mapping of the cardiometabolic risk profile, thereby providing a sustainable and easily reproducible community screening solution.
Based on these premises, the primary purpose of the present research is to validate, evaluate, and hierarchically analyze the predictive and clinical screening capacity of ROC curves for classic and advanced anthropometric indices in determining elevated Adiposity Volume Index (AVI) among young university students. By applying a stratified methodology, this study aims to precisely map how these diagnostic models modify, specialize, or lose their clinical value under the combined influence of sex, specific academic program, and perceived stress levels (PSQ). The ultimate objective is to provide the scientific community and preventive university medicine networks with a robust theoretical foundation and a set of individualized critical cut-off thresholds capable of detecting cardiometabolic risk long before classic clinical indicators or invasive procedures signal overt pathology.
To achieve the general purpose, the following specific objectives were established: evaluating the diagnostic efficiency and determining the optimal cut-off thresholds for traditional structural somatometric indicators (BMI and BSA) in identifying the risk of elevated adiposity; analyzing the screening power of the advanced Weight-Adjusted Waist Index (WWI) and determining its degree of predictive consistency across both sexes; investigating the diagnostic value of secondary markers (the right-hand digital 2D:4D ratio and the sagittal abdominal diameter-to-waist circumference ratio) as constitutional predictors of regional adipose tissue accumulation; quantifying the impact of perceived psychological stress (via the PSQ score) on metabolic status and determining its capacity for the clinical discrimination of visceral adiposity based on sex; and mapping how the curricular profile of university programs (Biomedical Sciences vs. Computer Science & Engineering vs. Social Sciences & Physiotherapy) modulates the interaction between psychological stress and somatometric markers.
Research Hypotheses
In accordance with the proposed objectives and existing literature, the following working hypotheses were formulated:
- Hypothesis 1 (H1): Classic structural somatic indicators (BMI and BSA) maintain superior predictive capacity and excellent diagnostic accuracy in identifying elevated adiposity volume (AVI above the median) across both sexes; however, the optimal cut-off thresholds exhibit significant variations between male and female subjects.
- Hypothesis 2 (H2): The advanced anthropometric index WWI (Weight-Adjusted Waist Index) presents a robust diagnostic value and a consistent clinical performance across sexes, functioning as a stable predictor of abdominal adiposity in both men and women.
- Hypothesis 3 (H3): The prenatal biological marker (R-2D:4D digit ratio) and regional geometric traceability (SAD-to-Waist Ratio) exhibit a pronounced sexual dimorphism in screening capacity, demonstrating a valid and prominent diagnostic performance exclusively within the female population.
- Hypothesis 4 (H4): The general level of perceived psychological stress (PSQ score) acts as a valid and robust clinical predictor for abdominal adiposity volume accumulation selectively, reaching statistical significance only within the female student sample, reflecting a female-specific psychosomatic vulnerability under the pressure of the academic environment.
- Hypothesis 5 (H5): The profile of the academic program followed by the students modulates perceived stress levels and, consequently, destabilizes the predictive patterns of advanced anthropometric indices, generating structural differences among biomedical, technical, and social sciences specializations.
2. Materials and Methods
2.1. Participants
The total sample consisted of 445 university students from the University of Oradea, aged between 20 and 25 years. Participants were enrolled across three distinct academic programs: Biomedical Sciences (BS) (n = 144), Computer Science and Engineering (CSE) (n = 159), and Social Sciences and Physiotherapy (SSP) (n = 142). Regarding sex distribution, the cohort included 199 men (44.7%) and 246 women (55.3%). All subjects participated voluntarily and provided informed consent prior to data collection.
2.2. Psychosocial Measures
The Perceived Stress Questionnaire (PSQ). Psychological states and reactions resulting from confrontations with situations involving loss, threats, or hassles were identified using the Perceived Stress Questionnaire (PSQ), developed by Levenstein et al. in 1993 [29]. According to the authors, the questionnaire is a highly relevant instrument for establishing the level of perceived stress. The scale comprises 30 items describing potential emotional and mental reactions to demands that exceed an individual's coping capacities, to understimulation, or to conflict situations. The participant's task is to circle one of four response options (where the number 1 signifies "almost never" and the number 4 signifies "almost always"). For 8 of the 30 items, the scores provided by the subject are reversed. The total score, ranging from 30 to 120, allows for the classification of subjects into one of three categories: low stress, moderate stress, and high stress [30]. Sample items include: "I feel frustrated and annoyed", "I feel that too many demands are being made on me", "I feel discouraged", "I feel mentally exhausted", and "I am full of worry about the future".
2.3. Anthropometric Measurements and Working Procedure
To determine the target anthropometric indices (BMI, R-2D:4D Ratio, SAD-to-Waist Ratio, BSA, and WWI), the following direct structural measurements were performed: standing height (H), body weight (W), waist circumference (WC), sagittal abdominal diameter (SAD), second digit length (2D), and fourth digit length (4D).
Height was measured with an ADE wall taliometer with 1 mm precision (ADE® GmbH, Germany) with individuals lightly dressed, without shoes, standing erect, back straight, heels together, and with feet slightly spread. Weight was measured with a digital device using bioelectrical impedance analysis (Omron BF-511; Omron Healthcare Co., Ltd., Kyoto, Japan).
WC was measured using a flexible, non-stretchable anthropometric tape. WC was recorded in centimeters at the midpoint between the lower border of the rib cage and the iliac crest along the midaxillary line, with participants standing erect and measured at the end of a normal expiration.
SAD was measured using a specialized sliding abdominal caliper (sliding anthropometer). The participant was placed in a supine position on a firm, flat examination table with knees comfortably bent at a 90° angle to relax the abdominal wall muscles. After a normal, quiet expiration, the investigator placed the fixed arm of the caliper beneath the lower back and lowered the sliding arm until it gently touched the highest point of the abdomen, typically at the level of the L4–L5 lumbar vertebrae or the natural umbilical line. The vertical depth was recorded to the nearest 0.1 cm.
The length of both the index finger (2D) and the ring finger (4D) was measured directly from the metacarpophalangeal joint (the basal crease where the finger meets the palm) to the most distal tip of the fleshy pad of the finger. The fingernail was strictly excluded from the measurement. The participant placed their right hand flat on a firm, level surface, palm facing upward, with the fingers fully extended, straight, and comfortably adducted. Measurements were executed manually using a professional YATO YT-7201 stainless steel digital electronic caliper. This instrument features a linear capacitive measuring system with a high-definition LCD display, providing a resolution of 0.01 mm and an intrinsic accuracy of ±0.02 mm for measurements under 100 mm. The caliper jaws were applied gently against the anatomical landmarks to avoid skin or subcutaneous tissue compression that could artificially distort the data. Prior to taking any measurements, a comprehensive physical inspection was conducted. The investigator verified that the participant’s fingers were completely straight and entirely free of any physical deformities, congenital anomalies, joint inflammation, severe scarring, or previous orthopedic trauma that could alter the natural soft tissue profile or bone architecture.
Body Mass Index (BMI) is the official clinical indicator utilized to evaluate whether an adult presents a healthy weight relative to height. This index provides a straightforward and practical approach to classify weight status, where a high value (BMI ≥ 30 kg/m²) defines obesity—a state closely linked to multiple metabolic comorbidities and increased mortality rates [31,32]. The BMI metric is calculated by dividing the participant's body weight in kilograms by the square of their body height measured in meters, according to the following mathematical formula:
The 2D:4D ratio (the length of the index finger divided by the ring finger) serves as a stable proxy biomarker of prenatal hormone exposure. A lower ratio (masculinized) indicates higher fetal testosterone, while a higher ratio (feminized) reflects higher prenatal estrogen. This ratio is established in the womb and remains stable throughout life [33]. The Right-Hand Second-to-Fourth Digit Ratio (R-2D:4D) is determined by dividing the exact length of the index finger by the exact length of the ring finger of the right hand. The calculation formula is as follows:
The Sagittal Abdominal Diameter-to-Waist circumference Ratio (SAD-to-Waist Ratio) combines a geometric depth parameter with a circumferential perimeter, offering a comprehensive three-dimensional perspective of visceral fat distribution. The SAD-to-Waist Ratio is calculated by dividing the sagittal abdominal diameter (measured in a supine position) by the standing waist circumference of the participant, according to the following mathematical formula:
Body Surface Area (BSA) is a calculated biometric parameter representing the total surface area of the human skin, expressed in square meters (m²). In clinical and epidemiological research, BSA serves as an essential indicator of metabolic mass and body size. The BSA is calculated by multiplying the participant's height in centimeters by their weight in kilograms, dividing the product by 3600, and then extracting the square root of the resulting value, according to the following mathematical formula:
The Weight-Adjusted Waist Index (WWI) evaluates central adiposity while minimizing the confounding effect of body weight. The WWI is obtained by dividing the participant's waist circumference in centimeters by the square root of their body weight in kilograms, according to the following mathematical formula:
2.4. Study Design and Procedure
This investigation was structured as a descriptive, cross-sectional study. Participants comprised university students from the University of Oradea, enrolled across three major academic programs: BS, CSE, and SSP, with ages ranging between 20 and 25 years.
Strict exclusion criteria were applied to ensure data integrity:
- Enrolment in academic programs other than the three selected specializations;
- Failure to state age or falling outside the designated 20–25 age bracket;
- Failure to indicate biological sex;
- Formally diagnosed chronic metabolic and/or cardiovascular diseases;
- Non-completion or partial completion of the psychosocial scale.
Data collection was carried out through direct, face-to-face clinical and anthropometric interactions. Immediately following the completion of the physical measurements, each participant was provided with the printout containing the PSQ. To guarantee seamless data matching, the anthropometric recording sheets and the psychosocial questionnaire for each individual were physically stapled and coded together.
2.5. Ethical Considerations
This study strictly adhered to institutional and international research ethics guidelines. All subjects participated on a completely voluntary basis and were informed in advance regarding the scope, purposes, and design of the research.
To ensure absolute privacy, participants were explicitly instructed not to provide any identifying information, such as names or personal identification codes. The protocol emphasized that only biological sex and academic program affiliation were relevant to the target epidemiological analysis. All collected data were aggregated anonymously.
The study protocol was formally reviewed and approved by the Research Ethics Committee of the Faculty of Medicine and Pharmacy, University of Oradea. Furthermore, signed written informed consent was obtained from each individual participant prior to the initiation of any data collection or anthropometric measurement procedures.
2.6. Statistical Data Analysis
Statistical data analysis was performed using IBM SPSS Statistics software (Version 26.0; IBM Corp., Armonk, NY, USA). The statistical significance threshold was set a priori at α = .05, with p < .05 values considered statistically significant. The distribution and normality of continuous variables were preliminarily evaluated by analyzing skewness and kurtosis indices, with all values falling within the accepted limits for the use of parametric tests.
The data analysis strategy comprised the following successive methodological steps:
- Frequency Analysis and Categorical Association: The distribution of participants by sex across the three academic programs (BS, CSE, and SSP) was evaluated using contingency tables (Crosstabs), and differences in proportions were tested using Pearson’s Chi-square test (χ²).
- Descriptive and Comparative ANOVA Analysis: Anthropometric indicators, advanced adiposity indices, and the psychological variable were expressed as Mean ± Standard Deviation (Mean ± SD). To evaluate the differences among the means of the three academic programs, a One-Way ANOVA test was applied, strictly stratified by sex to control for inherent sexual dimorphism. Subsequent multiple comparisons were performed using the Tukey HSD post-hoc test.
- Linear Association Analysis: Inter-correlation relationships between anthropometric predictors and perceived stress levels were evaluated by calculating Pearson correlation coefficients (r). For spatial efficiency and visual contrast, the matrix was stratified by sex using a diagonal split technique (data for the female group are presented below the main diagonal, while data for the male group are presented above the diagonal).
- Predictive Modeling via Multiple Linear Regression: Multiple linear regression models (Enter method) were constructed with AVI as the criterion (dependent) variable to evaluate the predictive relationships among compositional indices (BMI, BSA, WWI), the biological marker (the 2D:4D digit ratio), the distribution indicator (the SAD-to-Waist Ratio), and the global stress score obtained from the PSQ questionnaire. The analysis evolved from a general perspective to one of high specificity: first globally by sex, subsequently stratified by academic program, and finally through an advanced three-dimensional approach (sex × academic program × binary stress status). For each model, the coefficient of determination (R²), the F-test for model fit, unstandardized coefficients (B), standard errors (SE), standardized coefficients (β), and t-values were reported. Collinearity diagnostics were verified using the Variance Inflation Factor (VIF), with the obtained values falling below the critical threshold of 5.0, confirming the absence of multicollinearity among the predictors.
- Predictive Performance Analysis and Cut-off Threshold Estimation (ROC Analysis): The discriminatory capacity of the indices (BMI, R-2D:4D, SAD-to-Waist Ratio, BSA, WWI) and the PSQ was evaluated through Receiver Operating Characteristic (ROC) curve analysis. Global performance was quantified by the Area Under the Curve (AUC) with 95% Confidence Intervals (CI). Optimized critical cut-off thresholds were determined by maximizing the Youden index, reporting the associated sensitivity, specificity, as well as positive and negative predictive values.
3. Results
3.1. Descriptive Statistics and Distribution Analysis
In alignment with the research objectives, the preliminary investigation assessed the sample distribution across sexes and academic programs (Table 1).
Analysis of participant distribution by sex and academic program (Table 1) revealed major statistically significant differences among the three studied groups (χ² (2) = 45.718, p < .001). Within the Biomedical program, a clear predominance of the female population was recorded (74.3% women vs. 25.7% men). In direct contrast, the Computer Science and Engineering profile was heavily dominated by men (64.2% men vs. 35.8% women). The sex distribution was relatively more balanced within the Social Sciences and Physiotherapy program, although a slight premium was maintained in favor of female students (57.7% women vs. 42.3% men). Overall, the total sample (N = 445) was composed of a relatively homogeneous structure, with a slight prevalence of the female sex (55.3% women vs. 44.7% men).
3.2. Comparative Analysis of Anthropometric Health Indicators
The comparative One-Way ANOVA, stratified by sex (Table 2), revealed specific significant variations in anthropometric parameters across the studied academic programs. Regarding BMI, clear differences were recorded in both men (F = 6.418, p = .002) and women (F = 3.58, p = .031), with students from the BS program presenting the highest values. The post-hoc (Tukey) analysis confirmed that men from BS had a significantly higher BMI than their peers from CSE and SSP, whereas women from BS significantly exceeded only the female students from CSE. In terms of advanced anthropometric indices, the SAD-to-waist ratio exhibited significant variations exclusively within the female sample (F = 4.332, p = .014), where women from BS recorded significantly lower values compared to those from CSE. Conversely, the BSA (F = 4.115, p = .018) and WWI (F = 3.696, p = .027) indicators showed a significant dynamic only among men, with BS students displaying significantly higher values than those from SSP. The R-2D:4D ratio (a stable prenatal marker) and the overall perceived stress level did not present statistically significant differences across academic programs, regardless of sex (p > .05). However, at the descriptive level, a general trend toward amplified stress scores was observed within the female population compared to the male population across all study programs.
3.3. Predictors of AVI Among Students
The inter-variable correlation analysis, stratified by sex (Table 3), indicated distinct patterns of association between anthropometric parameters and the psychological component. Within the female population, a positive, weak-to-moderate, but highly statistically significant correlation was observed between BMI and the PSQ score (r = .182, p < .01). Remarkably, this association was entirely absent in the male sample (r = -.045, p > .05), suggesting a sex-differentiated psychosomatic reactivity. Classic and advanced anthropometric indicators (BMI, BSA, WWI, and the SAD-to-Waist Ratio) exhibited strong mutual positive correlations in both subgroups (p < .01), with the closest link recorded between BMI and BSA (in women: r = .842; in men: r = .736). Furthermore, the prenatal marker represented by the 2D:4D digit ratio manifested significant association patterns with current body composition parameters. In women, a higher R-2D:4D ratio was significantly associated with higher values of BMI (r = .449), BSA (r = .329), and WWI (r = .286), all at a threshold of p < .001. In men, although the associations remained significant, their intensity was visibly lower (with WWI: r = .318, p < .01; with BMI: r = .238, p < .01; with BSA: r = .170, p < .05).
As demonstrated in Table 4, statistically significant differences emerged between the estimates generated by the regression equations and the mean outcomes for the male cohort (F(6, 199) = 2257.066, p < .001) and the female cohort (F(6, 246) = 31.311, p < .001). The proportion of variance in abdominal volume status (the coefficient of multiple determination) explained by the joint action of BMI, R-2D:4D, SAD-to-Waist Ratio, BSA, WWI, and PSQ yielded an R² = .986 for the male students, indicating that these variables account for 98.6% of AVI variance. In the female cohort, the multiple coefficient of determination (R² = .440) demonstrated that the predictors contribute 44.0% to AVI variance, with the effect being moderate-to-strong in this case. Overall, the implemented model indicates a powerful and substantial impact of the selected predictors on AVI. The utilized models highlight the critical importance of combining anthropometric predictors with genetic (R-2D:4D) and psychological factors, thereby enabling excellent accuracy in identifying the risk of central fat accumulation among young adults.
Multiple linear regression models run separately by sex (Table 5) revealed major structural differences in the determinism of the AVI. Within the male sample, the global model displayed an extremely high predictive capacity (R² = .986, F = 2257.066, p < .001), with the variance of AVI being explained almost entirely by the combined set of predictors. The strongest independent positive predictors were the WWI (β = .411, p < .001), BSA (β = .393, p < .001), and BMI (β = .347, p < .001) indicators, followed by a modest but significant contribution from the SAD-to-Waist Ratio (β = .024, p = .011). The R-2D:4D ratio and perceived stress did not influence the male model. In contrast, within the female sample, the model explained 44.0% of the AVI variance (R² = .440, F = 31.311, p < .001). The strongest positive predictor was BMI (β = .362, p = .001), followed by WWI (β = .251, p < .001) and BSA (β = .228, p = .013). Remarkably, unlike in men, the 2D:4D digit ratio emerged as a significant negative predictor among women (B = -23.237, β = -.112, p = .043), indicating a link between the prenatal hormonal profile and adult adiposity volume in young adulthood. The SAD-to-Waist Ratio and perceived stress levels did not manifest significant direct predictive effects (p > .05) in the female model.
Simultaneous stratification of the predictive equations based on sex and academic program (Table 6) revealed a profound structural heterogeneity within the female population. While the predictive models for men remained extremely stable and powerful across all three university profiles (R² ranging between .986 and .989, p < .001), driven massively by the triad of BMI, BSA, and WWI, the female subgroup experienced major variations. Thus, for female students in the BS program, the explanatory capacity of the model decreased dramatically to only 29.6% (R² = .296, F = 7.018, p < .001). Within this specific group, the only independent predictor with a statistically significant impact on AVI was the WWI index (B = 1.420, β = .218, p = .023), whereas classic markers such as BMI (p = .093) lost their direct significance. In contrast, for female students in the CSE (R² = .976) and SSP (R² = .991) programs, the predictive architecture realigned with the male pattern, being sovereignly and highly significantly (p < .001) dominated by the same heavy anthropometric parameters (BMI, BSA, and WWI). Among men, a notable particularity was identified in the BS profile, where the perceived stress score emerged as a significant independent negative predictor (B = -.020, p = .007), an effect that was completely absent in the other specializations.
Multiple linear regression analysis performed by stratifying the sample based on sex and the presence of stress (Table 7) highlighted a particularly powerful psychosomatic interaction phenomenon manifested exclusively within the female group. Within the male group, the behavior of the predictive model remained remarkably stable and immune to the influence of adaptive states. In both men with low stress levels (R² = .987, F = 1675.423, p < .001) and those with high stress levels (R² = .986, F = 1063.202, p < .001), the variance of AVI was explained almost entirely by the classic anthropometric triad consisting of BMI, BSA, and WWI, with all variables maintaining a highly significant contribution (p < .001). In major contrast, within the female subgroup, the presence of stress completely reconfigures the adiposity prediction mechanism. In the absence of stress (.00 score), the anthropometric parameters excellently explain 88.3% of AVI variance (R² = .883, F = 145.320, p < .001), with BMI being the sovereign predictor (β = .645, p < .001). However, under conditions of psychological stress (1.00 score), the explanatory capacity of the model collapses dramatically to 41.3% (R² = .413, F = 19.391, p < .001). Strikingly, BMI completely loses its independent predictive capacity (p = .264). In this state of distress, the female equation becomes dominated by the WWI compositional index (β = .396, p < .001), and the prenatal biological marker represented by the 2D:4D digit ratio emerges as a major and robust independent negative predictor (B = -45.463, β = -.186, p = .015).
Three-dimensional multiple linear regression analysis of the sample (sex × academic program × stress status) (Table 8) highlighted that the collapse of anthropometric predictability identified globally within the female population is not a generalized phenomenon; rather, it is a profoundly specific effect, isolated exclusively among female students in the BS program (R² = .313). In the absence of psychological stress (.00 score), the model excellently explains 90.8% of the variance in AVI for BS women, with the equation classically controlled by BMI (β = .400, p = .001), BSA (β = .360, p = .001), and, in a positive manner, by the prenatal marker represented by the 2D:4D digit ratio (β = .184, p = .007). However, upon the onset of stress (1.00 score), the anthropometric model collapses dramatically, and the heavy somatic parameters (BMI and BSA) completely lose their statistical significance (p > .05). In this context of distress, female body adiposity volume is predicted solely by WWI compositional index (β = .428, p = .002) and, strikingly, by the 2D:4D ratio, which undergoes a radical sign reversal, becoming an extremely aggressive negative predictor (B = -87.780, β = -.304, p = .019). In contrast to this atypical dynamic in BS, female students in the CSE (R² > .97) and SSP (R² > .97) profiles maintain strong structural stability in their models, with the triad of BMI, BSA, and WWI remaining an unshakable predictive pillar regardless of the presence or absence of stress (p < .05). Among the male population, a remarkable uniformity was observed across all academic programs (R² constantly ranging between .978 and .989, p < .001). In men, the model is mathematically and sovereignly dictated by the same triad (BMI, BSA, and WWI), with the only micro-variation identified among BS students presenting low stress levels, where the SAD-to-Waist Ratio manifested a marginal but significant positive influence (B = 15.303, p = .047), an effect that dissipates completely under the action of stress.
Clinical diagnostic performance analysis using ROC curves (Table 9, Figure 1(a), Figure 1(b)) certified highly distinct sex differences in evaluating the screening capacity of anthropometric and psychological markers. Within the male sample (Table 9, Figure 1(a)), the capacity to identify elevated adiposity volume (AVI above the median) is controlled with excellent accuracy by structural somatic indicators, with the hierarchy sovereignly dominated by BMI (AUC = .942, p < .001) and BSA (AUC = .925, p < .001). The optimal cut-off threshold for BMI in men was established at 22.93 kg/m², generating a sensitivity of 82.6% and a specificity of 85.5% (J = .681), whereas for Body Surface Area (BSA), the optimal threshold was identified at 1.89 m², yielding a remarkable specificity of 90.9% (J = .735). The WWI index also manifested a highly robust predictive value (AUC = .876, p < .001, cut-off = 9.69). Among the secondary markers, only the R-2D:4D digit ratio reached marginal significance (AUC = .594, p = .041, cut-off = .98), while the SAD-to-Waist Ratio and the overall perceived stress level demonstrated no clinical utility for screening within the male cohort (p > .05).
In profound structural antithesis, within the female sample (Table 9, Figure 1(b)), all six predictors introduced into the model demonstrated a highly statistically significant screening discriminatory capacity (p ≤ .001). BMI exposed an almost perfect diagnostic accuracy (AUC = .971, 95% CI (.954, .988), p < .001), with the optimal threshold calculated at 23.64 kg/m² (sensitivity = 93.7%, specificity = 85.6%, J = .793). BSA (AUC = .953, cut-off = 1.74 m²) and WWI (AUC = .876, cut-off = 9.63) consolidated the sovereign somatometric predictive capacity. Critically, secondary biological and psychological markers showed an extremely robust diagnostic performance in women: the prenatal marker represented by the R-2D:4D digit ratio manifested a prominent area under the curve (AUC = .737, p < .001), fixing the risk threshold at a value of 1.01, followed stably by the SAD-to-Waist Ratio (AUC = .677, p < .001, cut-off = .25). Remarkably, the psychological variable of perceived stress demonstrated a valid and robust clinical diagnostic utility exclusively among female students (AUC = .631, 95% CI (.559, .704), p < .001), with the optimal threshold beyond which the risk of abdominal adiposity volume accumulation increases significantly established at a value of 66.50 points.
4. Discussion
The results indicate a sex-based segregation across study profiles (a female predominance in BS and a male majority in CSE), but a balanced overall distribution (44.7% men vs. 55.3% women). This structure, showing a significant difference (p < .001), allows for a nuanced, sex-controlled analysis of the selected anthropometric predictors and perceived stress, effectively accounting for the inherent sexual dimorphism.
Furthermore, our findings highlight an interesting asymmetry between classic and advanced anthropometric indicators. The fact that students in the BS program (particularly men) present higher BMI and WWI scores compared to their counterparts in other specializations may reflect specific lifestyle characteristics or dietary behaviors characteristic of the initial years of university life in the medical field—a phenomenon partially documented in the literature [33,34,35,36]. On the other hand, the lack of statistical significance for the R-2D:4D ratio across academic programs validates its nature as a biologically fixed prenatal marker, independent of subsequent vocational or academic trajectories, while preserving typical sexual dimorphism (lower values in men, typically below 1.00). Similarly, the uniformity of perceived stress across academic profiles, combined with consistently higher scores in women, underscores that psychological vulnerability within the university environment is mediated by sex-based factors rather than the curricular specificities of the chosen program.
The sexual dimorphism observed in correlation dynamics provides additional evidence regarding the biological and behavioral determinism of weight status. The female-exclusive correlation between the perceived stress score and BMI supports hypotheses in medical psychology regarding sex-differentiated coping mechanisms; young women tend to associate emotional distress with alterations in dietary behavior (such as emotional eating), leading over time to increased body mass, a phenomenon less pronounced in men at this age stage. Furthermore, the stronger association of the 2D:4D digit ratio with adiposity indicators (BMI, WWI) in women compared to men suggests that the prenatal hormonal environment (a higher ratio indicating lower fetal testosterone and higher estrogen exposure) may exert a long-lasting programmatic influence on the predisposition toward adipose tissue accumulation in young adulthood, manifesting more prominently among female students.
A finding of particular scientific interest in our study is represented by the divergent predictive role of the right-hand 2D:4D digit ratio. The fact that this prenatal biological marker demonstrated a significant negative influence on AVI exclusively among female students (p = .043) provides fresh evidence in support of the "intrauterine programming" theory of obesity. A lower R-2D:4D ratio, theoretically associated with increased exposure to fetal testosterone, appears to act as a long-term vulnerability factor for adipose tissue accumulation in women—a dynamic that is completely masked when the analysis is performed without sex stratification. Furthermore, the massive discrepancy between the coefficient of determination in men (R² = .986) and that in women (R² = .440) suggests that the geometric equation of body volume captured by AVI is dictated almost mathematically by total body mass and surface area (BSA, BMI) in the case of young men. In women, however, the architecture of adipose tissue exhibits a significantly more complex variability, likely controlled by active hormonal profiles specific to childbearing age, which dilute the strictly anthropometric predictive strength of standard models.
The collapse of the coefficient of determination (R² = .296) observed exclusively among female students in the BS program represents a crucial element of novelty. This suggests that in the case of young women pursuing rigorous medical studies, AVI ceases to be a simple linear reflection of overall body mass (BMI), being governed instead by a far more complex dynamic. The fact that the WWI index remains the only stable predictive pillar in this group demonstrates its superior clinical utility. WWI succeeds in capturing subtle variations in abdominal fat distribution independently of gross body weight, offering a much higher screening accuracy for this specific sample category. Concurrently, the emergence of stress as a significant negative predictor in the equation for BS men (p = .007) indicates a distinct psychosomatic response: under conditions of high academic distress [37], these students appear to engage mechanisms that limit central body adiposity accumulation, in contrast to the behaviors described in women, further underscoring the necessity for sex-individualized approaches in clinical assessment [38,39].
This selective collapse of anthropometric predictability under the influence of stress within the female sample (R² decreasing from 88.3% to 41.3%) makes a valuable original contribution to medical anthropology and neuroendocrinology. The complete loss of BMI's significance as a weight-related predictor under stress conditions (p = .264) demonstrates that, under the influence of psychological distress, adiposity accumulation or volume in young women no longer follows a linear or homogeneous weight increase model. Pathophysiologically, chronic stress activates the hypothalamic-pituitary-adrenal (HPA) axis, generating a hypersecretion of cortisol. Cortisol, due to the high density of glucocorticoid receptors in the mesenteric region, promotes the redistribution of deep adipose tissue and alters body volume geometry in a manner that classic BMI cannot capture [40]. The major relevance of the modern WWI index (p < .001) under stress conditions strengthens this hypothesis, given that WWI corrects waist circumference relative to total weight, thereby isolating metabolically induced central-adipose accumulation. Furthermore, the strong re-emergence of the 2D:4D digit ratio as a negative predictor (p = .015) exclusively under stress conditions suggests that the prenatal hormonal imprint (fetal exposure to androgens/estrogens) acts as a latent programming factor. This biological marker appears to dictate the constitutional sensitivity of tissues to stress in adulthood, governing the pattern of fat storage when the organism's homeostasis is psychologically disrupted—a dynamic that is completely absent in the male sample.
This advanced three-dimensional exploration validates a crucial hypothesis: the interaction between the adaptive psychological state (stress) and anthropometric indicators is critically mediated by the vocational-academic environment in young women. The discovery that the collapse of adiposity volume (AVI) predictability occurs strictly among stressed female students in the BS program isolates this group as possessing a unique neuroendocrine vulnerability. Medical and biomedical education imposes chronic stress patterns characterized by high performance pressure and sleep deprivation, factors recognized for triggering severe dysfunction of the hypothalamic-pituitary-adrenal (HPA) axis. The resulting pulsatile and chaotic secretion of cortisol acts selectively, inhibiting peripheral storage and promoting deep central-abdominal fat accumulation [41]. This phenomenon explains why BMI and BSA (indicators of overall body mass) become completely incompetent in predicting AVI among high-stress female medical students (p > .05), leaving WWI as the sole valid compositional indicator (p = .002). Biologically, the behavior of the R-2D:4D digit ratio within this subgroup is fascinating. In female students with low stress levels, R-2D:4D displays a positive coefficient, reflecting the standard female dimorphic pattern where prenatal estrogen exposure favors normal gynoid adiposity. Under the effect of stress, however, the reversal of the coefficient to a negative direction (B = -87.780, p = .019) demonstrates that women with a lower R-2D:4D ratio (increased prenatal testosterone exposure, indicating a more androgenic biometric profile) become hyper-reactive to cortisol, developing a much more pronounced central adiposity volume. This early hormonal imprint appears to function as a biological marker of latent constitutional sensitivity, activated exclusively by the noxious stimulus represented by intense academic stress—a dynamic completely absent in technical or social sciences profiles, where coping resources or the nature of curricular stress may take different forms [42].
The rigorous establishment of clinical thresholds through Youden optimization brings to light findings of particular epidemiological and anthropological importance. The fact that the optimal cut-off thresholds for BMI positioned themselves firmly below the conventional clinical overweight limit (≥ 25.0 kg/m²) in both sexes (reaching values of 22.93 kg/m² in men and 23.64 kg/m² in women) constitutes undeniable empirical evidence that the dangerous expansion of central adiposity volume (captured by the modern AVI index) establishes itself silently among young university students even within a weight range considered clinically normal. This dynamic supports recent arguments in the literature signaling that among young populations, often characterized by physical inactivity, raw BMI tends to significantly underestimate early visceral adiposity accumulation, making the introduction of more sensitive geometric volumetric indices mandatory (39). The comprehensive predictive success demonstrated by the ROC curves within the female sample—where even the PSQ score (AUC = .631, p = .01) and the R-2D:4D digit ratio (AUC = .737, p < .001, cut-off = 1.01, J = .439) achieved a high level of clinical performance—elucidates the indissoluble interconnection among psychological vulnerability, prenatal endocrine determinism, and the phenotypic expression of obesity in women. A major and original finding of our research is represented by the stark, sex-dependent polarization of perceived stress's (PSQ score) predictive capacity on the Adiposity Volume Index (AVI). Our data demonstrate that while within the male sample, the stress level exhibits no clinical screening utility (p > .05), within the female population, the PSQ score becomes a genuine and highly statistically significant predictor, with a critical alarm threshold identified at a value of 66.50 points. The identification of this value as the optimal risk threshold for perceived stress within the female subgroup provides clinicians with a clear psychometric screening indicator: exceeding this score is associated with an increased probability of accelerated visceral fat accumulation—an effect likely mediated through the neuroendocrine pathways of the HPA axis and glucocorticoid secretion [43]. Furthermore, the solid performance of the R-2D:4D digit ratio in women demonstrates that the constitutional sensitivity of fatty tissues and the geometric pattern of storage in young adulthood are under strong latent intrauterine hormonal programming. High estrogen exposure during prenatal development is significantly related to the development of excessive body weight in men and women and the accumulation of subcutaneous fat in the arms, thighs, and lower legs in women with obesity. This relationship indicates a new area of activity in the field of obesity prevention [25]. Moreover, it seems that the 2D:4D index (especially of the right hand) may be a useful factor in the early prediction of the risk of developing excessive body weight in humans [44]. Additionally, the 2D:4D ratio in general, but particularly that of the right hand, serves as an excellent biomarker for metabolic syndrome and cardiovascular risk [25]. In men, the strict isolation of diagnostic capacity solely within pure somatometric parameters (BMI, BSA, WWI) and the clinical failure of adaptive indicators reconfirm that the male body status is significantly more conservative biologically, being governed at this stage of life by raw geometric laws directly related to total surface area and body mass, a phenomenon also noted in other studies [45,46].
This major sex-based discrepancy can be grounded in two interdependent mechanisms: one neuroendocrine and one behavioral in nature [47].
From a behavioral and psychometric perspective, young female students exposed to high levels of stress tend to adopt coping strategies radically different from those of men, frequently oriented toward dysfunctional dietary habits known as "emotional eating" [38,48]. Under the pressure of stress, women present a statistically more pronounced tendency to consume hypercaloric foods rich in refined carbohydrates and saturated fats—a mechanism that offers a temporary reduction in anxiety by stimulating dopaminergic reward pathways [49]. Correlating this behavior with the physical inactivity specific to exam periods explains why the threshold of 66.50 points on the PSQ questionnaire isolates the risk of increased AVI with such high accuracy exclusively within the female sample.
An interesting 2020 study showed that AVI is higher in people with depression/anxiety [50]. AVI takes place among the best indicators of abdominal fat deposition [51]. The utilization and combination of anthropometric indices in identifying central or visceral obesity, especially in individuals presenting a normal weight, is of paramount importance; we share the perspective of de Jesus et al. [8], who obtained unfavorable cardiometabolic marker values in individuals with normal-weight obesity compared to normal-weight individuals who did not exhibit central or visceral obesity—a phenomenon also reported in other studies [17]. Previous research [52] has demonstrated the existence of differences in stress reactions based on various demographic variables. Thus, women and older individuals exhibit more stress reactions, likely due to a more pronounced tendency to appraise many life situations as threatening and to utilize emotional coping strategies [53]. Low socio-economic status is associated with an increased level of distress in men. Furthermore, professional roles are related to stress in married women with children who experience low levels of cooperation between partners [54].
Studies such as those conducted by Barnett et al. [55] show that female students manifest a higher level of self-criticism in response to hypothetical failures than male students, suggesting that women may perceive threatening events as more stressful than men do. More recent research [56,57] has uncovered a strong link between negative life events and suicidal ideation or attempts. This relationship was moderated by a sense of competence, autonomy, and the satisfaction of basic psychological needs.
On the other hand, Szabo and Marian [58] found that university students face pressures related to both academic performance and family-related stressors (such as financial situations, ill partners, or children). Social support was identified as a critical mitigating factor against the stress experienced by students.
Performance expectations, in turn, determine a series of stress consequences, manifested as physiological, emotional, social, cognitive, and performance-related stress. Research conducted on the Romanian university student population has also found that a relationship exists among active stress management (taking active steps to try to eliminate the stressor), the positive reinterpretation of stress, and personality variables. Other authors emphasize that students' sense of control over a stressful situation can have a mitigating effect [59]. Female students appear to appraise stressful situations in a more negative manner. Additionally, male students report a higher level of leisure-time satisfaction than female students. However, studies also show that some individuals resort to negative coping strategies to manage stressors—such as self-criticism, alcohol, drugs, and internet addiction—which are not helpful in the long term [39].
Perceived stress, coping strategies, and social support contribute significantly to students' well-being. In the same vein, Sandler [60], who studied perceived stress and academic performance among university students, argues that higher education institutions must provide relevant curricula and services tailored to students' needs. Many students attempt to complete their studies and workplace tasks simultaneously, in addition to managing family responsibilities, which frequently generates supplementary stress.
From the analysis of the literature, two important conclusions emerge: first, it is essential to understand the specific sources of stressors faced by university students, and second, it is crucial to identify the various reactions to these stressors.
Abdominal obesity, whether central or visceral, is clearly a major risk factor for metabolic syndrome. Therefore, a careful and thorough approach is imperatively needed in the prevention, identification, and appropriate treatment of obesity. Diagnosis is achieved based on anthropometric indices associated (either directly or indirectly) with adiposity and its distribution within the body, as well as through the combination of these indices [61]. Combining anthropometric indices alone, or combining them with digit ratios (which represent secondary anthropometric markers), as well as with psychological factors, can provide a more comprehensive picture of cardiometabolic risk.
The fundamental originality and innovative character of our study reside in its holistic and three-dimensional approach to the interaction among biology, academic profile, and psychological state. Beyond strictly somatometric determinism, psychological stress represents a major systemic modulator of energy metabolism.
The results of our research underscore the urgent need to reconfigure preventive medicine programs within the university environment. They demonstrate that weight and adiposity management in female students cannot be effective if approached in isolation, through strictly nutritional measures; rather, it must obligatorily integrate psychological strategies aimed at reducing perceived stress, viewed as direct measures for preventing cardiometabolic risk.
4.1. Practical Recommendations for Clinicians and Educational Institutions
Based on the findings of this study, several actionable recommendations can be formulated for both clinical practice and academic environments:
- Implementation of Non-Invasive Screening Programs: It is highly recommended to utilize the WWI and the SAD-to-Waist Ratio in university student health centers as rapid, cost-effective, and substantially more precise instruments than raw BMI for the early identification of metabolic risks.
- Tailored Intervention Strategies Based on Academic Profiles: Because indices vary significantly among university programs (BS, CSE, and SSP), higher education institutions should design department-specific health campaigns. For instance, incorporating active breaks and optimizing ergonomics would benefit CSE students, who may be more predisposed to extreme physical inactivity.
- Integration of Psychological and Nutritional Support: Given the demonstrated impact of perceived stress (PSQ) on morphological indices, university nutrition or physical activity programs must not be implemented in isolation; instead, they should be obligatorily coupled with stress management techniques and psychological counseling.
- Monitoring Anthropometric Markers Throughout the University Years: It is strongly recommended to conduct longitudinal studies (tracking students from their first year until graduation) to precisely observe how exam-related stress and the academic lifestyle influence body shape evolution over time.
- Utilization of the Digit Ratio (2D:4D) in Complementary Research: Including this stable biological marker in screening evaluations can assist in identifying an underlying constitutional predisposition, thereby enabling a significantly more personalized and preventive healthcare approach.
4.2. Limitations of the Study
Although the present research provides valuable and original insights into the neuro-somatic interaction among young adults, several methodological limitations must be considered. First, the cross-sectional design of the study precludes the establishment of direct causal relationships between perceived stress and modifications in AVI. Second, utilizing a sample derived from a single higher education institution, limited to students from three specific academic profiles, restricts the generalizability of the findings to the broader population or other age cohorts. Third, the assessment of stress relied exclusively on psychological self-report scales, reflecting subjective perception, without integrating objective endocrine biomarkers (e.g., free cortisol). Finally, the absence of strict statistical control for variables related to detailed dietary behavior and precise physical activity levels represents a limitation that warrants adjustment in future research utilizing a longitudinal approach.
5. Conclusions
The present research highlights a profound, sex-dependent phenotypic and psychosomatic differentiation regarding the capacity of anthropometric and psychological predictors to identify elevated adiposity volume among the young university population:
- Sovereignty of Classic Anthropometric Indices: Within both the male and female cohorts, anthropometric indices (BMI and BSA) maintain their status as primary predictors, demonstrating maximum diagnostic accuracy in screening overall weight status.
- Validation of Advanced Waist Indices: The Weight-Adjusted Waist Index (WWI) represents a robust and cross-sex equilibrated instrument, confirming that the monitoring of abdominal fat can be performed with similar efficiency in both sexes through refined anthropometric equations.
- Prenatal Digital and Regional Dimorphism: The fetal hormonal imprint (reflected by the R-2D:4D digit ratio) and regional geometric abdominal traceability (expressed by the SAD-to-Waist Ratio) are confirmed as viable clinical screening markers exclusively within the female sample, demonstrating limited or absent predictive utility in men.
- Female Psychosomatic Vulnerability: The study certifies the existence of a critical link between the psychological and metabolic dimensions solely among female students. The level of perceived stress acts as a valid clinical predictor, scientifically demonstrating that psychological pressure within the academic environment translates directly into the risk of visceral adiposity accumulation in women, in contrast to men.
Author Contributions
Conceptualization, I.M.T. and M.I.M.; methodology, I.M.T. and M.I.M.; formal analysis, I.M.T. and M.I.M.; investigation, I.M.T. and M.I.M.; writing – original draft preparation, I.M.T. and M.I.M.; writing – review and editing, I.M.T., M.I.M. and C.B.; validation, I.M.T., M.I.M. and C.B.; visualization, I.M.T. and M.I.M.; supervision, I.M.T., M.I.M., and C.B.
Funding
This research received no external funding.
Institutional Review Board Statement
This study was conducted in accordance with Declaration of Helsinki, and approved by the Research Ethics Committee of the Faculty of Medicine and Pharmacy, University of Oradea, (protocol code CEFMF/1 and date of approval: 28 March 2024).
Informed Consent Statement
Informed consent was obtained from all participants involved in the study.
Data Availability Statement
The data presented in this study are available on request from the corresponding author. The data are not publicly available due to privacy restrictions and ethical restrictions.
Acknowledgments
The authors would like to thank all the participants who voluntarily took part in this study.
Conflicts of Interest
The authors declare no conflicts of interest.
Abbreviations
| BMI | Body Mass Index |
| BSA | Body Surface Area |
| 2D | 2nd digit (index finger) |
| 4D | 4th digit (ring finge) |
| R-2D:4D | Right Hand 2D:4D Ratio |
| SAD-to-Waist Ratio | Sagittal Abdominal Diameter to Waist Circumference Ratio |
| WWI | Weight-Adjusted Waist Index |
| AVI | Abdominal Volume Index |
| SAD | Sagittal Abdominal Diameter |
| W | Weight |
| H | Height |
| WC | Waist Circumference |
| HC | Hip Circumference |
| NWO | Normal-Weight Obesity |
| PSQ | Perceived Stress Questionnaire |
| LLS (.00 score) | Low Level of Stress |
| HLS (1.00 score) | High Level of Stress |
| BS | Biomedical Sciences |
| CSE | Computer Science and Engineering |
| SSP | Social Sciences and Physiotherapy |
| ANOVA | Analysis of Variance |
| ROC | Receiver Operating Characteristic |
| AUC | Area Under the Curve |
| CI | Confidence Interval |
| SD | Standard Deviation |
| HPA | Hypothalamic-Pituitary-Adrenal Axis |
References
- Piqueras, P.; Ballester, A.; Durá-Gil, J.V.; Martinez-Hervas, S.; Redón, J.; Real, J.T. Anthropometric Indicators as a Tool for Diagnosis of Obesity and Other Health Risk Factors: A Literature Review. Front. Psychol. 2021, 12, 631179. [CrossRef]
- Lynch, D.H.; Petersen, C.L.; Fanous, M.M.; Spangler, H.B.; Kahkoska, A.R.; Jimenez, D.; Batsis, J.A. The relationship between multimorbidity, obesity and functional impairment in older adults. J. Am. Geriatr. Soc. 2022, 70, 1442–1449. [CrossRef]
- Schetz, M.; De Jong, A.; Deane, A.M.; Druml, W.; Hemelaar, P.; Pelosi, P.; Pickkers, P.; Reintam-Blaser, A.; Roberts, J.; Sakr, Y.; Jaber, S. Obesity in the critically ill: A narrative review. Intensive Care Med. 2019, 45, 757–769. [CrossRef]
- Wang, J.; Wang, Y.; Li, S.; Wu, B.; Feng, Q.; Qiu, W.; Wang, J.; Gao, H. Waist-to-weight index and cognitive impairment: Understanding the link through depression mediation in the NHANES. J. Affect. Disord. 2024, 365, 313–320. [CrossRef]
- Kahn, C.R.; Wang, G.; Lee, K.Y. Altered adipose tissue and adipocyte function in the pathogenesis of metabolic syndrome. J. Clin. Invest. 2019, 129, 3990–4000. [CrossRef]
- Di Angelantonio, E.; Bhupathiraju, S.H.; Wormser, D.; Gao, P.; Kaptoge, S.; Berrington de Gonzalez, A.; Cairns, B.J.; Huxley, R.; Jackson, C.L.; Joshy, G.; Lewington, S.; Manson, J.E.; Murphy, N.; Patel, A.V.; Samet, J.M.; Woodward, M.; Zheng, W.; Zhou, M.; Bansal, N.; Hu, F.B. Body-mass index and all-cause mortality: Individual-participant-data meta-analysis of 239 prospective studies in four continents. Lancet 2016, 388, 776–786. [CrossRef]
- Badillo, N.; Khatib, M.; Kahar, P.; Khanna, D. Correlation Between Body Mass Index and Depression/Depression-Like Symptoms Among Different Genders and Races. Cureus 2022, 14, e21841. [CrossRef]
- de Jesus, F.G.; Duque, A.P.; Huguenin, G.V.B.; Mediano, M.F.F.; de Almeida, M.T.; Caldas, C.C.A.; Marques-Neto, S.R.; Rodrigues Junior, L.F. Normal-Weight Obesity and an Unfavorable Cardiometabolic Profile: Results from the Study of Workers’ Health (ESAT). Healthcare 2026, 14, 1008. [CrossRef]
- Mohammadian Khonsari, N.; Khashayar, P.; Shahrestanaki, E.; Kelishadi, R.; Mohammadpoor Nami, S.; Heidari-Beni, M.; Esmaeili Abdar, Z.; Tabatabaei-Malazy, O.; Qorbani, M. Normal Weight Obesity and Cardiometabolic Risk Factors: A Systematic Review and Meta-Analysis. Front. Endocrinol. 2022, 13, 857930. [CrossRef]
- Park, Y.; Kim, N.H.; Kwon, T.Y.; Kim, S.G. A novel adiposity index as an integrated predictor of cardiometabolic disease morbidity and mortality. Sci. Rep. 2018, 8, 16753. [CrossRef]
- Cai, S.; Zhou, L.; Zhang, Y.; Cheng, B.; Zhang, A.; Sun, J.; Li, M.; Su, Y.; Bao, Q.; Zhang, Y.; Ma, S.; Zhu, P.; Wang, S. Association of the Weight-Adjusted-Waist Index With Risk of All-Cause Mortality: A 10-Year Follow-Up Study. Front. Nutr. 2022, 9, 894686. [CrossRef]
- Qin, Z.; Chang, K.; Yang, Q.; Yu, Q.; Liao, R.; Su, B. The association between weight-adjusted-waist index and increased urinary albumin excretion in adults: A population-based study. Front. Nutr. 2022, 9, 941926. [CrossRef]
- Korycka-Bloch, R.; Balicki, P.; Guligowska, A.; Sołtysik, B.K.; Kostka, T.; Chrząstek, Z. Weight-Adjusted Waist Index (WWI)—A Promising Anthropometric Indicator of Depressive Symptoms in Hospitalized Older Patients. Nutrients 2024, 17, 68. [CrossRef]
- Huang, X.T.; Lv, X.; Jiang, H. The weight-adjusted-waist index and cognitive impairment among U.S. older adults: A population-based study. Front. Endocrinol. 2023, 14, 1276212. [CrossRef]
- Kahn, H.S.; Rissanen, H.; Bullard, K.M.; Knekt, P. The population distribution of the sagittal abdominal diameter (SAD) and SAD/height ratio among Finnish adults. Clin. Obes. 2014, 4, 333–341. [CrossRef]
- Hu, Z.; Liang, R.; Chen, Y. Sagittal abdominal diameter: A novel and potentially superior indicator than waist circumference for diagnosis of central obesity, based on evidence from multiple data sources. Atherosclerosis 2025, 402, 119107. [CrossRef]
- Wu, Y.; Li, D.; Vermund, S.H. Advantages and Limitations of the Body Mass Index (BMI) to Assess Adult Obesity. Int. J. Environ. Res. Public Health 2024, 21, 757. [CrossRef]
- Visaria, A.; Setoguchi, S. Body mass index and all-cause mortality in a 21st century U.S. population: A National Health Interview Survey analysis. PLoS ONE 2023, 18, e0287218. [CrossRef]
- Jeong, S.M.; Lee, D.H.; Rezende, L.F.M.; Giovannucci, E.L. Different correlation of body mass index with body fatness and obesity-related biomarker according to age, sex and race-ethnicity. Sci. Rep. 2023, 13, 3472. [CrossRef]
- Byker Shanks, C.; Bruening, M.; Yaroch, A.L. BMI or not to BMI? debating the value of body mass index as a measure of health in adults. Int. J. Behav. Nutr. Phys. Act. 2025, 22, 23. [CrossRef]
- Risérus, U.; de Faire, U.; Berglund, L.; Hellénius, M.L. Sagittal abdominal diameter as a screening tool in clinical research: Cutoffs for cardiometabolic risk. J. Obes. 2010, 2010, 757939. [CrossRef]
- Yurtsever, C.; Vatansever, M.; Yurtsever, B.A.; Atasoy, V. Corrigendum to "2D: 4D digit ratio, bilateral asymmetry, and insulin resistance in women with obesity" [Early Hum. Dev. 217 (2026) 106518]. Early Hum. Dev. 2026, 217, 106521. [CrossRef]
- Jeevanandam, S.; Muthu, P.K. 2D:4D Ratio and its Implications in Medicine. J. Clin. Diagn. Res. 2016, 10, CM01–CM03. [CrossRef]
- Manning, J.T.; Fink, B. Digit ratio (2D:4D) and its relationship to foetal and maternal sex steroids: A mini-review. Early Hum. Dev. 2023, 183, 105799. [CrossRef]
- Elvan, Ö.; Serin, E.K.; Emül, T.G. Exploring the Predictive Value of 2D:4D Ratio in Cardiovascular Diseases and Metabolic Syndrome: A Systematic Review. Am. J. Hum. Biol. 2025, 37, e70140. [CrossRef]
- Manning, J.T. Resolving the role of prenatal sex steroids in the development of digit ratio. Proc. Natl. Acad. Sci. USA 2011, 108*, 16143–16144. [CrossRef]
- Manning, J.T.; Fink, B. Sexual dimorphism in the ontogeny of second (2D) and fourth (4D) digit lengths, and digit ratio (2D:4D). Am. J. Hum. Biol. 2018, 30, e23138. [CrossRef]
- Servi, R.; Akkoc, R.F.; Aksu, F.; Cetin, S.; Kavaklı, A.; Ogeturk, M. Second to Fourth Digit Ratio (2D:4D) in Hypertension Disease. Am. J. Hum. Biol. 2025, 37, e70062. [CrossRef]
- Levenstein, S.; Prantera, C.; Varvo, V.; Scribano, M.L.; Berto, E.; Luzi, C.; Andreoli, A. Development of the Perceived Stress Questionnaire: A new tool for psychosomatic research. J. Psychosom. Res. 2093, 37, 19–32. [CrossRef]
- Băban, A. Stress and personality; Presa Universitară Clujeană: Cluj-Napoca, România, 1998.
- Haroun, D.; Darwish, M.; Ehsanallah, A. Associations of body adiposity index, body mass index, waist circumference, and percentage of body fat in young female Emirati adults. PLoS ONE 2024, 19, e0302779. [CrossRef]
- Iyen, B.; Weng, S.; Vinogradova, Y.; Akyea, R.K.; Qureshi, N.; Kai, J. Long-term body mass index changes in overweight and obese adults and the risk of heart failure, cardiovascular disease and mortality: A cohort study of over 260,000 adults in the UK. BMC Public Health 2021, 21, 576. [CrossRef]
- Telfer, M. An Analysis Of How Stress Impacts Dietary Habits In First-Year Students. Senior Theses, University of South Carolina, Columbia, SC, USA, 2020, p. 388. https://scholarcommons.sc.edu/senior_theses/388.
- Vila-Martí, A.; Elío, I.; Sumalla-Cano, S. Eating Behavior during First-Year College Students, including Eating Disorders-RUVIC-RUNEAT-TCA Project. Protocol of an Observational Multicentric Study. Int. J. Environ. Res. Public Health 2021, 18*, 9457. [CrossRef]
- Horaist, H.; Watson, M. Healthy Lifestyle Behaviors Among First-Year College Students Attending a University in Mississippi. Am. J. Lifestyle Med. 2024, 18, 512–519. [CrossRef]
- Avram, C.; Nyulas, V.; Onisor, D.; Georgescu, I.M.; Szakacs, J.; Ruta, F. Food Behavior and Lifestyle Among Students: The Influence of the University Environment. Nutrients 2025, 17, 12. [CrossRef]
- Deng, W.; Mei, J. Relationship between obesity-related indicators and adult depression from NHANES 2021 to 2023: A cross-sectional study. Medicine 2026, 105, e49216. [CrossRef]
- Roy, S.K.; Jahan, K.; Alam, N. Perceived stress, eating behavior, and overweight and obesity among urban adolescents. J. Health Popul. Nutr. 2021, 40, 54. [CrossRef]
- Vučković, V.; Kajtna, T.; Širok, K. Physical Activity, Body Appreciation, and Perceived Stress in Relation to Life Satisfaction Among University Students. Healthcare 2026, 14, 1572. [CrossRef]
- Mouchacca, J.; Abbott, G.R.; Ball, K. Associations between psychological stress, eating, physical activity, sedentary behaviours and body weight among women: A longitudinal study. BMC Public Health 2013, 13, 828. [CrossRef]
- Carlsson, A.C.; Riserus, U.; Ärnlöv, J.; Borné, Y.; Leander, K.; Gigante, B.; Hellénius, M.L.; Bottai, M.; de Faire, U. Prediction of cardiovascular disease by abdominal obesity measures is dependent on body weight and sex--results from two community based cohort studies. Nutr. Metab. Cardiovasc. Dis. 2014, 24, 891–899. [CrossRef]
- Faris, M.E.; Cheikh Ismail, L.; Abdelrahim, D.N.; Zeb, F.; Mohamad, M.N.; Saleh, S.T.; Raad, S.; Tenbakji, R.; Mohammad, H.; Khalaf, L.; Alnimer, A.W.; Stojanovska, L.; Al Dhaheri, A.S. Exploring the interplay between stress level, sleep quality, and body composition among university students: A cross-sectional study. J. Educ. Health Promot. 2025, 14, 486. [CrossRef]
- Tchernof, A.; Després, J.P. Pathophysiology of human visceral obesity: An update. Physiol. Rev. 2013, 93, 359–404. [CrossRef]
- Iljin, A.; Antoszewski, B.; Szewczyk, T.; Strzelczyk, J.K.; Jędrych, M.; Kasielska-Trojan, A. The 2D:4D index is associated with the development of excess body weight in adults, but not with the rate of weight loss following bariatric surgery. Sci. Rep. 2022, 12, 8078. [CrossRef]
- Cao, T.; Xie, R.; Wang, J.; Xiao, M.; Wu, H.; Liu, X.; Xie, S.; Chen, Y.; Liu, M.; Zhang, Y. Association of weight-adjusted waist index with all-cause mortality among non-Asian individuals: A national population-based cohort study. Nutr. J. 2024, 23*, 62. [CrossRef]
- Mainous, A.; Wu, V.; Yin, L.; Sharma, P.; Jenkins, B.; Saguil, A.; Nelson, D.; Orlando, F. Body Mass Index versus Percent Body Fat as a Predictor of Mortality in Men Aged 20-49. Ann. Fam. Med. 2024, 22, 6079. [CrossRef]
- Torres, S.J.; Nowson, C.A. Relationship between stress, eating behavior, and obesity. Nutrition 2007, 23, 887–894. [CrossRef]
- Mróz, M.; Stobnicka, D.; Marcewicz, A.; Szlendak, B.; Iwanowicz-Palus, G. Stress and Coping Strategies among Women in Late Motherhood. J. Clin. Med. 2024, 13, 1995. [CrossRef]
- Amiri, S.; Behnezhad, S. Obesity and anxiety symptoms: A systematic review and meta-analysis. Neuropsychiatrie 2019, 33, 72–89. [CrossRef]
- Hadi, S.; Momenan, M.; Cheraghpour, K.; Hafizi, N.; Pourjavidi, N.; Malekahmadi, M.; Foroughi, M.; Alipour, M. Abdominal volume index: A predictive measure in relationship between depression/anxiety and obesity. Afr. Health Sci. 2020, 20, 257–265. [CrossRef]
- Wang, H.; Liu, A.; Zhao, T.; Gong, X.; Pang, T.; Zhou, Y.; Xiao, Y.; Yan, Y.; Fan, C.; Teng, W.; Lai, Y.; Shan, Z. Comparison of anthropometric indices for predicting the risk of metabolic syndrome and its components in Chinese adults: A prospective, longitudinal study. BMJ Open 2017, 7, e016062. [CrossRef]
- Barnet, B.; Joffe, A.; Duggan, A.K.; Wilson, M.D.; Repke, J.T. Depressive symptoms, stress, and social support in pregnant and postpartum adolescents. Arch. Pediatr. Adolesc. Med. 1996, 150, 64–69. [CrossRef]
- Miller, S.M.; Kirsch, N. Sex differences in cognitive coping with stress. In Gender and Stress; Barnett, R.C., Biener, L., Baruch, G.K., Eds.; Free Press: New York, NY, USA, 1987; pp. 278–307.
- Greenglass, E.R. The Contribution of Social Support to Coping. In Women in Management; Snyder, E., Ed.; Taylor & Francis: London, UK, 1993; pp. 323–340.
- Barnett, R.C.; Baruch, G.K.; Biener, L. Women and Gender in Research on Work and Family Stress. Am. Psychol. 1987, 42, 130–136. [CrossRef]
- Marian, M. Trial of hopelessness theory by the use of modelling. New psychometric data on the Hopelessness Depression Symptom Questionnaire. J. Psychol. Educ. Res. 2012, 20, 45–58.
- Rowe, C.A.; Walker, K.L.; Britton, P.C.; Hirsch, J.K. The relationship between negative life events and suicidal behavior moderating role of basic psychological needs. Crisis 2013, 34, 233–241. [CrossRef]
- Szabo, Z.; Marian, M. Stressors and reactions to stress: A cross-cultural case study in two educational programs. J. Evidence-Based Psychother. 2017, 17, 89–103. [CrossRef]
- Misra, R.; McKean, M. College students’ academic stress and its relation to their anxiety, time management, and leisure satisfaction. Am. J. Health Stud. 2000, 16*, 41–51.
- Sandler, M.E. A structural examination of academic integration, perceived stress, academic performance, and goal commitment from an elaborated model of adult student persistence. Presented at the Annual Meeting of the American Educational Research Association, New Orleans, LA, USA, April 2002.
- Bener, A.; Yousafzai, M.T.; Darwish, S.; Al-Hamaq, A.O.; Nasralla, E.A.; Abdul-Ghani, M. Obesity index that better predict metabolic syndrome: Body mass index, waist circumference, waist hip ratio, or waist height ratio. J. Obes. 2013, 2013, 269038. [CrossRef]
Figure 1.
Receiver operating characteristic (ROC) curves for abdominal volume. BMI = Body Mass Index; R-2D:4D = Right Hand 2D:4D Ratio; SAD-to-Waist Ratio = Sagittal Abdominal Diameter to Waist Circumference Ratio; BSA = Body Surface Area; WWI = Weight-Adjusted Waist Index; PSQ = Perceived Stress Questionnaire. (a). in male group; (b). in female group.
Figure 1.
Receiver operating characteristic (ROC) curves for abdominal volume. BMI = Body Mass Index; R-2D:4D = Right Hand 2D:4D Ratio; SAD-to-Waist Ratio = Sagittal Abdominal Diameter to Waist Circumference Ratio; BSA = Body Surface Area; WWI = Weight-Adjusted Waist Index; PSQ = Perceived Stress Questionnaire. (a). in male group; (b). in female group.
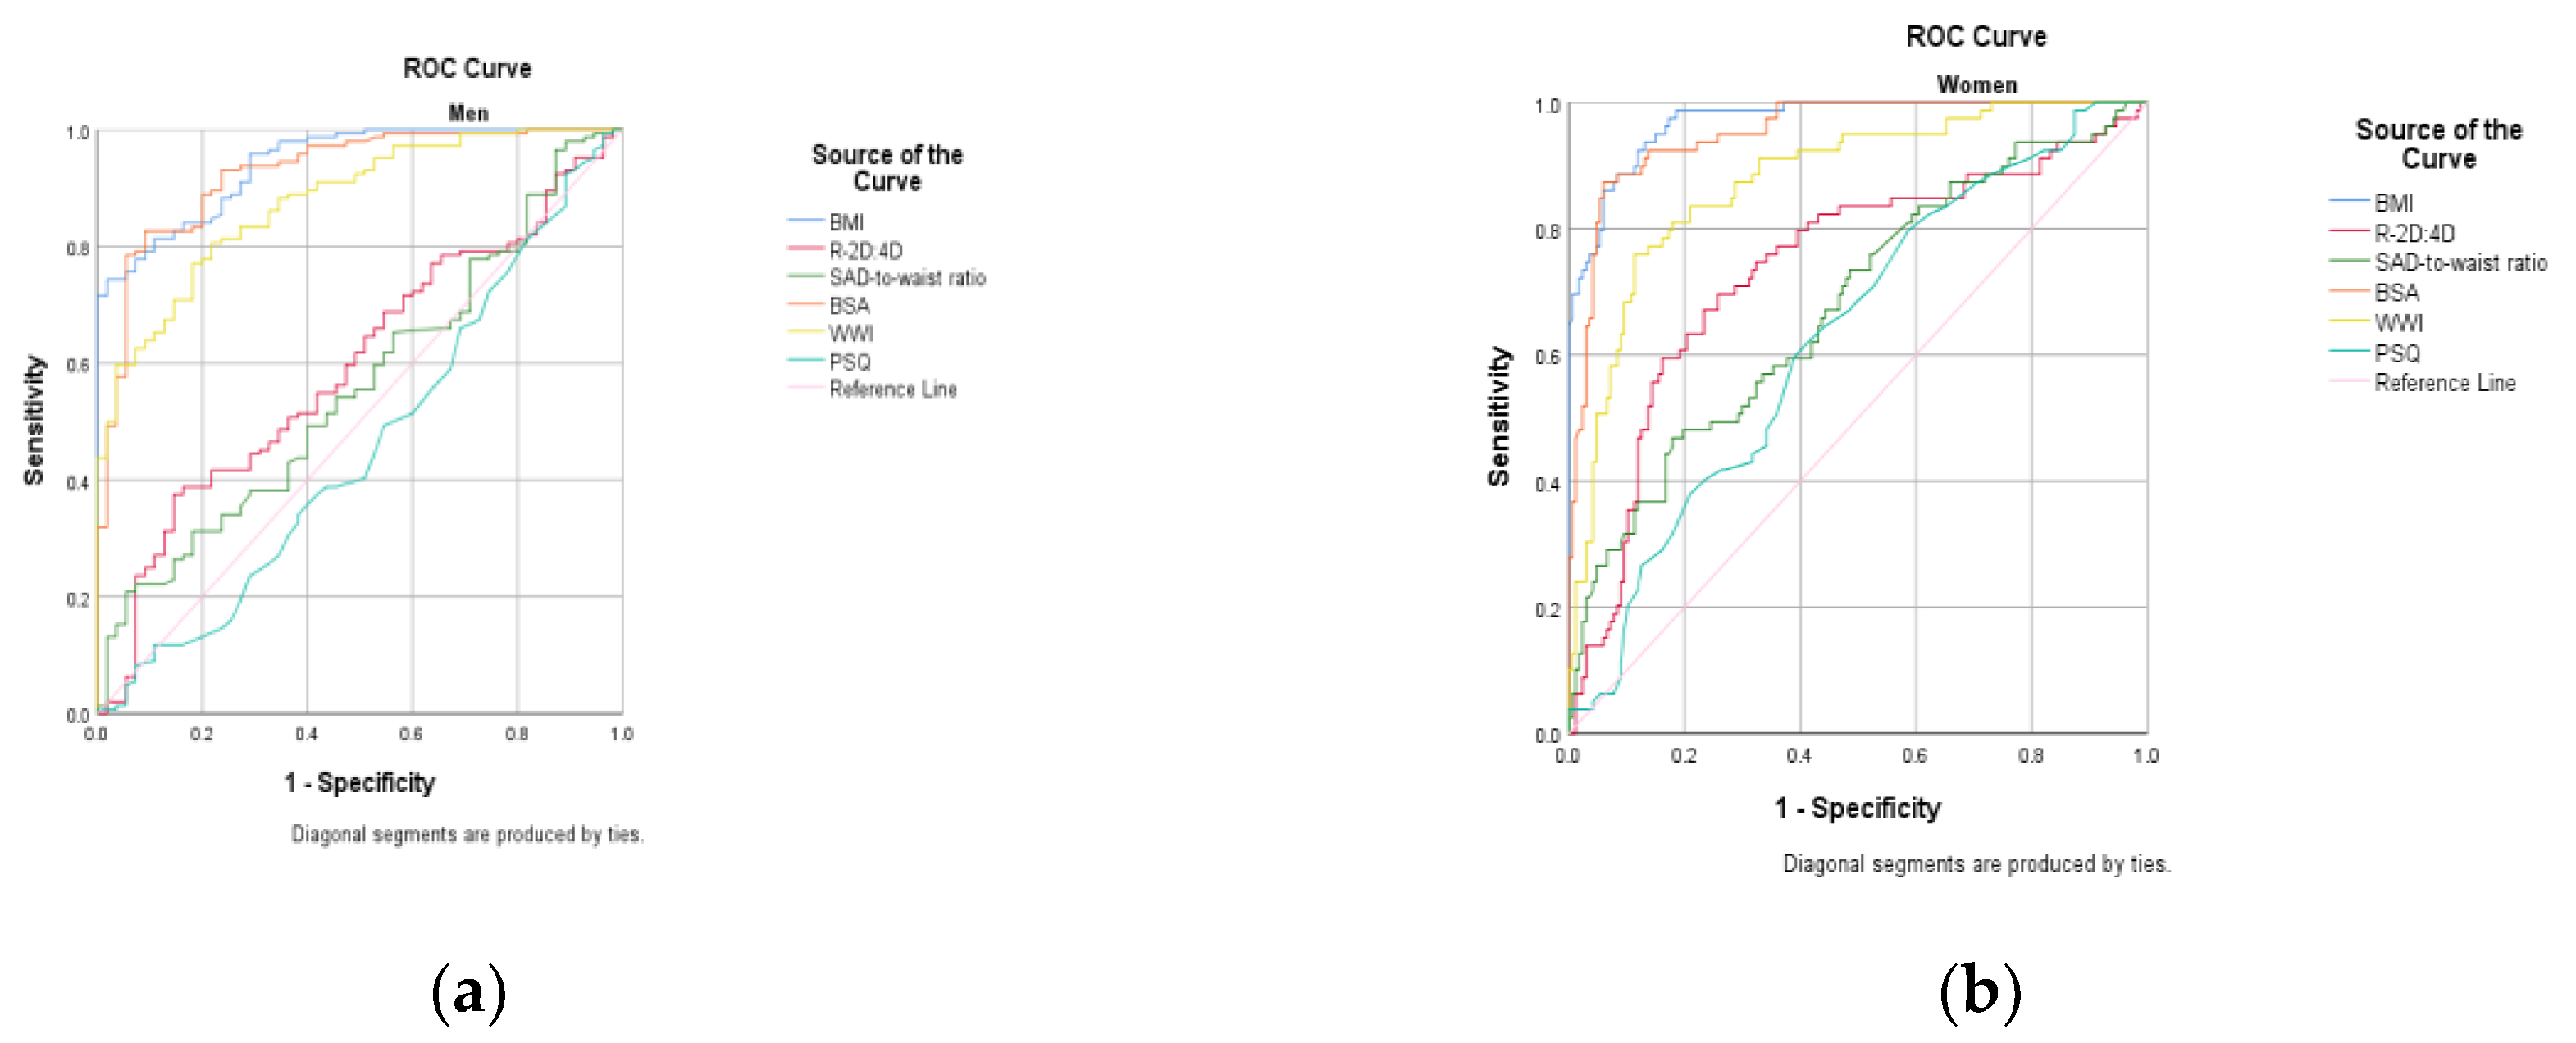

Table 1.
Sample structure according to academic program and sex.
| Academic program | Men n (%) |
Women n (%) |
Total n (%) |
χ2 | p |
| Biomedical Sciences | 37 (25.7%) | 107 (74.3%) | 144 (100.0%) | 27,319 | .0001 |
| Computer Science and Engineering |
102 (64.2%) |
57 (35.8%) |
159 (100.0%) |
11,716 | .0006 |
| Social Sciences and Physiotherapy | 60 (42.3%) | 82 (57.7%) | 142 (100.0%) | 3,308 | .06 |
| Total sample size | 199 (44.7%) | 246 (55.3%) | 445 (100.0%) | 45.718 | < .001 |
Note: n = number of participants; % = percentage of the academic program total; χ² = value of Pearson's Chi-square test; p = statistical significance threshold.
Table 2.
Descriptive and comparative profile (ANOVA) of anthropometric and psychological parameters based on sex and academic program.
Table 2.
Descriptive and comparative profile (ANOVA) of anthropometric and psychological parameters based on sex and academic program.
| Parameter/ Predictor | Sex | BS (n = 144) Mean ± SD |
CSE (n = 159) Mean ± SD |
SSP (n = 142) Mean ± SD |
F | p | Post – Hoc (Tukey) |
| BMI | Men | 27.78 ± 4.5 | 24.83 ± 4.61 | 24.75 ± 4.54 | 6.418 | .002 | BS>CSE* BS>SSP* |
| Women | 24.66 ± 5.59 | 22.59 ± 4.72 | 23.44 ± 4.21 | 3.58 | .031 | BS>CSE* | |
| R-2D:4D | Men | .98 ± .03 | .98 ± .03 | .97 ± .03 | 2.685 | .071 | NS |
| Women | 1.00 ± .03 | 1.00 ± .21 | 1.00 ± .26 | .376 | .687 | NS | |
| SAD-to-Waist Ratio | Men | .26 ± .02 | .26 ± .02 | .26 ± .02 | .225 | .779 | NS |
| Women | .25 ± .02 | .26 ± .02 | .26 ± .02 | 4.332 | .014 | BS<CSE* | |
| BSA | Men | 2.01 ± .17 | 1.95 ± .17 | 1.91 ± .17 | 4.115 | .018 | BS>SSP* |
| Women | 1.70 ± .18 | 1.65 ± .17 | 1.71 ± .16 | 2.292 | .103 | NS | |
| WWI | Men | 10.07 ± .60 | 9.85 ± .55 | 9.73 ± .65 | 3.696 | .027 | BS>SSP* |
| Women | 9.50 ± 1.13 | 9.51 ± .76 | 9.41 ± .56 | .283 | .754 | NS | |
| PSQ | Men | 61.24 ± 12.40 | 61.61 ± 12.31 | 63.53 ± 13.42 | .545 | .581 | NS |
| Women | 67.22 ± 14.24 | 65.74 ± 13.05 | 66.99 ± 14.00 | .224 | .79 | NS |
Note: BS = Biomedical Sciences; CSE = Computer Science and Engineering; SSP = Social Sciences and Physiotherapy; BMI = Body Mass Index; R-2D:4D = Right Hand 2D:4D Digit Ratio; SAD-to-Waist Ratio = Sagittal Abdominal Diameter-to-Waist Circumference Ratio; BSA = Body Surface Area; WWI = Weight-Adjusted Waist Index; PSQ = Perceived Stress Questionnaire; NS = Statistically non-significant. Means are rounded according to standard editorial requirements. * Indicates significant differences at the p < .05 level in the post-hoc test.
Table 3.
Pearson correlation matrix between anthropometric and psychological parameters, stratified by sex (Men above the diagonal / Women below the diagonal).
Table 3.
Pearson correlation matrix between anthropometric and psychological parameters, stratified by sex (Men above the diagonal / Women below the diagonal).
| Coefficient / Predictor | BMI | R-2D:4D | SAD-to-Waist Ratio | BSA | WWI | PSQ |
| BMI | 1 | .238** | .374** | .736** | .639** | -.045 |
| R-2D:4D | .449** | 1 | .098 | .170* | .318** | .012 |
| SAD-to-Waist Ratio | .394** | .217** | 1 | .261** | .179* | .054 |
| BSA | .842** | .329** | .379** | 1 | .442** | -.021 |
| WWI | .454** | .286** | .130* | .326** | 1 | .062 |
| PSQ | .182** | -.012 | .041 | .038 | .029 | 1 |
Note: BMI = Body Mass Index; R-2D:4D = Right Hand 2D:4D Digit Ratio; SAD-to-Waist Ratio = Sagittal Abdominal Diameter-to-Waist Circumference Ratio; BSA = Body Surface Area; WWI = Weight-Adjusted Waist Index; PSQ = Perceived Stress Questionnaire. Values in the upper triangle (top-right) represent Pearson correlation coefficients (r) for men (n = 199). Values in the lower triangle (bottom-left) represent Pearson correlation coefficients (r) for women (n = 246). * Correlation is significant at the p < .05 level (2-tailed). ** Correlation is significant at the p < .01 level (2-tailed).
Table 4.
Multilinear regression equation for predictive purposes based on academic program (criterion: AVI).
Table 4.
Multilinear regression equation for predictive purposes based on academic program (criterion: AVI).
| Sex | R | R2 | F | df | p |
| Male | .993 | .986 | 2257.066 | 6 | < .001 |
| Female | .663 | .440 | 31.311 | 6 | < .001 |
Note: Dependent Variable: AVI; Predictors: BMI, R-2D:4D, SAD-to-Waist Ratio, BSA, WWI, PSQ.
Table 5.
Global multiple linear regression models for predicting the Adiposity Volume Index (AVI) based on sex.
Table 5.
Global multiple linear regression models for predicting the Adiposity Volume Index (AVI) based on sex.
| Sex | Predictor / Variable | Unstandardized Coefficients | Standardized Coefficients | t | p | |
| B | Std. Err. | β | ||||
| Male | Constant | -41.766 | 1.485 | — | -28.118 | < .001 |
| BMI | .318 | .014 | .347 | 22.627 | < .001 | |
| R-2D:4D | .032 | .083 | .003 | .384 | .701 | |
| SAD-to-Waist Ratio | 5.335 | 2.090 | .024 | 2.553 | .011 | |
| BSA | 9.663 | .311 | .393 | 31.110 | < .001 | |
| WWI | 2.942 | .082 | .411 | 35.924 | < .001 | |
| PSQ | -.010 | .008 | -.010 | -1.189 | .236 | |
| Female | Constant | 1.363 | 12.169 | — | .112 | .911 |
| BMI | .401 | .114 | .362 | 3.520 | .001 | |
| R-2D:4D | -23.237 | 11.413 | -.112 | -2.036 | .043 | |
| SAD-to-Waist Ratio | .542 | .627 | .041 | .865 | .388 | |
| BSA | 7.417 | 2.975 | .228 | 2.493 | .013 | |
| WWI | 1.574 | .345 | .251 | 4.562 | < .001 | |
| PSQ | .012 | .014 | .040 | .857 | .395 | |
Note: BMI = Body Mass Index; R-2D:4D = Right Hand 2D:4D Ratio; SAD-to-Waist Ratio = Sagittal Abdominal Diameter to Waist Circumference Ratio; BSA = Body Surface Area; WWI = Weight-Adjusted Waist Index; PSQ = Perceived Stress Questionnaire.
Table 6.
Multiple linear regression models for predicting the AVI index, stratified by sex and academic program.
Table 6.
Multiple linear regression models for predicting the AVI index, stratified by sex and academic program.
| Sex | Academic program | Predictor/ Variable | Unstandardized Coefficients | Standardized Coefficients | t | p | |
| B | Std. Err. | β | |||||
| Male | BS R2 = .989, p < .001 |
Constant | -46.909 | 3.340 | - | -14.043 | < .001 |
| BMI | .253 | .030 | .277 | 8.508 | < .001 | ||
| SAD-to-Waist Ratio | 11.067 | 4.988 | .051 | 2.219 | .034 | ||
| BSA | 11.844 | .674 | .475 | 17.575 | < .001 | ||
| WWI | 3.056 | .164 | 0.449 | 18.672 | < .001 | ||
| PSQ | -.020 | .007 | -.059 | -2.901 | .007 | ||
| CSE R2 = .986, p < .001 |
Constant | -42.525 | 2.365 | - | -17.982 | < .001 | |
| BMI | .323 | .021 | .360 | 15.369 | < .001 | ||
| BSA | 9.702 | .485 | .408 | 19.985 | < .001 | ||
| WWI | 2.943 | .120 | .391 | 24.437 | < .001 | ||
| SSP R2 = .988, p < .001 |
Constant | -40.410 | 2.475 | - | -16.328 | < .001 | |
| BMI | .332 | .027 | .345 | 12.371 | < .001 | ||
| SAD-to-Waist Ratio | 9.969 | 3.293 | .051 | 3.027 | .004 | ||
| BSA | 8.925 | .532 | .353 | 16.769 | < .001 | ||
| WWI | 2.877 | .149 | .430 | 19.344 | < .001 | ||
| Female | BS R2 = .296, p < .001 |
Constant | 26.719 | 26.962 | - | .991 | .324 |
| WWI | 1.420 | .617 | .218 | 2.303 | .023 | ||
| Note: Both BMI (p = .093) and R-2D:4D (p = .056) did not reach the significance threshold | |||||||
| CSE R2 = .976, p < .001 |
Constant | -40.493 | 4.819 | - | -8.403 | < .001 | |
| BMI | .205 | .041 | .246 | 4.980 | < .001 | ||
| BSA | 10.372 | .970 | .461 | 10.695 | < .001 | ||
| WWI | 2.699 | .143 | .522 | 18.903 | < .001 | ||
| SSP R2 = .991, p < .001 |
Constant | -27.794 | 1.879 | - | -14.789 | < .001 | |
| BMI | .313 | .021 | .406 | 14.624 | < .001 | ||
| BSA | 7.886 | .441 | .388 | 17.868 | < .001 | ||
| WWI | 2.240 | .082 | .384 | 27.449 | < .001 | ||
Note: BS = Biomedical Sciences; CSE = Computer Science and Engineering; SSP = Social Sciences and Physiotherapy; BMI = Body Mass Index; R-2D:4D = Right Hand 2D:4D Digit Ratio; SAD-to-Waist Ratio = Sagittal Abdominal Diameter-to-Waist Circumference Ratio; BSA = Body Surface Area; WWI = Weight-Adjusted Waist Index; PSQ = Perceived Stress Questionnaire. For conciseness, only predictors that reached the statistical significance threshold within each sub-model (p < .05) or displayed major trends are presented.
Table 7.
Multiple linear regression models for predicting the AVI index, stratified by sex and the presence of psychological stress.
Table 7.
Multiple linear regression models for predicting the AVI index, stratified by sex and the presence of psychological stress.
| Sex | Stress Status | Predictor / Variable | Unstandardized Coefficients | Standardized Coefficients | t | p | |
| B | Std. Err. | β | |||||
| Male | LLS (.00 score) (R² = .987, p < .001) |
BMI | .343 | .018 | .378 | 19.043 | < .001 |
| BSA | 9.574 | .404 | .390 | 23.701 | < .001 | ||
| WWI | 2.716 | .118 | .356 | 23.003 | < .001 | ||
| HLS (1.00 score) (R² = .986, p < .001) |
BMI | .284 | .023 | .305 | 12.596 | < .001 | |
| BSA | 9.951 | .484 | .403 | 20.581 | < .001 | ||
| WWI | 3.156 | .114 | .482 | 27.760 | < .001 | ||
| Female | LLS (.00 score) (R² = .883, p < .001) |
BMI | .484 | .048 | .645 | 9.990 | < .001 |
| BSA | 5.046 | 1.185 | .249 | 4.258 | < .001 | ||
| WWI | .564 | .115 | .187 | 4.898 | < .001 | ||
| HLS (1.00 score) R2 = .976, p < .001 |
SAD-to-Waist Ratio | -45.463 | 18.547 | -.186 | -2.451 | .015 | |
| BSA | 10.906 | 5.206 | .290 | 2.095 | .038 | ||
| WWI | 3.871 | .770 | .396 | 5.029 | < .001 | ||
Note: LLS (.00 score) = Low Level of Stress; HLS (1.00 score) = High Level of Stress; BMI = Body Mass Index; R-2D:4D = Right Hand 2D:4D Digit Ratio; SAD-to-Waist Ratio = Sagittal Abdominal Diameter-to-Waist Circumference Ratio; BSA = Body Surface Area; WWI = Weight-Adjusted Waist Index. The criterion (dependent variable) is AVI. For conciseness, only predictors that reached the statistical significance threshold within each stratified subgroup (p < .05) are presented.
Table 8.
Multiple linear regression models for predicting the AVI index, stratified three-dimensionally by sex, academic program, and stress status.
Table 8.
Multiple linear regression models for predicting the AVI index, stratified three-dimensionally by sex, academic program, and stress status.
| Sex | Academic program | Stress Status |
Predictor / Variable | Unstandardized Coefficients | Standardized Coefficients | t | p | |
| B | Std. Err. |
β | ||||||
| Male | BS | LLS (.00 score) R2 = .989 |
BMI | .224 | .039 | .256 | 5.697 | < .001 |
| SAD-to-Waist Ratio | 15.303 | 7.146 | .060 | 2.141 | .047 | |||
| BSA | 13.441 | 1.026 | .490 | 13.102 | < .001 | |||
| WWI | 2.908 | .232 | .394 | 12.553 | < .001 | |||
| HLS (1.00 score) R2 = .986 |
BMI | .291 | .042 | .273 | 6.894 | < .001 | ||
| BSA | 9.462 | .708 | .460 | 13.369 | < .001 | |||
| WWI | 3.283 | .185 | .570 | 17.741 | < .001 | |||
| CSE | LLS (.00 score) R2 = .986 |
BMI | .359 | .024 | .388 | 14.995 | < .001 | |
| BSA | 9.513 | .549 | .404 | 17.339 | < .001 | |||
| WWI | 2.739 | .153 | .332 | 17.931 | < .001 | |||
| HLS (1.00 score) R2 = .978 |
BMI | .283 | .037 | .329 | 7.621 | < .001 | ||
| BSA | 10.012 | .889 | .414 | 11.262 | < .001 | |||
| WWI | 3.113 | .193 | .465 | 16.106 | < .001 | |||
| SSP | LLS (.00 score) R2 = .988 |
BMI | .352 | .035 | .394 | 10.046 | < .001 | |
| BSA | 8.450 | .686 | .353 | 12.310 | < .001 | |||
| WWI | 2.648 | .233 | .383 | 11.372 | < .001 | |||
| HLS (1.00 score) R2 = .988 |
BMI | .326 | .045 | .305 | 7.238 | < .001 | ||
| BSA | 10.046 | .889 | .470 | 11.296 | < .001 | |||
| WWI | 3.083 | .186 | .470 | 16.553 | < .001 | |||
| Female | BS | LLS (.00 score) R2 = .908 |
BMI | .299 | .086 | .400 | 3.485 | .001 |
| R-2D:4D | 25.603 | 8.970 | .184 | 2.854 | .007 | |||
| BSA | 7.959 | 2.141 | .360 | 3.718 | .001 | |||
| HLS (1.00 score) R2 = .313 |
R-2D:4D | -87.780 | 36.264 | -.304 | -2.421 | .019 | ||
| WWI | 5.378 | 1.636 | .428 | 3.288 | .002 | |||
| CSE | LLS (.00 score) R2 = .988 |
BMI | .255 | .042 | .368 | 6.093 | < .001 | |
| BSA | 8.402 | .981 | .457 | 8.567 | < .001 | |||
| WWI | 2.104 | 162 | .392 | 12.969 | < .001 | |||
| HLS (1.00 score) R2 = .978 |
BMI | .157 | .059 | .169 | 2.657 | .013 | ||
| BSA | 12.177 | 1.390 | .481 | 8.762 | < .001 | |||
| WWI | 2.862 | .198 | .544 | 14.464 | < .001 | |||
| SSP | LLS (.00 score) R2 = .989 |
BMI | .345 | .035 | .399 | 9.974 | < .001 | |
| BSA | 6.865 | .552 | .374 | 12.432 | < .001 | |||
| WWI | 2.068 | .123 | .518 | 16.824 | < .001 | |||
| HLS (1.00 score) R2 = .993 |
BMI | .282 | .031 | .370 | 8.988 | < .001 | ||
| BSA | 8.802 | .736 | .424 | 11.957 | < .001 | |||
| WWI | 2.150 | .080 | .380 | 26.875 | < .001 | |||
Note: BS = Biomedical Sciences; CSE = Computer Science and Engineering; SSP = Social Sciences and Physiotherapy; BMI = Body Mass Index; R-2D:4D = Right Hand 2D:4D Digit Ratio; SAD-to-Waist Ratio = Sagittal Abdominal Diameter-to-Waist Circumference Ratio; BSA = Body Surface Area; WWI = Weight-Adjusted Waist Index; LLS (.00 score) = Low Level of Stress; HLS (1.00 score) = High Level of Stress. The model is simultaneously stratified across three levels. To maintain clarity, only predictors with statistical significance within each subgroup (p < .05) are presented. All global models were highly significant at the p < .001 threshold.
Table 9.
Discriminatory capacity and optimal cut-off thresholds of anthropometric and psychological predictors in identifying elevated adiposity volume (AVI above the median).
Table 9.
Discriminatory capacity and optimal cut-off thresholds of anthropometric and psychological predictors in identifying elevated adiposity volume (AVI above the median).
| Sex | Predictors | AUC | 95% CI | p | Cut-off | Sensibility | Specificity | Youden index |
| Male | BMI | .942 | .912 – .971 | < .001 | 22.93 | 82.6% | 85.5% | .681 |
| BSA | .925 | .885 – .965 | < .001 | 1.89 | 82.6% | 90.9% | .735 | |
| WWI | .876 | .828 – .925 | < .001 | 9.69 | 77.1% | 81.8% | .589 | |
| R-2D:4D | .594 | .508 – .679 | .041 | .98 | 50.7% | 63.6% | .143 | |
| SAD-to-Waist Ratio | .560 | .474 – .647 | .188 | .25 | 65.3% | 43.6% | .089 | |
| PSQ | .458 | .366 – .549 | .356 | 65.50 | 34.0% | 61.8% | -.042 | |
| Female | BMI | .971 | .954 – .988 | < .001 | 23.64 | 93.7% | 85.6% | .793 |
| BSA | .953 | .928 – .978 | < .001 | 1.74 | 92.4% | 86.2% | .786 | |
| WWI | .876 | .830 – .922 | < .001 | 9.63 | 81.0% | 82.0% | .630 | |
| R-2D:4D | .737 | .666 – .807 | < .001 | 1.01 | 69.6% | 74.3% | .439 | |
| SAD-to-Waist Ratio | .677 | .605 – .750 | < .001 | .25 | 73.4% | 51.5% | .249 | |
| PSQ | .631 | .559 – .704 | .001 | 66.50 | 62.0% | 58.7% | .207 |
Note: BMI = Body Mass Index; R-2D:4D = Right Hand 2D:4D Digit Ratio; SAD-to-Waist Ratio = Sagittal Abdominal Diameter-to-Waist Circumference Ratio; BSA = Body Surface Area; WWI = Weight-Adjusted Waist Index; PSQ = Perceived Stress Questionnaire; NS = Statistically Non-Significant (p > .05). The binary criterion utilized is represented by the AVI variable binarized using the median split method.
Disclaimer/Publisher’s Note: The statements, opinions and data contained in all publications are solely those of the individual author(s) and contributor(s) and not of MDPI and/or the editor(s). MDPI and/or the editor(s) disclaim responsibility for any injury to people or property resulting from any ideas, methods, instructions or products referred to in the content. |
© 2026 by the authors. Licensee MDPI, Basel, Switzerland. This article is an open access article distributed under the terms and conditions of the Creative Commons Attribution (CC BY) license (http://creativecommons.org/licenses/by/4.0/).
Copyright: This open access article is published under a Creative Commons CC BY 4.0 license, which permit the free download, distribution, and reuse, provided that the author and preprint are cited in any reuse.


