

Submitted:
19 July 2026
Posted:
20 July 2026
You are already at the latest version
Abstract
Non-coding RNAs (ncRNAs) play important roles in various biological processes primarily via regulating gene expression at multiple levels. Nevertheless, compared to protein-coding genes, ncRNAs are relatively understudied, characterized by low expression, large variation, and more dynamic expression across different tissues and cell types, which creates unique challenges in differential expression (DE) analysis. We propose a new DE method specifically for ncRNAs based on a composite quantile regression model for count data, in which we combine multiple quantiles and select the best subset of quantiles that most differentiate the expression levels between conditions. The proposed method is flexible, robust and capable of capturing the typically low-count, multi-modal and wide-spread distribution of ncRNA count data. We showed in simulations that our method improved the detection power of ncRNAs while controlling the false positive rates as compared to existing DE tools especially when counts are low. Critical ncRNAs and biologically interpretable targeted pathways were identified when we further applied our method to a Smart-seq-total single-cell RNA-seq dataset and a human organ developmental RNA-seq dataset. An R package to implement CQRM and the codes for this study are publicly available: https://github.com/iamverywell/CQRM.
Keywords:
differential expression analysis
; non-coding RNA
; RNA-seq
; quantile regression
1. Introduction
Non-coding RNAs (ncRNAs) comprise a diverse class of RNA molecules that lack protein-coding potential but play essential roles in gene regulation and cellular function. These include long non-coding RNAs (lncRNAs), microRNAs (miRNAs), small nuclear RNAs (snRNAs) and circular RNAs (circRNAs), among others. Increasing evidence demonstrates that ncRNAs are involved in chromatin organization, transcriptional regulation, RNA processing, translation, and intercellular signaling, and contribute to numerous physiological and pathological processes across plants and animals [1,2,3,4,5]. Dysregulation of ncRNA expression has been implicated in a wide range of diseases, including cancer, neurodegenerative disorders, cardiovascular diseases, and psychiatric conditions, making ncRNAs attractive biomarkers and therapeutic targets [1,2,3,4,5].
Compared with coding genes, many ncRNAs exhibit lower expression levels, stronger tissue- and cell-type specificity, reduced evolutionary conservation, and greater expression heterogeneity [6,7]. These features suggest specialized regulatory functions but also create substantial analytical challenges for transcriptomic studies. The widespread adoption of bulk and single-cell RNA sequencing (scRNA-seq) technologies in recent decades has enabled transcriptome-wide profiling of ncRNA expression and stimulated growing interest in identifying differentially expressed (DE) ncRNAs associated with biological processes and disease phenotypes. However, DE analysis of ncRNAs is considerably more challenging than that of protein-coding genes, as many ncRNA species are characterized by low abundance, high sparsity, substantial biological variability, and multimodal expression distributions [8,9]. These characteristics are often biologically meaningful and may reflect heterogeneous transcriptional regulation, cell-state specificity, or context-dependent expression patterns. Consequently, DE analysis may manifest not only shifts in mean expression levels but also changes in variability, skewness, sparsity, or other distributional properties. Representative examples of such ncRNA expression distributions are shown in Figure S1.
For count data from RNA-seq or scRNA-seq, existing DE methods can be broadly classified into parametric count-based methods, nonparametric methods, and zero-inflation-adjusted methods (Table 1). Parametric methods such as edgeR [10] and DESeq2 [11] model gene expression counts using the negative binomial (NB) distribution and primarily focus on detecting differences in mean expression levels between conditions. Limma-voom [12] transforms count data and employs empirical Bayes moderated linear models to improve variance estimation and inference, particularly in small-sample settings. Although these methods have demonstrated excellent performance for mRNA analyses, the underlying assumptions may be violated for many ncRNAs whose expression distributions exhibit excessive zeros, heavy tails, or multimodality.
Nonparametric DE methods such as the Wilcoxon rank-sum test [13], SAMSeq [14], and NOISeq [15] relax distributional assumptions and often provide improved robustness in heterogeneous settings. The Wilcoxon test has been highlighted in recent comparative studies as a more robust approach for DE analysis with better false discovery rate (FDR) control and power performance [16]. However, rank-based methods generally focus on differences in central tendency and may have limited sensitivity when DE arises through more complex distributional changes in variability, skewness, sparsity, or multimodality. Previous benchmarking studies have reported that many conventional RNA-seq DE pipelines show reduced sensitivity and unstable FDR control for low-abundance transcripts, including lncRNAs and other ncRNAs [9]. For scRNA-seq data, several zero-inflated methods have been proposed, including zero-inflated negative binomial (ZINB) models [17] and a zero-inflated quantile regression model [18]. While these methods improve modeling of sparse expression data, they primarily focus on dropout mechanisms. Dedicated DE methods specifically designed for ncRNAs remain relatively limited. Existing methods such as lncDIFF [19] target count-transformed continuous data and have demonstrated improved performance for lowly expressed lncRNAs, but generally remain tied to specific distributional assumptions or particular ncRNA classes. Given the growing recognition of ncRNAs as critical regulators in health and disease, there remains a pressing need for flexible statistical frameworks capable of accommodating the diverse and heterogeneous expression patterns observed across ncRNA species.
In this paper, we propose a Composite Quantile Regression Model (CQRM) for DE analysis of ncRNA sequencing data. Unlike conventional DE methods that primarily target differences in mean expression, CQRM integrates information across multiple quantiles of the expression distribution, enabling the detection of a wider range of DE patterns. By avoiding restrictive parametric assumptions, CQRM remains robust to the heterogeneous, sparse, and often non-standard expression distributions commonly observed in ncRNAs. In addition, its regression-based framework naturally accommodates complex experimental designs and covariate adjustment. Although quantile regression has previously been applied to DE analysis, such as in ZIAQ for single-cell RNA-seq data [18], existing approaches typically evaluate differential expression at individual quantiles. In contrast, CQRM aggregates evidence across multiple combinations of quantiles to capture global distributional differences between conditions, providing a flexible and robust framework for DE analysis across diverse non-coding RNA species.
2. Method
We propose a composite quantile regression-based framework for differential expression (DE) analysis of ncRNA count data from RNA-seq or scRNA-seq experiments. The method first models the association between expression counts and covariates at individual quantiles using quantile regression with jittering to accommodate the discrete nature of count data. It then aggregates evidence across multiple quantiles through a composite testing procedure, enabling the detection of differential expression patterns that may occur throughout the expression distribution rather than at a single quantile or solely in the mean.
2.1. Modeling ncRNA Count Data Using Quantile Regression with Jittering
Denote by Y the matrix of count data from RNA-seq or scRNA-seq where indicates the count value for gth ncRNA () in sample or cell i (). Denote by X the matrix of covariates. In a typical DE analysis, we are interested in comparing the RNA expression profiles between a case and a control group. Without loss of generality, we assume one covariate (), where when a sample is from the case group (e.g. cancer patients) and when a sample is from the control group (e.g. normal controls). Standard quantile regression (QR) assumes a continuous response variable. Directly applying QR to count data is challenging because the discreteness of the response leads to non-smoothness and non-standard asymptotic behavior of the conditional quantile estimator [20]. To address this issue, Machado and Santos Silva [21] proposed adding independent uniform noise to the count outcome, a procedure commonly referred to as jittering [22]. Specifically, let denote the uniform random variable independent of , and define the jittered response . The resulting variable is continuous, and its conditional quantiles have a one-to-one relationship with those of the original count variable under the jittering construction. After applying a monotonic transformation to the jittered count variable if and otherwise, where is a suitably small positive number, the conditional quantile function of the transformed response can be modeled using quantile regression as:
where denotes the conditional -th quantile of given covariates , is the quantile-specific intercept, and is the vector of quantile-specific regression coefficients. The transformation we employed here is the same as in Machado and Santos Silva [21], which works as a reasonable approximation in many situations [21].
The coefficient estimates for any fixed can be obtained by
where .
To decrease the estimate’s dependence on the random draw of , we averaged the QR estimates from M repeatedly and independently “jittered” samples and used the “average-jittering” estimator as our final estimate:
where is the estimate derived from m-th jitter sample. The “average-jittering” estimator is more efficient than the estimate obtained with a single sample. Following Machado and Santos Silva [21], we also showed the asymptotic behavior of (see Appendix A).
Similarly, we derived and as:
2.2. Composite Quantile Regression for Differential Expression Testing
A key limitation of existing QR-based differential expression methods is that inference is typically conducted at a single quantile level. Such approaches are most sensitive to differential expression occurring at that particular portion of the distribution, but may lose power when expression differences are distributed across multiple quantiles or when the affected quantiles vary across ncRNA species. Given the heterogeneous and often multimodal expression distributions observed in ncRNA sequencing data, differential expression may manifest through changes in location, variability, sparsity, or other distributional characteristics. Motivated by this observation, we propose a composite QR framework that aggregates evidence across multiple quantiles to capture a broader spectrum of DE patterns.
For a fixed quantile level , inference can be performed using a score test. Compared with asymptotic Wald-type inference, score tests avoid estimation of the conditional density function and generally exhibit improved finite-sample performance, particularly at extreme quantiles [23]. In contrast to bootstrap-based procedures, score tests are also computationally efficient, making them well suited for large-scale RNA-seq studies involving thousands of ncRNAs. For the quantile regression model introduced in Section 2.1, the hypothesis of interest at quantile (without loss of generality, we will drop subscript g from here on) is
The corresponding score statistic is
where is the quantile score function, denotes the estimated intercept under the null, and is the ith element of the residualized covariate vector . Specifically, , where is the projection matrix onto the space spanned by the intercept. Thus, under the one-covariate setting, is an vector representing the covariate after removing its projection onto the intercept space. measures the association between the transformed expression and X at the -th conditional quantile, i.e., after removing the collinearity between X and the intercept via . Rather than testing each quantile separately, our goal is to assess differential expression across multiple quantiles simultaneously. Let denote a prespecified set of quantile levels and let denote a specific non-empty subset of , with up to possible subsets. The choice of quantiles involves a trade-off between capturing stronger signals and introducing additional noise. In practice, a tuning procedure is recommended to determine an appropriate set of quantiles that balances statistical power and Type I error control. In this study, we use the 0.2, 0.4, 0.6, and 0.8 quantiles for all CQRM-based methods. For any non-empty subset w, let denote the corresponding quantile vector of size h, and define the vector of rank-score statistics as . We can then conduct a composite score test aggregating information across these quantiles. Under the null, follows an asymptotically multivariate normal distribution:
where is the covariance matrix whose -th element is
In particular, when , this reduces to the diagonal elements
whereas when , the off-diagonal elements are
The composite rank score test statistic is then constructed based on :
which is shown to asymptotically follow a distribution with degrees of freedom equal to h under the null hypothesis. This statistic jointly evaluates differential expression across all quantiles contained in the combination and therefore captures a wider range of distributional changes than single-quantile tests.
To adaptively identify the most informative quantile combination for each ncRNA, we evaluate all non-empty quantile combinations and compute the corresponding p-values . We then employ a minimum-p-value (minP) procedure [24] and treat the quantile combination with the minimum p-value as the one reflecting the significance of the coefficient in the hypothesis test for differential expression, i.e. .
Since the minimum p-value MinP is obtained by searching across multiple quantile combinations, it does not follow a uniform distribution under the null hypothesis. A straightforward approach is to estimate its null distribution using permutation. However, such a procedure is computationally prohibitive for large-scale RNA-seq studies because the quantile regression model must be repeatedly refitted for every gene and every permutation.
To improve computational efficiency, we developed an approximate inference procedure (CQRM-Approx) that avoids gene-level permutations by directly approximating the null distribution of the MinP statistic. Under the null hypothesis, the composite score vector asymptotically follows a multivariate normal distribution (), where is estimated from the sample covariance matrix and is shared across genes. We first generate B independent realizations from this null distribution. For each realization, p-values are computed for all candidate quantile combinations using the corresponding covariance submatrices. Then we record the minimum p-value among all quantile combinations with the same degree of freedom as , denoted by . Repeating this procedure across all B realizations yields an empirical null distribution of the MinP statistic corresponding to the same degree of freedom as .
For a given gene, the final adjusted p-value is computed as: , which represents the proportion of null MinP statistics that are at least as significant as the observed MinP statistic. By generating the null distribution directly from the asymptotic score distribution, CQRM-Approx eliminates the need for repeated permutation and model refitting while substantially reducing computational cost. Theoretical complexity analysis (Table S1) and empirical runtime benchmarking (Figure S2, Table S2) demonstrate that CQRM-Approx achieves considerable computational savings relative to the permutation-based implementation with minimal loss of accuracy.
Unlike conventional differential expression methods that primarily target mean shifts, the proposed CQRM method aggregates evidence across multiple quantiles and adaptively identifies the quantile combination that best characterizes differential expression. As a result, CQRM is capable of detecting a broader range of distributional changes, including shifts affecting only the lower or upper tails, heterogeneous expression variability, and multimodal expression patterns commonly observed in ncRNA sequencing studies. To investigate alternative patterns of differential expression, we also developed two related procedures: CQRM-Region and CQRM-Best. CQRM-Region restricts the candidate quantile combinations to contiguous quantile intervals, thereby favoring differential expression signals that extend smoothly across neighboring portions of the expression distribution. In contrast, CQRM-Best considers all individual quantiles and selects the most significant quantile-specific test. Next, we evaluate the performance of the proposed CQRM variants and compare them with existing state-of-the-art DE methods using semi-synthetic data simulations.
3. Results
3.1. Simulation
3.1.1. Simulation Settings
We conducted semi-synthetic simulations based on the kidney renal clear cell carcinoma (KIRC) RNA-seq dataset from The Cancer Genome Atlas (TCGA) [25]. The dataset contains expression measurements for 20,531 genes across 72 paired tumor and adjacent normal tissue samples. Using a real RNA-seq dataset allows the simulations to preserve realistic count distributions, mean–variance relationships, sparsity patterns, and other sources of biological and technical variation commonly observed in ncRNA sequencing studies.
Genes with zero counts in more than 60% of samples were first removed. To construct a set of putative true differentially expressed genes (DEGs), we applied three representative DE methods from different methodological classes: DESeq2 (negative-binomial based), Wilcoxon rank-sum test (nonparametric), and CQRM (quantile-regression based). Genes identified as significant by all three methods at a highly stringent false discovery rate (FDR) threshold of were designated as true DEGs. The remaining genes were treated as non-DE genes. A semi-synthetic dataset was then generated by preserving the original counts of the true DEGs while randomly permuting sample labels for the non-DE genes between the tumor and normal groups. This strategy preserves realistic expression distributions while establishing a known ground truth for performance evaluation. To better mimic the heterogeneous and noisy expression characteristics frequently observed in ncRNAs, genes with expression variance below the 10th percentile were excluded from subsequent analyses.
Two factors were considered in the simulation:
- (i)
- Expression level (low vs. moderate counts). To investigate performance under different count regimes, genes were stratified according to their mean expression levels. Genes with mean counts below the 20th percentile were classified as the low-count group, representing the sparse and low-abundance expression patterns commonly observed in ncRNAs. Genes with mean counts between the 20th and 50th percentiles were classified as the moderate-count group.
- (ii)
- Signal strength (weak to strong): True DEGs were further categorized into three groups of equal size according to increasingly stringent significance thresholds, representing weak, moderate, and strong signals, respectively.
For each simulation replicate, a dataset containing 2,000 genes was generated, with 40% designated as true DEGs and 60% as non-DE genes. A relatively high DEG proportion (40%) was chosen to reflect transcriptome-wide perturbations commonly observed in cancer studies and to ensure stable evaluation across a broad range of signal strengths. Each group (tumor and normal) contained 50 samples subsampled from the original data. Results are based on 50 simulation replicates. We compared nine DE methods: DESeq2, edgeR, limma-voom, Wilcoxon rank-sum test, NOISeq, ZIAQ, CQRM, CQRM-Best, and CQRM-Region. We evaluated both detection power and false discovery rate (FDR) control. Detection power was assessed as the proportion of true DE genes among the top-ranked genes identified by each method. To evaluate error control, we computed the empirical FDR among genes declared significant at nominal FDR thresholds of 0.1, 0.05, 0.01, and 0.001. All results were summarized over 50 independent simulation replicates.
3.1.2. Simulation Results
The simulation results are summarized in Figure 1 and Figure 2. In the low-count setting (Figure 1(d)–(f)), the negative-binomial-based methods DESeq2 and edgeR exhibit substantial FDR inflation, particularly at moderate and large nominal FDR thresholds. Although both methods are highly sensitive and frequently rank among the most powerful approaches, this gain in power comes at the expense of reduced error control. As signal strength decreases, the FDR inflation becomes less pronounced, although both methods remain above the nominal level in most low-count scenarios. In contrast, NOISeq consistently exhibits conservative FDR control across all settings, with empirical FDR well below the nominal thresholds. This conservative behavior is accompanied by substantially lower power than competing methods, particularly under weak-signal conditions. Limma-voom generally maintains reasonable FDR control and is less sensitive to count sparsity than the negative-binomial-based approaches, although its power is typically lower than that of the leading methods. The Wilcoxon rank-sum test demonstrates strong power across nearly all scenarios and often performs comparably to the most powerful methods. However, under low-count settings it exhibits noticeable FDR inflation, particularly at weaker signal strength. ZIAQ demonstrates overall strong performance with both good FDR control and high power in low-count settings. However, its performance deteriorates under weak-signal scenarios, particularly in the moderate-count setting, where it exhibits a noticeable loss of power relative to CQRM methods.
Quantile regression-based methods generally achieve good power with well-controlled FDR, especially in low-count settings. Among them, CQRM consistently provides the best FDR calibration, with empirical FDR values generally closest to the nominal levels across a wide range of settings. CQRM-Best and CQRM-Region tend to be slightly more conservative, often yielding empirical FDR values below the target thresholds. Importantly, all three CQRM variants maintain competitive power while providing substantially improved error control relative to DESeq2, edgeR, and Wilcoxon in challenging low-count scenarios. In moderate-count data with very weak signals, CQRM-based methods demonstrate slightly underpowered behavior compared to DESeq2 and Wilcoxon, which may be because the data are closer to their assumptions in this setting. Another simulation with different sample sizes was conducted, and the power of all DE methods increased with sample size, as expected (Figure S3 and Figure S4).
Taken together, the results suggest that CQRM offers a robust compromise between statistical power and FDR control, particularly in low-count settings that resemble the expression characteristics of many ncRNAs. While DESeq2, edgeR, and Wilcoxon can achieve higher power in some scenarios, this advantage is often accompanied by substantial inflation of false discoveries. In contrast, CQRM maintains competitive sensitivity while providing more reliable error control across a broad range of count levels and signal strengths.
3.2. Case Study 1: DE Analysis of Different ncRNA Species Across Human Cell Lines
To evaluate the performance of CQRM on diverse non-coding RNA species, we analyzed the broad-spectrum RNA sequencing dataset GSE151334 generated using the scRNA-seq tool Smart-seq-total [26]. Unlike conventional RNA-seq protocols that primarily capture mRNAs, Smart-seq-total profiles the entire cellular RNA content, including mRNAs, lncRNAs, miRNAs, snoRNAs, snRNAs, and other non-coding RNA species. We analyzed the total RNAomes of human primary dermal fibroblasts, HEK293T cells (human embryonic kidney cell line), and MCF7 cells (human breast cancer cell line) from the original study. Cells with fewer than 2,000 detected genes or more than two million sequencing reads were excluded. RNAs lacking annotation were removed prior to analysis. Overall, expression levels are low in this dataset, with median counts for both ncRNA and total RNA close to zero and mean counts below 50. Pairwise differential expression analyses were then performed among fibroblasts, HEK293T, and MCF7 cells using edgeR, Wilcoxon, and CQRM. The ZIAQ method encountered errors on this dataset and was therefore excluded from the analysis.
The results are summarized in Figure 3 and Figure 4 (ncRNA includes lncRNAs, miRNAs, snoRNAs, snRNAs and other rare ncRNA species; all RNAs include both mRNAs and ncRNAs). Because the true DE status is unknown in real data, genes identified as significant (Benjamini-Hochberg adjusted ) by multiple methods can be regarded as higher-confidence DE candidates. Therefore, genes consistently detected across methods were used to assess the extent to which CQRM recovers robust DE signals. The Venn diagrams in Figure 3 compare the overlap among CQRM, edgeR, and Wilcoxon. Across all three pairwise cell line comparisons, CQRM shared a substantial proportion of DE genes with both edgeR and Wilcoxon, indicating its ability to recover strong and reproducible DE signals. CQRM also exhibits conservative behavior in DE analysis, with comparatively fewer uniquely detected genes than the other methods, consistent with the stable FDR control observed in simulation.
Inspection of the expression distributions further illustrates the advantage of CQRM. As shown in the box plots (Figure 4), the top 100 DEGs identified by CQRM tended to have lower average expression levels (mean counts) than those identified by edgeR and Wilcoxon for both ncRNAs and all RNAs, suggesting improved sensitivity for low-abundance transcripts commonly encountered among ncRNAs.
3.3. Case Study 2: DE Analysis of lncRNA During Human Organ Development
In the second example, we used CQRM to analyze a large-scale developmental transcriptome dataset spanning multiple organs and developmental stages [27]. Raw bulk RNA-seq count data spanning developmental stages of multiple human organs (brain, cerebellum, heart, kidney, liver, ovary, and testis) were obtained from LnExpDB (https://ngdc.cncb.ac.cn/lncexpdb/downloads; E-MTAB-6814). For the present analysis, only annotated lncRNAs were retained. LncRNAs with detectable expression in fewer than 20% of samples were excluded to reduce the influence of extremely sparse transcripts. Developmental stages were dichotomized into early and late developmental periods. Samples labeled as weeks post-conception or days post-birth were classified as early-stage, whereas samples labeled as years post-birth were classified as late-stage. Organs with insufficient sample sizes or highly imbalanced numbers of early- and late-stage samples (heart, kidney, liver, and ovary) were excluded from downstream analyses. Consequently, differential expression analyses were conducted for brain, cerebellum, and testis. DE analyses were carried out between early and late developmental stages for each organ using edgeR, Wilcoxon, ZIAQ and CQRM methods.
As shown in Figure 5, CQRM identified a large core set of lncRNAs shared with edgeR and Wilcoxon across all three organs. Consistent with the simulation studies and Case Study 1, the lncRNAs prioritized by CQRM tended to exhibit lower average expression levels than those identified by edgeR or Wilcoxon (Figure 6). To evaluate the functional relevance of the identified lncRNAs, we performed enrichment analysis for lncRNAs using the curated lncRNA resource NcPath [28], the result of which is included in supplementary Tables S3–S5.
Top signaling pathways targeted by lncRNAs detected by CQRM in the brain include those involved in neural metabolism and membrane formation (e.g. cholesterol metabolism, fat digestion and absorption, phosphatidylinositol signaling), stem-cell and developmental regulation (e.g., pluripotency signaling and autophagy) and neuroimmune regulation (e.g., cytokine signaling, Th1/Th2 differentiation), all of which have established roles in brain development and maturation [29,30,31]. For cerebellum, genes targeted by lncRNAs detected by CQRM were mainly enriched in pathways involved in neural circuit formation and cerebellar maturation (e.g. axon guidance, Rap1 signaling pathway, circadian rhythm). For testis, genes targeted by lncRNAs detected by CQRM were mainly enriched in pathways involved in endocrine and reproductive signaling (e.g. insulin secretion, thyroid hormone signaling pathway, oxytocin signaling pathway). Notably, these enriched pathways are highly relevant to the biological functions and developmental processes of their respective organs, supporting the ability of CQRM to identify biologically meaningful lncRNAs and their target genes. The distinct enrichment patterns observed across organs further highlight the tissue-specific regulatory roles of lncRNAs during development.
4. Discussion
In this paper, we developed CQRM, a composite quantile regression framework for DE analysis of ncRNA count data. Unlike conventional DE methods that primarily target differences in mean expression, CQRM aggregates information across multiple quantiles and detects a broader range of distributional changes, including shifts in variability, skewness, sparsity, and multimodality. These features are commonly observed across diverse ncRNA species and often reflect biologically meaningful regulatory processes. In semi-synthetic simulations generated based on the TCGA KIRC RNA-seq data, CQRM achieved competitive power while maintaining well controlled FDR across a range of count levels and signal strengths, especially in low-count settings. The two real-data applications further support the practical utility of CQRM. In both the broad-spectrum Smart-seq-total scRNA-seq dataset and the human organ developmental lncRNA sequencing dataset, CQRM demonstrated increased sensitivity for low-abundance ncRNAs while retaining the majority of consensus differential expression signals identified across methods. Moreover, for the organ developmental example, target genes of lncRNAs prioritized by CQRM are enriched in pathways highly related to the developmental process of specific organs, suggesting that the signals detected by CQRM are biologically meaningful rather than artifacts of increased false-positive findings.
To date, the majority of DE methods have been developed for protein-coding genes and rely on distributional assumptions that are often well suited to mRNA expression profiles. Although several recent studies have focused on identifying critical ncRNA regulators and reconstructing ncRNA-mediated regulatory networks [32,33,34], less efforts were made to develop DE methods specifically tailored to the unique characteristics of ncRNA sequencing data. Many ncRNAs exhibit low abundance, high sparsity, high biological variability, and heterogeneous or multimodal expression distributions [9,35]. Consequently, DE may arise through changes in multiple aspects of the expression distribution rather than solely through shifts in mean expression. CQRM addresses this gap by providing a flexible distribution-aware framework that aggregates evidence across multiple quantiles, which can improve statistical efficiency and robustness relative to single-quantile analyses, particularly under heterogeneous and non-Gaussian error distributions [36]. Although quantile regression has previously been applied for DE analysis in scRNA-seq data such as ZIAQ [18], CQRM captures a broader spectrum of DE patterns without relying on explicit zero-inflation assumptions thus shows particular advantages for ncRNA expression data.
The current framework analyzes each ncRNA independently and therefore does not explicitly leverage regulatory relationships, co-expression patterns, or pathway structure that may further improve power and biological interpretability. Future work will focus on integrating prior biological knowledge, gene regulatory networks, and multi-omics data within the composite quantile framework to better prioritize critical ncRNA markers and characterize ncRNA-mediated regulatory mechanisms. An R package implementing CQRM, together with codes required to reproduce the analyses presented in this study, are publicly available at: https://github.com/iamverywell/CQRM.
Supplementary Materials
The following supporting information can be downloaded at the website of this paper posted on Preprints.org.
Author Contributions
Conceptualization, Z.X. and T.M.; methodology, Z.X.; software, Z.X.; formal analysis, Z.X.; data curation, Z.X.; writing—original draft preparation, Z.X.; writing—review and editing, Z.X., R.P. and T.M.; visualization, Z.X.; supervision, T.M.; project administration, T.M. All authors have read and agreed to the published version of the manuscript.
Funding
Research reported in this publication was supported by the National Institute on Drug Abuse (NIDA) of the National Institutes of Health under award number 1K01DA059603-01A1, by the University of Maryland Grand Challenge Grant to TM and EPIB Pilot Award to TM.
Institutional Review Board Statement
Not applicable.
Informed Consent Statement
Not applicable.
Data Availability Statement
The CQRM R package is publicly available at https://github.com/iamverywell/CQRM. The scRNA-seq dataset used in Case Study 1 is publicly available at NCBI GEO under accession number GSE151334. The bulk RNA-seq dataset used in Case Study 2 is publicly available at LnExpDB (https://ngdc.cncb.ac.cn/lncexpdb/downloads; accession E-MTAB-6814).
Conflicts of Interest
The authors declare no conflicts of interest.
Appendix A
The asymptotic behavior of the average-jittering estimator defined in Equation (3) is as follows:
where
where , , and
and
As the repetition M goes to infinity, the limiting covariance will be [21].
References
- Bushati, N.; Cohen, S.M. microRNA functions. Annu. Rev. Cell Dev. Biol. 2007, 23, 175–205. [Google Scholar] [CrossRef] [PubMed]
- Matera, A.G.; Terns, R.M.; Terns, M.P. Non-coding RNAs: lessons from the small nuclear and small nucleolar RNAs. Nat. Rev. Mol. Cell Biol. 2007, 8, 209–220. [Google Scholar] [CrossRef] [PubMed]
- Salzman, J. Circular RNA expression: its potential regulation and function. Trends Genet. 2016, 32, 309–316. [Google Scholar] [CrossRef] [PubMed]
- Statello, L.; Guo, C.J.; Chen, L.L.; Huarte, M. Gene regulation by long non-coding RNAs and its biological functions. Nat. Rev. Mol. Cell Biol. 2021. [Google Scholar] [CrossRef] [PubMed]
- Mattick, J.S. RNA regulation: a new genetics? Nat. Rev. Genet. 2004, 5, 316–323. [Google Scholar] [CrossRef] [PubMed]
- Derrien, T.; Johnson, R.; Bussotti, G.; Tanzer, A.; Djebali, S.; Tilgner, H.; et al. The GENCODE v7 catalog of human long noncoding RNAs: analysis of their gene structure, evolution, and expression. Genome Res. 2012. [Google Scholar] [CrossRef] [PubMed]
- Kornienko, A.E.; Guenzl, P.M.; Barlow, D.P.; Pauler, F.M. Gene regulation by the act of long non-coding RNA transcription. BMC Biol. 2013, 11, 59. [Google Scholar] [CrossRef] [PubMed]
- Raithel, S.; Johnson, L.; Galliart, M.; Brown, S.; Shelton, J.; Herndon, N.; Bello, N.M. Inferential considerations for low-count RNA-seq transcripts: a case study on the dominant prairie grass Andropogon gerardii. BMC Genom. 2016, 17, 140. [Google Scholar] [CrossRef] [PubMed]
- Assefa, A.T.; De Paepe, K.; Everaert, C.; Mestdagh, P.; Thas, O.; Vandesompele, J. Differential gene expression analysis tools exhibit substandard performance for long non-coding RNA-sequencing data. Genome Biol. 2018, 19, 96. [Google Scholar] [CrossRef] [PubMed]
- Robinson, M.D.; McCarthy, D.J.; Smyth, G.K. edgeR: a Bioconductor package for differential expression analysis of digital gene expression data. Bioinformatics 2010, 26, 139–140. [Google Scholar] [CrossRef] [PubMed]
- Love, M.I.; Huber, W.; Anders, S. Moderated estimation of fold change and dispersion for RNA-seq data with DESeq2. Genome Biol. 2014, 15, 550. [Google Scholar] [CrossRef] [PubMed]
- Law, C.W.; Chen, Y.; Shi, W.; Smyth, G.K. voom: Precision weights unlock linear model analysis tools for RNA-seq read counts. Genome Biol. 2014, 15, R29. [Google Scholar] [CrossRef] [PubMed]
- Wilcoxon, F. Individual comparisons by ranking methods. Biom. Bull. 1945, 1, 80–83. [Google Scholar] [CrossRef]
- Li, J.; Tibshirani, R. Finding consistent patterns: a nonparametric approach for identifying differential expression in RNA-Seq data. Stat. Methods Med. Res. 2011, 22, 519–536. [Google Scholar] [CrossRef] [PubMed]
- Tarazona, S.; Furió-Tarí, P.; Turrà, D.; Di Pietro, A.; Nueda, M.J.; Ferrer, A.; Conesa, A. Data quality aware analysis of differential expression in RNA-seq with NOISeq R/Bioc package. Nucleic Acids Res. 2015, 43, e140. [Google Scholar] [PubMed]
- Li, Y.; Ge, X.; Peng, F.; Li, W.; Li, J.J. Exaggerated false positives by popular differential expression methods when analyzing human population samples. Genome Biol. 2022, 23, 79. [Google Scholar] [CrossRef] [PubMed]
- Risso, D.; Perraudeau, F.; Gribkova, S.; Dudoit, S.; Vert, J.P. A general and flexible method for signal extraction from single-cell RNA-seq data. Nat. Commun. 2018, 9, 284. [Google Scholar] [CrossRef] [PubMed]
- Zhang, W.; et al. Zero-inflated quantile regression for differential expression analysis in single-cell RNA-seq data. Bioinformatics 2020. [Google Scholar] [CrossRef] [PubMed]
- Li, Q.; Yu, X.; Chaudhary, R.; Slebos, R.J.C.; Chung, C.H.; Wang, X. lncDIFF: a novel quasi-likelihood method for differential expression analysis of non-coding RNA. BMC Genom. 2019, 20, 539. [Google Scholar] [CrossRef] [PubMed]
- Manski, C.F. Semiparametric Analysis of Discrete Response; Johns Hopkins University Press, 1985. [Google Scholar]
- Machado, J.A.F.; Santos Silva, J.M.C. Quantiles for counts. In Journal of the American Statistical Association; 2005. [Google Scholar]
- Stevens, W.L. Fiducial limits of the parameter of a discontinuous distribution. Biometrika 1950, 37, 117–129. [Google Scholar] [CrossRef]
- Kocherginsky, M.; et al. Quantile regression for count data. J. Stat. Plan. Inference 2012. [Google Scholar] [CrossRef] [PubMed]
- Loughin, T.M. A systematic comparison of methods for combining p-values from independent tests. Comput. Stat. Data Anal. 2004, 47, 467–485. [Google Scholar] [CrossRef]
- Ricketts, C.J.; De Cubas, A.A.; Fan, H.; Smith, C.C.; Lang, M.; Reznik, E.; et al. The Cancer Genome Atlas Comprehensive Molecular Characterization of Renal Cell Carcinoma. Cell Rep. 2018, 23, 313–326. [Google Scholar] [CrossRef] [PubMed]
- Isakova, A.; Neff, N.; Quake, S.R. Single-cell quantification of a broad RNA spectrum reveals unique noncoding patterns associated with cell types and states. Proc. Natl. Acad. Sci. 2021, 118, e2113568118. [Google Scholar] [CrossRef] [PubMed]
- Cardoso-Moreira, M.; Halbert, J.; Valloton, D.; Velten, B.; et al. Gene expression across mammalian organ development. Nature 2019, 571, 505–509. [Google Scholar] [CrossRef] [PubMed]
- Li, Z.; Zhang, Y.; Fang, J.; Xu, Z.; Zhang, H.; Mao, M.; Chen, Y.; Zhang, L.; Pian, C. NcPath: a novel platform for visualization and enrichment analysis of human non-coding RNA and KEGG signaling pathways. Bioinformatics 2023, 39, btac812. [Google Scholar] [CrossRef] [PubMed]
- Hussain, G.; Wang, J.; Rasul, A.; Anwar, H.; Imran, A.; Qasim, M.; Zafar, S.; Kamran, S.K.S.; Razzaq, A.; Aziz, N.; et al. Role of cholesterol and sphingolipids in brain development and neurological diseases. Lipids Health Dis. 2019, 18, 26. [Google Scholar] [CrossRef] [PubMed]
- Valencia, M.; Kim, S.R.; Jang, Y.; Lee, S.H. Neuronal autophagy: characteristic features and roles in neuronal pathophysiology. Biomol. Ther. 2021, 29, 605. [Google Scholar] [CrossRef] [PubMed]
- Deverman, B.E.; Patterson, P.H. Cytokines and CNS development. Neuron 2009, 64, 61–78. [Google Scholar] [CrossRef] [PubMed]
- Ke, H.; Ren, Z.; Qi, J.; Chen, S.; Tseng, G.C.; Ye, Z.; Ma, T. High-dimension to high-dimension screening for detecting genome-wide epigenetic and noncoding RNA regulators of gene expression. Bioinformatics 2022, 38, 4078–4087. [Google Scholar] [CrossRef] [PubMed]
- Ke, H.; Ma, T. NGP: A Tool to Detect Noncoding RNA-Gene Regulatory Pairs from Transcriptomic Data. In Cancer Bioinformatics; Springer, 2025; pp. 231–246. [Google Scholar]
- Ke, H.; Ye, Z.; Feng, L.; Xu, Z.; Pan, R.; Li, E.; Qi, J.; Chen, S.; Liang, M.; Ma, T. Inferring non-coding RNA regulatory network from transcriptomic data and curated databases. bioRxiv 2025, 2025–04. [Google Scholar]
- Korthauer, K.D.; Chu, L.F.; Newton, M.A.; Li, Y.; Thomson, J.; Stewart, R.; Kendziorski, C. A statistical approach for identifying differential distributions in single-cell RNA-seq experiments. Genome Biol. 2016, 17, 222. [Google Scholar] [CrossRef] [PubMed]
- Zou, H.; Yuan, M. Composite quantile regression and the oracle model selection theory. Ann. Stat. 2008. [Google Scholar] [CrossRef] [PubMed]
Figure 1.
Empirical FDR vs. nominal FDR curves for nine differential expression methods under moderate- and low-count settings. The empirical false discovery rate (FDP) is plotted against the nominal FDR threshold. The black dashed reference marks indicate the nominal level. Results are averaged over 50 simulation replicates, with variability shown as ±1 standard deviation. (a), (b), (c): results in the moderate-count scenario at the weakest, median, and strongest signal levels, respectively. (d), (e), (f): results in the low-count scenario at the weakest, median, and strongest signal levels, respectively.
Figure 1.
Empirical FDR vs. nominal FDR curves for nine differential expression methods under moderate- and low-count settings. The empirical false discovery rate (FDP) is plotted against the nominal FDR threshold. The black dashed reference marks indicate the nominal level. Results are averaged over 50 simulation replicates, with variability shown as ±1 standard deviation. (a), (b), (c): results in the moderate-count scenario at the weakest, median, and strongest signal levels, respectively. (d), (e), (f): results in the low-count scenario at the weakest, median, and strongest signal levels, respectively.
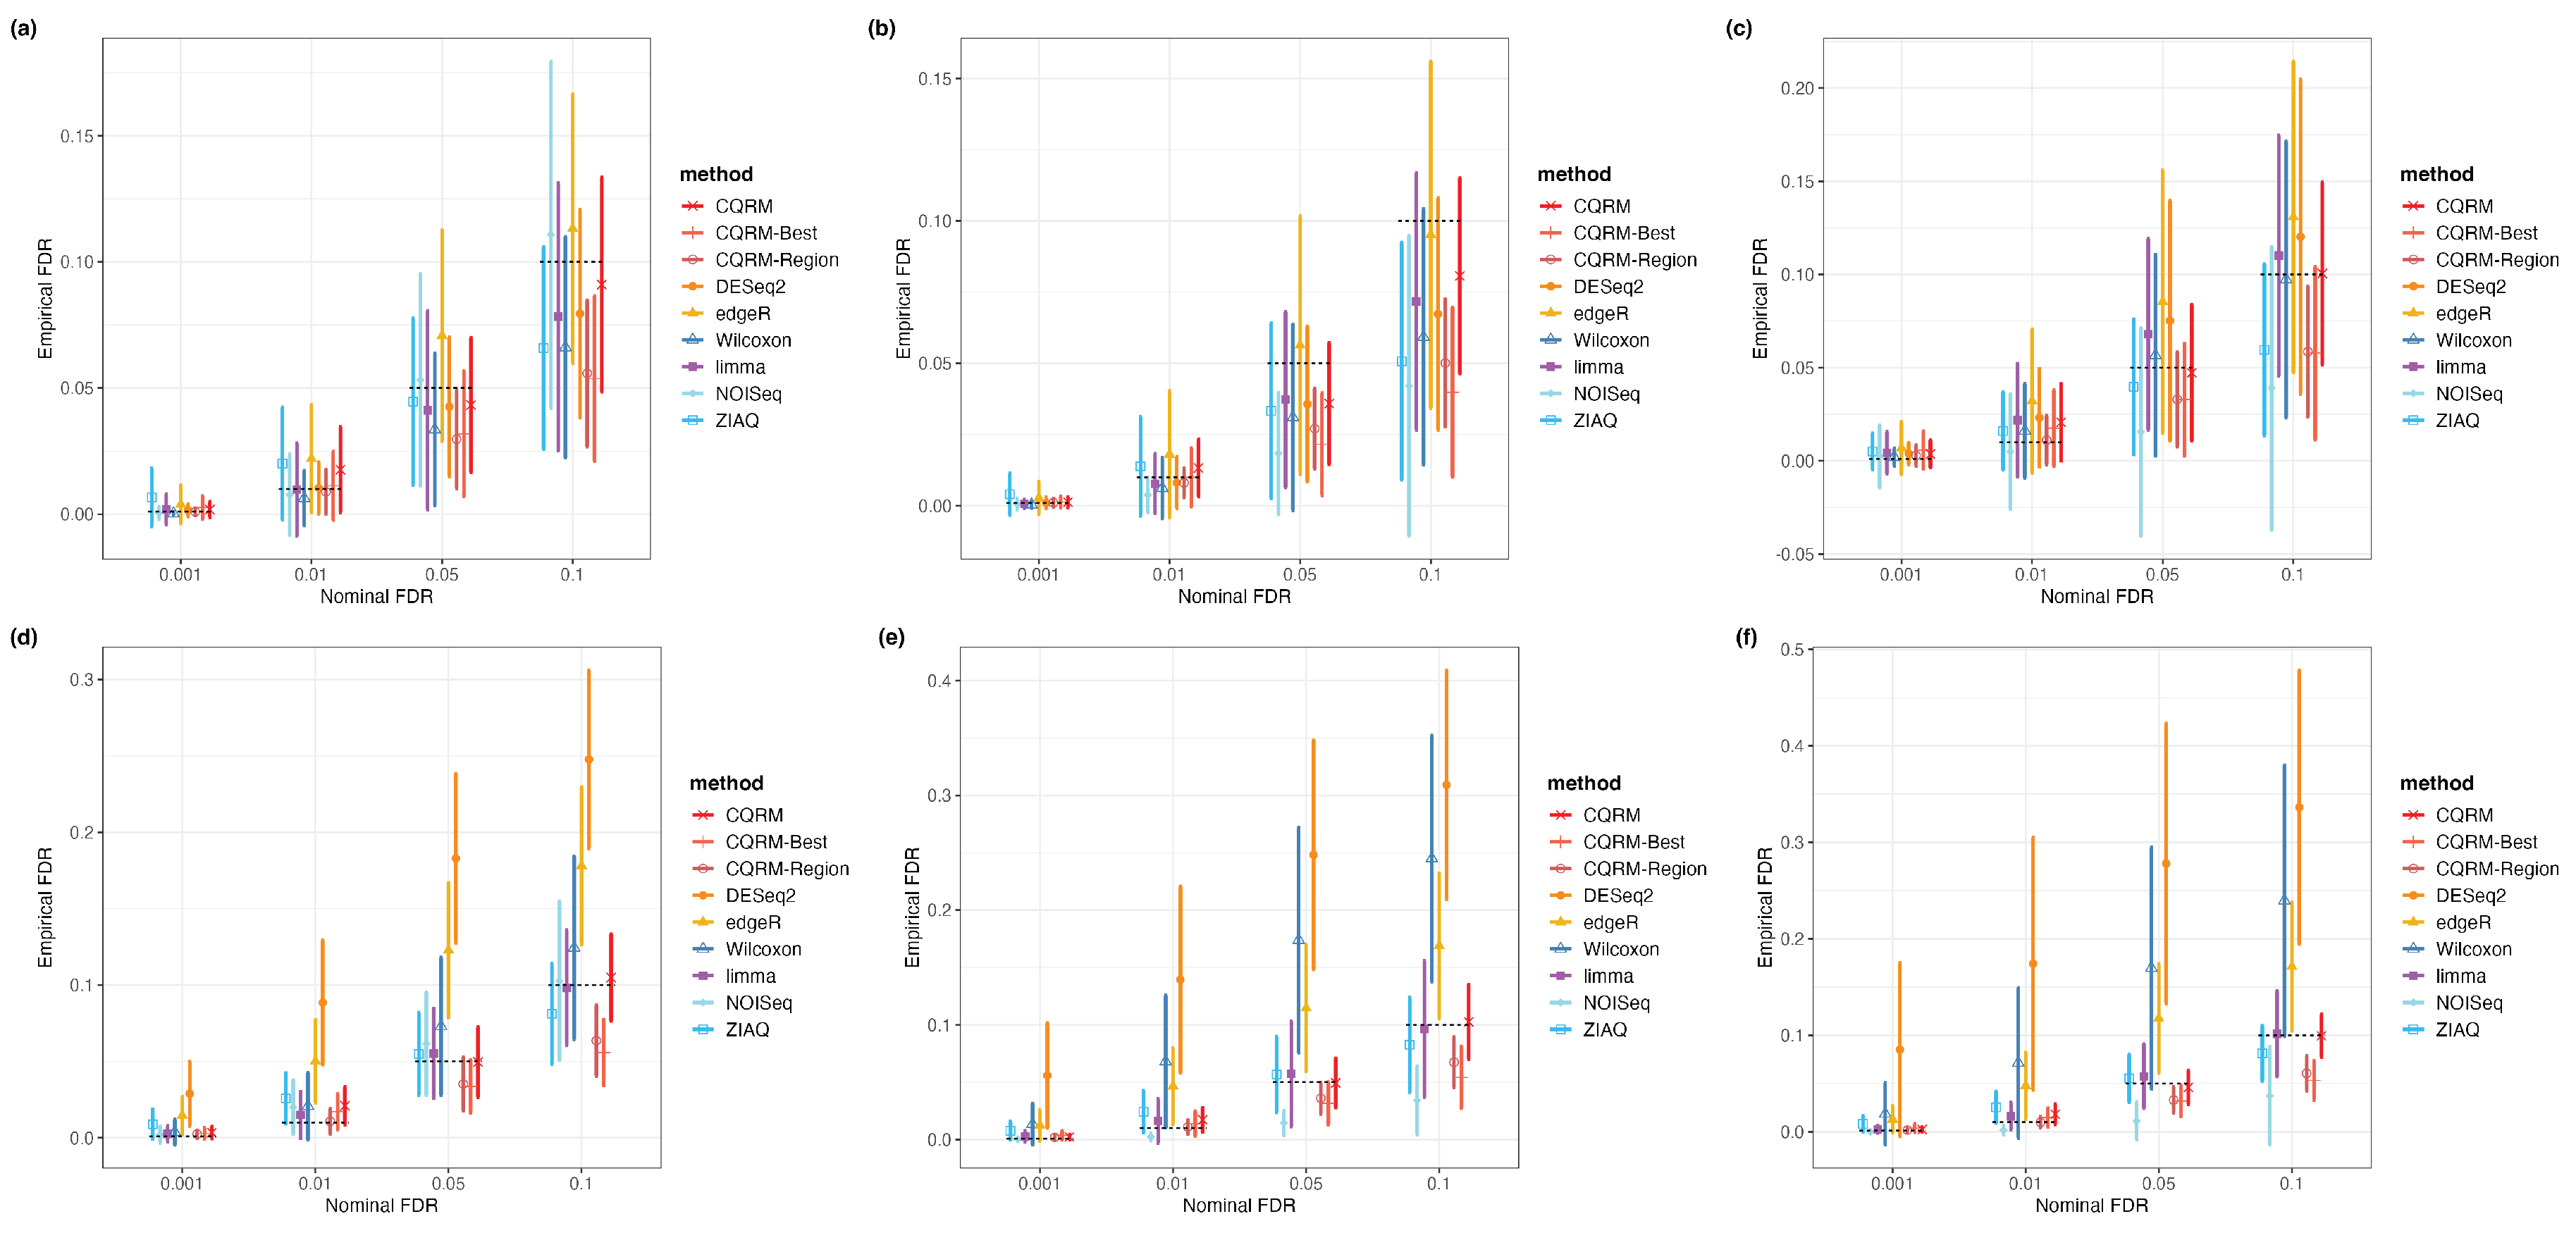
Figure 2.
Top-rank curves showing the proportion of true DE genes recovered by each method under moderate- and low-count settings. Genes are ranked by p-value from most to least significant; the cumulative proportion of true DE genes detected is shown across ranking intervals. (a), (b), (c): results in the moderate-count scenario at the weakest, median, and strongest signal levels, respectively. (d), (e), (f): results in the low-count scenario at the weakest, median, and strongest signal levels, respectively.
Figure 2.
Top-rank curves showing the proportion of true DE genes recovered by each method under moderate- and low-count settings. Genes are ranked by p-value from most to least significant; the cumulative proportion of true DE genes detected is shown across ranking intervals. (a), (b), (c): results in the moderate-count scenario at the weakest, median, and strongest signal levels, respectively. (d), (e), (f): results in the low-count scenario at the weakest, median, and strongest signal levels, respectively.
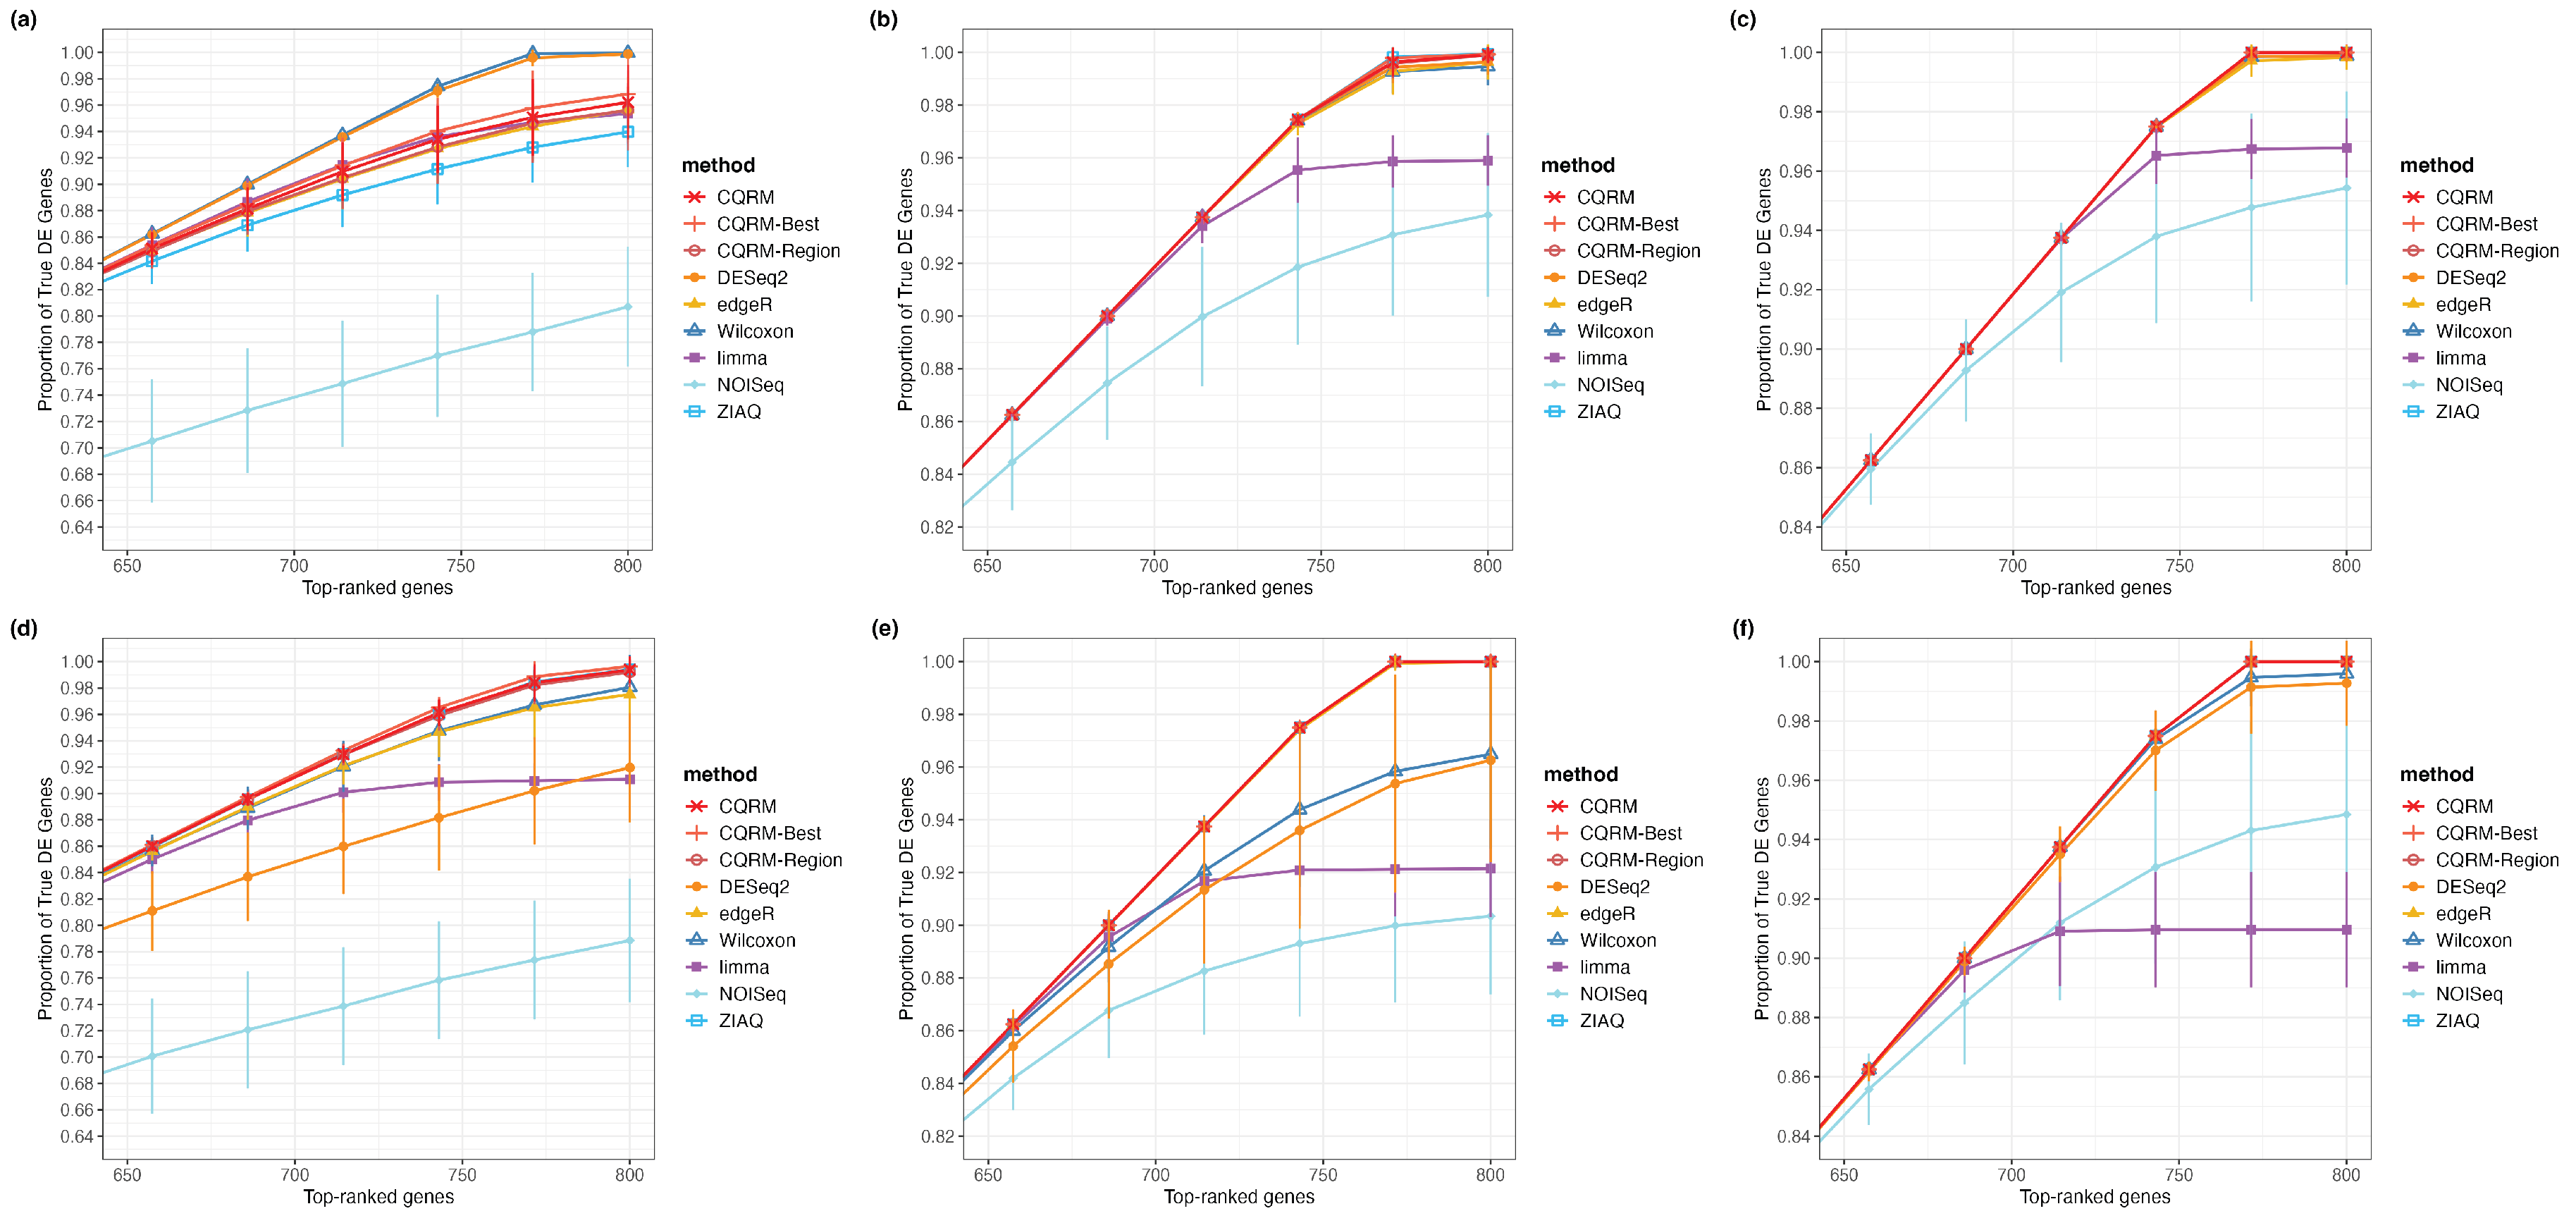
Figure 3.
Venn diagrams of DEGs detected by Wilcoxon, edgeR, and CQRM at FDR across three cell-line comparisons (fibroblast vs. HEK293T, fibroblast vs. MCF7, HEK293T vs. MCF7) for ncRNA and all RNAs. Rows correspond to RNA categories and columns to cell-line comparisons.
Figure 3.
Venn diagrams of DEGs detected by Wilcoxon, edgeR, and CQRM at FDR across three cell-line comparisons (fibroblast vs. HEK293T, fibroblast vs. MCF7, HEK293T vs. MCF7) for ncRNA and all RNAs. Rows correspond to RNA categories and columns to cell-line comparisons.
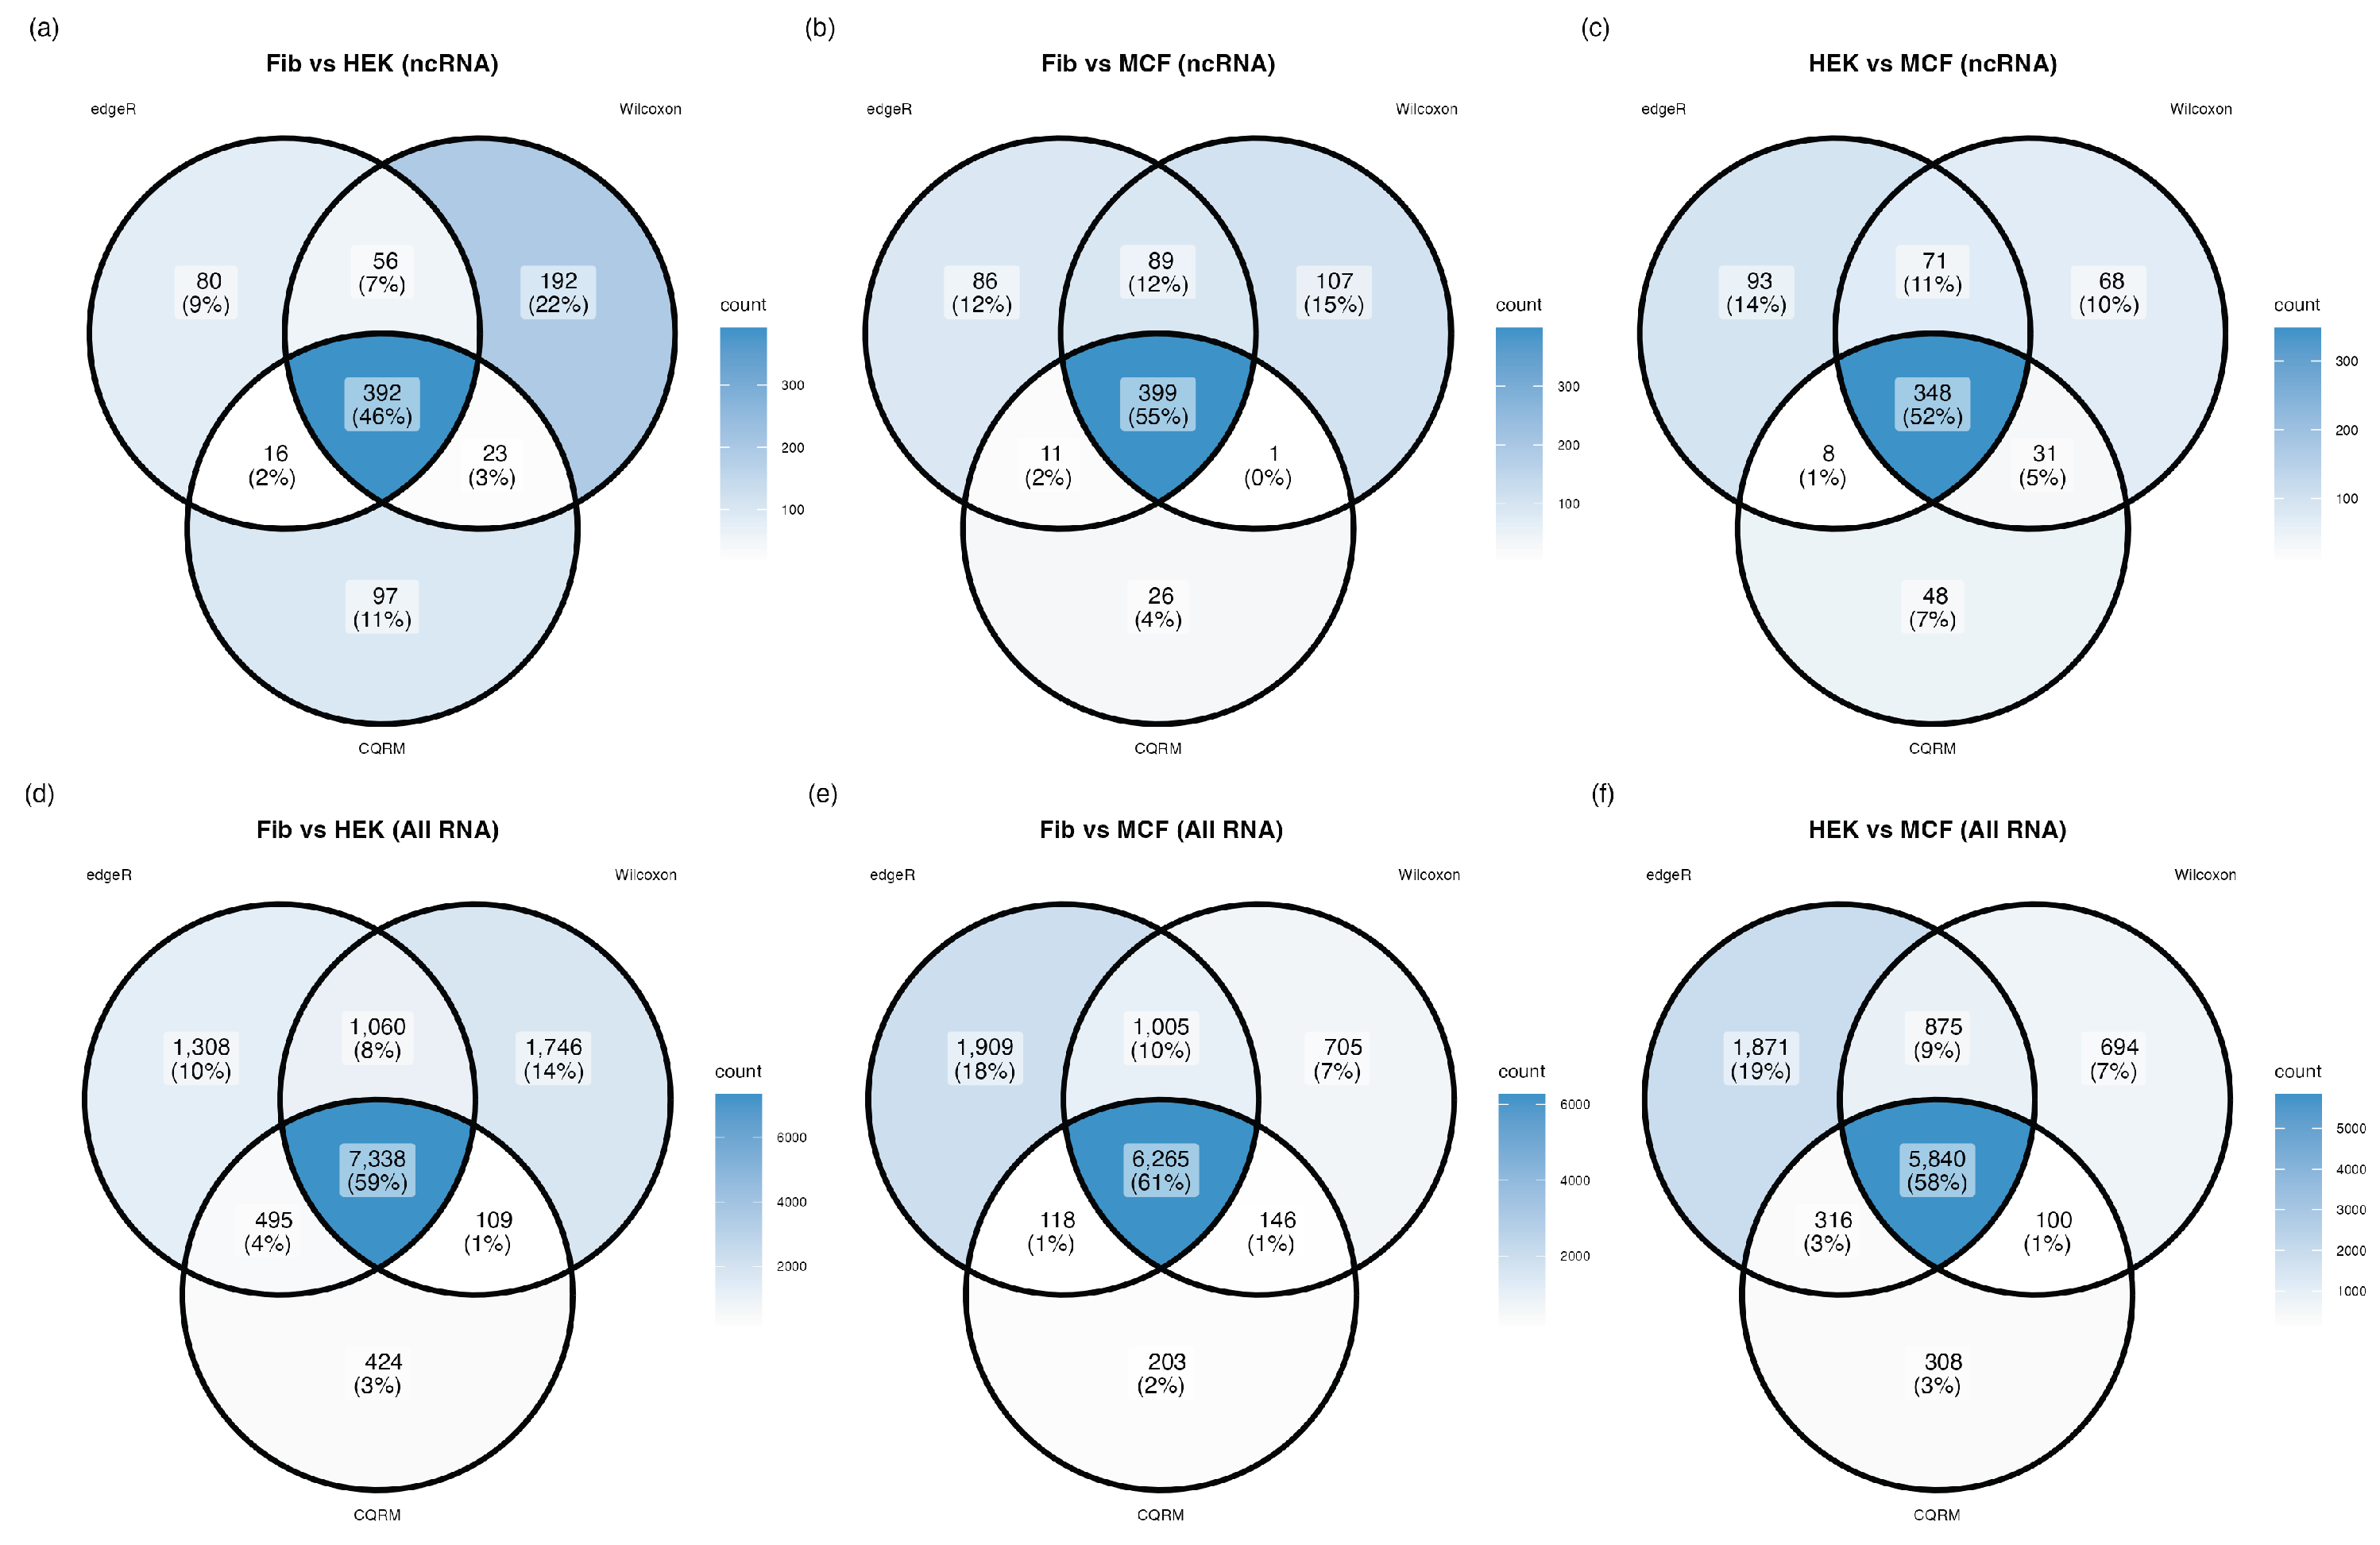
Figure 4.
Side-by-side boxplots of mean counts for the top 100 DEGs detected by Wilcoxon, edgeR, and CQRM across three cell-line comparisons (fibroblast vs. HEK293T, fibroblast vs. MCF7, HEK293T vs. MCF7) for ncRNA and all RNAs. Rows correspond to RNA categories and columns to cell-line comparisons.
Figure 4.
Side-by-side boxplots of mean counts for the top 100 DEGs detected by Wilcoxon, edgeR, and CQRM across three cell-line comparisons (fibroblast vs. HEK293T, fibroblast vs. MCF7, HEK293T vs. MCF7) for ncRNA and all RNAs. Rows correspond to RNA categories and columns to cell-line comparisons.
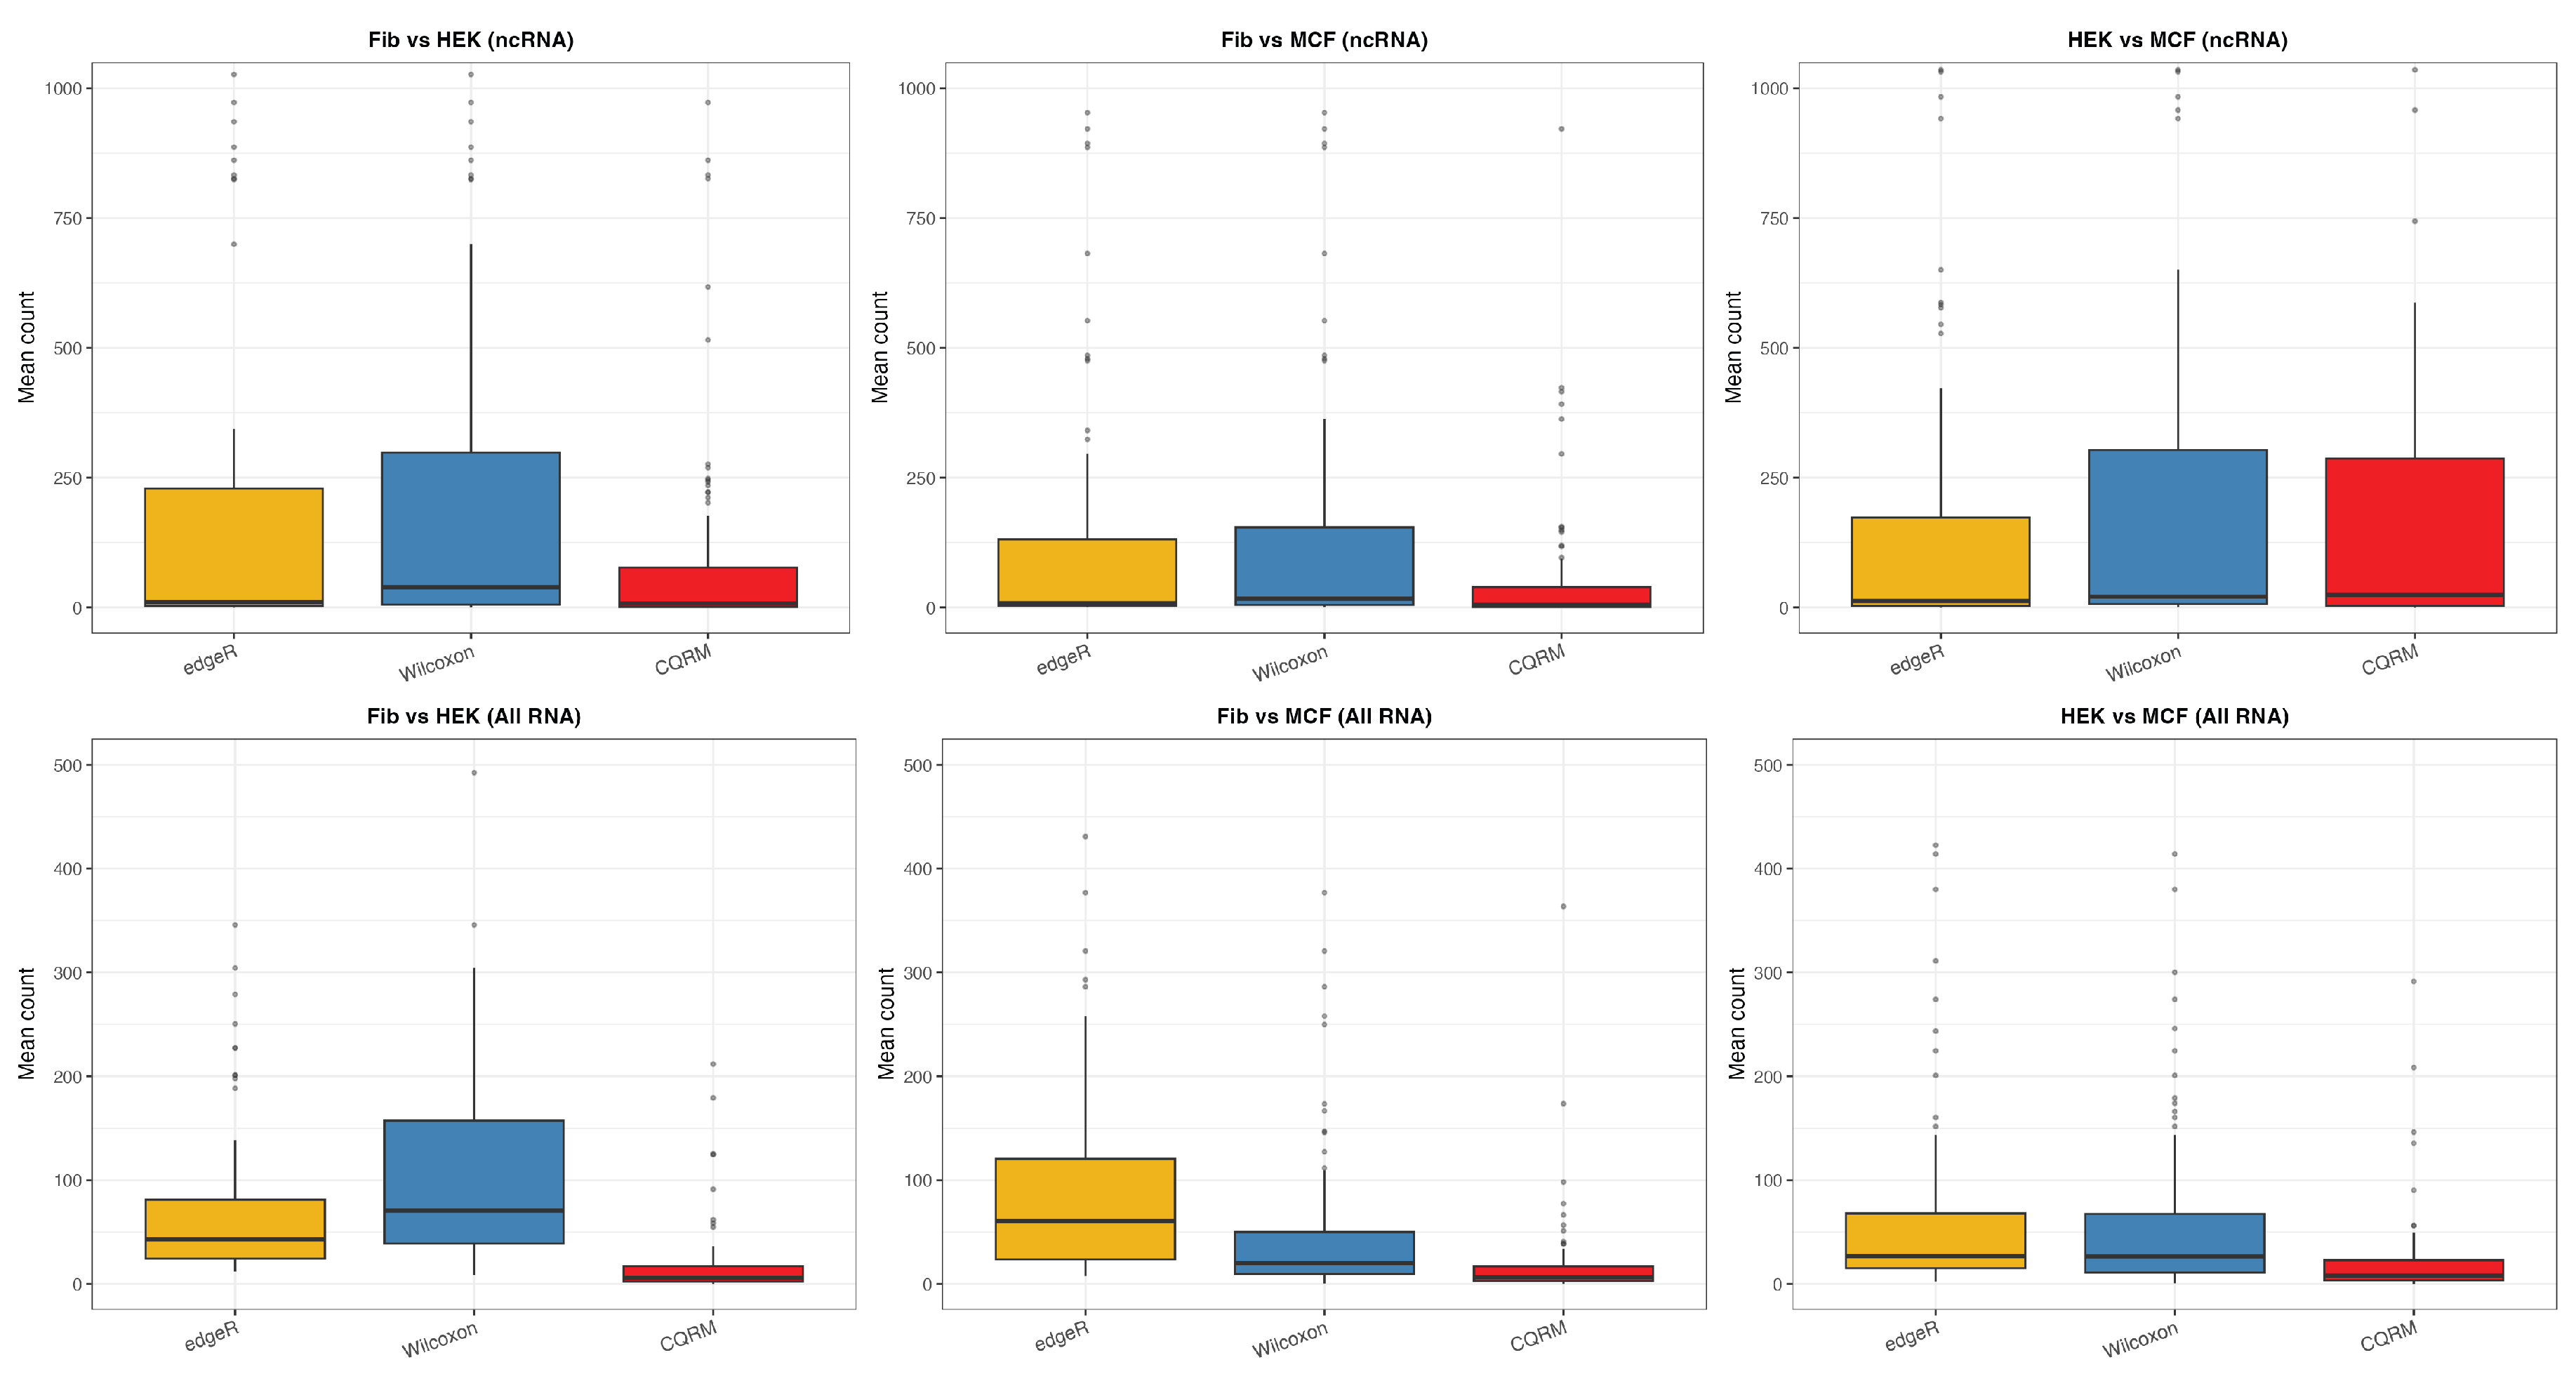
Figure 5.
Venn diagrams of DEGs detected by Wilcoxon, edgeR, CQRM and ZIAQ at FDR for lncRNAs between early and late developmental stages in brain, cerebellum, and testis.
Figure 5.
Venn diagrams of DEGs detected by Wilcoxon, edgeR, CQRM and ZIAQ at FDR for lncRNAs between early and late developmental stages in brain, cerebellum, and testis.
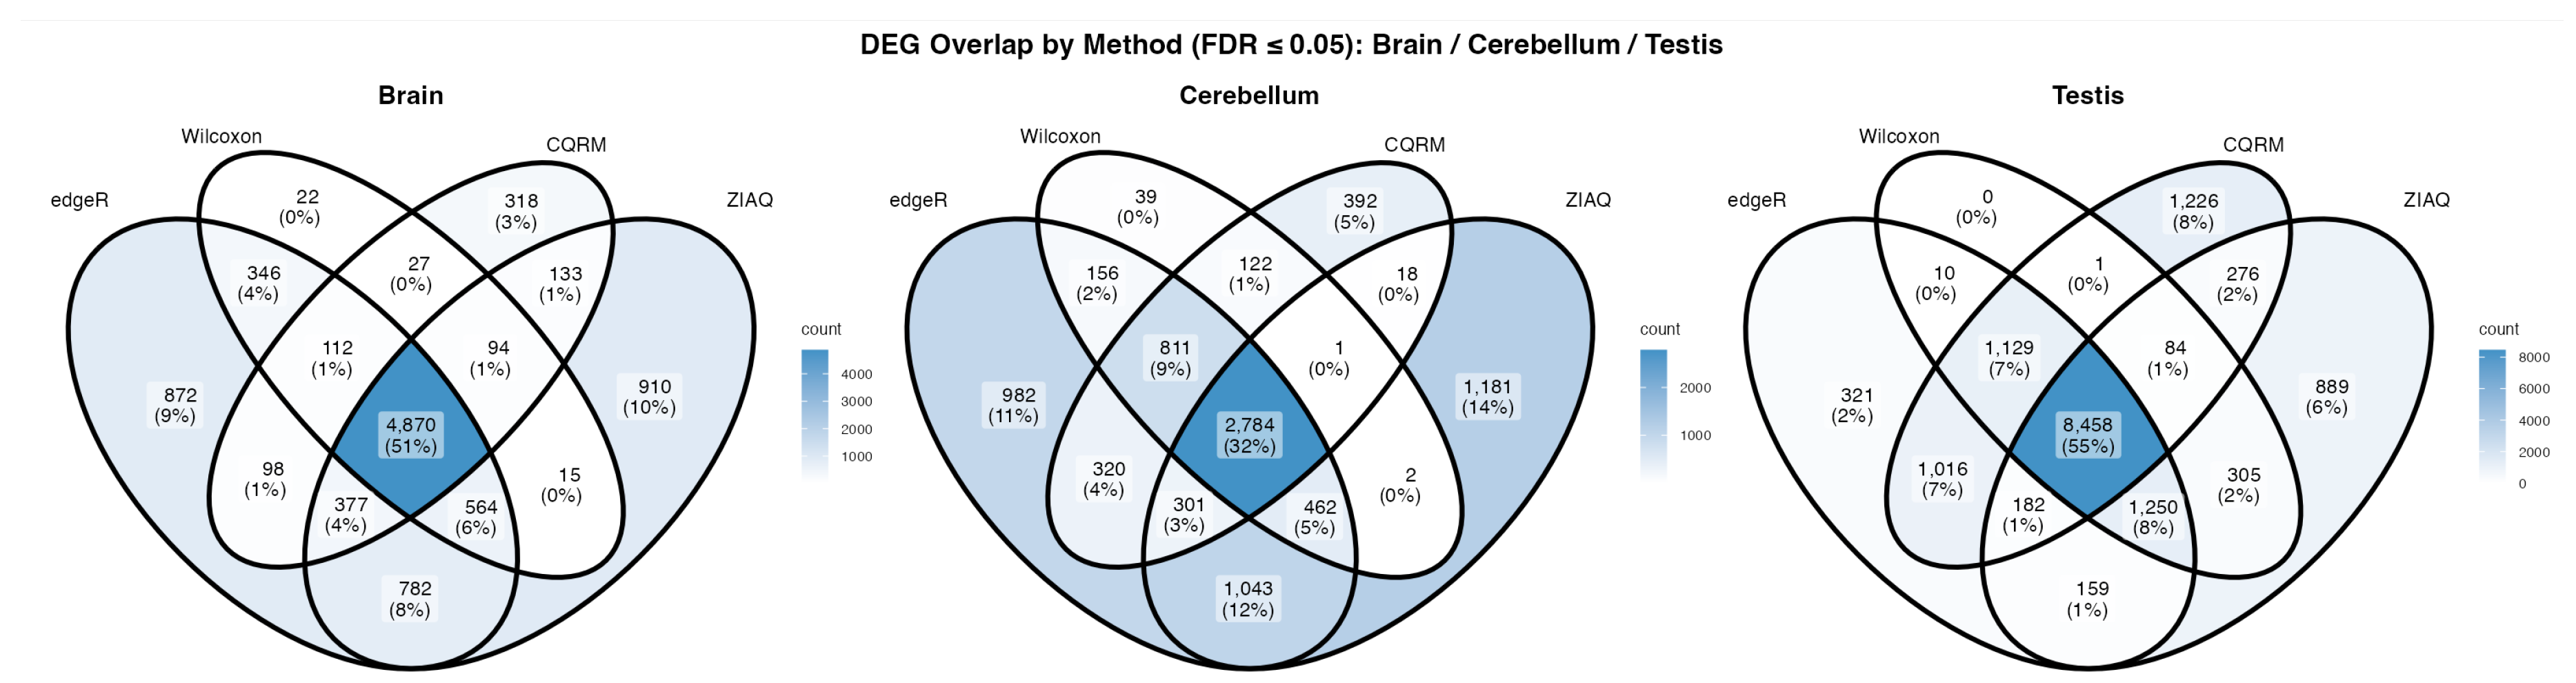
Figure 6.
Side-by-side boxplots of mean counts for the top 500 DEGs detected by Wilcoxon, edgeR, CQRM and ZIAQ in brain, cerebellum, and testis.
Figure 6.
Side-by-side boxplots of mean counts for the top 500 DEGs detected by Wilcoxon, edgeR, CQRM and ZIAQ in brain, cerebellum, and testis.
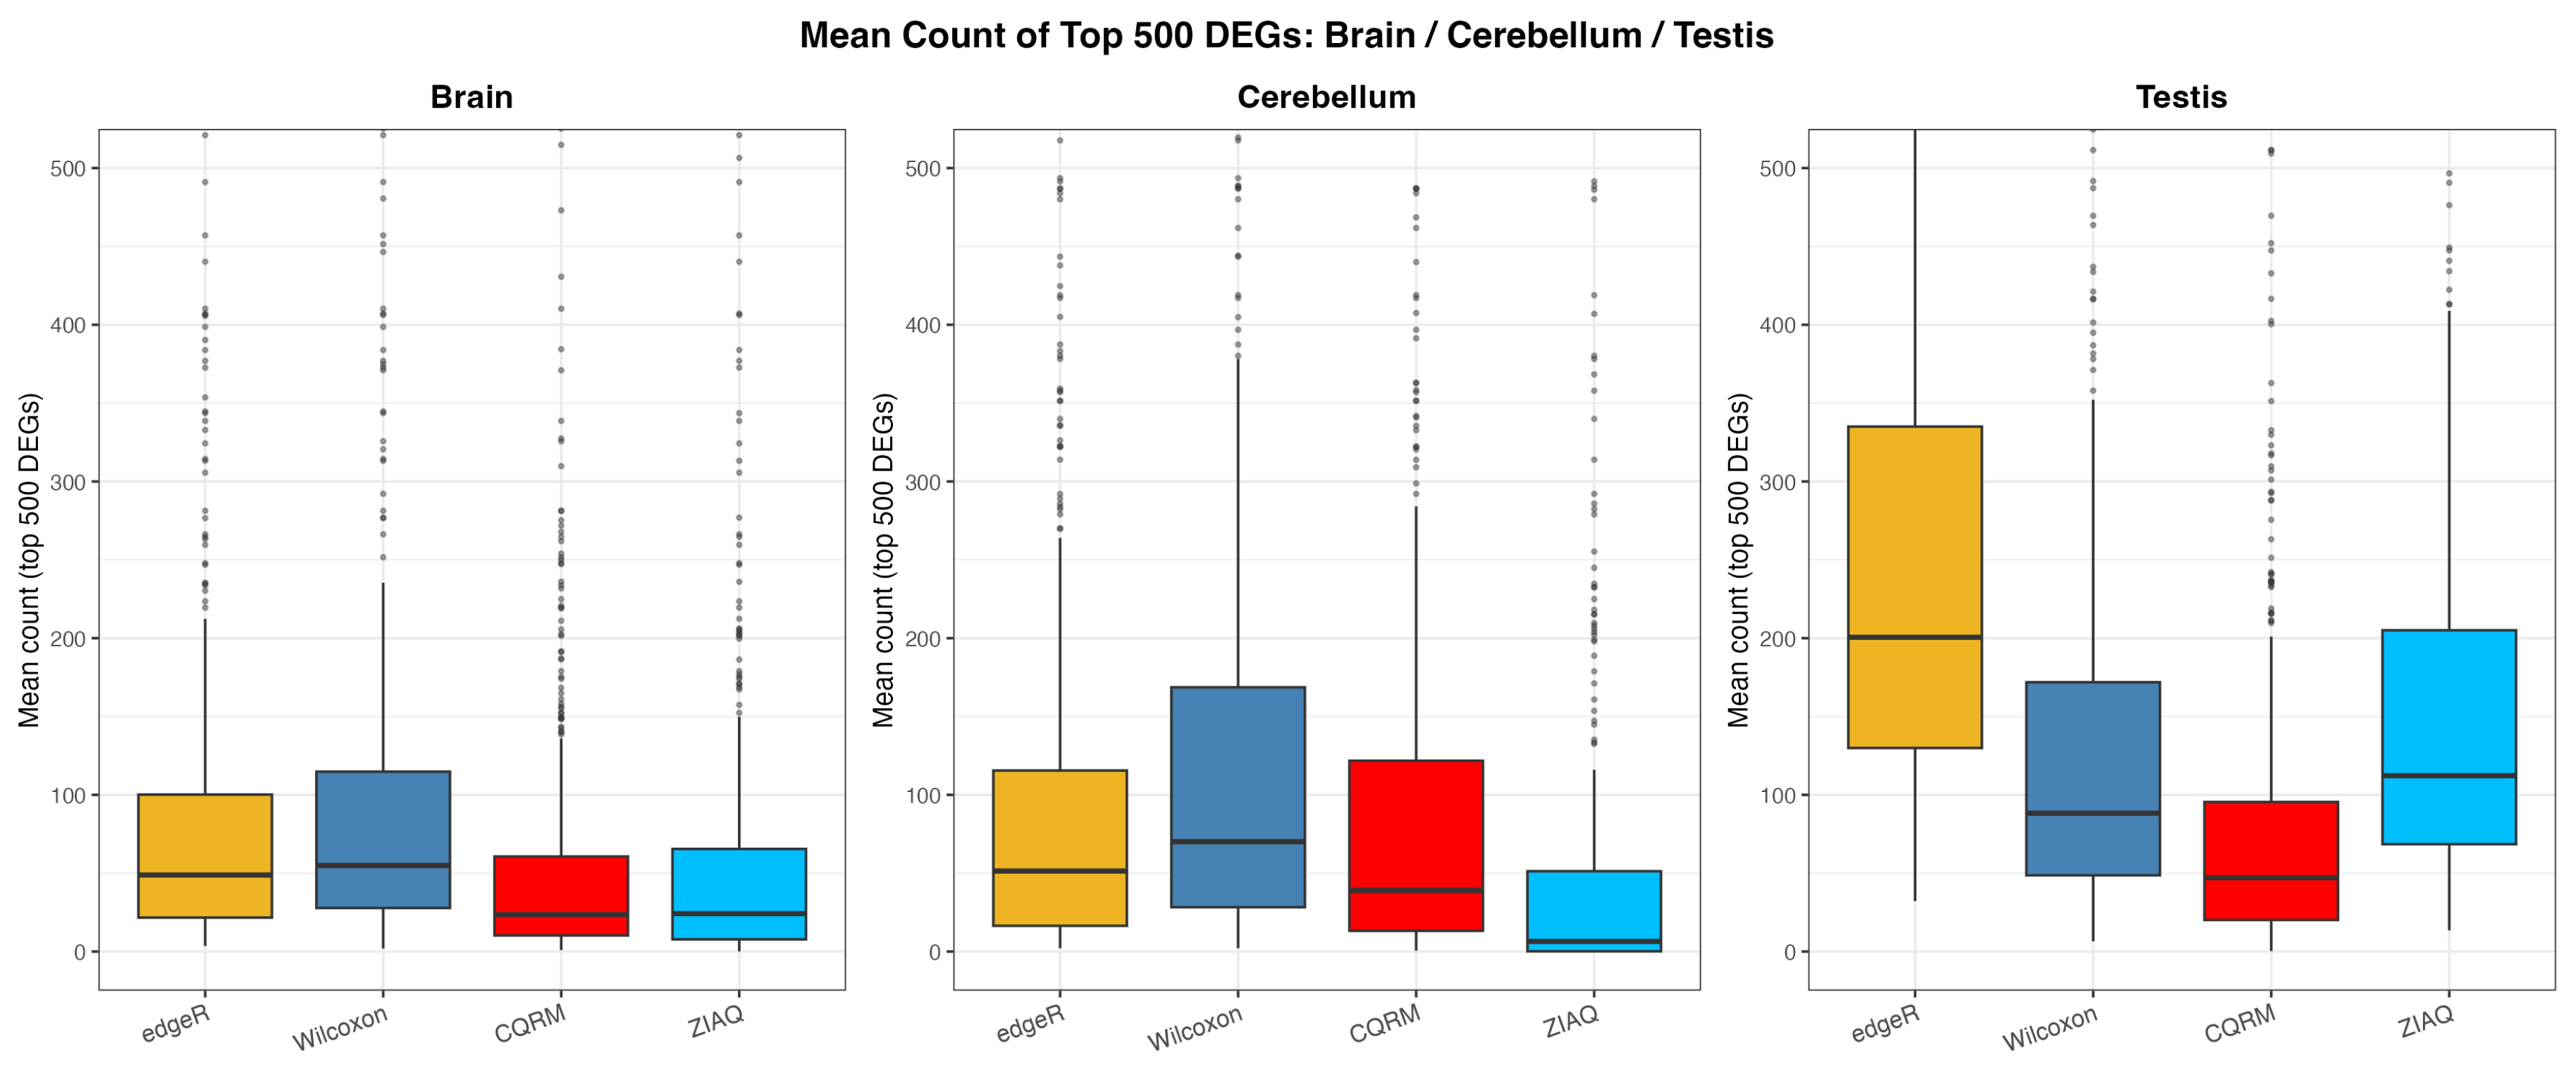

Table 1.
Summary of major DE methods used to model count data from RNA-seq or scRNA-seq.
| Category | Method | Main model | Main characteristics | Reference |
|---|---|---|---|---|
| Parametric | DESeq2 | Negative binomial (NB) | size-factor normalization; NB GLM, Wald test. | [11] |
| edgeR | NB | robust NB GLM, Likelihood ratio test. | [10] | |
| limma-voom | Transform + Linear | voom transformation; Linear model + eBayes shrinkage. | [12] | |
| Non-parametric | Wilcoxon test | No distribution assumption | Rank-based | [13] |
| SAMSeq | No distribution assumption | rank-based and resampling-based test. | [14] | |
| NOISeq | No distribution assumption | non-parametric and data-adaptive test. | [15] | |
| [l]Zero-inflation | ||||
| (scRNA-seq) | ZINB-WaVE | Zero-inflated NB | both dimension reduction and signal extraction | [17] |
| ZIAQ | Zero-inflated quantile regression | zero-inflation adjusted quantile regression model + Fisher’s p-value combination. | [18] |
Disclaimer/Publisher’s Note: The statements, opinions and data contained in all publications are solely those of the individual author(s) and contributor(s) and not of MDPI and/or the editor(s). MDPI and/or the editor(s) disclaim responsibility for any injury to people or property resulting from any ideas, methods, instructions or products referred to in the content. |
© 2026 by the authors. Licensee MDPI, Basel, Switzerland. This article is an open access article distributed under the terms and conditions of the Creative Commons Attribution (CC BY) license (http://creativecommons.org/licenses/by/4.0/).
Copyright: This open access article is published under a Creative Commons CC BY 4.0 license, which permit the free download, distribution, and reuse, provided that the author and preprint are cited in any reuse.