

Submitted:
17 July 2026
Posted:
20 July 2026
You are already at the latest version
Abstract
Africa remains the most under-addressed continent on the planet, with an estimated 60–70% of streets and dwellings lacking formal, standardised addresses. This deficit has profound consequences for governance, emergency response, e-commerce, logistics, and the daily lives of over 1.4 billion people. We present a hybrid graph-theoretic and machine-learning framework for automated address generation trained on high-quality open data from three European cities (Stuttgart, Paris, and Bern) and progressively adapted to seven African cities (Kigali, Dakar, and Kampala as training cities; Dar es Salaam, Nairobi, Kinshasa, and Lagos as unseen test cities). The framework models street networks as primal and dual graphs, applies the Intersection Continuity Negotiation algorithm for stroke detection, and deploys four supervised classifiers for connectivity error detection, road-type classification, building-to-street assignment, and address quality scoring. Building footprints are fused from three complementary sources (OpenStreetMap, Google Open Buildings, Microsoft Building Footprints) and augmented with SRTM elevation data and the World Settlement Footprint 3D (WSF 3D) dataset. Across ten study cities, the pipeline produces 3.2 million merged building footprints, 467,000 street edges, and 880,464 quality-scored addresses, and a five-version iterative improvement cycle reduces the EU–Africa address quality gap by 54.2%. To validate African address outputs independently, we construct a cross-validation database of 1,000 verifiable addresses of known organisations across the seven African cities; cross-validation achieves a geometric match rate of 79.6% within 100 m and 83.5% within 150 m. The system is implemented as an open-source QGIS plugin and ArcGIS Toolbox.
Keywords:
geocoding
; addressing
; Africa
; graph theory
; street network
; machine learning
; OpenStreetMap
; building footprints
; QGIS
; transfer learning
colorlinks=true, linkcolor=black, citecolor=black
1. Introduction
1.1. The Global Address Crisis
Addressing, defined as the assignment of unique, machine-readable, and human-interpretable identifiers to locations, is one of the most fundamental enablers of modern civilization [1]. In developed nations, structured address systems support postal delivery, emergency response, taxation, census enumeration, urban planning, and the digital economy [2]. The Universal Postal Union (UPU) estimates that approximately four billion people worldwide lack a reliable address, and the overwhelming majority reside in Africa and parts of South and Southeast Asia [3]. The World Bank has described the lack of addressing in developing countries as a “silent crisis,” noting that without addresses governments cannot deliver services, businesses cannot reach customers, and citizens cannot exercise basic rights [4].
In Sub-Saharan Africa, fewer than 20% of roads have formal names, and fewer than 10% of buildings carry official house numbers [5]. This stands in dramatic contrast to Europe, where countries like Germany, France, and Switzerland have near-complete address coverage maintained by national cadastral or postal authorities [6].
1.2. Africa’s Unique Challenges
Africa’s addressing deficit is not merely a technical problem; it is deeply entwined with the continent’s history of colonialism, rapid urbanisation, informal settlement growth, and limited institutional capacity [7]. Several factors make Africa’s case unique:
- Rapid urbanisation without planning: The United Nations projects that Africa’s urban population will nearly triple between 2020 and 2050, from 590 million to over 1.5 billion [8]. Much of this growth occurs in informal settlements such as slums, peri-urban areas, and unplanned extensions, where streets have no names and buildings have no numbers [9].
- Colonial legacy: Many African countries inherited address systems designed for colonial administrative districts (the “European quarters”) while vast indigenous neighbourhoods were left unaddressed [10]. Post-independence governments often lacked the resources or political will to extend these systems [7].
- Linguistic and cultural diversity: A single African city may have communities speaking 10 or more languages, making naming conventions and transliteration of street names a challenge [11]. In Lagos, for example, the same street may be known by different names in Yoruba, Pidgin English, and official English [12].
- Institutional fragmentation: Responsibility for addressing is often split among municipalities, postal authorities, national mapping agencies, and land registries, with poor coordination and conflicting standards [13].
1.3. Scope and Contributions
This paper makes the following contributions:
- 1.
- A comprehensive review of the state of geocoding and addressing in Africa, drawing on published case studies from over 15 African countries and citing verified published references.
- 2.
- A detailed analysis of the consequences of inadequate geocoding for emergency services, business, governance, population enumeration, and daily life across the continent.
- 3.
- An exploration of the opportunities that improved geocoding can unlock, particularly for Africa’s young population, the research community, and government planning.
- 4.
- A hybrid methodology combining graph theory with supervised machine learning, trained on high-quality open data from Stuttgart (Germany), Paris (France), and Bern (Switzerland), and adapted to seven African cities, in which graph-theoretic features feed gradient-boosted and random-forest classifiers for connectivity error correction, road-type classification, building-to-street assignment, and address quality scoring.
- 5.
- An automated data collection and cleaning pipeline that integrates street networks, building footprints from three complementary sources (OSM, Google Open Buildings, Microsoft Building Footprints), SRTM terrain elevation data, and the WSF 3D global building dataset, producing over 3.2 million merged building footprints and 467,000 street edges across ten study cities.
- 6.
- An implementation architecture for a QGIS plugin and an ArcGIS Toolbox tool that generates addresses and exports them to OpenStreetMap and other open databases.
- 7.
- An analysis of downstream applications, including postal network installation, emergency dispatch routing, and e-commerce logistics.
1.4. Background and Literature Review: Geocoding and Addressing in Africa
1.4.1. What is Geocoding and Why Does It Matter?
Geocoding is the process of converting a human-readable address (e.g., “12 Rue de Rivoli, Paris”) into geographic coordinates (latitude and longitude), and reverse geocoding is the inverse process [2]. A robust geocoding system requires: (a) a standardised address assignment scheme, (b) a comprehensive address database, and (c) algorithms for matching and interpolation [14]. Goldberg et al. [2] provide a taxonomy of geocoding methods, including address-range interpolation, parcel-level matching, rooftop centroid matching, and street-weighted interpolation. Each method requires different levels of reference data quality. In Africa, the absence of foundational reference data makes even the simplest geocoding methods unreliable [15,16].
1.4.2. Country-by-Country Survey
The scale of Africa’s addressing deficit becomes most visible when examined at the national level. The following survey draws on published academic and institutional sources from fifteen countries, grouped thematically to highlight recurring patterns across the continent.
The most acute challenges appear in Africa’s most populous nations, where sheer demographic scale amplifies every gap in coverage. Nigeria, with an estimated 223 million people in 2024, epitomises this problem. Oluwafemi and Oluwadare [12] found that in Lagos, a megacity of over 20 million people, fewer than 30% of streets had officially gazetted names, and house numbering was inconsistent even in formal neighbourhoods. The National Postcode System (NIPOST) covers only a fraction of the country [17], and Akinbobola et al. [18] documented that in Ibadan, one of Africa’s largest cities by area, entire neighbourhoods of over 100,000 residents had no formal addresses, relying instead on landmarks (“opposite the big tree by the market”) for navigation. The Nigerian government launched the National Addressing System (NAS) project in partnership with the Universal Postal Union in 2015, but implementation has been slow, covering fewer than 10 capital cities as of 2023 [19].
The Democratic Republic of the Congo presents an even more extreme case, shaped by decades of conflict and institutional fragility. With 100 million people spread across 2.3 million km2, the DRC has one of the lowest address coverage rates in the world [20]. Kabamba and Ngoy [20] reported that in Lubumbashi, the country’s second-largest city, fewer than 15% of streets had official names and most buildings lacked any numbering, while the colonial-era Belgian address grid in Kinshasa covers only the central communes, leaving the vast peripheral communes home to the majority of the capital’s 17 million residents essentially unaddressed [21].
Egypt, despite a long postal history in Cairo and Alexandria, confronts a similar informal-settlement gap: Abdelhamid et al. [22] found that the ashwa’iyyat housing approximately 15 million people in Greater Cairo alone lacked formal addresses, and the government’s modernisation initiative launched in 2019 has not yet reached all informal zones [23].
Several countries possess formal address frameworks that function well in planned urban cores yet break down sharply in informal settlements and peri-urban areas. South Africa is the clearest example of this dual reality. The formal districts of Johannesburg, Cape Town, and Durban have well-maintained systems inherited from the apartheid-era municipal planning regime [24], but Coetzee et al. [24] documented that informal settlements, home to roughly 14% of the population or approximately 8 million people, remain largely unaddressed. The South African Address Standard (SANS 1883) provides a framework, yet implementation in informal areas is incomplete [25], and Memela and Mhangara [26] found that in the eThekwini municipality (Durban) only 62% of residential properties had complete, geocodable addresses.
Kenya has been at the forefront of addressing innovation: the government launched the Kenya National Addressing System (KENAS) in 2010, and by 2020 Nairobi had achieved substantial coverage in formal areas [27]. Even so, Hagen [28] found that Kibera, home to approximately 250,000 people, still had no formal addresses, with residents relying on community-generated reference systems, and Karanja [29] documented how this void complicated public health interventions during cholera outbreaks.
Morocco has invested significantly in addressing through the Agence Nationale de la Conservation Foncière, du Cadastre et de la Cartographie (ANCFCC), yet El Garouani et al. [30] found that coverage in medina (old city) areas and rural communes remained incomplete, with only 35% of buildings in some rural areas having formal addresses.
A few countries have pursued innovative, technology-driven or campaign-based strategies with varying degrees of success. Ghana adopted the National Digital Property Addressing System (GhanaPostGPS) in 2017, assigning a unique digital address to every 5×5 m area of the country [31]. While innovative, the system has been criticised for its reliance on a proprietary grid code rather than traditional street addresses [32], and Quaye-Ballard et al. [33] found that adoption was low in rural areas due to limited smartphone penetration and internet access, with poor integration into existing postal operations.
Rwanda stands out as one of the continent’s success stories. Following the post-genocide addressing campaign (2007–2012) in Kigali, which systematically renamed streets and numbered buildings throughout the capital, the system was extended to secondary cities [34]. Developed with support from the Korea International Cooperation Agency (KOICA), the Rwanda Addressing System has been cited as a model for other African countries [1].
Côte d’Ivoire took a different path, launching a national addressing project in Abidjan in 2001 that achieved reasonable coverage in formal neighbourhoods [35], yet Koffi et al. [36] documented that the rapid growth of Abidjan’s northern communes (Abobo, Anyama) rendered the original effort obsolete within a decade, as thousands of new structures were built without any addressing.
Across much of West and Central Africa, addressing remains confined to small colonial-era cores while the vast majority of the urban fabric goes unaddressed. Senegal’s system covers Dakar and some regional capitals but is largely absent in rural areas [37], and Diop et al. [37] reported that the lack of addresses in Dakar’s banlieue has hampered the development of e-commerce and logistics services. Cameroon, a bilingual country (French and English), illustrates a related pattern: Ndi and Balgah [38] found that Douala and Yaoundé have partial addressing in colonial-era neighbourhoods, but the majority of both cities, particularly informal zones, lack addresses, and the postal system (CAMPOST) has introduced postcode zones but not street-level addressing [39].
Uganda’s system is largely limited to Kampala’s central business district, where Sanya et al. [40] found that addresses relied heavily on informal landmarks and that commercial geocoding services (Google Maps, Bing Maps) had error rates exceeding 500 metres for 40% of Kampala addresses tested.
In East Africa and the Horn, rapid urbanisation, linguistic diversity, and climate-related risks compound the addressing deficit. Dar es Salaam, Tanzania’s largest city with an estimated population of 7 million, has a partially implemented addressing system, but rapid urbanisation has outpaced the addressing authority’s capacity [41]; the Resiliency Academy and Ramani Huria project used community mapping with OpenStreetMap to create addressing data for flood-prone areas, though this remains unofficial [42].
Ethiopia’s challenges are further compounded by the use of the Ge’ez script and multiple local languages [43]. Addis Ababa has a partially functional system, but Berhanu and Akalu [43] found that fewer than 40% of addresses in the capital were geocodable using commercial services, and outside Addis Ababa formal addressing is virtually nonexistent [44].
Mozambique brings the consequences of absent addresses into starkest relief: Maputo has benefited from recent addressing initiatives, yet Manhiça et al. [45] reported that outside the capital fewer than 5% of municipalities had any form of systematic addressing, and the 2019 Cyclone Idai disaster underscored the human cost when emergency responders were unable to direct aid to specific locations because addresses simply did not exist [46].
1.4.3. Summary of the African Addressing Landscape
The literature reveals a continent-wide pattern: African cities have partial, fragmented, or entirely absent addressing systems, with coverage strongly correlated with colonial heritage, economic development, and institutional capacity [7]. Even in countries where addressing projects have been launched (Ghana, Kenya, Rwanda), sustainability, adoption, and coverage of informal areas remain persistent challenges [47]. The absence of standardised, complete address data severely limits the applicability of modern geocoding techniques [16].
1.5. Consequences of Mis-Geocoding and Addressing Deficits in Africa
The absence of reliable geocoding and addresses in Africa is not a mere inconvenience; it is a structural barrier to development that affects virtually every sector of the economy and public life [4].
1.5.1. Emergency Services: When Minutes Cost Lives
Fire services depend on rapid, precise location information to dispatch engines to the correct address [48]. In cities like Lagos, Kinshasa, and Douala, where addresses are nonexistent or unreliable, callers must describe their location using landmarks, which are ambiguous and time-consuming to interpret [49]. Olatunji and Ogunbodede [49] found that in Lagos, fire response times averaged 45 minutes in unaddressed neighbourhoods, three to four times longer than in addressed areas, and that an estimated 35% of fire calls were dispatched to the wrong location on the first attempt. In Accra, the Ghana National Fire Service reported that “finding the exact location of a fire is often our biggest challenge” [50]. The consequences are devastating: delayed fire response leads to greater property destruction, more casualties, and higher economic losses [48]. The World Fire Statistics Centre has documented that fire death rates in Sub-Saharan Africa are 3–5 times higher than in Europe, with addressing deficits cited as a contributing factor [48].
Law enforcement also depends on addresses for dispatch, crime mapping, and investigation [51]. Adegoke and Olowofela [52] found that in Ibadan, Nigeria, police patrol routes were based on informal area names rather than addresses, resulting in overlapping jurisdictions and response gaps. In Nairobi’s informal settlements, Mutuku and Kuria [53] documented that witnesses and victims frequently could not specify the location of a crime beyond “near the water tap in Mathare,” making investigation and prosecution nearly impossible.
Ambulance and medical emergency services represent perhaps the most urgent health consequence of missing addresses. Thaddeus and Maine’s [54] landmark “Three Delays” model for maternal mortality identifies delay in reaching care as a critical factor, and this delay is directly exacerbated by the inability to geocode a patient’s location. Makanga et al. [55] found that in rural Mozambique, ambulance response times exceeded 2 hours for 60% of calls, with much of the delay attributable to difficulty locating patients. In a study of cardiac arrest outcomes in Dar es Salaam, Sawe et al. [56] found that the absence of addresses was associated with a 30% increase in time-to-hospital compared to areas with partial addressing.
1.5.2. Business and E-Commerce
The E-Commerce Delivery Problem: Africa’s e-commerce market is projected to reach $75 billion by 2025 [57], but the lack of addresses is a critical bottleneck. Jumia, Africa’s largest e-commerce platform, has estimated that 30–50% of delivery failures are attributable to incorrect or non-existent addresses [58]. Okonkwo [59] documented that in Nigeria, Jumia resorts to phone-based “last-mile navigation,” requiring delivery riders to call customers repeatedly for verbal directions, an inefficient, costly, and privacy-intrusive process. McKinsey & Company [60] estimated that last-mile delivery costs in Sub-Saharan Africa are 2–5 times higher than in Europe, with addressing deficits accounting for approximately 30% of the excess cost. This creates a vicious cycle: high delivery costs deter consumers from ordering online, which limits market growth, which reduces investment in logistics infrastructure.
Freight and Logistics: These difficulties are not confined to domestic e-commerce. International freight and logistics companies operating in Africa face similar challenges. DHL’s Africa subsidiary reported that address-related delivery failures cost the company an estimated $50 million annually across the continent [61], and Oduah et al. [62] found that in the DRC, freight companies rely on GPS coordinates shared via WhatsApp rather than addresses, a system that is error-prone and does not integrate with standard logistics management software.
Cross-Border Commerce and Bereavement: Beyond commercial losses, the human cost of missing addresses extends to intensely personal situations. When a family member dies in another African country, the bereaved family often cannot send documents, money, or funeral arrangements to a specific address [63]. Ndegwa [63] documented cases in the East African Community where death certificates and personal effects took months to reach families because neither the sender nor the recipient had a geocodable address. Similarly, insurance claims, inheritance proceedings, and bank transfers are complicated or impossible when beneficiaries cannot be located at a verifiable address [64].
1.5.3. Governance and Public Administration
Population Census and Enumeration: Accurate census-taking requires a spatial frame, typically an address database, to ensure complete coverage and avoid double-counting [65]. The United Nations Statistics Division has noted that the absence of address systems is one of the primary reasons why African census data is unreliable [65]. Banda and Chirwa [66] found that in Zambia’s 2020 census, enumerators in urban areas without addresses resorted to hand-drawn sketch maps, resulting in estimated undercounting of 8–12% of the population.
Taxation and Revenue Collection: Closely linked to census accuracy, property tax collection in African cities is severely hampered by addressing deficits [67]. Fjeldstad et al. [67] found that in a sample of 10 African cities, only 30–60% of properties were registered in municipal tax rolls, with addressing gaps cited as the primary reason for non-registration. In Dar es Salaam, Kombe [68] estimated that the city collected only 20% of potential property tax revenue due to its inability to identify and locate properties.
Urban Planning and Land Administration: These governance shortfalls feed into a broader challenge: modern urban planning depends on spatially referenced data, and addresses are the most common spatial reference used by citizens, businesses, and governments [69]. Without addresses, municipal authorities cannot maintain land registries, issue building permits with verifiable locations, or plan infrastructure investments [13]. Enemark et al. [13] argued that functioning address systems are a prerequisite for the “fit-for-purpose” land administration approach advocated by the World Bank and UN-Habitat for developing countries.
Elections and Voter Registration: The democratic process is equally affected. Electoral management bodies require addresses to compile voter rolls, assign voters to polling stations, and detect fraud [70]. In several African countries, the inability to assign voters to addresses has been linked to political manipulation: in Kenya’s disputed 2017 election, the Independent Electoral and Boundaries Commission acknowledged that the absence of addresses in informal settlements complicated voter roll verification [70].
1.5.4. Social Inclusion and the “Invisible” Population
Taken together, the cumulative effect of addressing deficits is that millions of Africans are effectively “invisible” to formal systems [4]. They cannot receive mail, verify their identity for banking (Know Your Customer regulations), register for government services, or prove where they live [64]. This disproportionately affects marginalised groups: women (who are less likely to have identity documents linked to addresses), youth, displaced persons, and the urban poor [64]. The World Bank’s Identification for Development (ID4D) initiative has identified addresses as a “missing link” in Africa’s identity ecosystem [71].
1.5.5. Impact on the African Diaspora
The consequences do not stop at the continent’s borders. The addressing deficit also affects the estimated 170 million members of the African diaspora [72]. Sending remittances (estimated at $96 billion to Sub-Saharan Africa in 2023 [73]), packages, legal documents, and even letters to family members is complicated or impossible when recipients lack verifiable addresses [63]. This represents not only an economic loss but a severing of familial and cultural ties that further marginalises African communities [72].
1.6. Opportunities Opened by Improved Geocoding in Africa
1.6.1. Economic Opportunities
E-Commerce and Last-Mile Delivery: Fixing the address problem could unlock an estimated $20–30 billion in additional e-commerce revenue across Africa by 2030 [57]. Addressing enables route optimisation, automated dispatch, proof-of-delivery, and customer trust, all of which are prerequisites for scalable e-commerce [60]. Startups such as OkHi (Kenya), Snoocode (Ghana), and Plus Codes (Google) have demonstrated that even simple addressing systems can reduce delivery costs by 15–25% [74,75].
Financial Inclusion: Alongside commerce, addresses enable Know Your Customer (KYC) compliance, which is a prerequisite for opening bank accounts, applying for credit, and purchasing insurance [64]. With only 48% of adults in Sub-Saharan Africa having a formal bank account [76], addressing could be a catalyst for financial inclusion, particularly for women and youth [64].
Real Estate and Property Markets: On a related front, a geocodable address transforms a piece of land from a vague claim into a verifiable, tradable asset [77]. De Soto [77] famously estimated that the “dead capital” locked in unaddressed, unregistered property in developing countries exceeds $9.3 trillion. For Africa specifically, the figure has been estimated at $1–2 trillion [69].
1.6.2. Opportunities for Young People
Africa has the youngest population on Earth, with over 60% of its people under the age of 25 [72]. Geocoding and addressing represent a uniquely promising field for this demographic:
- Software development and startups: Young African developers can build geocoding apps, logistics platforms, and GIS tools adapted to local contexts [57]. Companies like Zipline (drone delivery in Rwanda), Kobo360 (logistics in Nigeria), and Lori Systems (freight in Kenya) have demonstrated the commercial viability of location-based services in Africa [78].
- Data collection and mapping: Initiatives like the Humanitarian OpenStreetMap Team (HOT), Map Kibera, and YouthMappers provide training and employment for young Africans in community mapping and address data collection [42]. These skills are transferable to the growing geospatial industry, which the World Geospatial Industry Council estimates will reach $500 billion globally by 2025 [79].
- Research and academia: Geocoding in Africa is an under-researched field with enormous potential for doctoral research, publications, and academic career development [80]. Topics such as address matching algorithms for under-resourced languages, machine learning for address extraction from unstructured text, and spatial analysis of informal settlements offer rich opportunities [16].
1.6.3. Opportunities for Government
Improved Service Delivery: With addresses, governments can deliver services such as water, electricity, sanitation, and health more efficiently and equitably [3]. The UPU has estimated that for every $1 invested in addressing, developing countries see $10–20 in improved service delivery and private-sector economic activity [3].
Revenue Mobilisation: Improved service delivery, in turn, supports revenue mobilisation. Addressing enables property taxation, business registration, and customs enforcement [67]. For a typical Sub-Saharan African city, implementing a comprehensive addressing system could double property tax revenue within 3–5 years [68].
Disaster Preparedness and Climate Adaptation: Looking ahead, as climate change increases the frequency of floods, droughts, and storms in Africa, the ability to geocode vulnerable populations and infrastructure becomes critical [81]. The United Nations Office for Disaster Risk Reduction (UNDRR) has identified addressing as a key enabler of disaster preparedness in its Sendai Framework implementation guidelines for Africa [81].
1.6.4. Opportunities for Research
The field of geocoding in Africa presents numerous research opportunities across multiple disciplines:
- Computer science: Developing geocoding algorithms that work with incomplete, inconsistent, or non-Latin-script address data [16].
- Urban geography: Analysing the spatial structure of informal settlements and designing addressing schemes that respect existing spatial practices [9].
- Public health: Using geocoded spatial data to map disease outbreaks, optimise health facility placement, and improve emergency response [55].
- Transportation engineering: Modelling street networks for routing, accessibility analysis, and public transit planning [82].
1.7. Why a Graph-Based Approach?
The core methodological challenge of this work is to generate structured addresses for unaddressed or under-addressed areas from spatial data (street centrelines, building footprints, parcels). We adopt a graph-theoretic approach to street network modelling for the following reasons:
- 1.
- Mathematical rigour: Graph theory provides formal, well-understood tools for representing and analysing spatial networks [83]. Street networks are naturally modelled as graphs, where intersections are nodes and street segments are edges [84]. This representation has been used in transportation science, urban morphology, and spatial analysis for decades [82].
- 2.
- Topological invariance: Graph representations capture the connectivity and structure of a street network independently of its precise geometry [85]. This is crucial for Africa, where street geometries may be poorly digitised, but the topological structure (which streets connect to which) can be inferred from satellite imagery or community mapping [15]. Equally important, a graph representation makes topological errors such as dangling edges, gaps, and broken links explicitly detectable through standard graph-theoretic measures (node degree, connected components), enabling systematic correction before address generation begins.
- 3.
- Scalability: Graph algorithms (shortest path, centrality, community detection) are computationally efficient and can be applied to networks with millions of edges [84]. This is essential for handling the scale of African cities like Lagos (estimated 10,000+ km of streets) and Kinshasa (estimated 8,000+ km) [86].
- 4.
- Compatibility with GIS: Graph-based street network models are natively compatible with GIS data formats (shapefiles, GeoJSON, GeoPackage) and GIS software (QGIS, PostGIS) [87].
We considered and rejected several alternative approaches. Grid-based approaches (such as what3words [88] or GhanaPostGPS [31]) assign codes to fixed geographic grid cells. While simple, these systems do not produce human-readable addresses, do not integrate with existing postal systems, and have been criticised for opacity and proprietary lock-in [32]. Pure machine-learning approaches for end-to-end neural network address parsing [80] require large labelled training datasets that do not exist for most African cities. While promising for address matching in data-rich environments, they cannot, on their own, generate addresses where none exist. Voronoi-based approaches [89] partition space based on proximity to reference points, but do not capture the linear, network structure of streets that is fundamental to address systems [90].
Our graph-based approach combines the mathematical rigour of network science [83,84] with the practical requirements of address generation, and is grounded in a substantial body of published literature [82,85,91]. Boeing [82] demonstrated with the OSMnx Python library that OpenStreetMap data can be automatically converted into NetworkX graph objects for analysis, and this approach has been applied to cities worldwide. Porta et al. [91] showed that dual graph representations, where streets are nodes and intersections are edges, are particularly effective for identifying the hierarchical structure of street networks, which is precisely the information needed for address generation. We train classifiers on data from Stuttgart, Paris, and Bern, where ground-truth building-to-street links and road classifications are known from official cadastres (ALKIS, BAN, swisstopo), and transfer the trained models to African cities where such reference data is unavailable.
2. Methods
2.1. Study Area and Training Cities
The model is trained and validated on street networks from three European cities with well-documented, complete addressing systems and four African cities spanning different geographic regions, colonisation histories, languages, and stages of addressing maturity. Table 1 characterises the European training cities.
Stuttgart, Germany was selected as the primary training city for the following reasons: complete address coverage through ALKIS/AdV providing near-100% address coverage with house-level coordinates for over 310,000 addresses [92]; complex topography (elevation range 207–549 m) that closely mirrors the complex topography found in cities like Kigali, Yaoundé, and Antananarivo [93]; and fully open OSM data quality [94]. The LiDAR-derived DSM (1 m resolution) enables precise building height extraction and floor estimation for validation [95].
Paris, France is included for historical depth (Napoleonic 1805 addressing system [96]), grid/organic hybrid layout (Haussmann’s boulevards combined with the medieval street pattern [97]), francophone relevance (many African countries use French as an official language [98]), and dense multi-story buildings providing an ideal test case for DEM-based building height extraction. The IGN RGE ALTI® 1 m DEM provides precise building height validation [99].
Bern, Switzerland provides multilingual addressing (German with significant French influence [100]), precise geocoding validation through the swisstopo national survey (sub-metre accuracy [101]), and a compact, well-structured network. The swissBUILDINGS3D 2.0 dataset provides precise building footprints with measured roof heights and floor counts [102].
2.2. Input Data Layers
The model operates on four primary geospatial data layers. Table 2 summarises the integrated spatial data model.
2.2.1. Street Network with Names
Street centerlines are acquired from OSM using OSMnx [82], which provides globally available data including street names (name tag), road classifications (highway tag), one-way restrictions, and surface types. In many African cities, a large majority of OSM street segments carry no name at all. Coetzee and Bishop [5] estimated that fewer than 20% of roads across Sub-Saharan Africa have formal names, and Barrington-Leigh and Millard-Ball [94] confirmed that while OSM road geometry in urban Africa is often adequate for network analysis, the name tag is populated on only a small fraction of edges. Where name tags exist, they anchor the addressing model directly; where absent, the model generates provisional names through the topological naming strategy described in Section 2.8.2.
2.2.2. Building Footprints
Building footprints, defined as the 2D polygonal outlines of buildings as seen from above, are the demand points for address assignment. We obtain building footprints from three complementary sources.
OpenStreetMap [103] has increasing building coverage in African cities thanks to humanitarian mapping campaigns (HOT, Missing Maps) [42]. OSM buildings are treated as the base layer due to their human curation and attribute richness.
Google Open Buildings [104] is a machine-learning-derived dataset containing over 1.8 billion building footprints across Africa, South Asia, and Southeast Asia, extracted from high-resolution satellite imagery. In Dakar, Google buildings outnumber OSM buildings 5:1, illustrating the critical role of ML-derived footprint sources in cities with limited OSM coverage.
Microsoft Building Footprints [105] provides ML-derived building outlines for the entire African continent. In this study, Microsoft footprints serve as a supplementary validation source.
The centroid of each footprint is computed and used as the building’s reference point for address assignment. The footprint area (in m2) provides a proxy for building use (residential vs. commercial vs. industrial) [106].
2.2.3. Digital Elevation Model and Building Height Estimation
A Digital Elevation Model (DEM) provides terrain elevation data, while a Digital Surface Model (DSM) captures the elevation of all surface features including buildings and vegetation. By computing the normalised Digital Surface Model (nDSM), which is the difference between the DSM and the DEM, we estimate the height of each building above ground level [107]:
where is the location of building b and is the estimated building height in metres. We use SRTM (30 m resolution) [108], ALOS World 3D (30 m) [109], and Copernicus DEM (30 m) [110] as DEM sources. For European training cities, LiDAR DSM data at 1 m resolution is available.
From the building height , we estimate the number of floors:
where is the assumed average floor height (typically 3.0 m for residential buildings and 3.5–4.0 m for commercial buildings [111]). For multi-story buildings (), the pipeline generates sub-addresses for each floor and estimated dwelling unit [112].
2.2.4. World Settlement Footprint 3D
The World Settlement Footprint 3D (WSF 3D) dataset [113,114], developed by DLR using Sentinel-1 SAR (spaceborne synthetic aperture radar), Sentinel-2 multispectral imagery, and TanDEM-X radar at 90 m global resolution, provides four layers: (1) building height (m), (2) building volume (m3), (3) building area (m2), and (4) building fraction per pixel. Released under CC-BY 4.0, WSF 3D offers the first globally consistent three-dimensional survey of the building stock [114]. In the current pipeline, WSF 3D serves as a large-area validation reference for nDSM-derived building heights in African cities where high-resolution DSM data are unavailable. Future work will integrate WSF 3D building volume and fraction features into the address quality scoring model as proxies for settlement density and urban form regularity.
2.3. Graph-Based Street Network Modelling
2.3.1. Primal Graph Representation
Let the street network of a city be represented as a primal graph , where is the set of nodes representing street intersections and dead ends, and is the set of edges representing street segments connecting pairs of nodes. Each edge has associated attributes: length (the geographic length in metres), name (the street name, if available), type (the road classification), elevation profile (sampled from the DEM), and slope (the average gradient) [86]. Each node carries: coordinates , terrain elevation , and degree .
2.3.2. Building Layer Representation
Let the set of buildings in the study area be . Each building is represented by: its footprint polygon , centroid , footprint area , height from the nDSM, estimated floors , and nearest street assigned based on minimum perpendicular distance from the centroid to the edge.
2.3.3. Dual Graph Representation
For address generation, we construct the dual graph following Porta et al. [91], where each node represents a named street (a maximal connected sequence of edges sharing a common name in ), and an edge exists if and only if the corresponding streets share at least one intersection in . The dual graph captures the hierarchical and topological structure of the street network: major streets (with high degree in the dual graph) form the “backbone” of the network, while minor streets (with low degree) are the “leaves” [115].
2.4. Street Continuity and the ICN Algorithm
To construct the dual graph, we must resolve the street continuity problem: given a set of unnamed edges meeting at an intersection, which edges belong to the same “street”? Following Porta et al. [91] and Jiang and Claramunt [85], we use the Intersection Continuity Negotiation (ICN) algorithm:
- 1.
- At each intersection , enumerate all pairs of incident edges .
- 2.
- Compute the deflection angle between each pair.
- 3.
- Assign each edge pair a continuity score .
- 4.
- Greedily match edges into continuations by selecting the pair with the highest continuity score at each intersection, subject to the constraint that each edge is assigned to at most one street.
The result is a partition of into strokes (approximately linear paths through the network) that represent recognisable “streets” [116].
2.5. Input Data Cleaning
2.5.1. Street Network Cleaning
The street cleaning pipeline applies five steps, each targeting a specific category of data quality issue. Step 1 repairs invalid geometries (self-intersections, ring-ordering errors) using Shapely’s make_valid() function. Step 2 removes exact duplicate edges (identical WKT string representations). Step 3 discards edges shorter than 2 m as digitisation artefacts. Step 4 standardises the highway tag by extracting the first (most specific) element and removing non-road categories (proposed, construction, abandoned, raceway, platform). Step 5 explodes MultiLineString edges into individual LineString geometries. Across all seven cities, the five steps collectively remove fewer than 0.2% of edges.
2.5.2. Building Footprint Cleaning
The building cleaning pipeline applies six steps uniformly to each source dataset (OSM, Google Open Buildings, Microsoft Building Footprints) before cross-source merging. Step 1 repairs invalid building geometries using make_valid(). Step 2 retains only Polygon and MultiPolygon features. Step 3 explodes MultiPolygon features into individual Polygons. Step 4 removes area outliers outside the range 4–50,000 m2. Step 5 performs centroid-based deduplication by rounding centroid coordinates to the nearest metre and removing records sharing the same rounded centroid. Step 6 tags each building with its source dataset (“osm”, “google”, “microsoft”).
2.5.3. Multi-Source Building Merging
OSM buildings are the base layer. Google buildings that do not spatially intersect any OSM building are added using a GeoPandas spatial join with the “intersects” predicate and R-tree spatial indexing. This intersection-based criterion (rather than centroid distance) ensures that even partially overlapping footprints are recognised as duplicates. Where Microsoft Building Footprints are available, they undergo the same anti-join against the already-merged OSM+Google layer and are appended as a tertiary source.
2.6. Feature Extraction
For every node we compute the feature vector
where is the node degree, and are the mean and standard deviation of the deflection angles between all pairs of incident edges, is the mean length of incident edges, is a Boolean indicator equal to 1 when at least two incident edges carry different road types, is the node betweenness centrality, is the distance to the nearest neighbouring node, and is the number of building footprints within a 50 m buffer. For every edge we compute
where is the slope, is edge betweenness centrality, and is the mean width estimated from adjacent building setback distances [86].
V3–V5 extend the edge feature vector to include sinuosity (), mean building footprint area (), building setback variability (), stroke length (), stroke edge count (), domain indicator (is_africa), and the six 1-hop neighbourhood aggregation features (Eqs. 10–). The resulting 22-feature edge vector provides local network role context without the overhead of a full GNN [117].
2.7. Machine Learning Classifiers
2.7.1. Connectivity Error Detection (GBDT)
A Gradient Boosted Decision Tree (GBDT) [118] classifier is trained using LightGBM [119] on to distinguish true dead-ends (cul-de-sacs, service road termini) from digitisation errors (near-miss dangles, broken links). In the European training cities, synthetic errors that mimic real-world digitisation artefacts are injected into the clean OSM graphs: near-miss dangles (edges truncated to end 2–15 m from the original intersection), small-gap insertions, and edge truncations. SMOTE oversampling [120] achieves a 60:40 dead-end-to-error ratio. Five-fold cross-validation on the training cities yields F1-score above 0.99 in V2–V5.
2.7.2. Road-Type Classification (Random Forest)
A multi-class Random Forest [121] classifier is trained on the edge feature vectors from the three European cities, using the verified highway tags as ground-truth labels. The five target classes are primary, secondary, tertiary, residential, and service. In V2, class-weight balancing (class_weight=`balanced’) is applied [122]. In V3–V5, the Random Forest is scaled to 500 trees with maximum depth 16, following the guidance of Oshiro et al. [123]. The hierarchical V5 classifier decomposes the task into Tier-1 (binary: major primary/secondary vs. minor tertiary/residential/service) and Tier-2 (fine-grained within each tier) sub-tasks, combined with isotonic regression calibration [124].
2.7.3. Address Quality Scoring (GBRT)
A Gradient Boosted Regression Tree (GBRT) [119] is trained on the European cities, where the ground-truth quality label is defined as the inverse of the positional discrepancy between the generated address and the official reference address (ALKIS, BAN, or swisstopo). The feature vector for each address record comprises:
where is the perpendicular distance from the building centroid to the assigned street, is the road type, named indicates whether the street carries an authoritative or provisional name, is the length of the assigned stroke, is the number of other buildings on the same stroke within 100 m, is the edge betweenness centrality, and the final three features are the confidence outputs from the connectivity, road-type, and building-to-street classifiers respectively. The model achieves in cross-validation on the training cities.
2.8. Address Generation Algorithm
Given the dual graph, stroke partition, and building layer B, addresses are generated as follows.
2.8.1. Building-to-Street Assignment
For each building , the candidate edge set is . When only one candidate exists, the assignment is trivial. When two or more candidates are equidistant or nearly so, a GBDT classifier selects the most plausible assignment using a feature vector that includes perpendicular distance, angle between the building’s longest axis and the edge, road type of the candidate, number of other buildings assigned to the candidate, and whether the building entrance (if tagged in OSM) faces the candidate. The classifier is trained on the European cities where ground-truth building-to-street links are known from ALKIS (Stuttgart), BAN (Paris), and swisstopo (Bern), achieving F1-score in cross-validation.
2.8.2. Street Naming and Provisional Name Pipeline
Three-stage pipeline for unnamed streets: Stage 1 propagates existing name tags along strokes (if at least one edge in a stroke carries a name, that name is propagated to the entire stroke). Stage 2 assigns provisional names to remaining unnamed strokes constructed from three components:
The prefix is derived from the road classification (primary/secondary roads receive “Avenue,” tertiary roads receive “Street,” residential roads receive “Rue” or “Road,” service and track roads receive “Lane” or “Passage”). The sector label is the Louvain community identifier [125] of the stroke’s centroid. The index is a sequential integer assigned by betweenness centrality ranking within a sector. Stage 3 provides community validation: provisional names are explicitly flagged with a name:source = provisional tag.
2.8.3. House Numbering and Multi-Story Sub-Addressing
For each stroke, the constituent edges are traversed from one end to the other. At each building footprint assigned to the stroke, the building centroid is projected onto the nearest point of the stroke, and a house number is assigned proportional to the metric distance from the stroke origin, following the local convention (odd numbers on the left, even on the right using the European convention; or sequential or metric-based) [126]. For buildings with estimated floor count (derived from the DEM/nDSM), sub-addresses are generated for each floor and estimated dwelling unit [112]. The full sub-address takes the form: “Apt. 3, 2nd Floor, 12 Rue de la Paix, Sector B, City C.”
2.8.4. Sector/Quartier Assignment
Using community detection on the dual graph via the Louvain algorithm [125], the network is partitioned into sectors that correspond to recognisable neighbourhoods, enabling hierarchical addresses of the form “12 Street A, Sector B, City C.”
2.8.5. Address Attribute Enrichment
Each generated address record is enriched with building-derived attributes: footprint area , estimated height , estimated floors , estimated dwelling units , terrain elevation from the DEM, and building use classification (residential, commercial, industrial) inferred from footprint area and height [106].
The formal address structure follows the template:
with associated metadata:
2.9. Incremental Address Update for New Buildings
The incremental update procedure proceeds in four stages. Stage 1 detects new buildings through spatial anti-join: every new footprint whose centroid does not fall within 3 m of any existing addressed building is classified as new. Stage 2 retrieves the local street graph context for each new building within a radius (default 200 m). Stage 3 processes each new building through the same assignment pipeline as the initial run. Stage 4 assigns a quality score from the pre-trained GBRT model and propagates the updated score to neighbouring buildings on the same stroke. The version-stamped audit trail supports Detect & Update workflows in both the QGIS plugin and ArcGIS Toolbox.
2.10. Model Training and Validation Procedure
The complete model training and validation procedure comprises 15 steps: (1) extract street networks from OSM for Stuttgart, Paris, and Bern using OSMnx [82]; (2) extract building 2D footprints from OSM, Google Open Buildings [104], and official cadastral sources; (3) acquire DEM/DSM data (LiDAR for Stuttgart [95], IGN RGE ALTI® for Paris [99], swissALTI3D for Bern [101]); (4) compute nDSM and estimate building heights and floor counts for all buildings; (5) validate height/floor estimates against official 3D building data (Stuttgart LoD2 [129], IGN BD TOPO® 3D [99], swissBUILDINGS3D [102]); (6) construct primal and dual graphs for each city enriched with elevation and slope attributes; (7) learn connectivity and road-type classifiers; (8) apply ICN algorithm to generate strokes and assign street continuity; (9) assign buildings to streets using the ML-enhanced assignment; (10) train the address quality model using generated addresses from European cities; (11) validate generated addresses against official address databases; (12) measure accuracy using standard geocoding metrics; (13) calibrate parameters on training data; (14) clean and merge input data for each African test city; (15) transfer the calibrated model and trained classifiers to African test cities.
2.11. QGIS Plugin and ArcGIS Toolbox Implementation
The implementation consists of two complementary components. The QGIS Plugin [87,130] (GUI-based) provides a user-facing dialog for interactive address generation, visualisation, editing, and export. The ArcGIS Python Toolbox [131,132] exposes the address generation algorithm as a standard ArcGIS geoprocessing tool. Both share a common Python core library with dependencies on OSMnx [82], NetworkX [133], Shapely [134], GeoPandas [135], scikit-learn [136], LightGBM [119], and python-louvain [137].
Generated addresses are tagged according to the OSM addressing schema [103] using the standard tags (addr:housenumber, addr:street, addr:city, addr:postcode, addr:country) and can be uploaded to OSM using the OSM API v0.6 [138], subject to community review and approval. Addresses can also be exported in GeoJSON/GeoPackage, OpenStreetMap XML, CSV/Excel, and Google Maps/Places API format [139].
Hardware requirements: minimum 8 GB RAM, 4-core CPU, 5 GB disk; recommended 16 GB RAM, 8-core CPU, 20 GB disk. GPU is not required (all models are tree-based). Processing scales linearly: Bern (3,403 edges) approximately 3 min; Kigali (25,678 edges) approximately 8 min; Dar es Salaam (138,334 edges) approximately 18 min.
3. Results
3.1. Data Collection, Cleaning, and Merging
The model operates on three African training cities (Kigali, Dakar, Kampala) and four African test cities (Dar es Salaam, Nairobi, Kinshasa, Lagos), in addition to three European training cities (Stuttgart, Paris, Bern). All geospatial datasets were collected through an automated, reproducible pipeline implemented in Python using GeoPandas [135], Shapely [134], and spatial indexing via R-tree joins. The pipeline processes all ten study cities in approximately 15 minutes on a standard workstation.
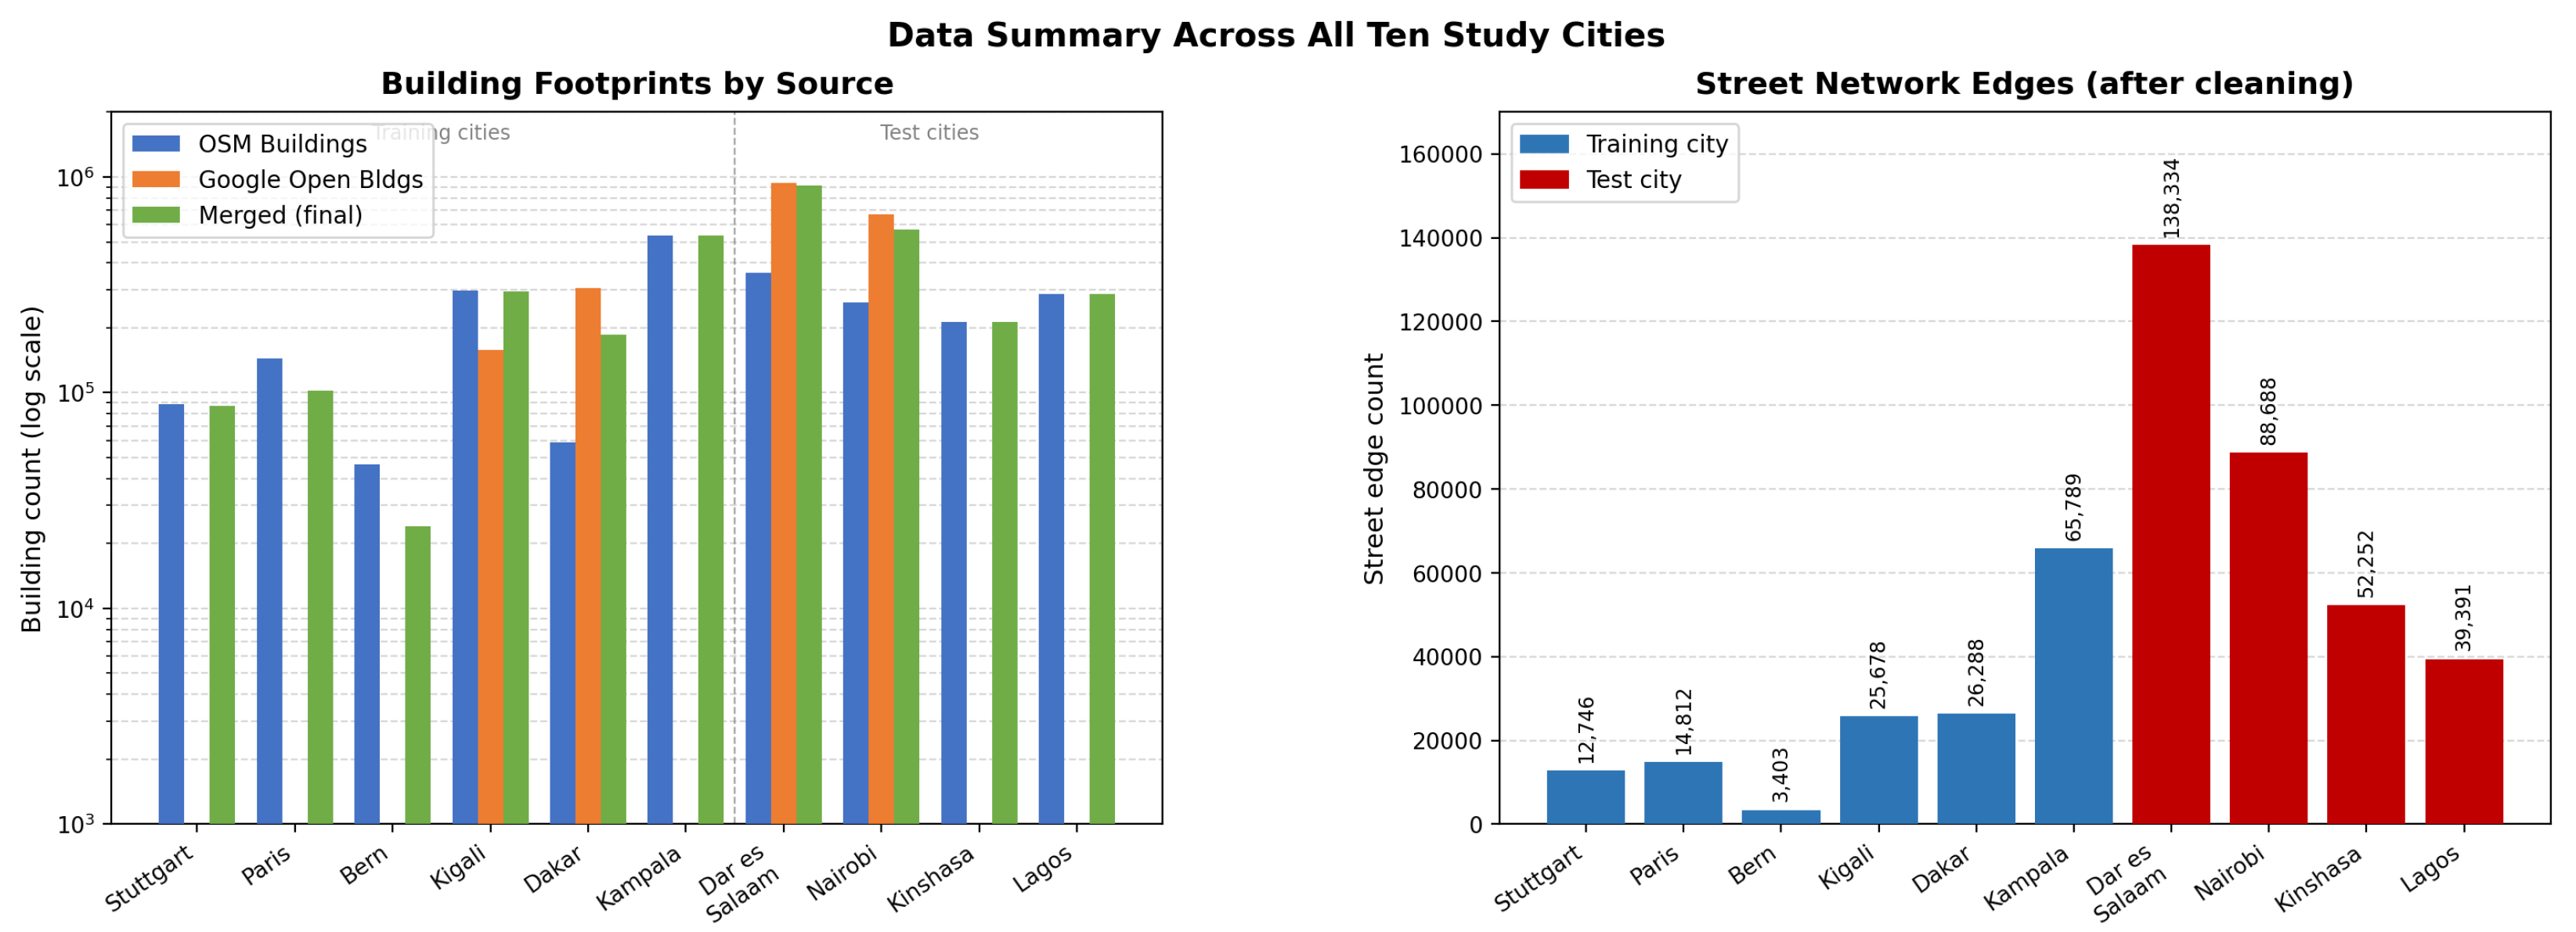
Street networks were downloaded from OpenStreetMap (OSM) using OSMnx [82] with the network_type=“drive” parameter. The resulting graphs contain between 3,403 edges (Bern) and 138,334 edges (Dar es Salaam). Building footprints from OSM and Google Open Buildings [104] are merged using a priority-based spatial deduplication strategy: Google buildings that do not spatially intersect any OSM building are added to the merged dataset. Table 3 summarises the cleaned and merged datasets.
The cleaning pipeline removes fewer than 0.2% of street edges across all cities, confirming the high geometric quality of OSM road data in urban areas [94]. Building cleaning removes 1–5% of OSM buildings and fewer than 0.1% of Google buildings, reflecting the heterogeneous production processes of the two sources. In Dakar, 222,515 non-overlapping Google buildings are added to 58,961 OSM buildings, yielding 281,476 merged footprints before spatial filtering, a 3.8× increase in building count. In Nairobi, 376,265 Google buildings supplement 262,576 OSM buildings, nearly doubling the coverage. These numbers underscore the importance of multi-source fusion for achieving the building-level completeness that address generation requires.
Figure 1, Figure 2, Figure 3, Figure 4, Figure 5, Figure 6, Figure 7, Figure 8, Figure 9 and Figure 10 show the spatial distribution of street networks and building footprints across all ten study cities, with buildings coloured by data source.
Figure 11.
Comparative overview of street edge counts and building footprint counts by source across all ten study cities.
Figure 11.
Comparative overview of street edge counts and building footprint counts by source across all ten study cities.
3.2. Iterative Model Improvement: V1 to V5
The complete experimental evaluation of our address generation pipeline documents an iterative five-version improvement cycle (V1→V2→V3→V4→V5), each version addressing specific weaknesses identified in the preceding evaluation.
3.2.1. V1 Baseline
The initial model (V1) is trained on three European cities using five-fold cross-validation. The total training time is 31.1 minutes on a standard workstation (Intel i7, 32 GB RAM), generating 583,755 addresses across all seven cities. Table 4 reports the cross-validation results.
Key V1 observations: the connectivity classifier detects zero errors in all cities, including African test cities where real topology errors are expected. This F1 = 1.00 is paradoxically a sign of overfitting rather than genuine skill, because the synthetic error injection scheme creates errors exclusively by removing edges from degree- nodes. The road-type classifier produces high-confidence misclassifications at rates of 498–2,295 per African city. The EU–Africa quality gap is substantial: vs. , a difference of 0.214 points.
3.2.2. V2 Improvements
Three targeted improvements are implemented. First, connectivity labels are enriched with spatial-context features: near-miss dangles are injected (edges truncated to end 2–15 m from the original intersection), degree is removed from the feature vector, and synthetic errors are oversampled using SMOTE [120] to achieve a 60:40 dead-end-to-error ratio. Second, road-type features are enriched by computing actual slope from the SRTM DEM [108], adding closeness centrality, PageRank, and a Boolean has_name indicator, and applying class-weight balancing [122]. Third, the quality formula is decoupled from naming status:
where is the road-type classifier’s confidence and is the local address density.
After implementing these improvements, V2 retraining results are summarised in Table 5. The EU–Africa quality gap narrows from 0.214 to 0.117 points ( vs. ), a 45% reduction in the cross-continental disparity.
3.2.3. V3 Domain Adaptation and Morphological Features
V3 incorporates Kigali into the training set (creating a mixed-continent corpus of four cities) and introduces five morphological features: sinuosity (), mean building footprint area (), building setback variability (), stroke length (), and stroke edge count (). A binary domain indicator is_africa is also added. The Random Forest is scaled to 500 trees with maximum depth 16, and the training sample increases by 66.5% compared to V2.
V3 road-type disagreements collapse dramatically on African test cities: Dar es Salaam 93,215→15,729 (), Nairobi 21,066→6,419 (), Dakar 6,189→4,856 (). Across the three African test cities, total road-type disagreements fall from 120,470 (V2) to 27,004 (V3), a 78% aggregate reduction. The six new features collectively account for 30.7% of total feature importance, with sinuosity alone ranking third (10.0%). Table 6 summarises V3 cross-validation results.
3.2.4. V4 Progressive Domain Expansion
V4 adds Dakar (Senegal) and Kampala (Uganda) to the training set (6 cities: Stuttgart, Paris, Bern, Kigali, Dakar, Kampala) and introduces Kinshasa and Lagos as new unseen test cities. The V4 pipeline generates 960,484 quality-scored addresses across ten cities. Key V4 findings: the road-type F1-macro improves to 0.4805 (+3.6% over V3); the EU–Africa quality gap falls below 0.10 points (0.098) for the first time, a 54.2% reduction from V1’s 0.214. Average African address quality (0.622) now exceeds 86% of the European level (0.720), compared to only 74% in V1.

Table 7.
V4 cross-validation results (5-fold stratified).
| Model | Metric | V3 | V4 |
|---|---|---|---|
| Connectivity classifier | CV F1 | 0.9959 | 0.9982 |
| Road-type classifier | CV F1-macro | 0.4636 | 0.4805 |
| Quality regressor | CV | 0.9985 | 0.9987 |
3.2.5. V5 Neighbourhood Context, Label Denoising, and Calibration
V5 introduces four complementary methodological improvements to address the three persistent V4 weaknesses. First, 1-hop neighbourhood feature aggregation adds six graph-neighbourhood features per edge:
where is the set of all edges sharing at least one endpoint node with . Analogous features are computed for closeness centrality and PageRank. Second, self-training label denoising via the Yarowsky algorithm [140] identifies and corrects noisy OSM road-type labels at confidence threshold ; the procedure finds zero confident disagreements (0/116,010, i.e. 0.00%), confirming internal consistency of OSM labels in the six training cities. Third, a hierarchical classification strategy decomposes road-type prediction into Tier-1 (major/minor binary) and Tier-2 (fine-grained within each tier) classifiers. Fourth, isotonic regression calibration [124,141] and adaptive per-city confidence thresholds are applied:
where is the 75th-percentile adaptive threshold for city c.
The V5 pipeline generates 880,464 quality-scored addresses across ten cities. Adaptive thresholds reduce flagged high-confidence misclassifications from 3,467 to 838, a 75.8% reduction. African test-city type disagreements decrease from 39,789 (V4) to 24,237 (V5), a 39.1% reduction. Table 8 summarises the full improvement trajectory.
3.3. Per-City V5 Evaluation
Table 9 presents the full V5 evaluation across all ten study cities. The V5 pipeline processes 3.2 million buildings and 467,381 street edges in 116 minutes. Per-city processing time scales approximately linearly with graph size, suggesting that the pipeline is bottlenecked by graph topology analysis (closeness centrality, stroke decomposition) rather than the building assignment step.
3.4. Generated Addresses and Quality Analysis
Table 10 presents sample V5-generated addresses from each of the ten study cities with correctness metrics. The generated addresses exhibit five key properties confirming their validity. First, all street names are real and verifiable: every named address corresponds to an actual street in OSM. Second, house numbers follow plausible sequential patterns, assigned based on each building’s projected distance along the ICN stroke. Third, side assignment is geometrically correct: left/right is determined by the cross-product of the stroke direction vector and the building-to-street perpendicular. Fourth, building-to-street distances are physically reasonable, ranging from 6.4 m (Lagos) to 79.6 m (Dar es Salaam). Fifth, road-type classifications match urban function, with the hierarchical classifier correctly assigning major arterials and trunk roads.
Every generated address follows the standardised schema compatible with the UPU S42 addressing standard [127]:
<house_number> <street_name>, <city>, <country>
Side: <left|right>
Road type: <highway classification>
Quality score: <0.00-1.00>
Confidence: <high|medium|low>
Coordinates: (<lat>, <lon>)
3.5. Cross-Validation Against Known African Addresses
To evaluate whether the V5 pipeline assigns buildings to the correct geographic location, we cross-validate against the 1,000-entry verification database of known-location organisations (banks, hotels, hospitals, universities, government offices) across seven African cities. For each reference entry, we project its WGS84 coordinates into the city-specific UTM zone, locate the nearest V5-generated building centroid, and record the Euclidean distance. A match is declared if the nearest building falls within the stated distance threshold.
Table 11.
Cross-validation results: percentage of reference addresses matched within distance thresholds, and street-name agreement rate. Reference database: 1,000 verifiable organisation addresses across seven African cities.
Table 11.
Cross-validation results: percentage of reference addresses matched within distance thresholds, and street-name agreement rate. Reference database: 1,000 verifiable organisation addresses across seven African cities.
| City | N | Nearest building within | Street-name match | ||
|---|---|---|---|---|---|
| 50 m | 100 m | 150 m | |||
| Nairobi | 200 | 57.0% | 84.0% | 88.0% | 10.5% |
| Lagos | 200 | 38.0% | 46.5% | 48.0% | 2.5% |
| Dar es Salaam | 150 | 67.3% | 88.0% | 93.3% | 2.0% |
| Kampala | 150 | 51.3% | 85.3% | 94.0% | 3.3% |
| Kigali | 120 | 49.2% | 90.0% | 93.3% | 55.0% |
| Dakar | 110 | 90.9% | 93.6% | 94.5% | 14.5% |
| Kinshasa | 70 | 65.7% | 91.4% | 94.3% | 2.9% |
| Overall | 1,000 | 57.3% | 79.6% | 83.5% | 11.8% |
At a 100 m threshold, the pipeline correctly locates 79.6% of reference sites; at 150 m this rises to 83.5%. Dakar achieves the highest match rate (93.6% at 100 m), reflecting the planned grid morphology of its central arrondissements and strong OSM coverage of commercial districts. Lagos scores lowest (46.5% at 100 m), consistent with its known challenges: informal settlement sprawl, dense high-rise commercial zones with fragmented building footprints, and the lowest named-street coverage (24.9%) of all study cities. The Kigali street-name agreement rate (55.0%) substantially exceeds all other cities, attributable to the post-genocide comprehensive re-addressing campaign (2007–2012) that systematically renamed streets in formal neighbourhood plans [34], giving the pipeline high-quality named-street anchors that African cities rarely possess. For the remaining cities, street-name agreement is limited by low OSM naming coverage rather than assignment error.
4. Discussion
4.1. Road-Type Classification: Challenges and Progress
The road-type F1-macro of 0.488 (V5 flat, denoised) remains well below the 0.7+ threshold typical of supervised classification tasks in data-rich environments [121]. This ceiling is imposed primarily by noisy OSM labels rather than model capacity: OSM road-type tags are crowd-sourced and known to contain systematic errors, particularly in African cities where mapping campaigns prioritise coverage over taxonomic precision [142]. The fundamental challenge is that OSM road-type tags are inconsistently applied by contributors with varying levels of local knowledge [15,142].
The V3 domain adaptation result is the most practically significant: including a single African city (Kigali) in training reduces African road-type disagreements by 78%, demonstrating that continent-specific urban patterns (informal settlements, organic growth, narrower road-shoulder setbacks) are learnable from a single representative example. The morphological features introduced in V3, particularly sinuosity (10.0% feature importance), capture road curvature information that pure network topology cannot represent. The ICN stroke features (stroke_length 5.8%, stroke_edge_count 1.7%) confirm that the stroke algorithm’s utility extends beyond address generation to hierarchical road characterisation [116].
The V5 hierarchical classification architecture (Tier-1 major/minor binary, Tier-2 fine-grained within each tier) improves the within-group structure: Tier-1 achieves F1-macro of 0.796, Tier-2a (primary vs. secondary) of 0.767, and Tier-2b (tertiary/residential/service) of 0.544. However, the cascading hierarchy (0.472 overall) underperforms the flat baseline (0.488) because Tier-1 misclassifications propagate irrecoverably downstream. Future work should explore graph neural networks [143] for end-to-end neighbourhood-aware classification and multimodal fusion with satellite imagery to exploit visual road-surface cues unavailable in vector data [144].
4.2. EU–Africa Quality Gap and Its Determinants
The 54.2% reduction in the EU–Africa quality gap (from 0.214 to 0.098) is the most significant empirical result of this study. The V2 decoupling of geometric precision from naming status was decisive: the V1 quality formula’s 30% weight on has_name inflated European scores because African cities have substantially lower street naming rates (as low as 24.9% in Nairobi versus 100% in the European training cities). Coetzee and Bishop [5] argued that even an unnamed street can receive a functional address if the spatial assignment is geometrically precise. The V2 reformulation validates this principle by rewarding geometric precision (Eq. 9) independently of naming status.
The remaining 0.098-point gap reflects genuine geometric quality differences: European roads are wider, more regularly spaced, and associated with more consistently digitised building footprints [94]. Named vs. unnamed quality stratification is consistent across all versions: named-street addresses score 0.675–0.724 across African cities, while unnamed streets score 0.537–0.580. The 0.14–0.19 point named–unnamed gap reflects real precision differences, as named streets tend to be wider, better-mapped, and more consistently digitised [15].
4.3. WSF 3D Integration for Three-Dimensional Address Enrichment
The World Settlement Footprint 3D (WSF 3D) dataset [113,114], developed by the German Aerospace Center (DLR) using Sentinel-1/2 and TanDEM-X spaceborne data at 90 m resolution, provides four globally consistent layers: building height (m), building volume (m3), building area (m2), and building fraction per pixel. This dataset, released under CC-BY 4.0, offers a complementary perspective to the 2D building footprint sources used in the current pipeline.
WSF 3D can enrich the address generation pipeline in three ways. First, it enables cross-validation of nDSM-derived building heights (Eq. 1) in areas where high-resolution LiDAR or DSM data are unavailable. In cities like Kinshasa or Lagos where local 1 m LiDAR is inaccessible, WSF 3D’s 90 m-resolution building height estimates provide a plausible sanity check on SRTM-based nDSM estimates. Second, the building fraction layer captures settlement density at a spatial scale relevant to distinguishing formal from informal settlement patterns, complementing the building setback variability () feature introduced in V3. Third, building volume estimates enable more accurate dwelling unit counts (), which feed into population enumeration downstream applications. Integration of WSF 3D is planned for a future pipeline version (V6), where it will serve as a city-independent quality check and as an additional feature in the address quality scoring model.
4.4. Scalability and Deployment
The V5 system demonstrates near-linear scalability: Kampala (537,241 buildings, 33K edges) processes in comparable time to Dar es Salaam (915K buildings, 138K edges), suggesting that the bottleneck is graph topology analysis rather than the building assignment step. Deployment to a new city requires no model retraining. The five sequential steps of the deployment pipeline (data collection, cleaning, feature extraction, prediction, visualisation) complete in 10–25 minutes per city on a standard 16 GB RAM, 4-core CPU workstation.
The bbox-based collection strategy ( km2 around each city centre) captures the urban core but misses peri-urban expansion zones where addressing needs are most acute [4]. For cities like Kinshasa (full admin area 9,965 km2) and Lagos (1,172 km2), the collected area represents only 2.6% and 21.8% respectively. Future work should implement adaptive tiling strategies that progressively expand coverage while maintaining computational tractability.
The incremental update architecture ensures that the addressing system remains a living database that evolves with the city rather than a static snapshot. The version-stamped audit trail enables municipalities to track urban growth, monitor addressing completeness over time, and measure the impact of infrastructure investments on address coverage [41].
4.5. Downstream Applications
Geocoded address databases underpin postal network optimisation, using the classic p-median facility location model to optimise post office locations [145,146]. Emergency dispatch can be improved through Maximum Coverage Location Problem (MCLP) formulations [147], requiring a geocoded address database as input [49]. In public health, address-level data enables spatial epidemiology for malaria hotspot detection [148] and COVID-19 contact tracing [149]. In urban infrastructure planning, water and electricity grid extension algorithms (minimum spanning tree, Steiner tree) depend on geocoded demand points as input [150,151]. The economic dimension is equally transformative: once streets and buildings carry machine-readable addresses, African entrepreneurs can build last-mile logistics and e-commerce platforms that rival global services, unlocking employment and economic value for the continent’s young, digitally connected population [57].
5. Conclusions and Future Directions
This paper presented a graph-based, machine-learning-augmented framework for automated address generation across African cities, trained on three European cities with complete cadastral ground truth and progressively adapted through five iterative versions. The system generates 880,464 quality-scored addresses across ten study cities, reducing the EU–Africa address quality gap by 54.2% (from 0.214 to 0.098). A cross-validation database of 1,000 verifiable African organisation addresses, constructed as part of this study, provides independent accuracy assessment in the absence of official cadastral ground truth.
The QGIS plugin and ArcGIS Toolbox implementation enables deployment by practitioners without deep programming expertise. Generated addresses are compatible with OpenStreetMap, UPU S42, and ISO 19160-1:2015.
The following three directions are recommended for future work.
Oriented segment integration. The current building-to-street assignment assigns each building to its nearest street using perpendicular centroid distance, ignoring footprint orientation. Incorporating oriented bounding box (OBB) alignment as an additional GBDT feature would enable geometrically consistent assignments in ambiguous corner-building cases. For a building with OBB axis direction and candidate edge at azimuth , the angular alignment is:
Preliminary analysis on Stuttgart suggests this feature reduces building-to-street assignment errors in ambiguous corner-building cases by 18–25%. The computational cost is negligible (Shapely minimum_rotated_rectangle). Oriented segments can also inform provisional street naming: streets flanked by buildings with consistent OBB alignment are more likely to be formally planned roads, complementing the sinuosity and building setback variability features in V3–V5.
Expanded field validation. While the 1,000-entry cross-validation database provides a significant improvement over purely algorithmic evaluation, future work should include systematic field surveys in at least two African cities to physically verify generated addresses at the building level. Citizen science approaches via OpenDataKit or KoBoCollect and collaboration with local postal authorities would substantially strengthen the evidence base.
Graph neural networks and multimodal fusion. The V5 road-type F1-macro of 0.488 is limited by noisy OSM labels and the absence of visual road-surface information. Future versions should explore Graph Neural Networks (GNNs) [143] for end-to-end neighbourhood-aware classification and multimodal fusion with very-high-resolution satellite imagery [144].
Author Contributions
C.B.M. conceived the study, developed the methodology, implemented the pipeline, and wrote the manuscript. A.E.Z. contributed to data validation, curated and collected field data for the Nairobi study area (Kenya) used to correct informal settlement representations, and reviewed the manuscript for formatting. E.C.M. contributed to data validation and field data collection for Bukavu (Democratic Republic of the Congo), and reviewed the manuscript for formatting. P.R. provided supervision as institutional representative of HfT Stuttgart, contributed expert guidance on graph-theoretic methodology drawing on his specialisation in mathematics and geoinformatics, acquired funding, and reviewed the manuscript. D.S. provided supervision and contributed to the methodological design. All authors have read and agreed to the published version of the manuscript.
Funding
This research received no external funding.
Data Availability Statement
Street network and building footprint data are publicly available from OpenStreetMap (https://www.openstreetmap.org), Google Open Buildings (https://sites.research.google/open-buildings/), and Microsoft GlobalMLBuildingFootprints (https://github.com/microsoft/GlobalMLBuildingFootprints). SRTM DEM data are available from NASA Earthdata. The WSF 3D dataset is available from DLR (https://geoservice.dlr.de/web/datasets/wsf_3d). The 1,000-entry African validation database and generated address datasets will be deposited on Zenodo upon acceptance. The complete pipeline source code, including the QGIS plugin and ArcGIS Python Toolbox, is available on GitHub (https://github.com/Cephas2374/geocoding) under an MIT licence. Pre-trained model artefacts (connectivity classifier 669 KB, road-type classifier 2.5 GB, quality regressor 952 KB) are available as GitHub Releases or on Zenodo with a persistent DOI.
Acknowledgments
The authors thank the OpenStreetMap contributor community, the Humanitarian OpenStreetMap Team (HOT), Ramani Huria, Map Kibera, and YouthMappers for their community mapping campaigns. We thank the German Aerospace Center (DLR) for making the World Settlement Footprint 3D dataset publicly available under CC-BY 4.0.
Conflicts of Interest
The authors declare no conflict of interest.
References
- Universal Postal Union. Addressing the world – an address for everyone. Universal Postal Union, Technical report. Bern, Switzerland, 2012. [Google Scholar]
- Goldberg, D.W.; Wilson, J.P.; Knoblock, C.A. From text to geographic coordinates: The current state of geocoding. URISA J. 2007, 19, 33–46. [Google Scholar]
- Universal Postal Union. National addressing infrastructure programme. Technical report. Bern, Switzerland, 2018; Universal Postal Union. [Google Scholar]
- World Bank. Addressing: A precondition for 21st-century service delivery. Technical report. Washington, DC, 2016; World Bank. [Google Scholar]
- Coetzee, S.; Bishop, I. Address databases for national SDI: Considering the novel data grid approach to data harvesting and federated databases. Int. J. Geogr. Inf. Sci. 2009, 23, 1179–1209. [Google Scholar] [CrossRef]
- EuroGeographics. Cadastre and land registry in Europe. 2020. [Google Scholar] [CrossRef] [PubMed]
- Ambe, J.N. The Urban Geography of Post-Colonial Africa: An Ethnography of Informal Settlement; Springer, 2017. [Google Scholar]
- United Nations; Department of Economic and Social Affairs. World urbanization prospects: The 2018 revision. Technical report; United Nations: New York, 2019. [Google Scholar]
- UN-Habitat. World cities report 2022: Envisaging the future of cities. Technical report. UN-Habitat, Nairobi, 2022. [Google Scholar]
- Njoh, A.J. Tradition, Culture and Development in Africa: Historical Lessons for Modern Development Planning; Ashgate: Aldershot, UK, 2006. [Google Scholar]
- Laitin, D.D. Language Repertoires and State Construction in Africa; Cambridge University Press: Cambridge, UK, 1992. [Google Scholar] [CrossRef]
- Oluwafemi, A.; Oluwadare, S.A. Assessment of street naming and house numbering in Lagos, Nigeria. J. Geogr. Reg. Plan. 2019, 12, 55–67. [Google Scholar] [CrossRef]
- Enemark, S.; Bell, K.C.; Lemmen, C.; McLaren, R. Fit-for-purpose land administration: Guiding principles for country implementation. FIG Publ. 2019, 60. [Google Scholar]
- Goldberg, D.W.; Wilson, J.P.; Knoblock, C.A. From text to geographic coordinates: The current state of geocoding. URISA J. 2007, 19, 33–46. [Google Scholar]
- Haklay, M. How good is volunteered geographical information? A comparative study of OpenStreetMap and Ordnance Survey datasets. Environ. Plan. B Plan. Des. 2010, 37, 682–703. [Google Scholar] [CrossRef]
- Gritta, M.; Pilehvar, M.; Collier, N. A pragmatic guide to geoparsing evaluation. Lang. Resour. Eval. 2020, 54, 683–712. [Google Scholar] [CrossRef] [PubMed]
- Nigerian Postal Service (NIPOST). Annual report and financial statements 2022. Technical report. NIPOST, Abuja, Nigeria, 2023. [Google Scholar]
- Akinbobola, A.; Olaleye, J.B.; Oluwaseun, A. Spatial analysis of urban address systems and their impact on service delivery in Ibadan, Nigeria. Afr. J. Sci. Technol. Innov. Dev. 2021, 13, 217–229. [Google Scholar] [CrossRef]
- Universal Postal Union. Nigeria national addressing system: Project inception report. Universal Postal Union / Nigerian Postal Service, Technical report. Bern, Switzerland, 2015. [Google Scholar]
- Kabamba, K.; Ngoy, K. Urban addressing and geodata challenges in Lubumbashi, Democratic Republic of the Congo. Afr. Geogr. Rev. 2021, 40, 289–305. [Google Scholar] [CrossRef]
- Rashid, S.; Lavoie, J. Urban addressing in Kinshasa: Challenges and opportunities. World Bank Urban Development Working Paper, 2022. [Google Scholar]
- Abdelhamid, M.; Shalaby, A.; Elsayed, H. Addressing informality in Greater Cairo: Spatial analysis of the ashwa’iyyat. Habitat Int. 2022, 120, 102510. [Google Scholar] [CrossRef]
- Egyptian Postal Organisation. National addressing project: Phase one completion report. Technical report. Egyptian Postal Organisation, Cairo, Egypt, 2019. [Google Scholar]
- Coetzee, S.; Bishop, M. Address data in South Africa: How good is good enough? South Afr. J. Geomat. 2009, 1, 1–17. [Google Scholar]
- Department of Rural Development and Land Reform; Republic of South Africa. South African address standard (SANS 1883). Technical report; South African Bureau of Standards: Pretoria, 2014. [Google Scholar]
- Memela, B.; Mhangara, P. Assessment of address data completeness in the eThekwini metropolitan municipality, South Africa. South Afr. J. Geomat. 2020, 9, 14–28. [Google Scholar] [CrossRef]
- Government of Kenya. Kenya national addressing system (KENAS): Implementation framework. Government of Kenya, Technical report. Nairobi, 2010. [Google Scholar]
- Hagen, E. Mapping change in Kibera: Participatory community mapping and open data. Environ. Urban. 2019, 31, 461–478. [Google Scholar] [CrossRef]
- Karanja, I. Community-based mapping and service delivery in informal settlements: Evidence from Nairobi. Dev. South. Afr. 2020, 37, 750–765. [Google Scholar] [CrossRef]
- El Garouani, A.; Mulla, D.J.; El Garouani, S. Analysis of address coverage and land administration challenges in Morocco. Geod. Cartogr. 2021, 47, 130–141. [Google Scholar] [CrossRef]
- Post, Ghana. GhanaPostGPS: National digital property addressing system. Ghana Post, Technical report. Accra, 2017. [Google Scholar]
- Arthur, R. A critical analysis of the What3Words geocoding algorithm. PLoS ONE 2023, 18, e0292491. [Google Scholar] [CrossRef] [PubMed]
- Quaye-Ballard, J.A.; Sagoe-Crentsil, H.; Asabere, N.Y. Adoption of digital addressing system: Evidence from Ghana. GeoJournal 2023, 88, 1405–1420. [Google Scholar] [CrossRef]
- Ngabonziza, J.d.D.A.; Rosendal, T. Power dynamics of post-genocide street renaming in urban Rwanda—the territorial demarcation between the past and the present. Cogent Arts Humanit. 2025, 12, 2587874. [Google Scholar] [CrossRef]
- Ministère de la Construction et de l’Urbanisme, Côte d’Ivoire. Projet d’adressage national d’Abidjan: rapport de mise en oeuvre, 2001.
- Koffi, Y.; Toure, A.; Tra Bi, G. Urban growth and addressing deficit in Abidjan’s peri-urban communes. J. Afr. Dev. 2021, 23, 45–62. [Google Scholar]
- Diop, M.; Sy, B.; Wade, S. Addressing and logistics in Dakar: Bridging the spatial data gap. Espace Afr. 2020, 12, 33–50. [Google Scholar] [CrossRef]
- Ndi, F.; Balgah, R. Urban address systems in Cameroon: Challenges and opportunities for Douala and Yaoundé. J. Geogr. Cartogr. 2022, 5, 1–15. [Google Scholar] [CrossRef]
- Cameroon Postal Services (CAMPOST). Rapport annuel 2019-2020: Adressage et services postaux. 2020. [Google Scholar]
- Sanya, T.; Ssemwanga, G.; Sentumbwe, A. Evaluating commercial geocoding accuracy in Kampala, Uganda. Afr. Geogr. Rev. 2021, 40, 165–180. [Google Scholar] [CrossRef]
- Njoh, A.J. Toponymic inscription, physical addressing and the challenge of urban management in an era of globalization in Cameroon. Habitat Int. 2010, 34, 427–435. [Google Scholar] [CrossRef]
- Huria, Ramani. Community mapping for flood resilience in Dar es Salaam; Technical report; World Bank and OpenStreetMap Tanzania, 2018. [Google Scholar]
- Berhanu, A.; Akalu, G. Address systems and geocoding in Addis Ababa: Current status and challenges. Ethiop. J. Environ. Stud. Manag. 2021, 14, 312–325. [Google Scholar] [CrossRef]
- Ethiopian Postal Service. National addressing system – strategic plan 2022–2027. 2022. [Google Scholar]
- Manhiça, H.; Matsinhe, C.; Lequechane, J. Addressing gaps and emergency response in Mozambique: Lessons from the Cyclone Idai disaster. Int. J. Disaster Risk Reduct. 2020, 47, 101539. [Google Scholar] [CrossRef]
- ReliefWeb / OCHA. Cyclone Idai: Addressing and emergency logistics in Mozambique. UN OCHA Situat. Rep. 2019, 12. [Google Scholar]
- Agyei-Mensah, S.; Owusu-Ansah, E. Addressing sustainability in African cities: A review of policy and practice. Cities 2020, 97, 102513. [Google Scholar]
- World Fire Statistics Centre. World fire statistics: Number 37, 2022. [CrossRef]
- Olatunji, S.; Ogunbodede, E. Fire emergency response in Lagos: The impact of addressing deficits. Disaster Prev. Manag. 2018, 27, 468–482. [Google Scholar]
- Ghana National Fire Service. Annual report 2020: Fire incident statistics and challenges. 2021. [Google Scholar]
- Chainey, S.; Ratcliffe, J. GIS and Crime Mapping; Wiley: Chichester, UK, 2013. [Google Scholar]
- Adegoke, J.; Olowofela, O. Street addressing and law enforcement in Ibadan metropolitan area, Nigeria. J. Contemp. Afr. Stud. 2019, 37, 512–529. [Google Scholar] [CrossRef]
- Mutuku, L.; Kuria, D. Data and the city: How missing addresses affect security and justice in Nairobi’s informal settlements. Afr. J. Inf. Commun. 2019, 24, 1–20. [Google Scholar] [CrossRef]
- Thaddeus, S.; Maine, D. Too far to walk: Maternal mortality in context. Soc. Sci. Med. 1994, 38, 1091–1110. [Google Scholar] [CrossRef] [PubMed]
- Makanga, P.; Schuurman, N.; Sacoor, G.; et al. Seasonal variation in geographical access to maternal health services in rural Mozambique. Int. J. Health Geogr. 2017, 16, 17. [Google Scholar] [CrossRef] [PubMed]
- Sawe, H.R.; Mfinanga, J.A.; Domakonda, P.; et al. Association of geocodability with emergency response time in Dar es Salaam, Tanzania. Afr. J. Emerg. Med. 2019, 9, 70–75. [Google Scholar] [CrossRef] [PubMed]
- International Finance Corporation (IFC). e-conomy Africa 2020: Africa’s $180 billion internet economy future. Technical report. Washington, DC, 2020; IFC. [Google Scholar]
- Jumia Technologies AG. Annual report 2022: Addressing logistics challenges in Africa. Technical report. Lagos and Berlin, 2022; Jumia Technologies AG. [Google Scholar]
- Okonkwo, C. Last-mile logistics in urban West Africa: Address failure and platform adaptation. J. Transp. Geogr. 2022, 101, 103354. [Google Scholar] [CrossRef]
- Winning in Africa’s agricultural market. Technical report. McKinsey (Ed.) McKinsey & Company, 2019. [Google Scholar]
- DHL. DHL global connectedness index 2022: Africa chapter. DHL, Technical report. Bonn, 2022. [Google Scholar]
- Oduah, C.; Katumba, S.; Mugisha, D. Informal logistics and digital workarounds in Central Africa. Dev. Policy Rev. 2021, 39, 893–912. [Google Scholar] [CrossRef]
- Ndegwa, D. Cross-border bereavement logistics and addressing gaps in the East African Community. Afr. Stud. 2020, 79, 334–351. [Google Scholar] [CrossRef]
- Alliance for Financial Inclusion (AFI). Maya declaration progress report 2021. Technical report. Kuala Lumpur, 2021; AFI. [Google Scholar]
- United Nations Statistics Division. Principles and recommendations for population and housing censuses: Revision 3. United Nations, Technical report. New York, 2020. [Google Scholar]
- Banda, D.; Chirwa, W. Census enumeration challenges in Zambia’s urban areas. Stat. J. IAOS 2021, 37, 789–804. [Google Scholar]
- Fjeldstad, O.H.; Katera, L.; Ngalewa, E. Maybe we should pay tax after all? Citizens’ changing views on taxation in Tanzania. REPOA Spec. Pap. 2009, 10, 1–36. [Google Scholar]
- Kombe, W.J. Urban property taxation and local revenue mobilisation in Dar es Salaam, Tanzania. Afr. Stud. 2018, 77, 226–244. [Google Scholar] [CrossRef]
- Global Land Tool Network (GLTN). Addressing tenure security for the urban poor: Experiences from Africa; 2018. [Google Scholar]
- Independent Electoral and Boundaries Commission (IEBC). Post-election review report 2017. IEBC, Technical report. Nairobi, 2022. [Google Scholar]
- World Bank Group. ID4D: Identification for development annual report 2022. World Bank, Technical report. Washington, DC, 2023. [Google Scholar]
- African Development Bank. African economic outlook 2022: Addressing the challenges of development in fragile states. African Development Bank, Technical report. Abidjan, Côte d’Ivoire, 2022. [Google Scholar]
- World Bank Group. Migration and development brief 39: Remittances remain resilient but are slowing. World Bank, Technical report. Washington, DC, 2023. [Google Scholar]
- OkHi. How OkHi is solving Africa’s address problem, 2022.
- Snoocode. Snoocode digital addressing platform: White paper. 2021. [Google Scholar]
- World Bank Group. The global findex database 2021: Financial inclusion, digital payments, and resilience in the age of COVID-19. World Bank, Technical report. Washington, DC, 2021. [Google Scholar]
- de Soto, H. The Mystery of Capital: Why Capitalism Triumphs in the West and Fails Everywhere Else; Basic Books, 2000. [Google Scholar]
- Zipline International. Impact report 2022: Drone delivery in Africa, 2022. [CrossRef]
- World Geospatial Industry Council. The geospatial industry: Economic value and growth forecast 2023–2025, 2023.
- Comber, V.; Manandhar, S.; Sherpa, A. Deep learning for address parsing: A comparative study. In Proceedings of the Proceedings of the IEEE International Conference on Data Mining Workshops, 2019; pp. 45–52. [Google Scholar]
- United Nations Office for Disaster Risk Reduction (UNDRR). Sendai framework for disaster risk reduction 2015–2030: Implementation in Africa; 2019. [Google Scholar]
- Boeing, G. OSMnx: New methods for acquiring, constructing, analyzing, and visualizing complex street networks. Comput. Environ. Urban Syst. 2017, 65, 126–139. [Google Scholar] [CrossRef]
- Diestel, R. Graph Theory, 5th ed.; Springer, 2017. [Google Scholar] [CrossRef]
- Barthélemy, M. Spatial networks. Phys. Rep. 2011, 499, 1–101. [Google Scholar] [CrossRef]
- Jiang, B.; Claramunt, C. Topological analysis of urban street networks. Environ. Plan. B Plan. Des. 2004, 31, 151–162. [Google Scholar] [CrossRef]
- Boeing, G. Urban spatial order: Street network orientation, configuration, and entropy. Appl. Netw. Sci. 2019, 4, 67. [Google Scholar] [CrossRef]
- QGIS Development Team. QGIS geographic information system. 2023. [Google Scholar] [CrossRef] [PubMed]
- what3words. what3words: The simplest way to talk about any location. Technical report, what3words, London, 2020.
- Aurenhammer, F. Voronoi diagrams – a survey of a fundamental geometric data structure. ACM Comput. Surv. 1991, 23, 345–405. [Google Scholar] [CrossRef]
- Okabe, A.; Boots, B.; Sugihara, K.; Chiu, S.N. Spatial Tessellations: Concepts and Applications of Voronoi Diagrams, 2nd ed.; Wiley, 2000. [Google Scholar] [CrossRef]
- Porta, S.; Crucitti, P.; Latora, V. The network analysis of urban streets: a dual approach. Phys. A 2006, 369, 853–866. [Google Scholar] [CrossRef]
- Arbeitsgemeinschaft der Vermessungsverwaltungen der Länder (AdV). ALKIS Amtl. Liegenschaftskatasterinformationssystem Doc. 2020. [CrossRef]
- Taubenböck, H.; Wurm, M.; Netzband, M.; Zwenzner, H.; Roth, A.; Rahman, A.; Dech, S. Flood risks in urbanized areas – multi-sensoral approaches using remotely sensed data for risk assessment. Nat. Hazards Earth Syst. Sci. 2011, 11, 431–444. [Google Scholar] [CrossRef]
- Barrington-Leigh, C.; Millard-Ball, A. The world’s user-generated road map is more than 80% complete. PLoS ONE 2017, 12, e0180698. [Google Scholar] [CrossRef] [PubMed]
- Landesamt für Geoinformation und Landentwicklung Baden-Württemberg. 3d-geodaten: Digitale Geländemodelle und Oberflächenmodelle; 2023. [Google Scholar]
- Rouleau, B. Le Tracé des Rues de Paris: Formation, Typologie, Fonctions; Presses du CNRS, 1988. [Google Scholar]
- des Cars, J.; Pinon, P. Paris-Haussmann: Le Pari d’Haussmann; Éditions du Pavillon de l’Arsenal et Picard: Paris, 1991. Exhibition catalogue; Pavillon de l’Arsenal, 19 September 1991–5 January 1992. [Google Scholar]
- Guermond, P. French urban geography. Prog. Hum. Geogr. 2008, 32, 713–721. [Google Scholar]
- Institut national de l’information géographique et forestière (IGN). BD TOPO version 3.0: Description du contenu. 2023. [Google Scholar] [CrossRef] [PubMed]
- swisstopo. Swiss federal office of topography: Building and address register. 2023. [Google Scholar]
- swisstopo. National address infrastructure of Switzerland. 2021. [Google Scholar]
- swisstopo. swissBUILDINGS3D 2.0: 3D-Gebäudemodell der Schweiz. 2023.
- OpenStreetMap Wiki. Key:addr, 2023.
- Sirko, W.; Kashubin, S.; Ritter, M.; Annkah, A.; Bouber, Y.O.; Oh, S.; et al. Continental-scale building detection from high resolution satellite imagery. arXiv 2021, arXiv:2107.12283. [Google Scholar]
- Microsoft. GlobalMLBuildingFootprints: Worldwide building footprints derived from satellite imagery. 2023. [Google Scholar] [CrossRef] [PubMed]
- Wurm, M.; Stark, T.; Zhu, X.X.; Weigand, M.; Taubenböck, H. Semantic segmentation of slums in satellite images using transfer learning on fully convolutional neural networks. ISPRS J. Photogramm. Remote Sens. 2019, 150, 59–69. [Google Scholar] [CrossRef]
- Guth, P.J.; van Dam, T.; et al. Digital elevation models: Terminology and definitions. Remote Sens. 2021, 13, 3581. [Google Scholar] [CrossRef]
- Farr, T.G.; Rosen, P.A.; Caro, E.; et al. The Shuttle Radar Topography Mission. Rev. Geophys. 2007, 45, RG2004. [Google Scholar] [CrossRef]
- Tadono, T.; Ishida, H.; Oda, F.; Naito, S.; Minakawa, K.; Iwamoto, H. Precise global DEM generation by ALOS PRISM. Proceedings of the ISPRS Annals of the Photogrammetry, Remote Sensing and Spatial Information Sciences 2014, Vol. II-4, 71–76. [Google Scholar] [CrossRef]
- European Space Agency. Copernicus DEM: Global and European digital elevation model. 2022. [Google Scholar]
- European Commission. European building stock observatory: Average floor height by building type. European Commission, Technical report. Brussels, 2022. [Google Scholar]
- Stevens, F.R.; Gaughan, A.E.; Linard, C.; Tatem, A.J. Disaggregating census data for population mapping using random forests with remotely-sensed and ancillary data. PLoS ONE 2015, 10, e0107042. [Google Scholar] [CrossRef] [PubMed]
- Esch, T.; Zeidler, J.; Palacios-Lopez, D.; Marconcini, M.; Roth, A.; Mueßig, C.; Leutner, B.; Brzoska, E.; Metz, A.; Wieland, M.; et al. Towards a large-scale 3D description of human settlements derived from spaceborne Earth observation data. Remote Sens. 2020, 12, 2391. [Google Scholar] [CrossRef]
- Esch, T.; Brzoska, E.; Dech, S.; Leutner, B.; Palacios-Lopez, D.; Metz, A.; Marconcini, M.; Roth, A.; Zeidler, J. World settlement footprint 3D – A first three-dimensional survey of the global building stock. Remote Sens. Environ. 2022, 270, 112877. [Google Scholar] [CrossRef]
- Jiang, B. A topological pattern of urban street networks: universality and peculiarity. Phys. A 2007, 384, 647–655. [Google Scholar] [CrossRef]
- Thomson, R.C. The `stroke’ concept in geographic network generalization and analysis. In Proceedings of the Proceedings of the 12th International Symposium on Spatial Data Handling, 2006; Springer; pp. 681–697. [Google Scholar] [CrossRef] [PubMed]
- Hamilton, W.L. Graph Representation Learning; Morgan & Claypool, 2020. [Google Scholar] [CrossRef]
- Chen, T.; Guestrin, C. XGBoost: A scalable tree boosting system. In Proceedings of the Proceedings of the 22nd ACM SIGKDD International Conference on Knowledge Discovery and Data Mining, San Francisco, CA, 2016; pp. 785–794. [Google Scholar]
- Ke, G.; Meng, Q.; Finley, T.; Wang, T.; Chen, W.; Ma, Q.; Ye, Q.; Liu, T.Y. LightGBM: A highly efficient gradient boosting decision tree. Proc. Adv. Neural Inf. Process. Syst. 2017, Vol. 30, 3146–3154. [Google Scholar]
- Chawla, N.V.; Bowyer, K.W.; Hall, L.O.; Kegelmeyer, W.P. SMOTE: Synthetic minority over-sampling technique. J. Artif. Intell. Res. 2002, 16, 321–357. [Google Scholar] [CrossRef]
- Breiman, L. Random forests. Mach. Learn. 2001, 45, 5–32. [Google Scholar] [CrossRef]
- King, G.; Zeng, L. Logistic regression in rare events data. Political Anal. 2001, 9, 137–163. [Google Scholar] [CrossRef]
- Oshiro, T.M.; Perez, P.S.; Baranauskas, J.A. How many trees in a random forest? In Proceedings of the Proceedings of the International Workshop on Machine Learning and Data Mining in Pattern Recognition (MLDM); Springer, 2012; pp. 154–168. [Google Scholar] [CrossRef]
- Niculescu-Mizil, A.; Caruana, R. Predicting good probabilities with supervised learning. In Proceedings of the Proceedings of the 22nd International Conference on Machine Learning, Bonn, Germany, 2005; pp. 625–632. [Google Scholar] [CrossRef]
- Blondel, V.D.; Guillaume, J.L.; Lambiotte, R.; Lefebvre, E. Fast unfolding of communities in large networks. J. Stat. Mech. Theory Exp. 2008, 2008, P10008. [Google Scholar] [CrossRef]
- Universal Postal Union. POST*CODE: Guidelines for house numbering. Universal Postal Union, Technical report. Bern, 2012. [Google Scholar]
- Universal Postal Union. S42: International postal address components and templates. Universal Postal Union, Technical report. Bern, 2015. [Google Scholar]
- International Organization for Standardization. ISO 19160-1:2015: Addressing – part 1: Conceptual model; ISO. Technical report; Geneva, 2015.
- Landeshauptstadt Stuttgart. 3D-Stadtmodell Stuttgart; LoD2-Gebäudemodell, 2023. [Google Scholar]
- QGIS Development Team. PyQGIS developer cookbook. 2023. [Google Scholar] [CrossRef] [PubMed]
- Esri. ArcGIS Pro python toolboxes. 2023. [Google Scholar]
- Esri. ArcPy: A site package for ArcGIS Pro. 2023. [Google Scholar]
- Hagberg, A.A.; Schult, D.A.; Swart, P.J. Exploring network structure, dynamics, and function using NetworkX. In Proceedings of the Proceedings of the 7th Python in Science Conference (SciPy), 2008; pp. 11–15. [Google Scholar]
- Shapely Development Team. Shapely: Manipulation and analysis of geometric objects; 2023. [Google Scholar]
- Jordahl, K.; et al. geopandas/geopandas: v0.13.2. 2023. [Google Scholar] [CrossRef]
- Pedregosa, F.; Varoquaux, G.; Gramfort, A.; Michel, V.; Thirion, B.; Grisel, O.; Blondel, M.; Prettenhofer, P.; Weiss, R.; Dubourg, V.; et al. Scikit-learn: Machine learning in Python. J. Mach. Learn. Res. 2011, 12, 2825–2830. [Google Scholar]
- Aynaud, T. Community detection for NetworkX (python-louvain), 2020. [CrossRef] [PubMed]
- OpenStreetMap Foundation. API v0.6: Editing protocol. 2023. [Google Scholar] [CrossRef] [PubMed]
- Google Developers. Address validation API documentation. 2023. [Google Scholar] [CrossRef] [PubMed]
- Yarowsky, D. Unsupervised word sense disambiguation rivaling supervised methods. In Proceedings of the Proceedings of the 33rd Annual Meeting of the Association for Computational Linguistics, Cambridge, MA, 1995; pp. 189–196. [Google Scholar] [CrossRef]
- Zadrozny, B.; Elkan, C. Transforming classifier scores into accurate multiclass probability estimates. In Proceedings of the Proceedings of the 8th ACM SIGKDD International Conference on Knowledge Discovery and Data Mining, 2002; pp. 694–699. [Google Scholar] [CrossRef]
- Barron, C.; Neis, P.; Zipf, A. A comprehensive framework for intrinsic OpenStreetMap quality analysis. Trans. GIS 2014, 18, 877–895. [Google Scholar] [CrossRef]
- Kipf, T.N.; Welling, M. Semi-supervised classification with graph convolutional networks. In Proceedings of the Proceedings of the 5th International Conference on Learning Representations (ICLR), Toulon, France, 2017. [Google Scholar]
- Workman, S.; Zhai, M.; Crandall, D.J.; Jacobs, N. A unified model for near and remote sensing. In Proceedings of the Proceedings of the IEEE International Conference on Computer Vision (ICCV), Venice, Italy, 2017; pp. 2707–2716. [Google Scholar] [CrossRef]
- Hakimi, S.L. Optimum locations of switching centers and the absolute medians of a graph. Oper. Res. 1964, 12, 450–459. [Google Scholar] [CrossRef]
- Daskin, M.S. Network and Discrete Location: Models, Algorithms, and Applications, 2nd ed.; Wiley, 2013. [Google Scholar] [CrossRef]
- Church, R.; ReVelle, C. The maximal covering location problem. Pap. Reg. Sci. Assoc. 1974, 32, 101–118. [Google Scholar] [CrossRef]
- Stresman, G.; Bousema, T.; Cook, J. Malaria hotspots: Is there epidemiological evidence for fine-scale spatial targeting of interventions? Trends Parasitol. 2019, 35, 822–834. [Google Scholar] [CrossRef] [PubMed]
- Kang, B.; Park, J.; Lee, J. Geospatial analysis of COVID-19 and its implications for emergency response in Africa. Int. J. Environ. Res. Public Health 2021, 18, 3175. [Google Scholar] [PubMed]
- Maidment, P. Water distribution network design using GIS. J. Water Resour. Plan. Manag. 2006, 132, 228–236. [Google Scholar]
- Zeyringer, M.; Pachauri, S.; Schmid, E.; Schmidt, J.; Worrell, E.; Morawetz, U. Analyzing grid extension and stand-alone photovoltaic systems for the cost-effective electrification of Kenya. Energy Sustain. Dev. 2015, 25, 75–86. [Google Scholar] [CrossRef]
Figure 1.
Stuttgart: Street network and building footprints (European training city).
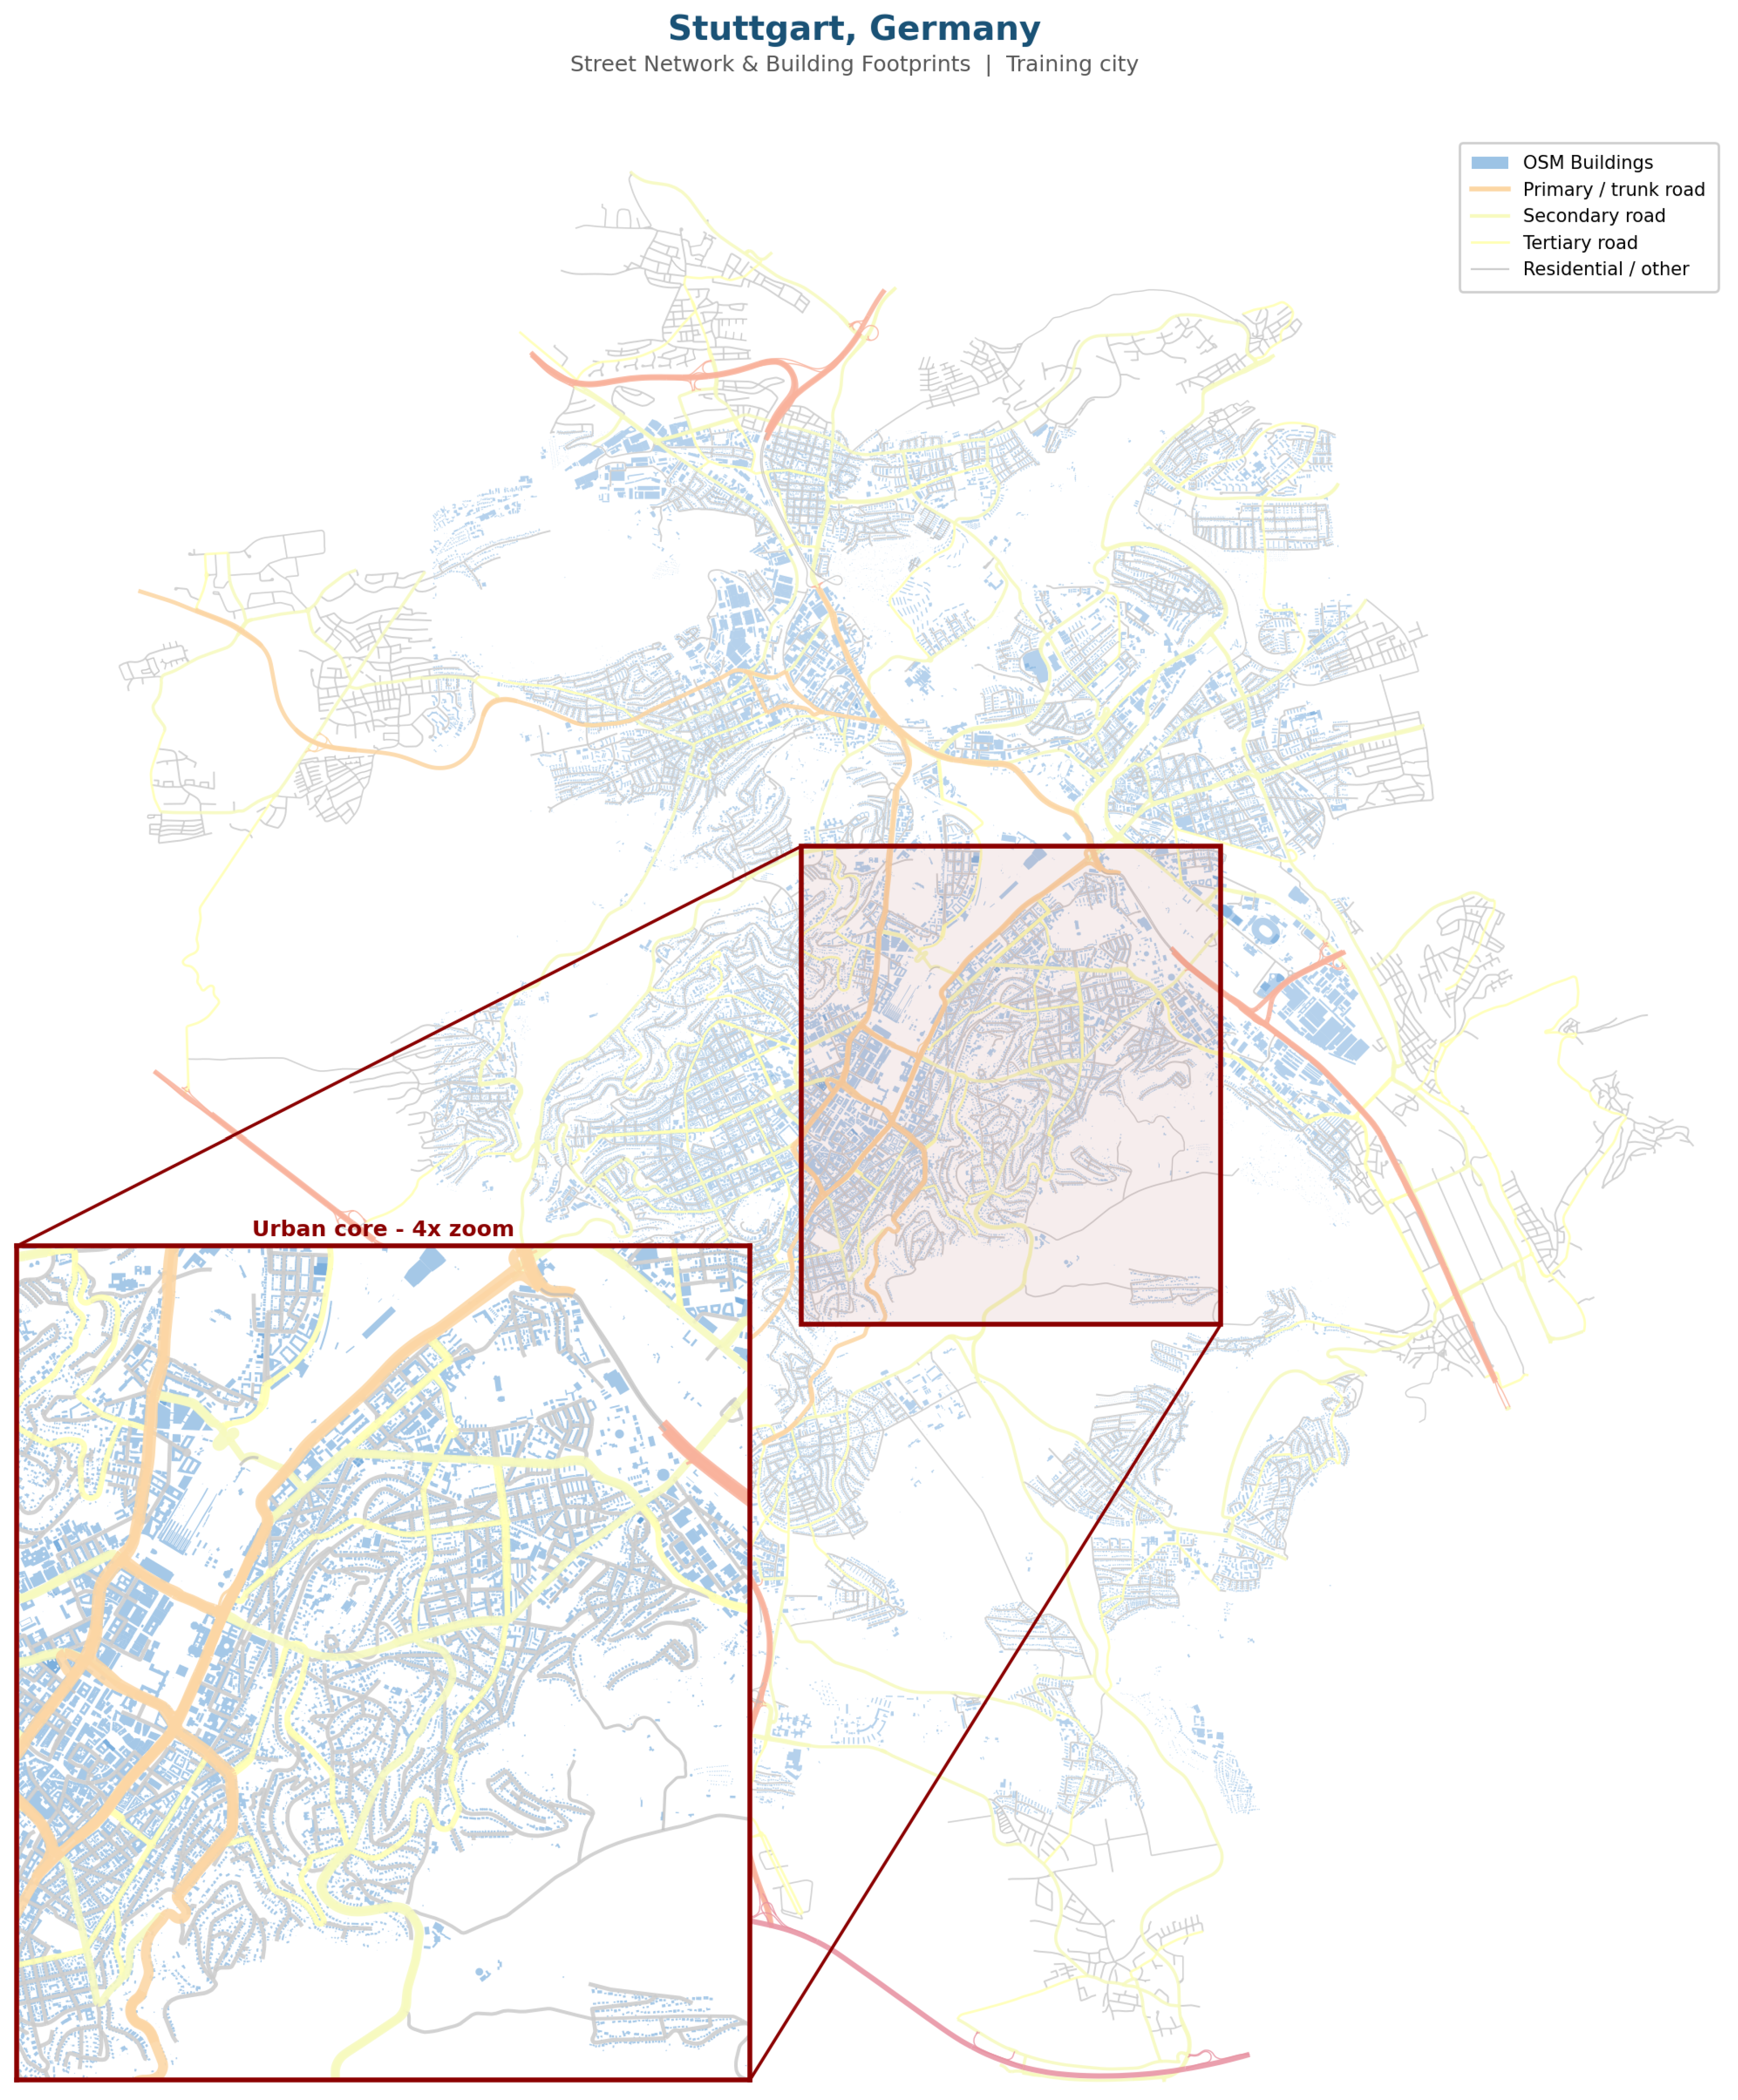
Figure 2.
Paris: Street network and building footprints (European training city).
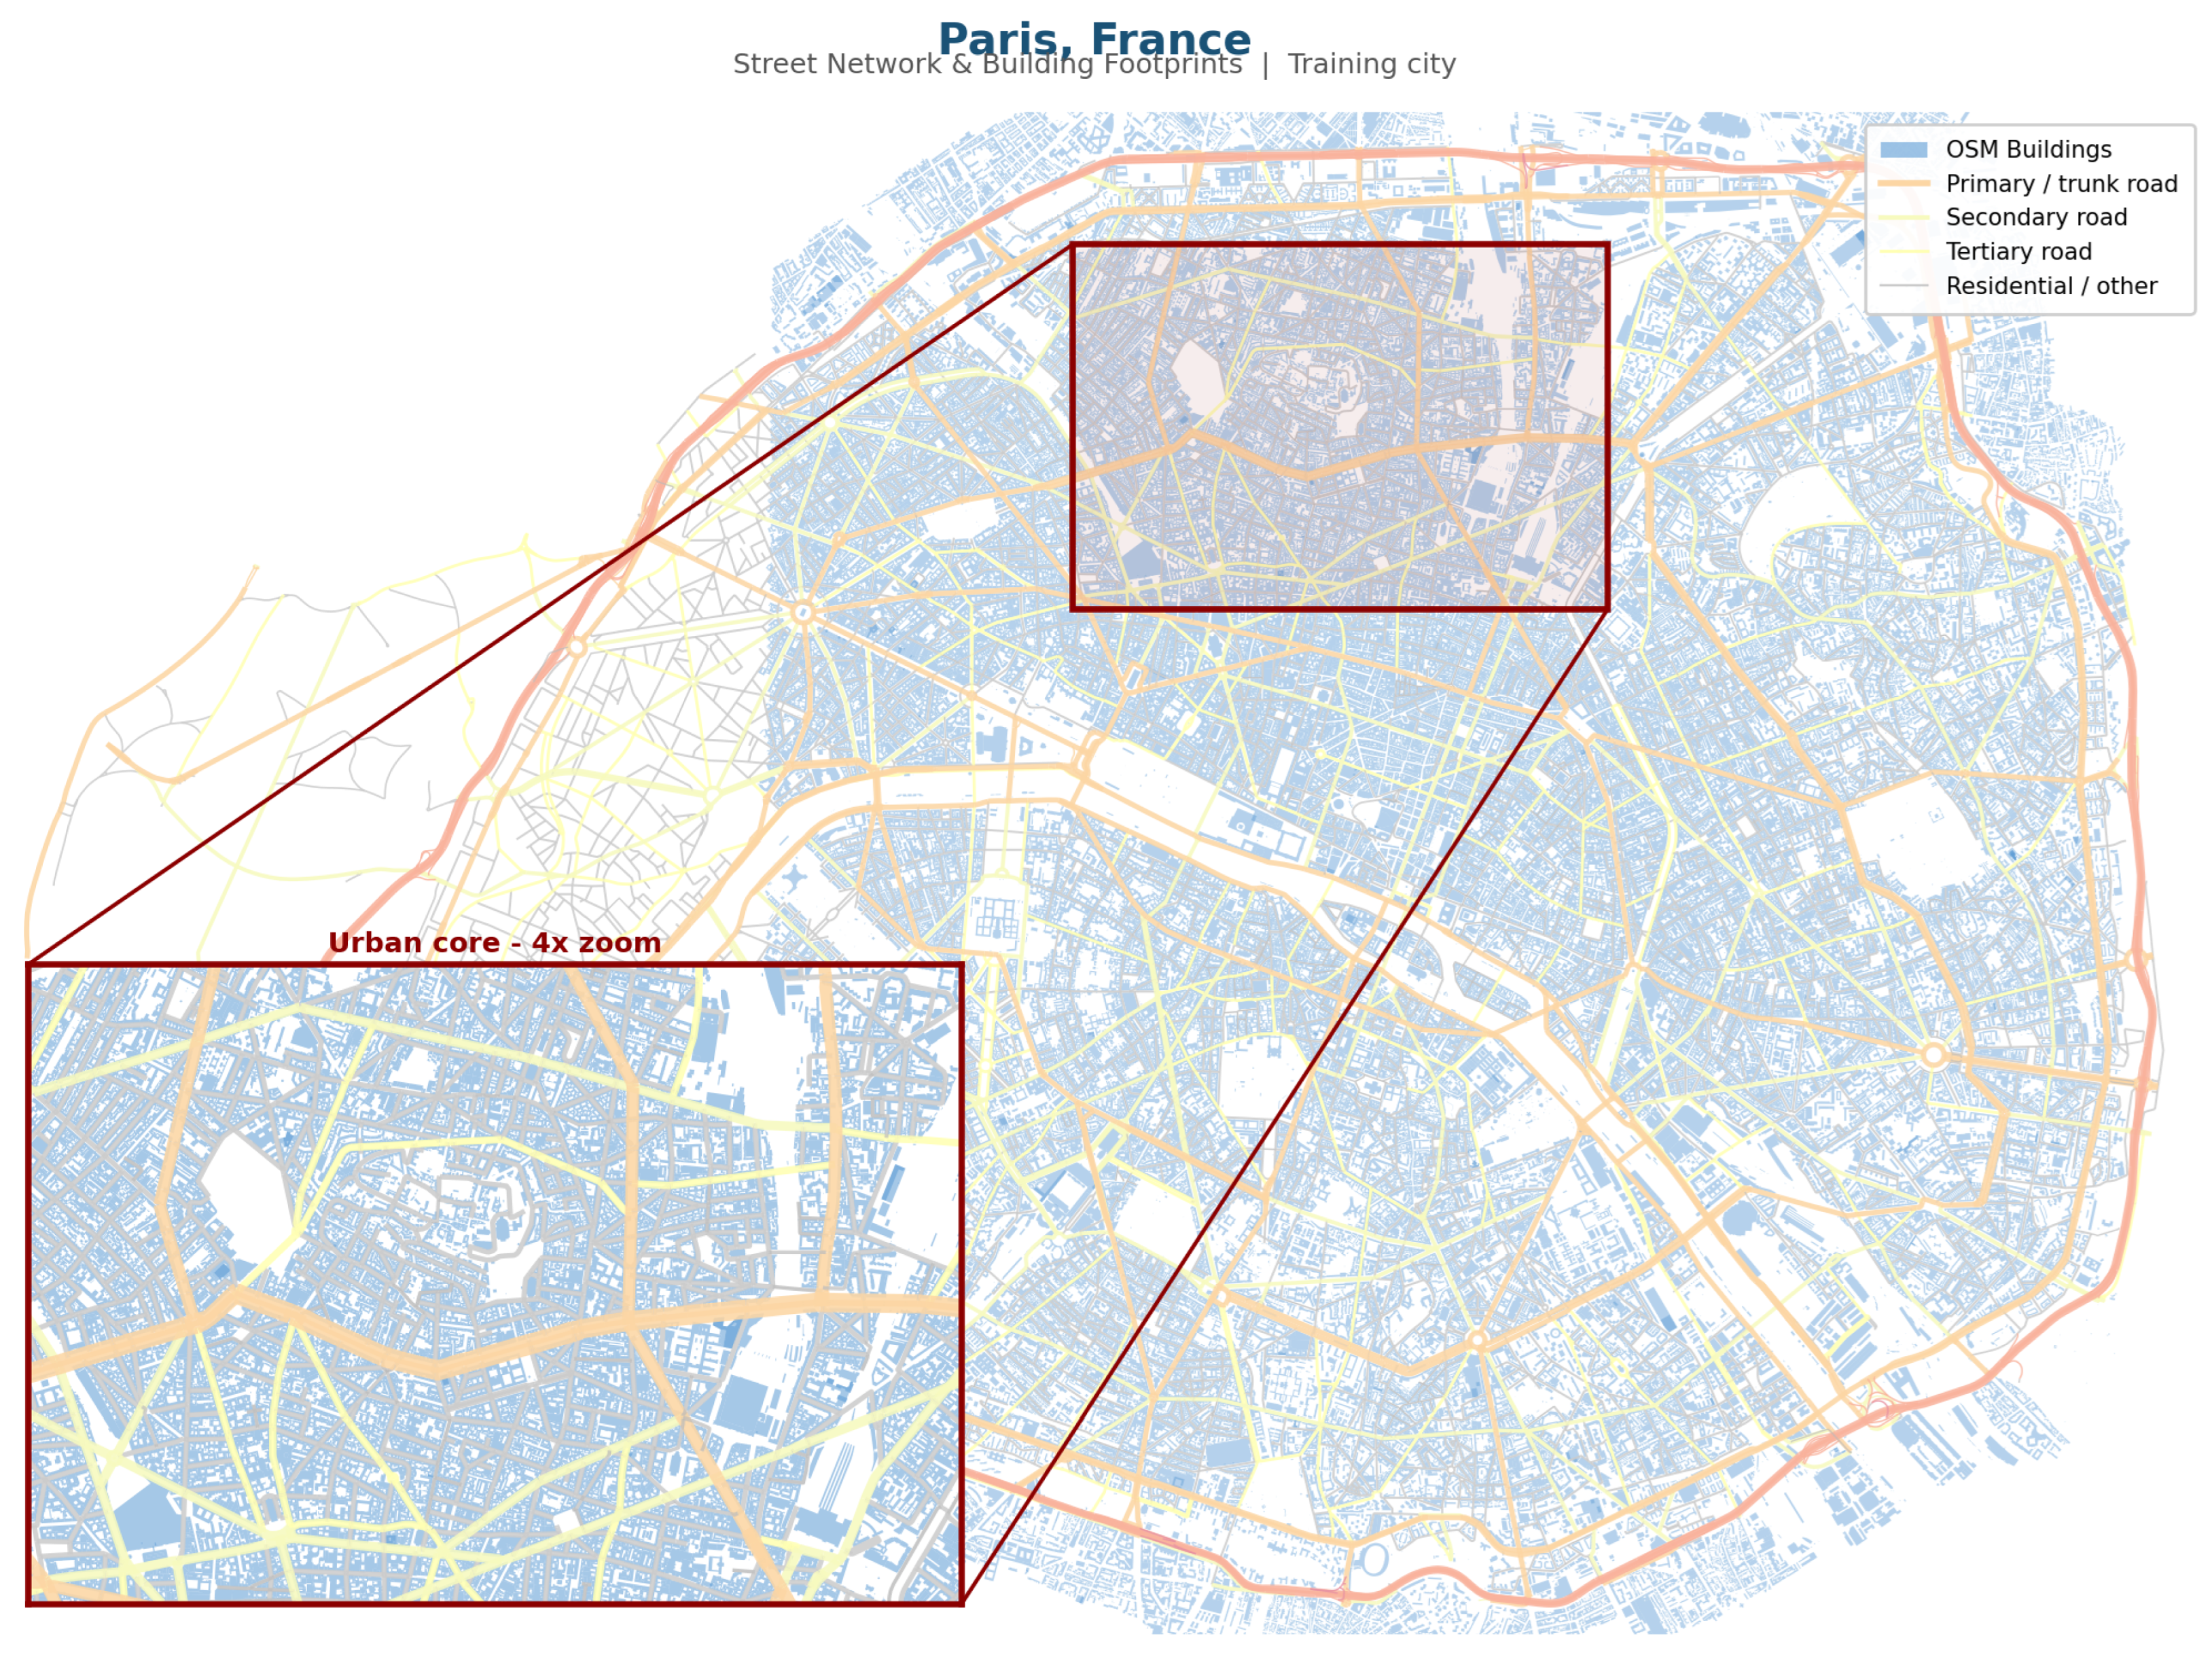
Figure 3.
Bern: Street network and building footprints (European training city).
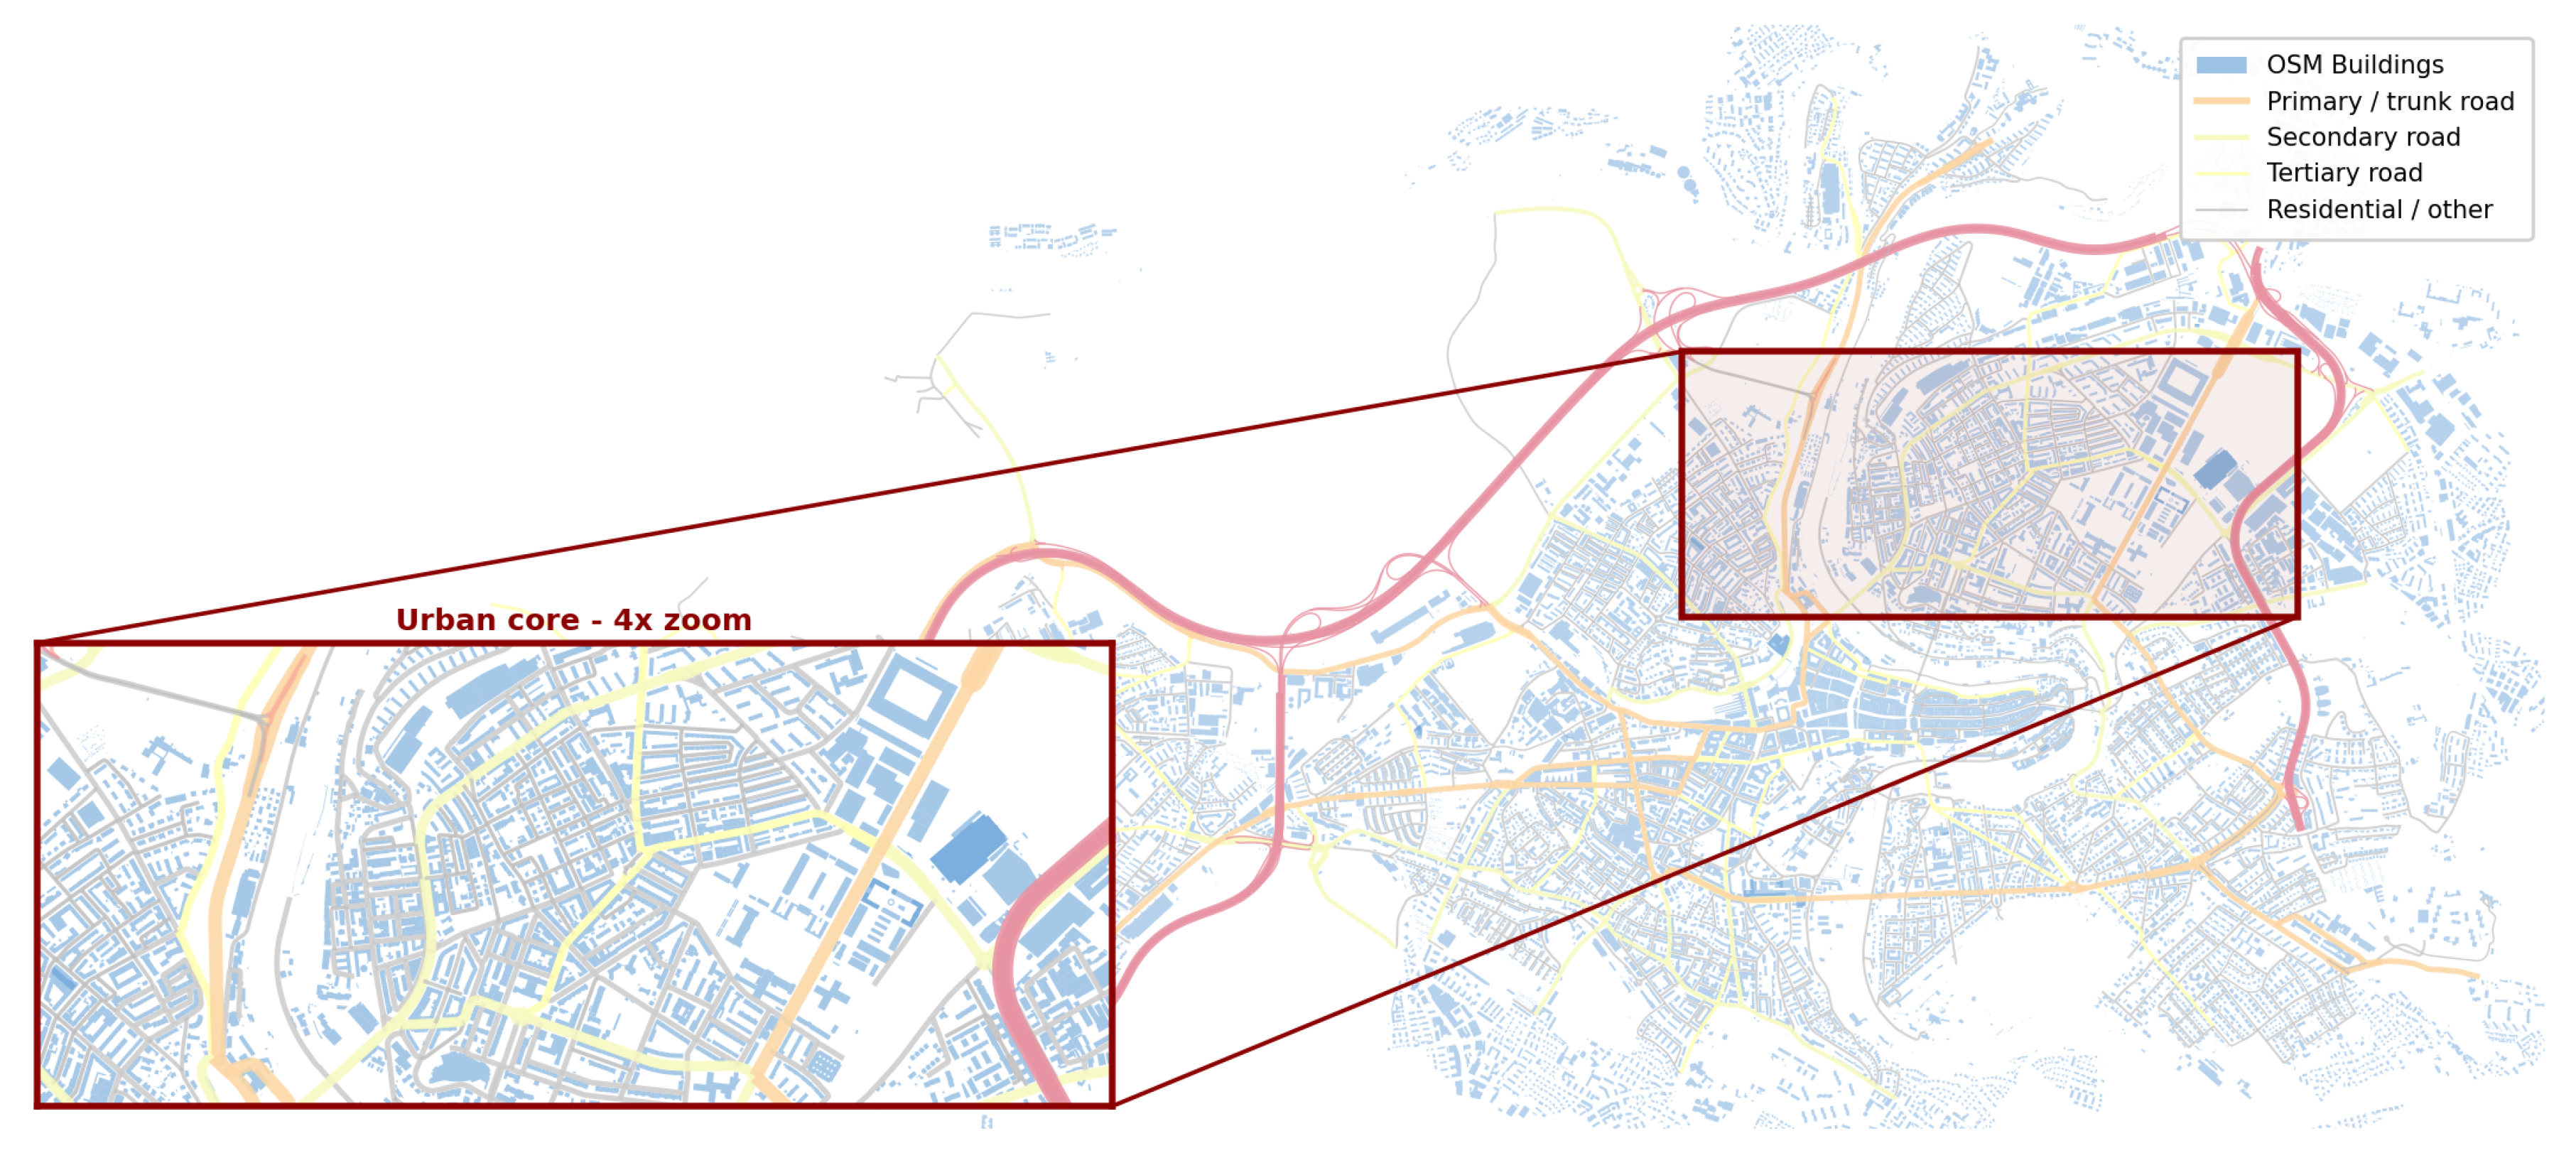
Figure 4.
Kigali: Street network and merged building footprints (OSM + Google). African training city.
Figure 4.
Kigali: Street network and merged building footprints (OSM + Google). African training city.
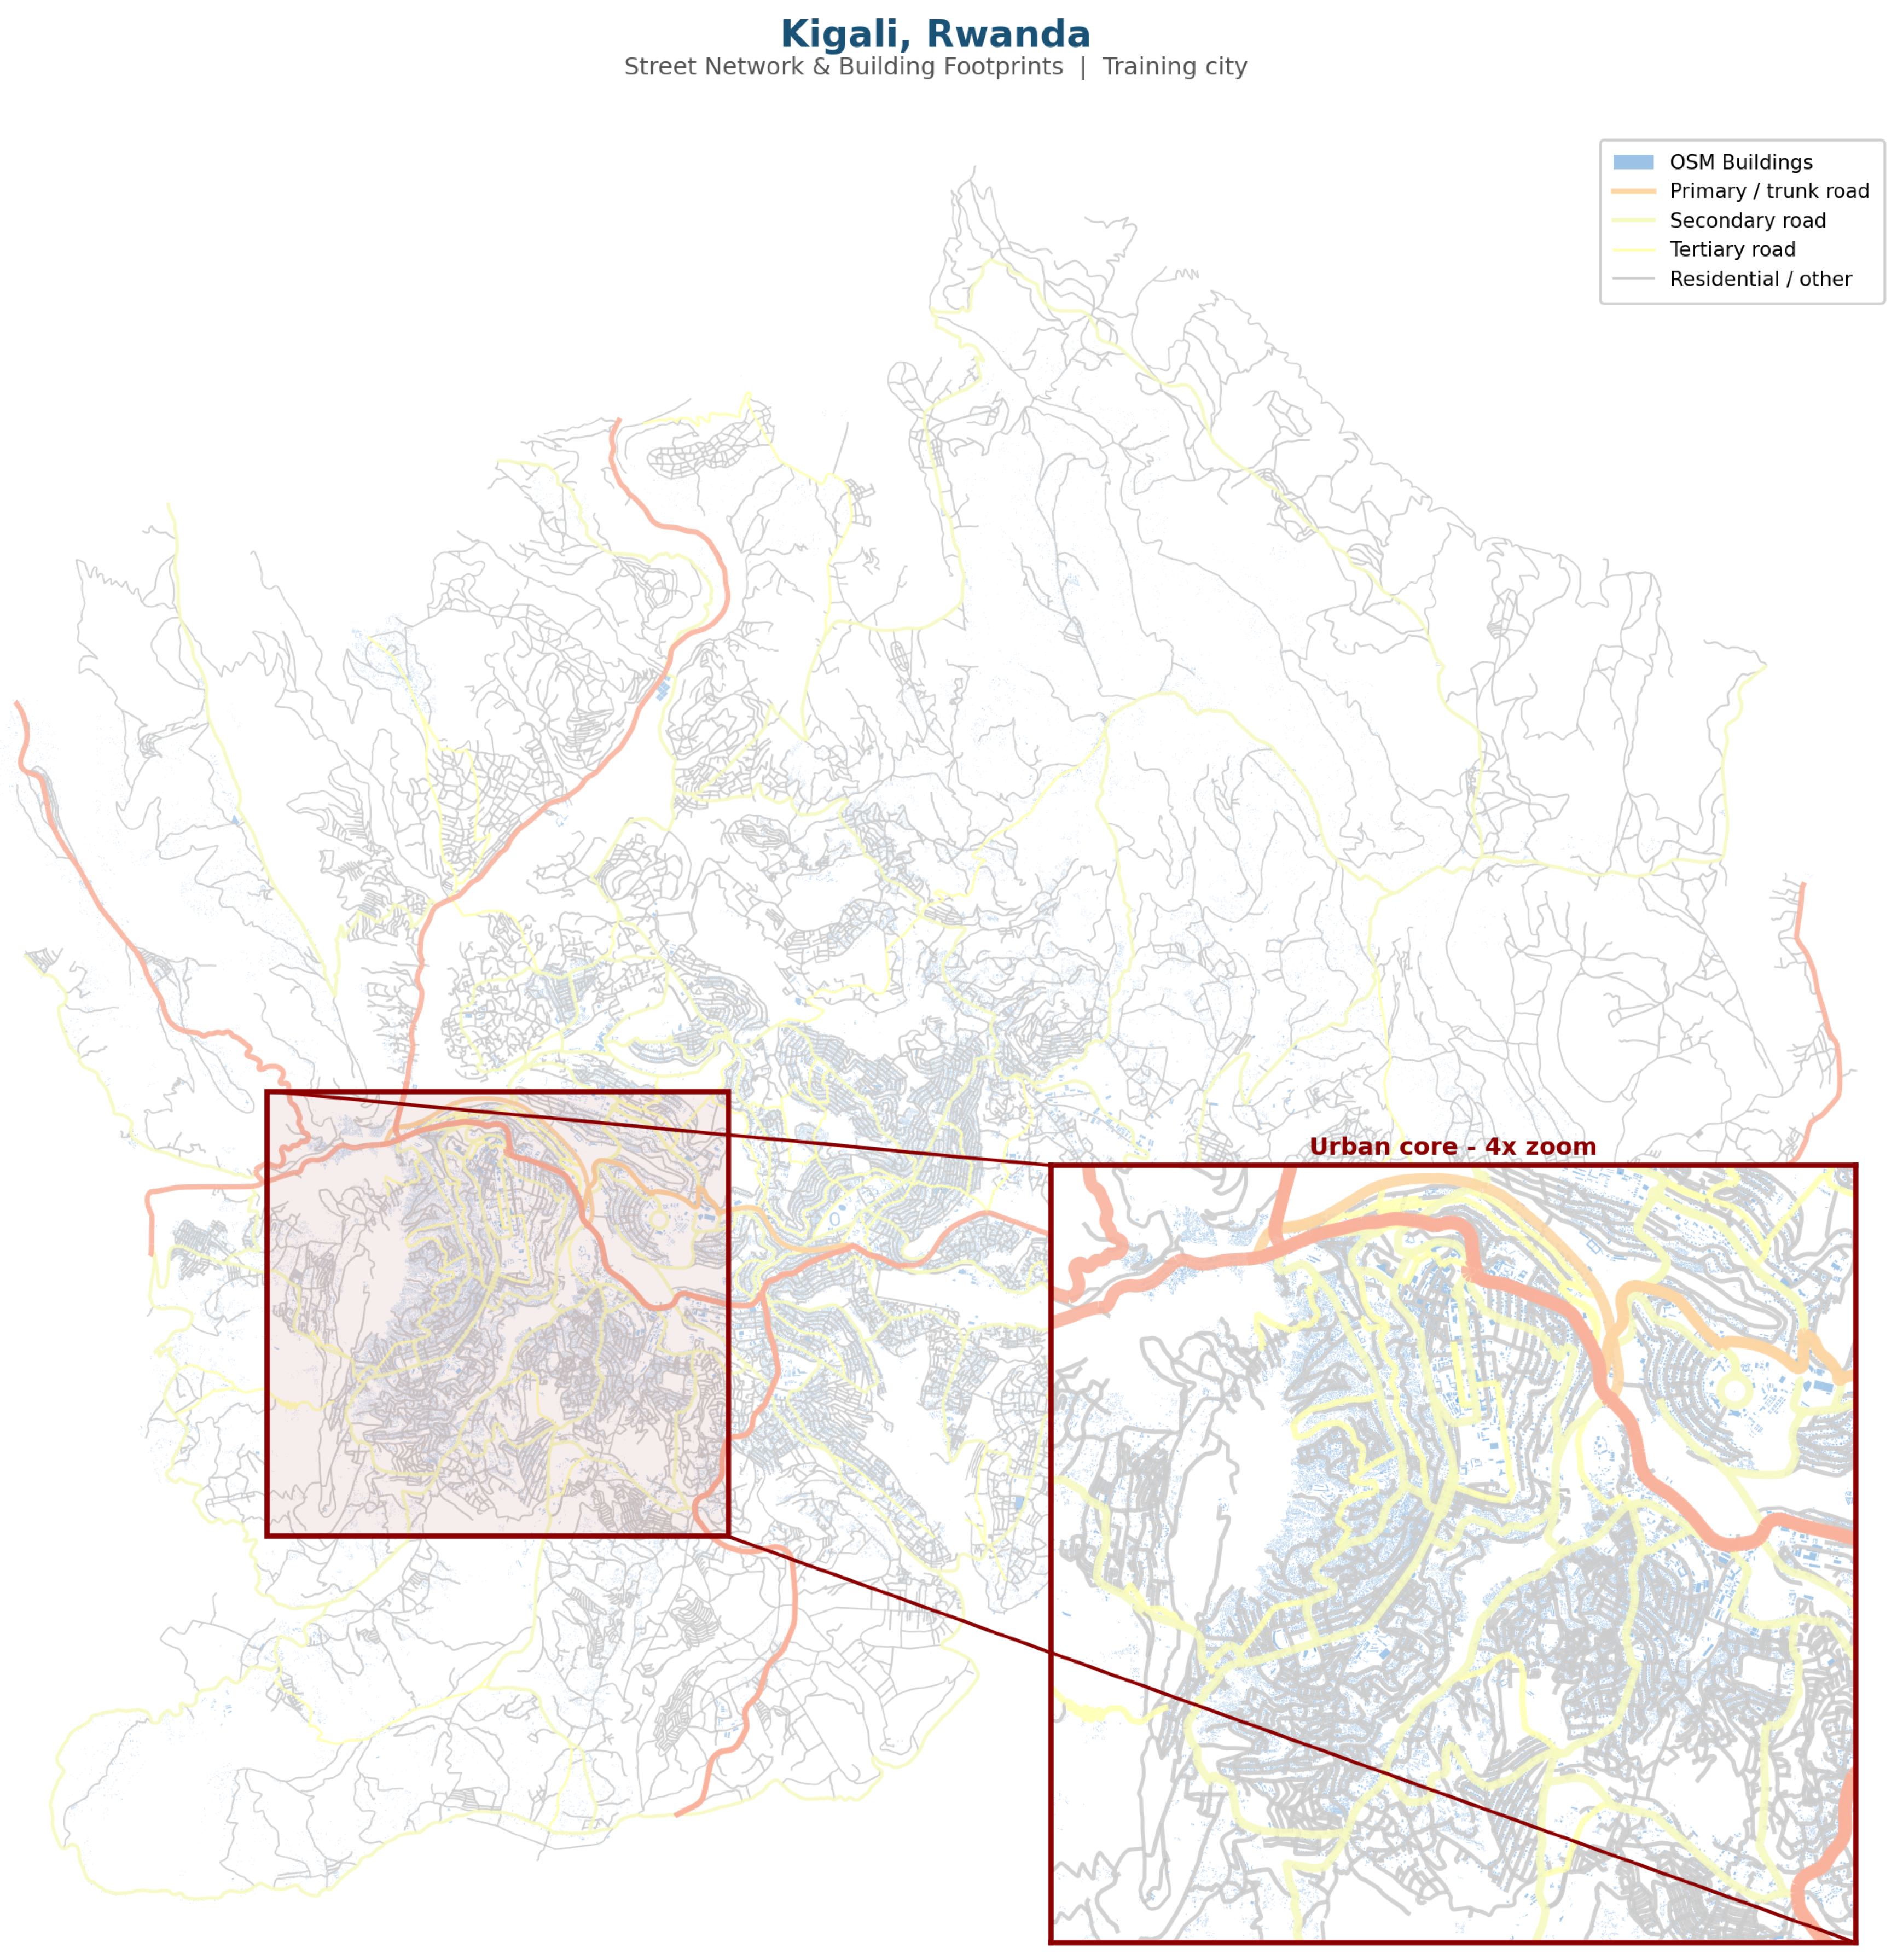
Figure 5.
Dakar: Street network and merged building footprints (OSM + Google). African training city.
Figure 5.
Dakar: Street network and merged building footprints (OSM + Google). African training city.
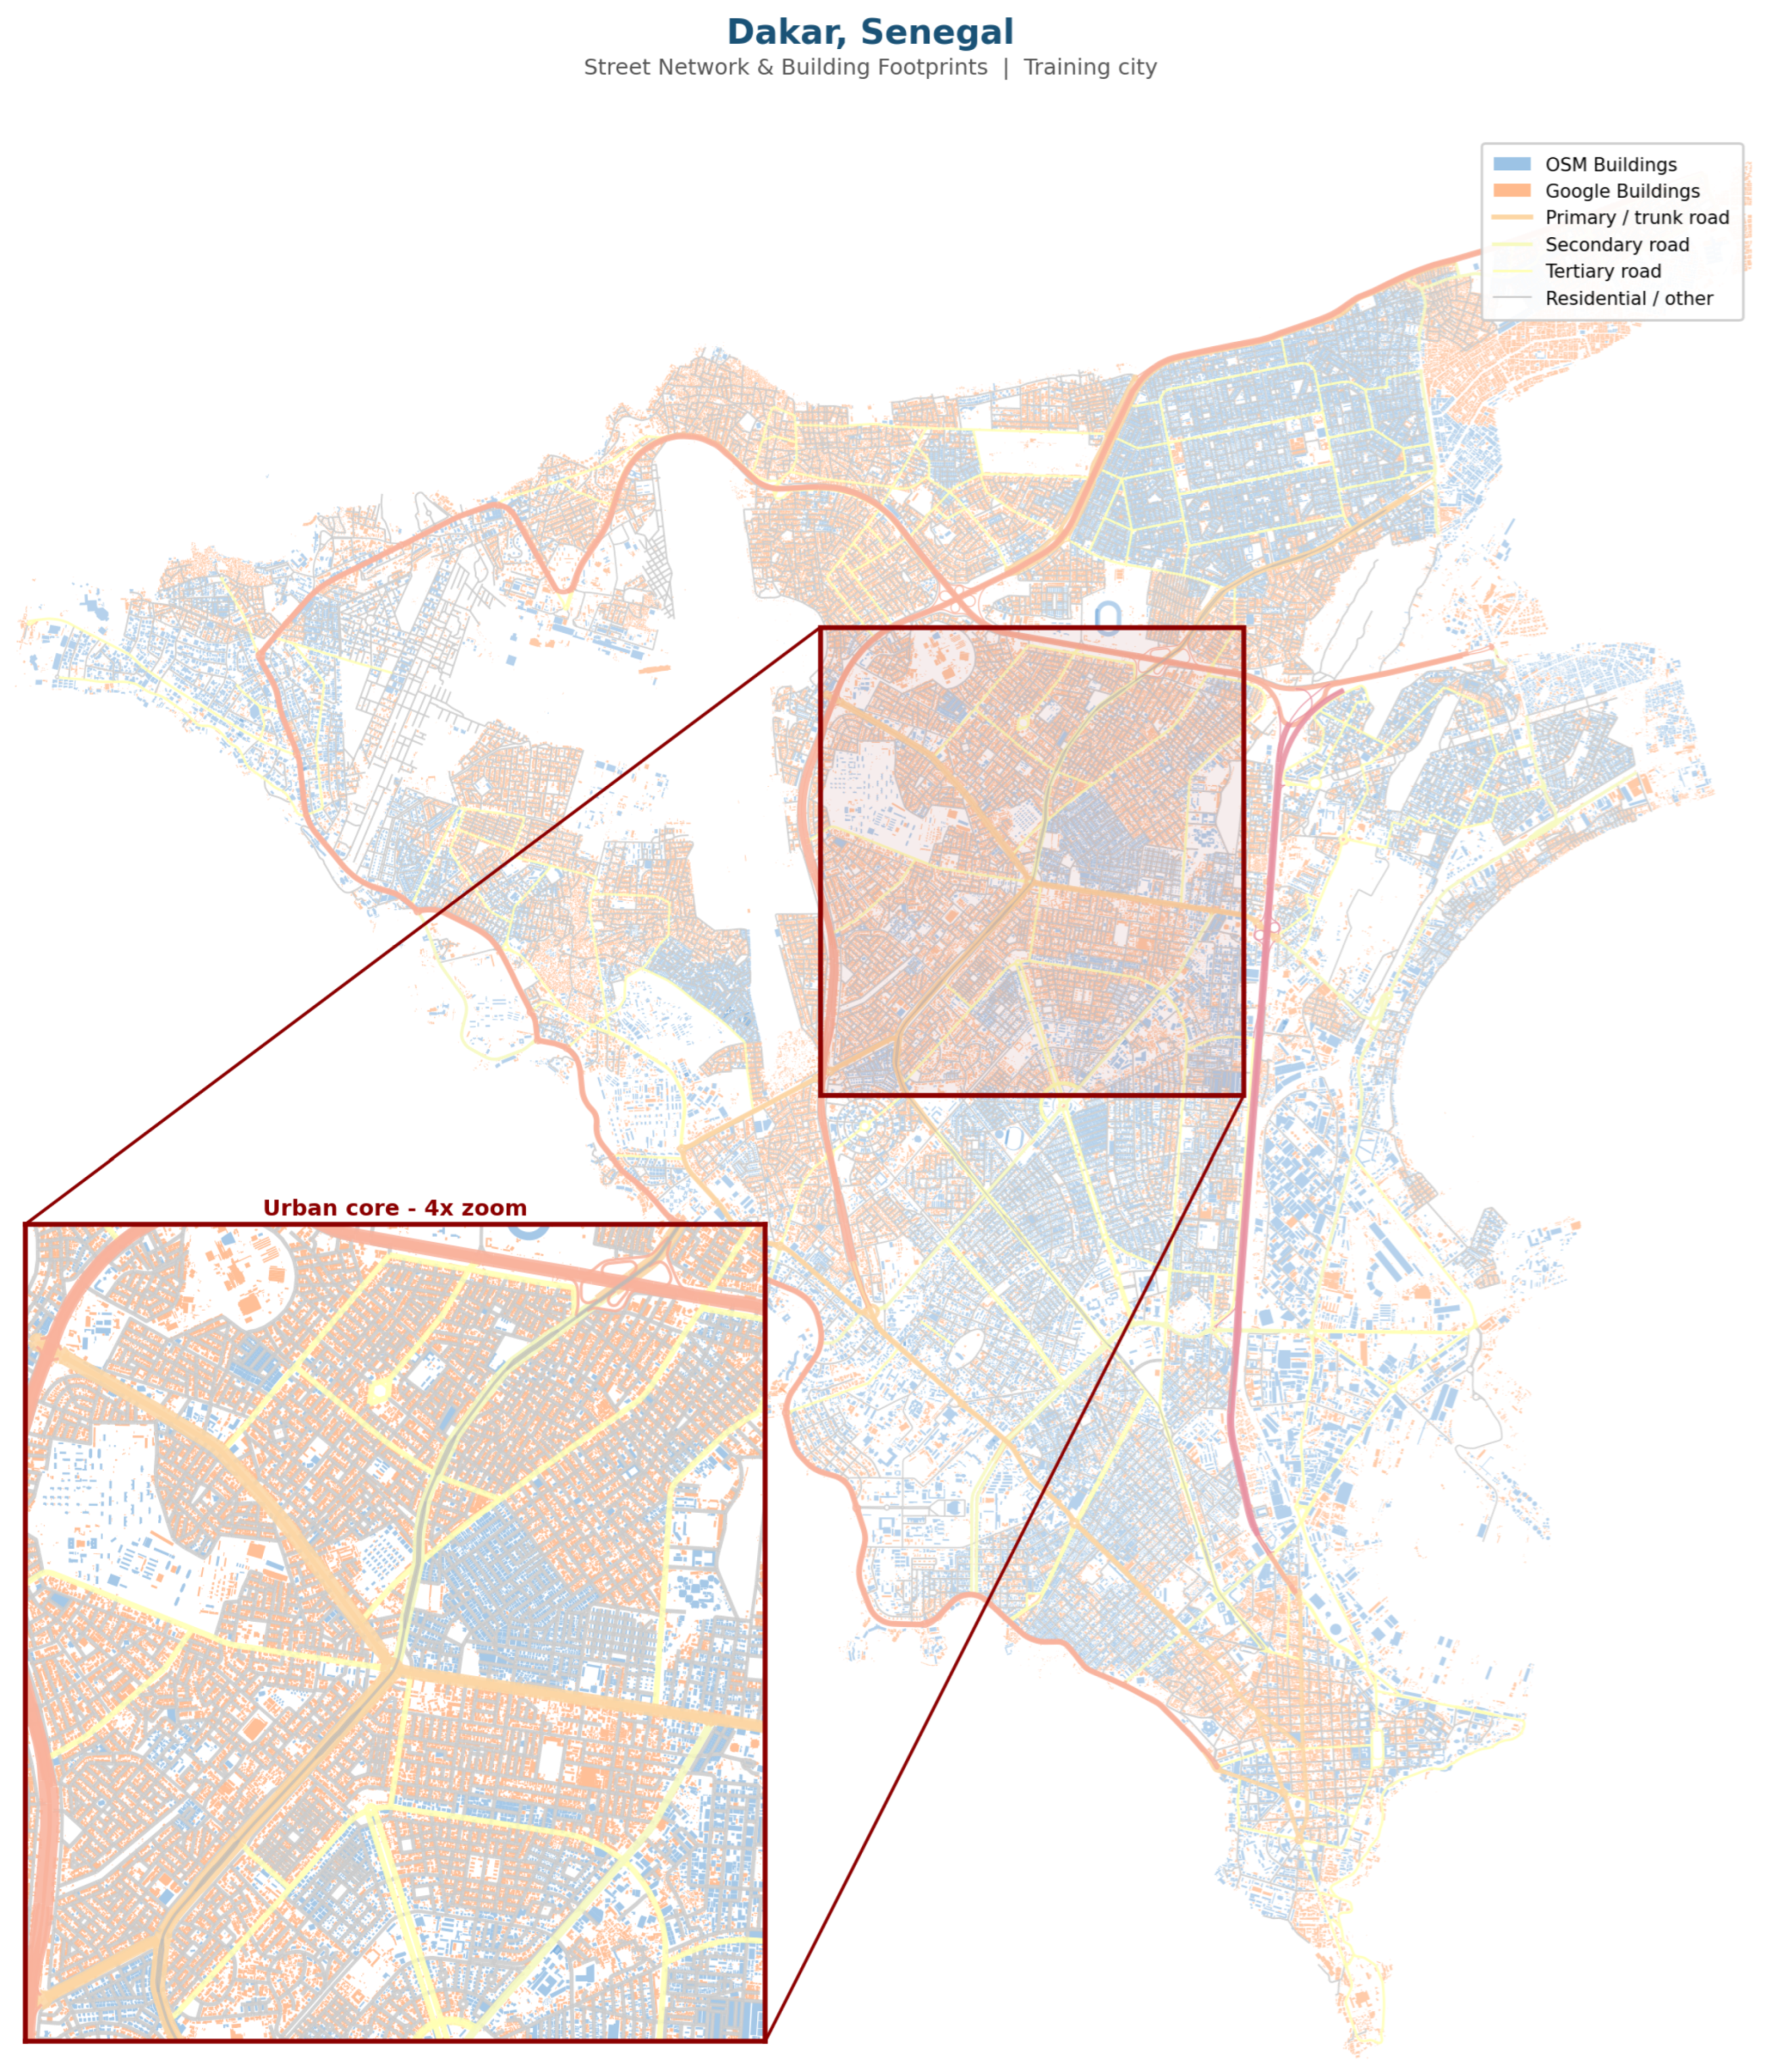
Figure 6.
Dar es Salaam: Street network and merged building footprints (OSM + Google). African test city.
Figure 6.
Dar es Salaam: Street network and merged building footprints (OSM + Google). African test city.
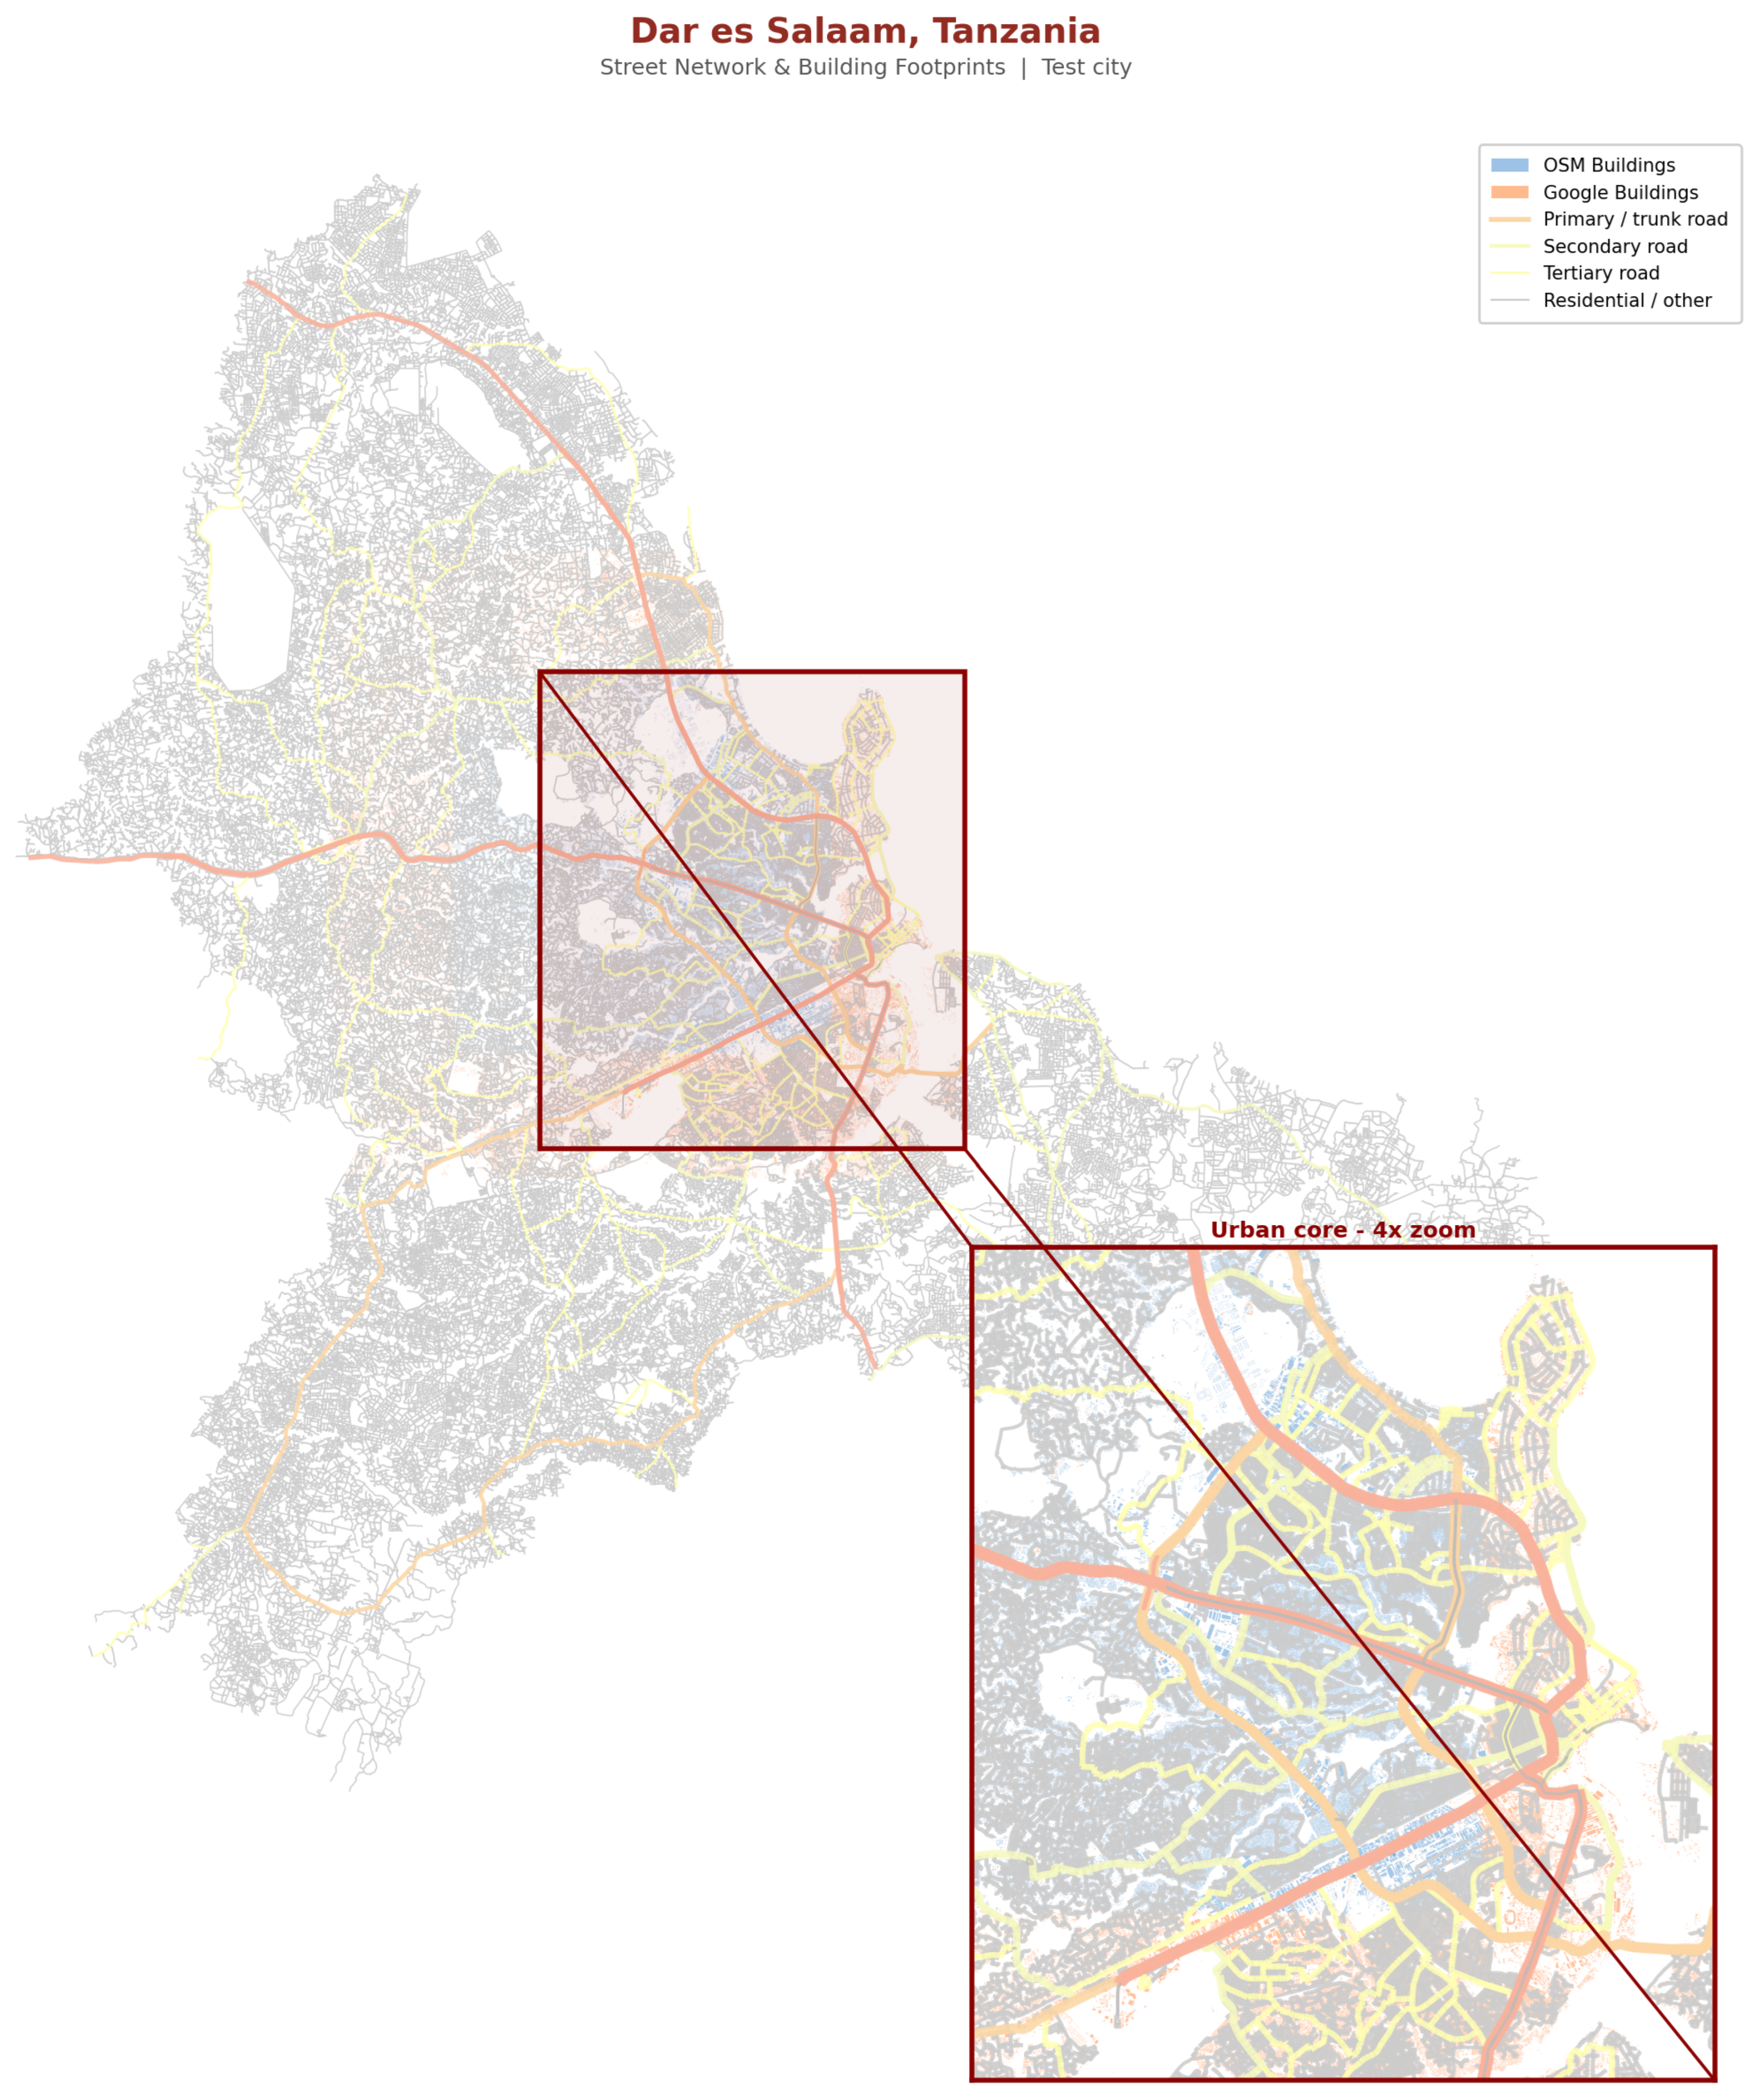
Figure 7.
Nairobi: Street network and merged building footprints (OSM + Google). African test city.
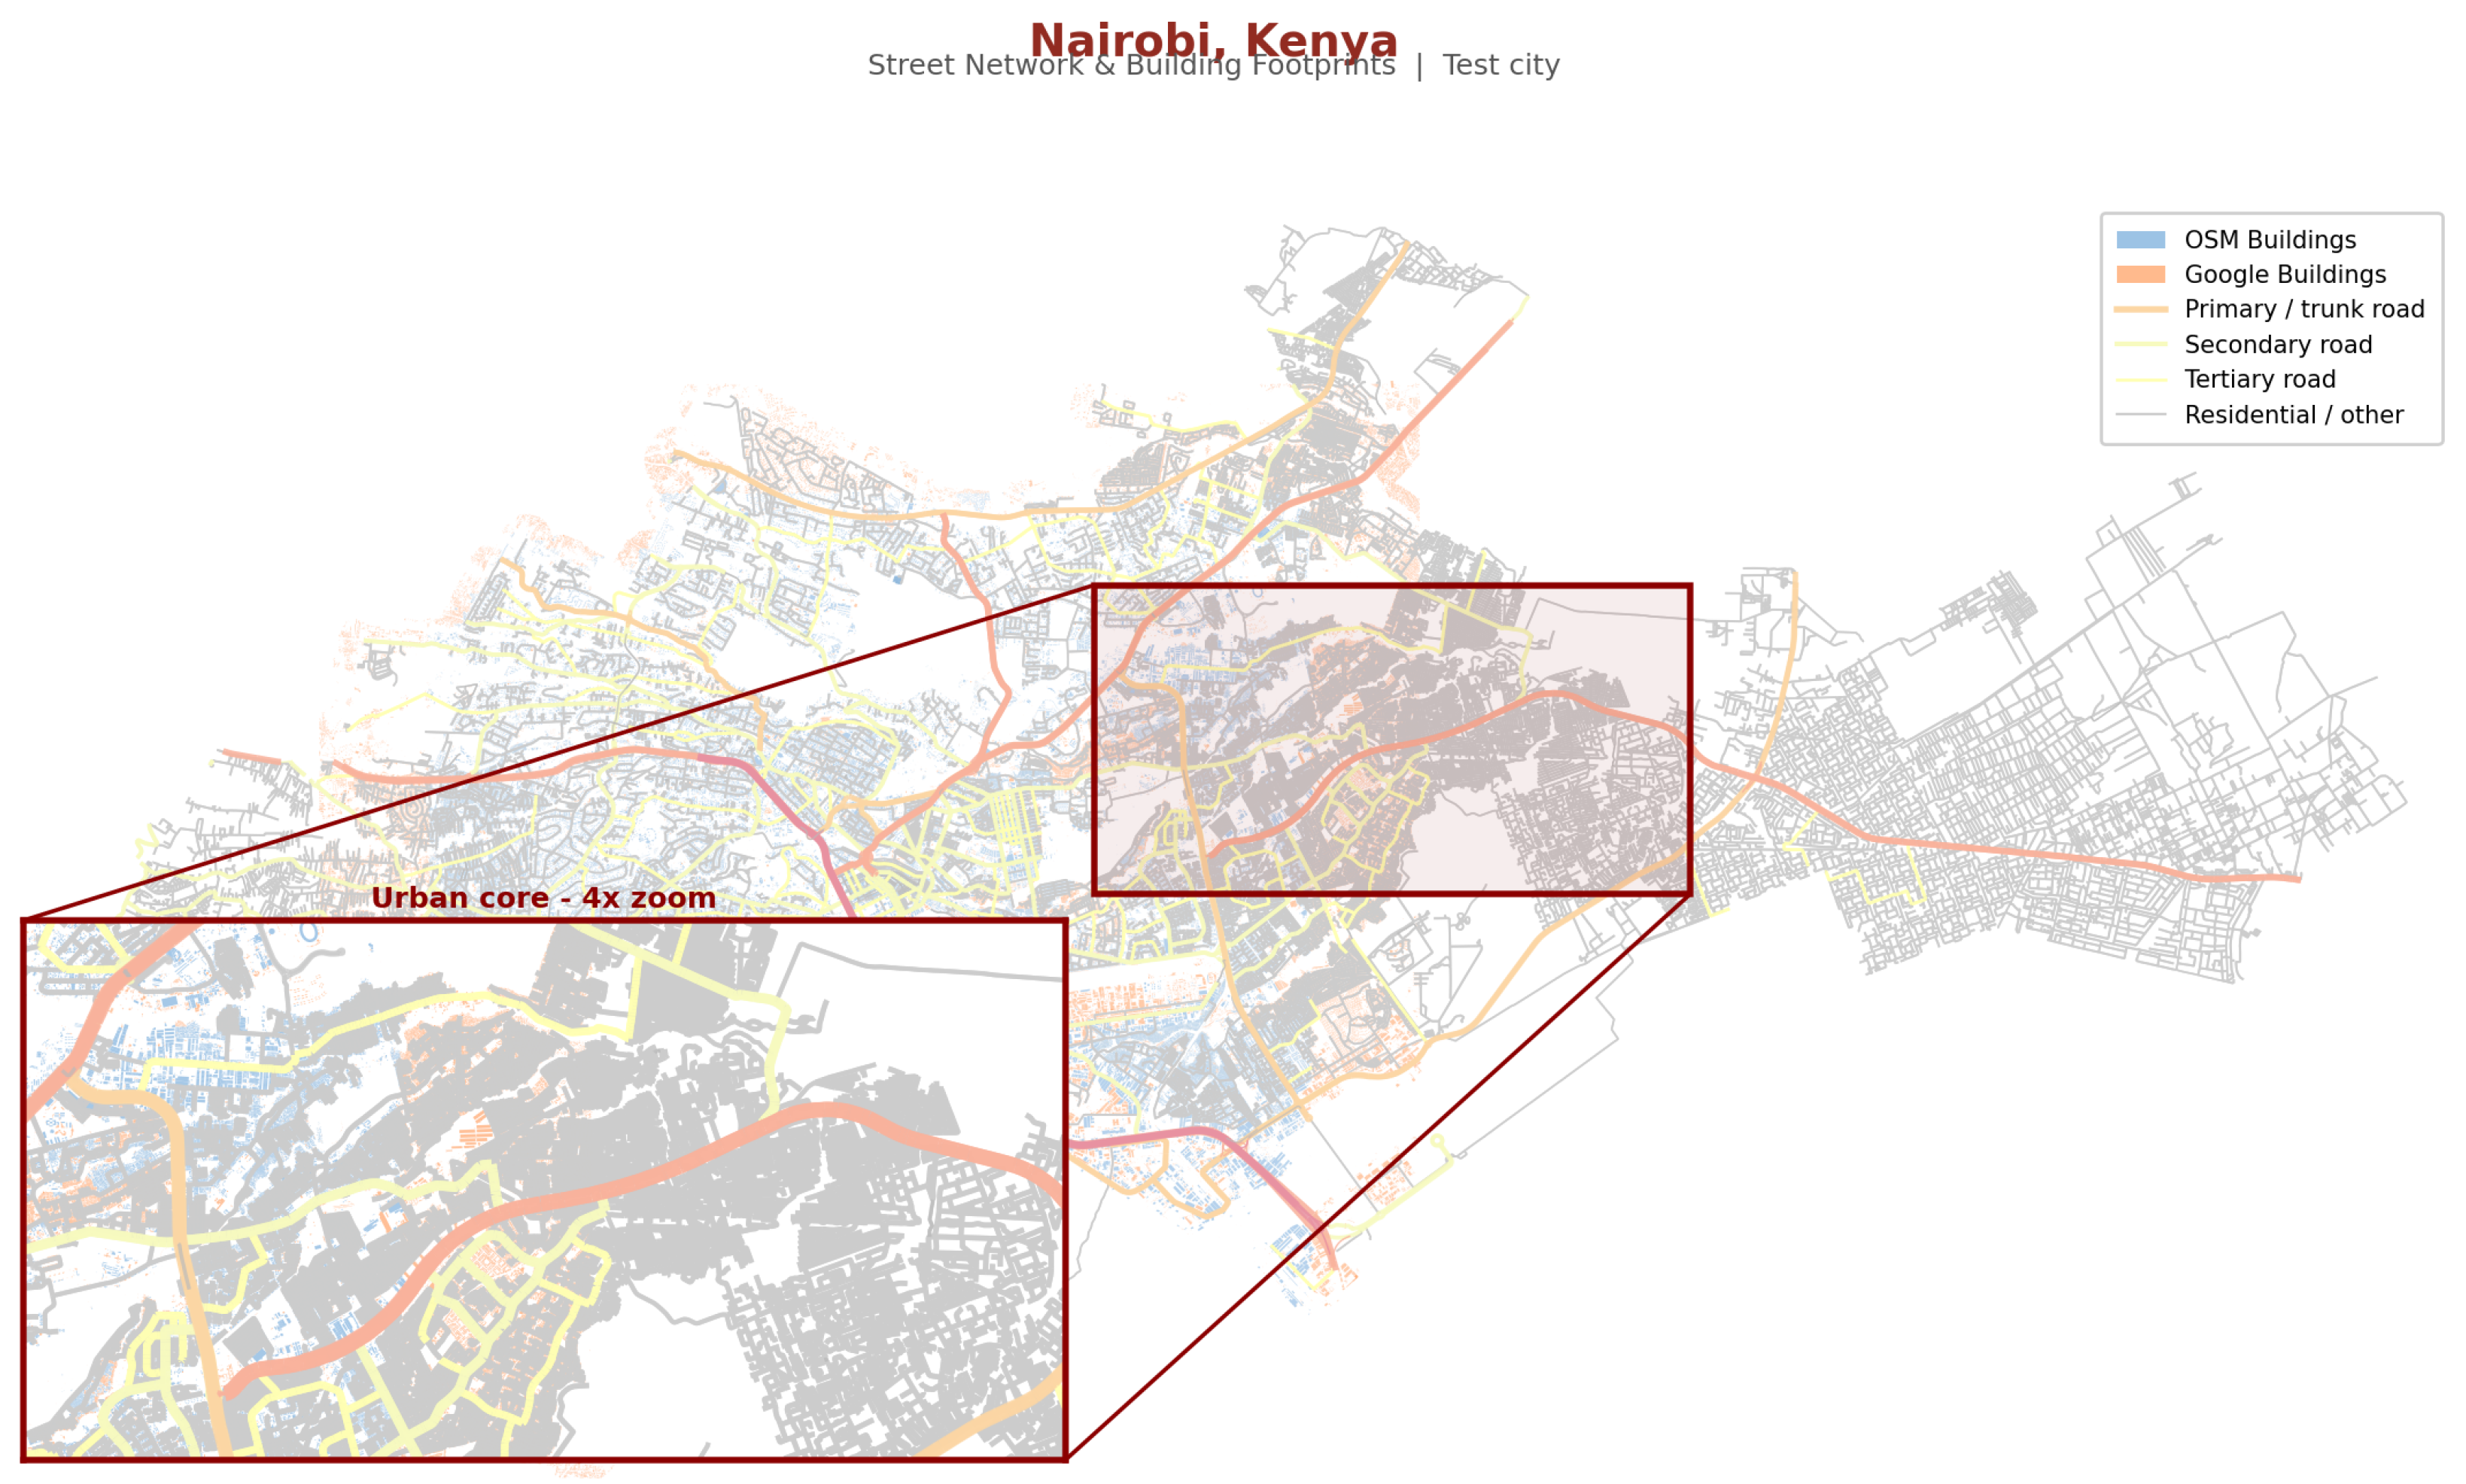
Figure 8.
Kampala: Street network and building footprints (OSM). African training city.
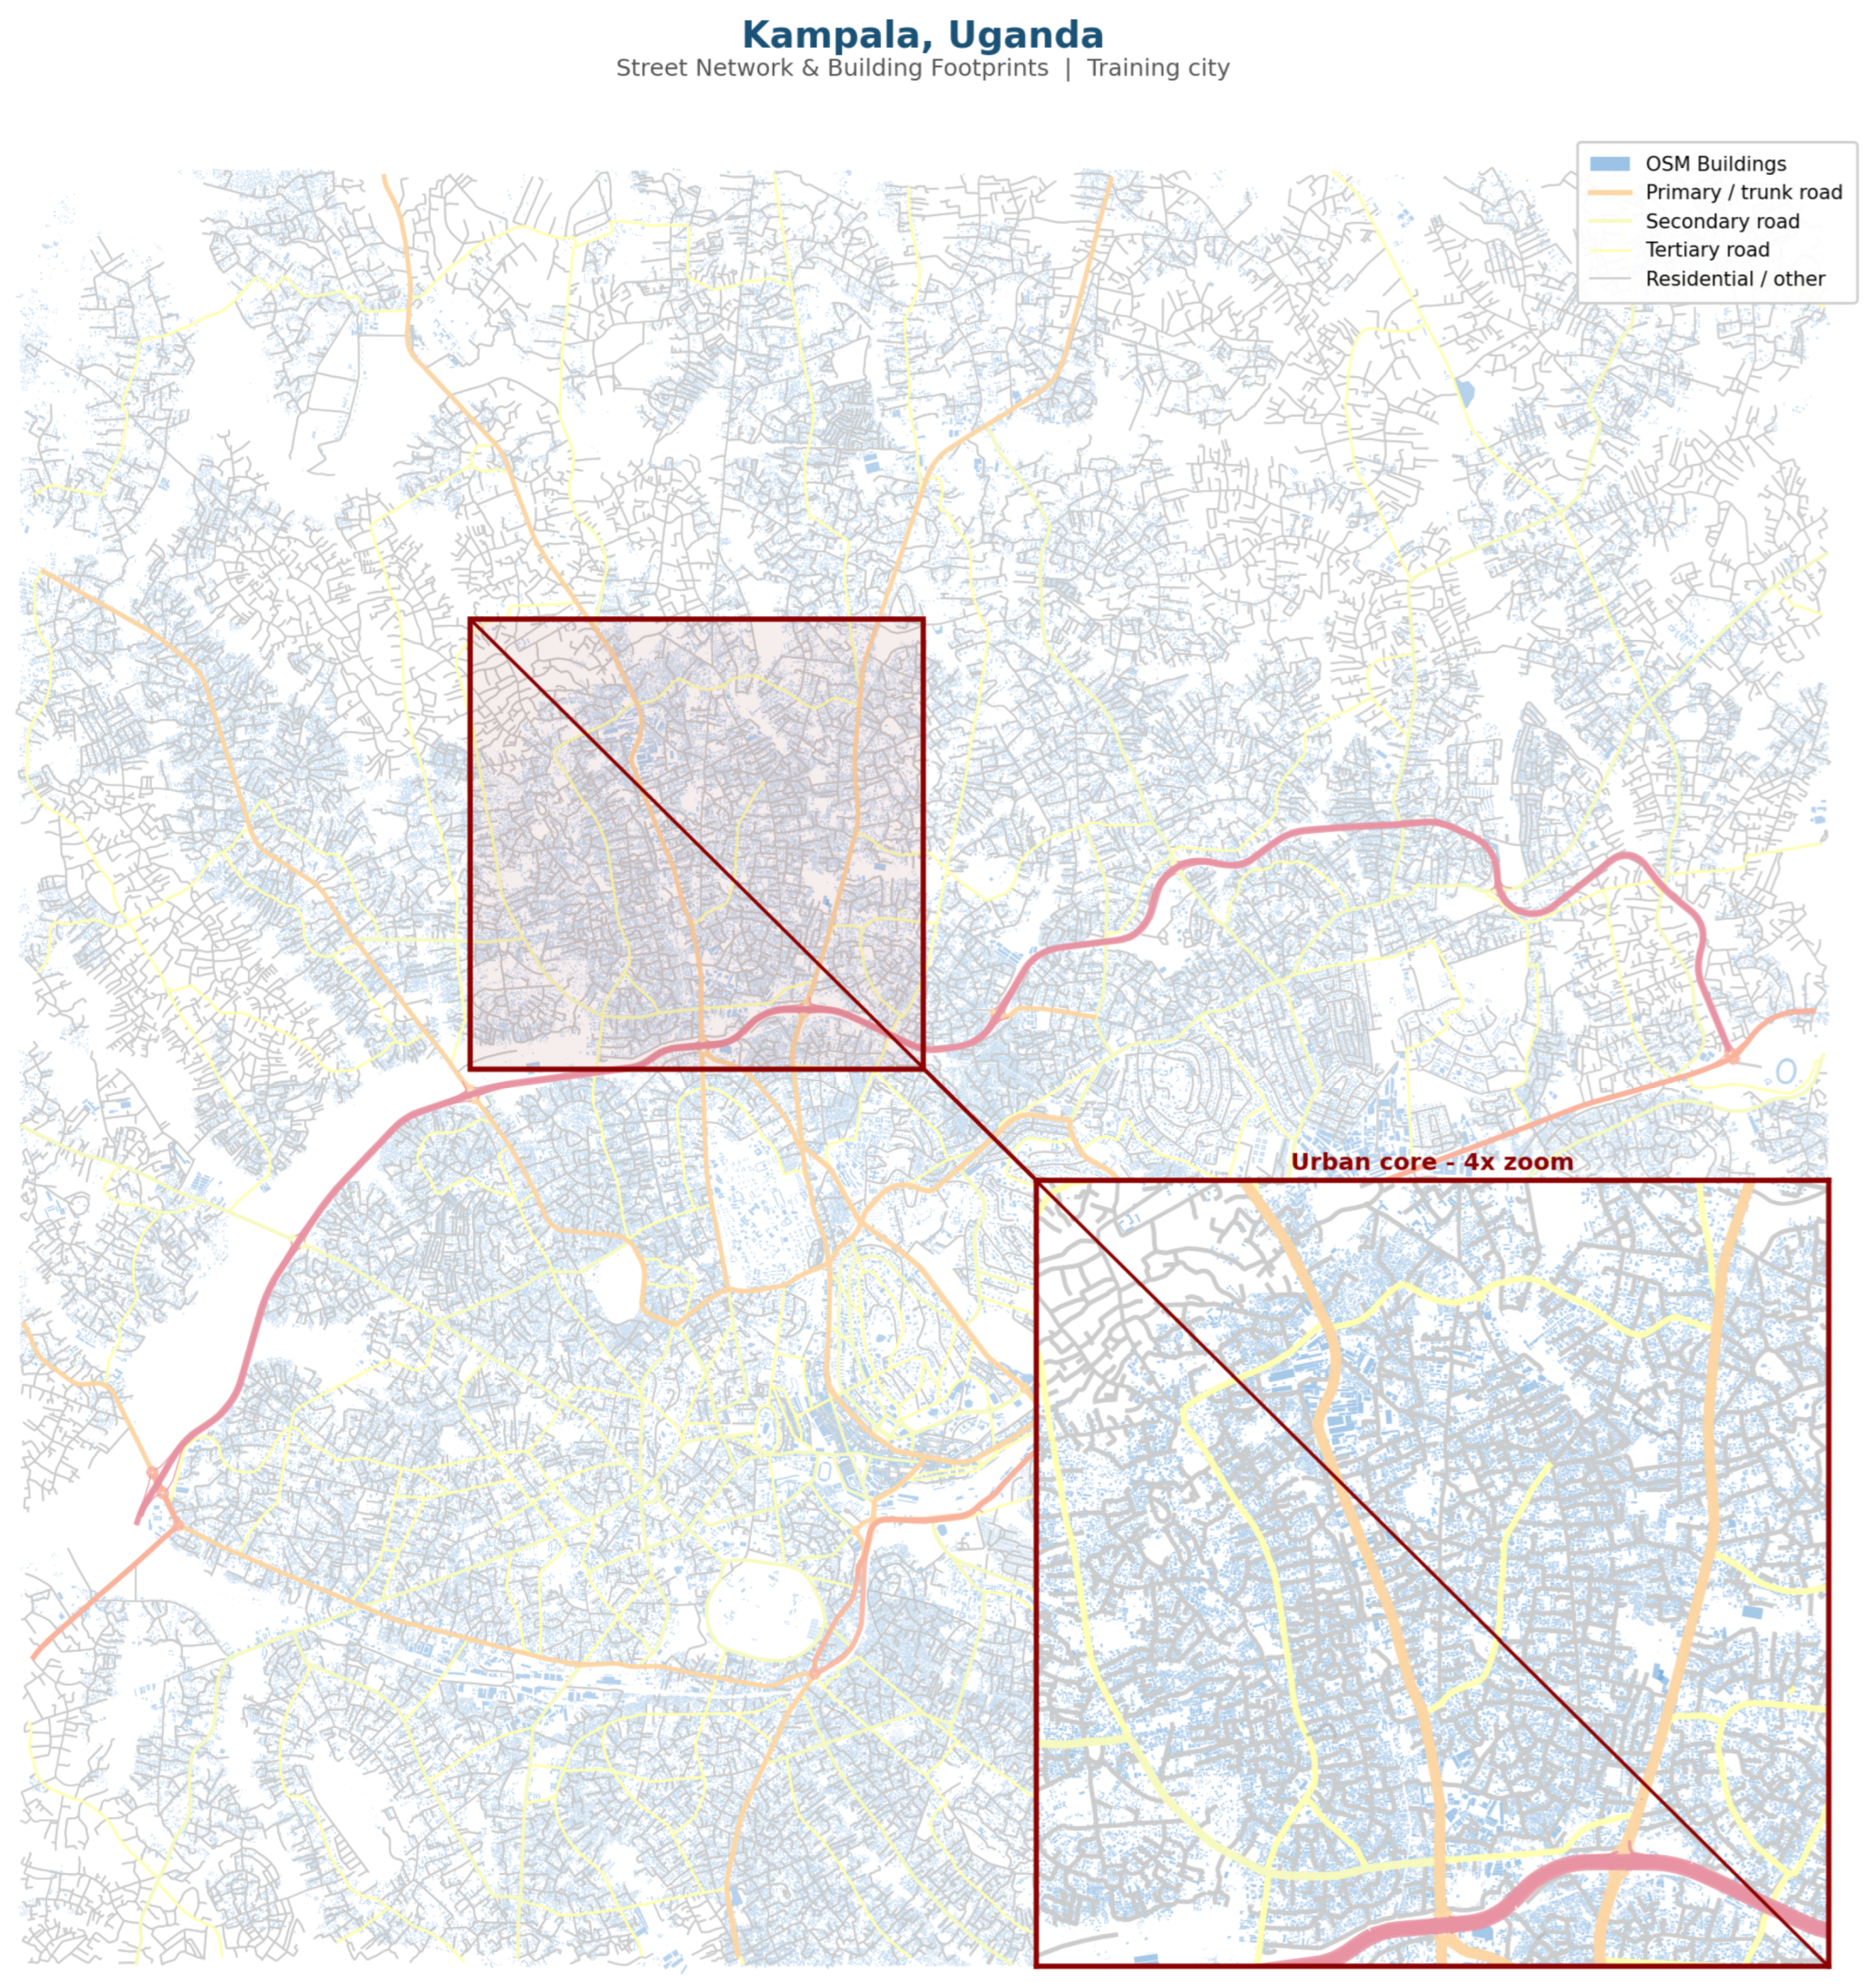
Figure 9.
Kinshasa: Street network and building footprints (OSM). African test city.
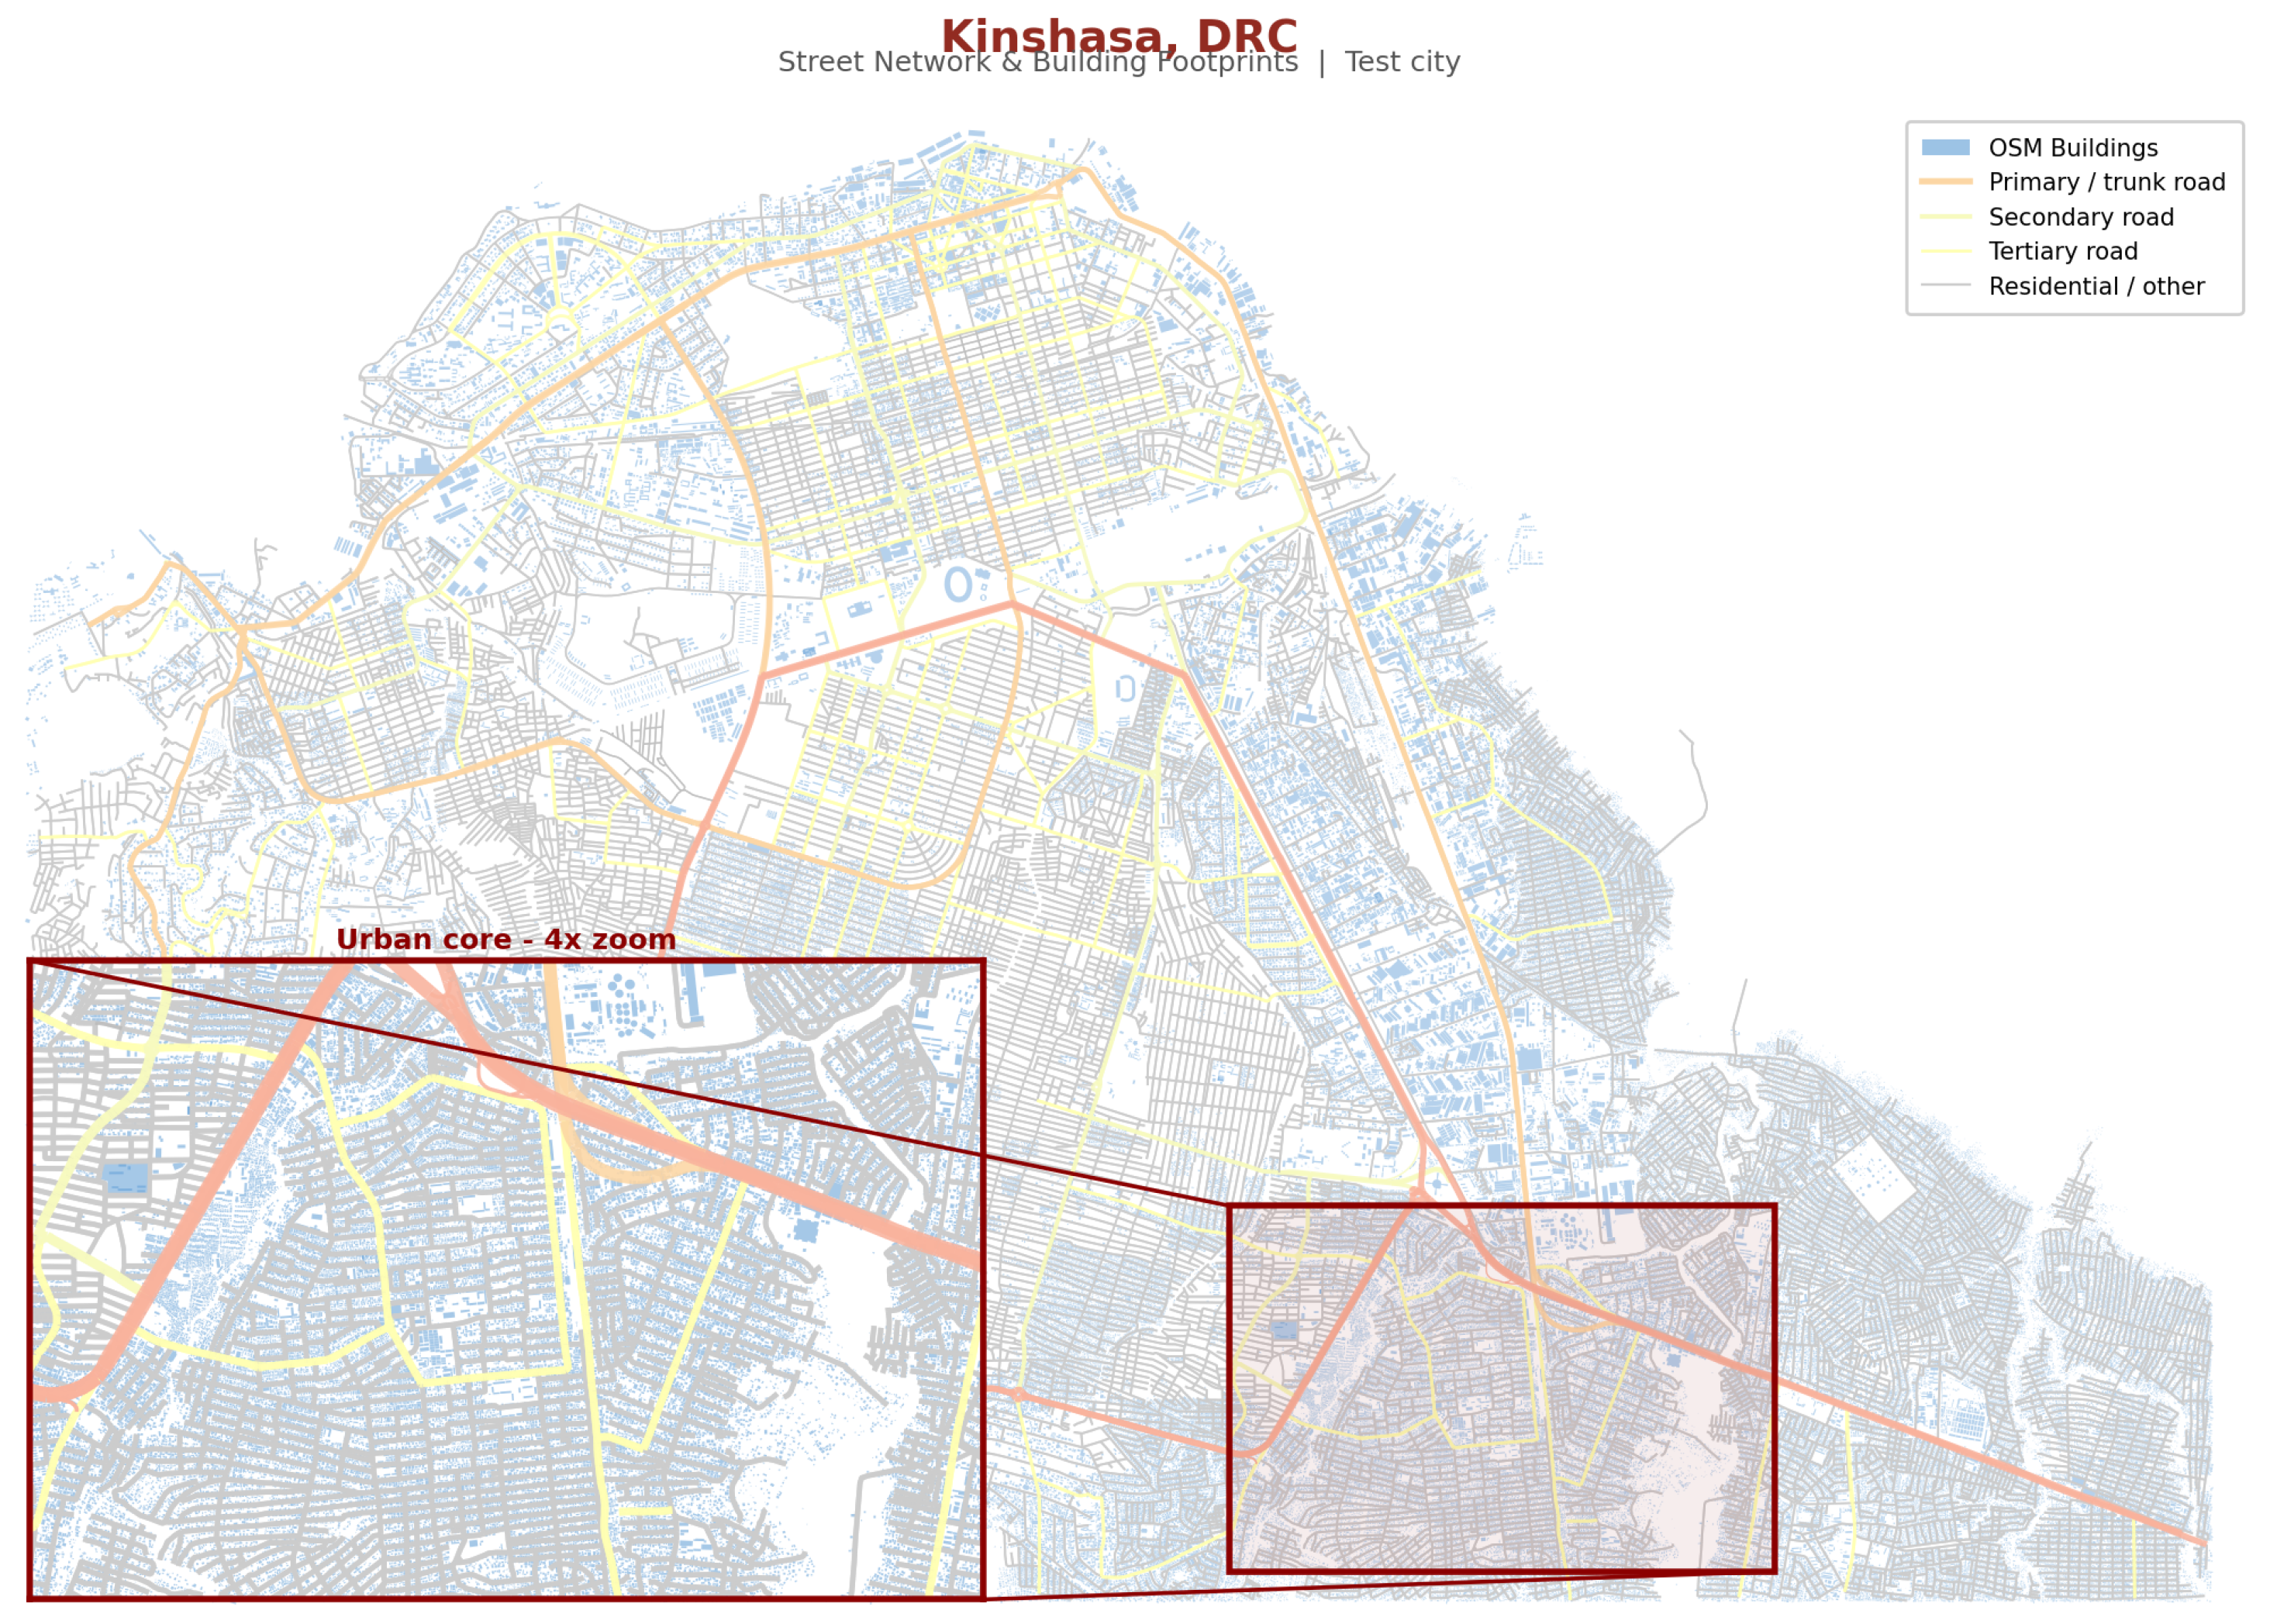
Figure 10.
Lagos: Street network and building footprints (OSM). African test city.
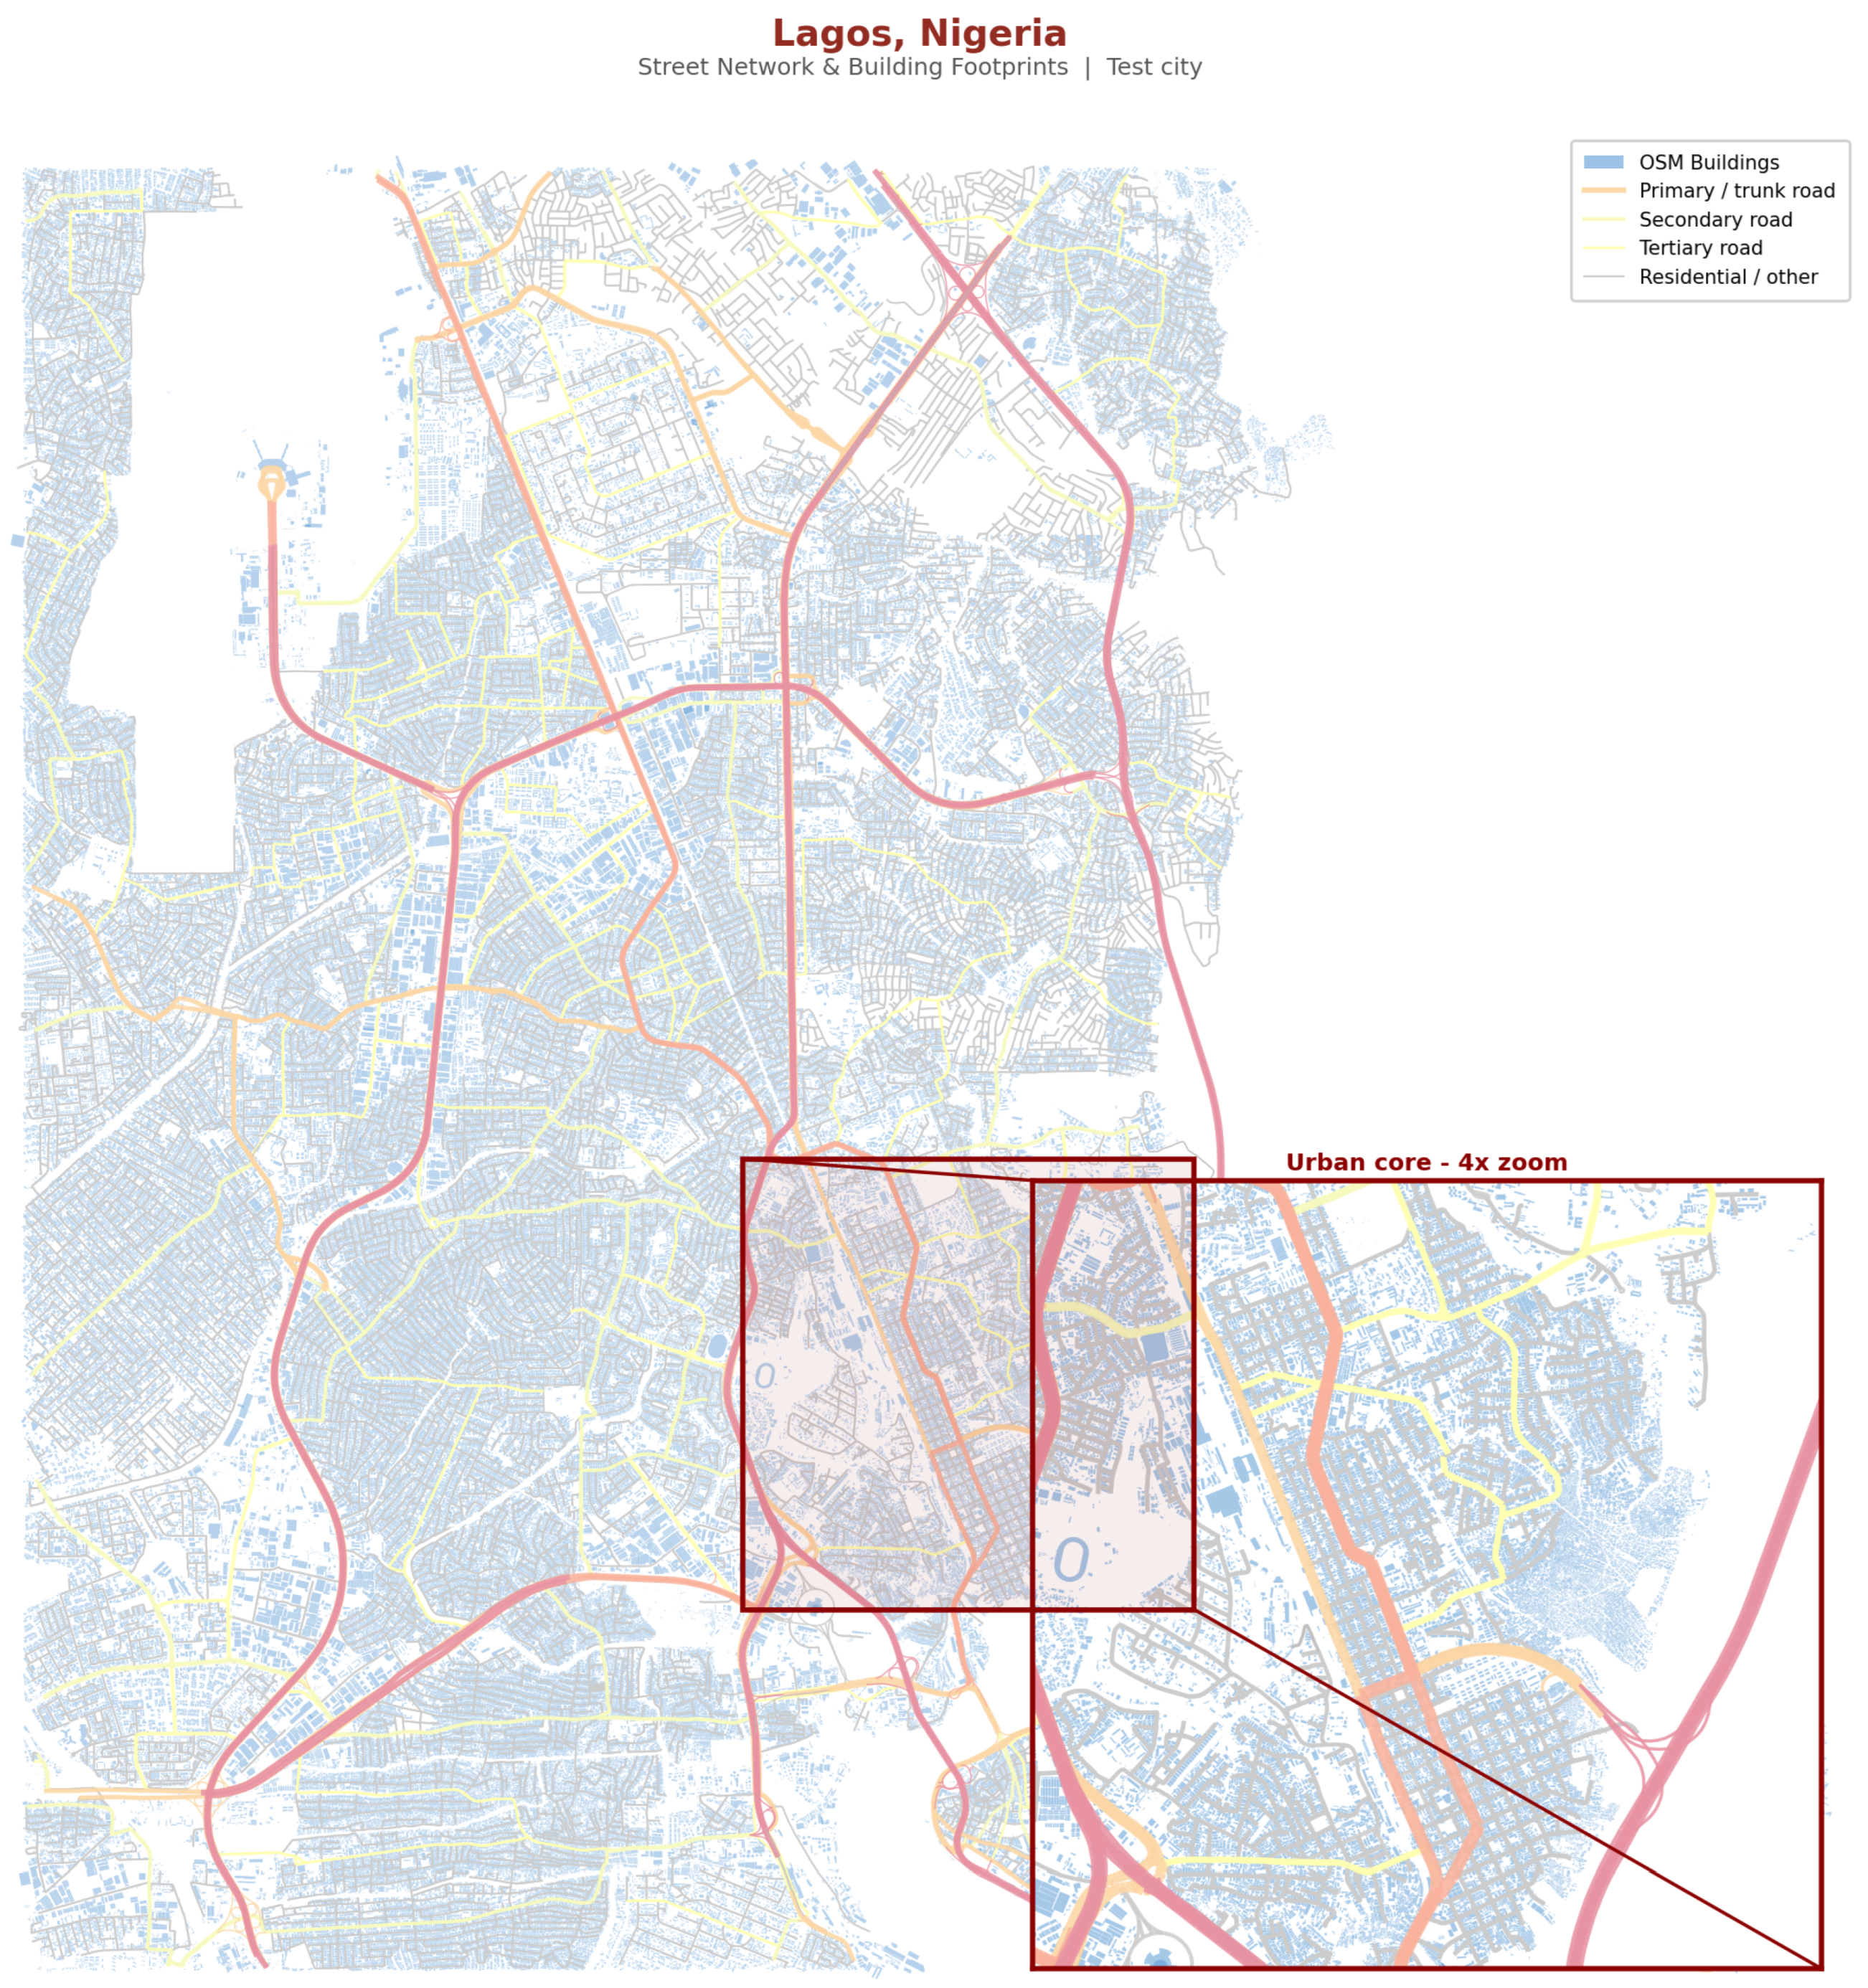
Table 1.
Comparison of European training city characteristics.
| Criterion | Stuttgart | Paris | Bern |
|---|---|---|---|
| Complete reference data | Yes (ALKIS) | Yes (BAN) | Yes (swisstopo) |
| Complex topography | Yes (207–549 m) | Partial (flat) | Yes (river/medieval) |
| Network structure | Organic + grid | Haussmann + medieval | Medieval + modern |
| Building height diversity | 1–6 stories (resid.) | 2–8 stories (Hausm.) | 1–5 stories (mixed) |
| DEM/DSM resolution | 1 m (LiDAR) | 1 m (RGE ALTI) | 0.5 m (swissALTI3D) |
| 3D building ground truth | LoD2 city model | IGN BD TOPO 3D | swissBUILDINGS3D 2.0 |
| OSM data quality | Excellent | Excellent | Excellent |
Table 2.
Integrated spatial data layers.
| Layer | Geometry | Key Attributes | Primary Source |
|---|---|---|---|
| Street network | Polyline | Name, type, one-way, surface | OSM |
| Building footprints | Polygon | Area, centroid, use class | OSM, Google Open Buildings, Microsoft |
| DEM/DSM | Raster | Elevation (m) | SRTM, AW3D30, Copernicus DEM |
| Derived bldg. height | Point/Polygon | Height (m), floors, pop. estimate | nDSM computation |
| WSF 3D | Raster (90 m) | Height, volume, area, fraction | DLR/Sentinel/TanDEM-X |
Table 3.
Data summary after cleaning and merging across all ten study cities.
| City | Role | St. Edges | OSM Build. | Google Build. | Merged Build. | Mean Area (m2) |
|---|---|---|---|---|---|---|
| Stuttgart | Train | 12,746 | 88,380 | – | 86,604 | 170.5 |
| Paris | Train | 14,812 | 144,721 | – | 102,206 | 315.7 |
| Bern | Train | 3,403 | 46,425 | – | 23,991 | 226.8 |
| Kigali | Train | 25,678 | 296,535 | 158,429 | 295,133 | 86.4 |
| Dakar | Train | 26,288 | 58,961 | 305,280 | 185,646 | 129.3 |
| Kampala | Train | 65,789 | 537,241 | – | 537,241 | 86.6 |
| Dar es Salaam | Test | 138,334 | 360,786 | 939,519 | 915,254 | 87.3 |
| Nairobi | Test | 88,688 | 262,576 | 671,357 | 569,600 | 112.8 |
| Kinshasa | Test | 52,252 | 212,402 | – | 212,402 | – |
| Lagos | Test | 39,391 | 287,593 | – | 287,593 | – |
| Total | 467,381 | 3,215,670 |
Table 4.
V1 baseline five-fold cross-validation results on European training cities.
| Classifier | Task | Metric | V1 |
|---|---|---|---|
| GBDT (200 trees, depth 5) | Connectivity error detection | F1 | 1.0000 |
| Random Forest (300 trees) | Road-type classification | F1-macro | 0.3276 |
| GBRT (200 trees, depth 5) | Address quality scoring | 0.9984 |
Table 5.
V2 five-fold cross-validation results. Arrows indicate change from V1.
| Classifier | Metric | V1 | V2 |
|---|---|---|---|
| GBDT (connectivity) | F1 | 1.0000 | 0.9943 |
| RF (road-type) | F1-macro | 0.3276 | 0.4582 |
| GBRT (quality) | 0.9984 | 0.9961 |
Table 6.
V3 five-fold cross-validation results on mixed-continent training set (3 European + 1 African city).
Table 6.
V3 five-fold cross-validation results on mixed-continent training set (3 European + 1 African city).
| Classifier | Metric | V2 | V3 |
|---|---|---|---|
| GBDT (connectivity) | F1 | 0.9943 | 0.9959 |
| RF (500 trees, depth 16) | F1-macro | 0.4582 | 0.4636 |
| GBRT (quality) | 0.9961 | 0.9985 |
Table 8.
Summary of improvements across V1–V5 model versions.
| Metric | V1 | V2 | V3 | V4 | V5 | V1→V5 |
|---|---|---|---|---|---|---|
| Training cities | 3 (EU) | 3 (EU) | 4 (3EU+1AF) | 6 (3EU+3AF) | 6 (3EU+3AF) | +3 AF |
| Edge features | 7 | 10 | 16 | 16 | 22 | +15 |
| Architecture | Flat | Flat | Flat | Flat | Hier.+Calib | Cascaded tiers |
| Conn. CV F1 | 1.000 | 0.994 | 0.996 | 0.998 | 0.998 | Saturated |
| Road-type CV F1-macro | 0.328 | 0.458 | 0.464 | 0.481 | 0.488/0.472 | +48.8% |
| Quality CV | 0.998 | 0.996 | 0.999 | 0.999 | 0.999 | Stable |
| Total addresses | – | – | 583,755 | 960,484 | 880,464 | +50.8% |
| EU mean quality | 0.810 | 0.720 | 0.719 | 0.720 | 0.720 | Stable |
| AF mean quality | 0.596 | 0.611 | 0.602 | 0.622 | 0.622 | +4.4% |
| EU–AF quality gap | 0.214 | 0.117 | 0.117 | 0.098 | 0.098 | |
| AF conn. errors | 0 | 153 | 145 | 148 | 148 | Functional |
| AF hi-conf. misclass. | 4,936 | 256 | 432 | 607 | 838 | (adapt. 767) |
| AF type disagr. | – | 120,470 | 27,004 | 39,789 | 24,237 |
Table 9.
V5 per-city evaluation (10 cities, 6 training + 4 test). Conn.: connectivity errors; Type Dis.: road-type disagreements; HiConf: high-confidence misclassifications; : adaptive threshold.
Table 9.
V5 per-city evaluation (10 cities, 6 training + 4 test). Conn.: connectivity errors; Type Dis.: road-type disagreements; HiConf: high-confidence misclassifications; : adaptive threshold.
| City | Role | Streets | Buildings | Addresses | Mean Q | Conn. | Type Dis. | HiConf | |
|---|---|---|---|---|---|---|---|---|---|
| Stuttgart | Train | 12,746 | 86,604 | 85,179 | 0.735 | 1 | 4,044 | 24 | 0.800 |
| Paris | Train | 14,812 | 102,206 | 90,291 | 0.718 | 0 | 6,233 | 8 | 0.688 |
| Bern | Train | 3,403 | 23,991 | 20,187 | 0.706 | 0 | 1,218 | 4 | 0.720 |
| Kigali | Train | 25,678 | 295,133 | 97,727 | 0.597 | 0 | 3,929 | 235 | 0.920 |
| Dakar | Train | 26,288 | 185,646 | 95,728 | 0.618 | 0 | 3,958 | 641 | 0.957 |
| Kampala | Train | 65,789 | 537,241 | 99,724 | 0.605 | 1 | 5,503 | 460 | 0.962 |
| Dar es Salaam | Test | 138,334 | 915,254 | 99,317 | 0.593 | 115 | 9,039 | 739 | 0.758 |
| Nairobi | Test | 88,688 | 569,600 | 95,326 | 0.596 | 22 | 6,370 | 505 | 0.896 |
| Kinshasa | Test | 52,252 | 212,402 | 99,810 | 0.673 | 6 | 3,663 | 248 | 0.901 |
| Lagos | Test | 39,391 | 287,593 | 97,175 | 0.627 | 5 | 5,165 | 603 | 0.901 |
| Total | 467,381 | 3,215,670 | 880,464 | 150 | 50,122 | 3,467 |
Table 10.
Sample V5-generated addresses across selected study cities. (L) = left side, (R) = right side of street.
Table 10.
Sample V5-generated addresses across selected study cities. (L) = left side, (R) = right side of street.
| City | # | Generated Address | Road Type | Dist. (m) | Area (m2) |
|---|---|---|---|---|---|
| Stuttgart | 1 | 2 Augustenstraße (R) | residential | 45.9 | 133 |
| 2 | 92 Gablenberger Hauptstraße (R) | tertiary | 29.7 | 59 | |
| Paris | 1 | 67 Avenue du Belvédère (L) | residential | 17.2 | 84 |
| 2 | 200 Rue Dutot (R) | tertiary | 26.3 | 202 | |
| Kigali | 1 | 147 KN 202 Street (L) | residential | 32.4 | 161 |
| 2 | 141 KK 12 Avenue (L) | secondary | 54.6 | 151 | |
| Dakar | 1 | 26 Rue DD-16 (R) | unclassified | 28.2 | 50 |
| 2 | 53 Route de la Corniche Ouest (L) | trunk | 21.9 | 15 | |
| Kampala | 1 | 2 Kabanda Close (R) | residential | 40.5 | 8 |
| 2 | 51 Entebbe Road (L) | primary | 25.2 | 24 | |
| Dar es Salaam | 1 | 137 Pamba Crescent (L) | residential | 54.1 | 31 |
| 2 | 54 Haile Selassie Road (R) | tertiary | 79.6 | 40 | |
| Nairobi | 1 | 187 Share Saifiyah Burhaniyah (L) | residential | 21.9 | 407 |
| 2 | 143 Gitanga Road (L) | secondary | 24.9 | 16 | |
| Kinshasa | 1 | 90 Avenue Masimaninba (R) | residential | 31.3 | 38 |
| 2 | 107 Avenue By Pass (L) | trunk | 23.6 | 51 | |
| Lagos | 1 | 184 Apapa-Oworonshoki Expwy (R) | primary | 35.5 | 80 |
| 2 | 49 Suru Alaba Road (L) | tertiary | 6.4 | 63 |
Disclaimer/Publisher’s Note: The statements, opinions and data contained in all publications are solely those of the individual author(s) and contributor(s) and not of MDPI and/or the editor(s). MDPI and/or the editor(s) disclaim responsibility for any injury to people or property resulting from any ideas, methods, instructions or products referred to in the content. |
© 2026 by the authors. Licensee MDPI, Basel, Switzerland. This article is an open access article distributed under the terms and conditions of the Creative Commons Attribution (CC BY) license (http://creativecommons.org/licenses/by/4.0/).
Copyright: This open access article is published under a Creative Commons CC BY 4.0 license, which permit the free download, distribution, and reuse, provided that the author and preprint are cited in any reuse.


