
Submitted:
13 July 2026
Posted:
16 July 2026
You are already at the latest version
Abstract
Background: The ERSPC-MRI PM is of the most widely used and extensively validated predictive model in Europe. Objective: We aimed to validate and compare the perfor-mance of the BCN-MRI PM and ERSPC-MRI PM in an Ibero-American population. Met-hods: We conducted a prospective analysis of 540 men with suspected PCa who underwent MRI and prostate biopsy in 2025. Individual csPCa risk estimates were cal-culated using the online calculators for the BCN-MRI PM and ERSPC-MRI PM. Results: The overall csPCa detection rate was 55.7%. The BCN-MRI PM demonstrated good cali-bration, with close agreement between predicted and observed csPCa probabilities, whereas the ERSPC-MRI PM underestimated risk in the intermediate-probability range. Discrimination for csPCa was significantly better with the BCN-MRI PM (AUC, 0.807; 95% CI 0.771-0.843) than with the ERSPC-MRI PM (AUC, 0.764; 95% CI 0.724-0.803; p < 0,001). Decision curve analysis showed a greater net benefit for the BCN-MRI PM than for the ERSPC-MRI PM and the strategy of biopsying all men. Clinical utility curves demon-strated a more favorable balance between avoided biopsies and missed csPCa cases across threshold probabilities. At a sensitivity of 95%, the BCN-MRI PM achieved a specificity of 38.9% (95% CI, 32.5%–45.1%) compared with 30.1% (95% CI, 24.6%–35.7%) for the ERSPC-MRI PM, avoiding 21.5% and 16.3% of biopsies, respectively (p = 0.043). The performance of both models was also evaluated according to PI-RADS category and participating center. Conclusions: In this Ibero-American cohort, the BCN-MRI PM demonstrated superior calibration and overall clinical performance compared with the ERSPC-MRI PM.
Keywords:
clinically significant prostate cancer
; predictive model
; magnetic resonance imaging
1. Introduction
Prostate cancer (PCa) is the second most commonly diagnosed malignancy among men worldwide and the third leading cause of cancer-related death in this population [1]. Early detection of clinically significant PCa (csPCa) reduce PCa-specific mortality [2,3,4], with evidence suggesting that population-based screening is more effective than opportunistic screening in achieving this benefit [5].
The diagnostic work-up for suspected PCa is typically initiated by an elevated serum prostate-specific antigen (PSA) level, usually >3.0 ng/mL. Magnetic resonance imaging (MRI) is then recommended to estimate the likelihood of csPCa using the Prostate Imaging-Reporting and Data System (PI-RADS). Combined targeted and systematic biopsies are generally recommended for men with PI-RADS scores ≥3, whereas systematic biopsy alone may be considered in men with PI-RADS scores <3 who remain at high risk of csPCa because of elevated PSA density, suspicious digital rectal examination (DRE) findings, or persistently rising PSA levels [6,7,8]. Despite this contemporary diagnostic pathway, unnecessary biopsies and overdetection of insignificant PCa (iPCa) remain major challenges [9]. To address these limitations, the European Association of Urology (EAU) recommends risk-adapted diagnostic pathways based on validated predictive models. These approaches are expected to reduce unnecessary MRI examinations and prostate biopsies while improving csPCa detection and minimizing missed csPCa cases [10,11,12,13,14,15,16]. Several MRI-based predictive models have been developed to improve risk stratification and optimize biopsy selection [17]. However, only a few provide individualized risk estimates through freely accessible and clinically applicable risk calculators [18,19]. Moreover, external validation is essential before implementing predictive models in populations other than those in which they were developed and whenever diagnostic pathways evolve over time [20,21].
The European Randomized Study of Screening for Prostate Cancer MRI-based predictive model (ERSPC-MRI PM), also known as the SWOP or Rotterdam MRI model, was developed in 2019 from the previous ERSPC risk calculators 3/4 by incorporating PI-RADS version 1 findings (https://www.prostatecancer-riskcalculator.com) [22]. The model has undergone extensive external validation across diverse populations, frequently requiring local recalibration to maintain optimal performance [23,24,25,26,27,28,29,30]. Following its validation and recalibration in a contemporary Norwegian cohort, the online calculator was updated to reflect a csPCa prevalence of approximately 20% [27]. Consequently, the developers recommend local recalibration whenever cancer detection rates differ substantially from those of the original development cohort.
The Barcelona MRI predictive model (BCN-MRI PM or BCN-PM 2) was developed in 2022 and incorporated into the Barcelona risk calculator (http://bcnrc.com), together with the BCN-PM 1 developed to be used prior MRI [31,32]. Unlike the ERSPC-MRI PM, the BCN-MRI PM was developed using PI-RADS version 2.0 and incorporates age, PSA level and MRI-derived prostate volume without range limitation, and previous negative biopsy, family history of PCa, DRE findings, and PI-RADS score. Since its development, the BCN-MRI PM has been externally validated in several contemporary clinical settings, including men receiving 5-alpha reductase inhibitors, cohorts evaluated using PI-RADS version 2.1, transperineal biopsy pathways, saturation-targeted biopsy protocols, and both European and Ibero-American populations [33,34,35,36,37].
Because individualized csPCa risk estimated generated by the ERSPC-MRI PM were available in three participating centers involved in the external validation of BCN-PM 1 and 2 and the BCN risk-stratified pathway in an Ibero-American population, we aimed to compare the calibration and clinical performance of both predictive models. The secondary objectives were: (i) to describe the baseline characteristics of the overall study population and assess heterogeneity among participating centers; (ii) to compare model calibration, discrimination, and net benefit for csPCa detection; (iii) to compare the overall clinical effectiveness of both models, particularly at high sensitivity thresholds for csPCa detection; and (iv) to compare the clinical utility of both predictive models according the PI-RADS scores and participant centers.
2. Materials and Methods
2.1. Design, Setting, and Participants
A retrospective validation and performance comparison of BCN-MRI PM and ERSPC-MRI PM was conducted in an Ibero-American cohort of 540 men with suspected PCa who underwent MRI and prostate biopsy in 2025. This cohort was selected from 2017 men enrolled in a prospective validation study of the BCN-risk stratified pathway across eight centers in Ibero-America: four in Argentina, two in Spain, one in Chile, and one in México. Instituto Alexander Fleming (IAF) in Buenos Aires (Argentina), Cruz Blanca (CB) in Barcelona (Spain), and Hospital Clínico de la Universidad de Chile (HCUCH) in Santiago (Chile), additionally reported individual csPCa risk estimates derived from the ERSPC-RC for men who underwent MRI, comprising in 239, 189 and 113 cases, respectively (Figure 1).
2.2. PCa Suspicion and Diagnostic Approach for csPCa
PCa suspicion was identified as serum PSA level > 3.0 ng/mL, and/or a suspicious DRE [8]. All participants underwent multiparametric MRI. A 1.5-Tesla strength field scanner was used at IAF, whereas and 3-Tesla were used at CB and HCUCH. A surface phased-array coil was used in all cases. MRI examinations were performed according to the recommendations of the European Society of Urogenital Radiology and included T2-weighted, diffusion-weighted, and dynamic contrast enhanced sequences [38]. All MRI examinations were interpreted locally by experienced radiologists using PI-RADS v2.1 [39,40]. Cognitive MRI-transrectal ultrasound (TRUS) fusion guided-biopsy was performed at IAF, whereas CB and HUCH used software-based fusion techniques. All prostate biopsies were performed via the transperineal route. Targeted biopsies of PI-RADS > 3 lesions included 2–4 cores per lesion (up to three lesions) at IAF and HCUCH, whereas mapping at 5-mm intervals was performed at CB. In all center’s targeted biopsies were complemented by a 12-core systematic biopsy. Men with PI-RADS < 3 and a high risk of csPCa, based on elevated PSA density, suspicious DRE findings, or increased PSA level, underwent a 12-core systematic biopsy. All biopsies we performed by experienced local urologists. Biopsy specimens were analyzed in local pathology departments by dedicated uropathologists. CsPCa was defined as an International Society of Urologic Pathology (ISUP) Grade Group was ≥ 2 [41,42].
2.3. Assessment of Individual csPCa Risk Using the BCN-MRI PM and ERSPC-MRI PM.
Individual risks of csPCa risks were calculated using the BCN-RC (http://barcelonarc.com) and the recalibrated version of the ERSPC-RC (https://www.prostatecancer-riskcalculator.com).
2.4. Statistical Analysis.
Data were reported according to the Standards of Reporting for MRI-targeted Biopsy Studies (START) guidelines [43], and anonymized datasets were harmonized across centers. Continuous variables were expressed as medians and interquartile range (IQR), whereas categorical variables were reported as frequencies and percentages. The Mann–Whitney U test and Kruskal–Wallis tests were use to compare continuous variables between two or more groups, respectively, whereas Pearson’s chi-square test was used to compare categorical variables. Correlation between risks estimated was analyzed with Cohen´s Kappa Index. Odds ratios of csPCa and corresponding 95% confidence intervals (CIs) were calculated when appropriate. Heterogeneity among centers was assessed by comparing their baseline characteristics. Model calibration using calibration plots, calibration-in-the-large, calibration slope, and Brier score metrics. Discrimination for csPCa was evaluated using Receiver operating characteristic (ROC) curves, and areas under the curve (AUCs), which were compared using the DeLong’s test. Decision curve analysis (DCA) was used to evaluate net benefit. Clinical utility curves (CUCs) were used to estimate the proportion of avoided biopsies and missed csPCa cases across a range of threshold probabilities. Thresholds corresponding to high csPCa sensitivity levels were identified, and corresponding specificities, and avoided biopsies were compared between models. The clinical performance of both models was also evaluated according to PI-RADS category and participating center using aforementioned statistical methods. All statistical tests were two-sided, and p-value < 0.05 was considered significant. Statistical analyses were performed using R software (version 4.3.2; R Foundation for Statistical Computing, Vienna, Austria).
3. Results
3.1. Characteristics of the Study Population.
The distribution of variables included in the BCN-MRI PM and ERSPC-MRI PM is summarized in Table 1. A family history of PCa, a variable included only in the BCN-MRI PM, was present in 10.9% of participants. A suspicious DRE was observed in 18.9% of participants; however, it was the sole indication for PCa suspicion (PSA level < 3.0 ng/mL) in 15 men (2.8%), among whom 7 cases of csPCa (2.3%) were detected. Treatment with 5-alpha reductase inhibitors (5-ARIs) was reported in 24 participants, of whom 11 (45.8%) were diagnosed with csPCa, compared with 290 of 516 participants (56.2%) who were not receiving 5-ARI treatment (p = 0.317).
The overall rate of csPCa detection rate was 55.7%. The distribution of csPCa according to PI-TADS category is presented in Table 2. Notably, 5.2% participants underwent prostate biopsy with PI-RADS < 3.
3.2. Analysis and Correlation of csPCa Probabilities Calculated by the BCN-MRI PM and ERSPC-MRI PM.
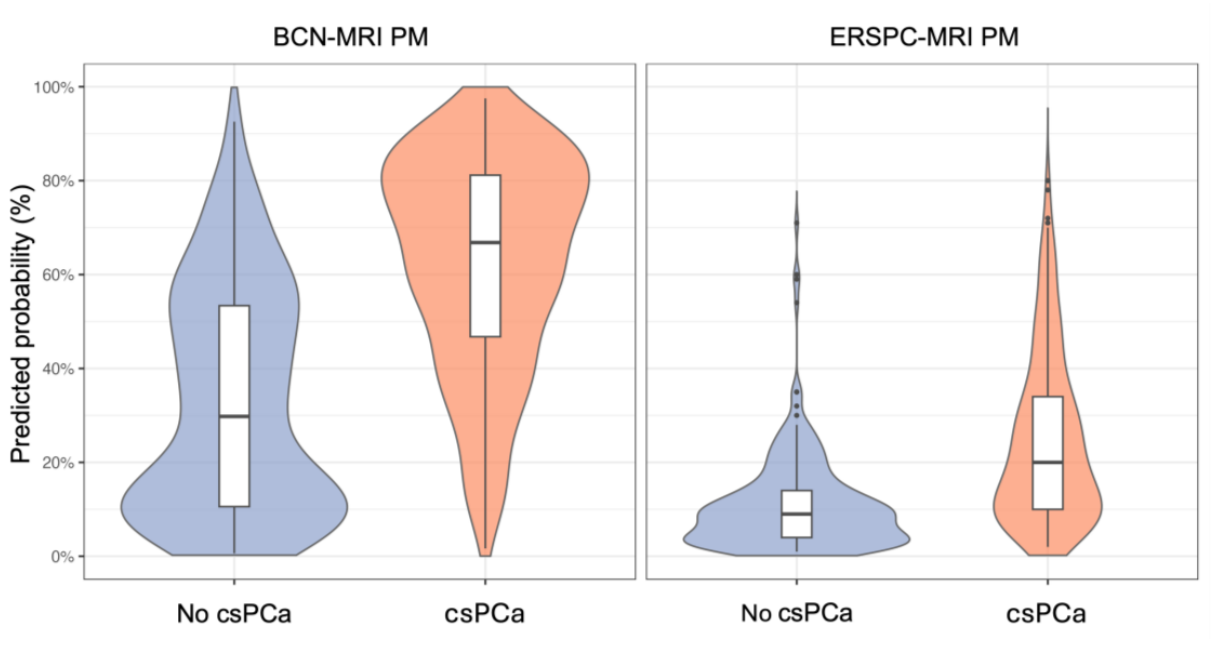
The median probability of csPCa according to the BCN-MRI PM was 29.8% (IQR, 10.5%–53.4%) in men without csPCa and 66.8% (IQR, 47.7%–81.2%) in those with detected csPCa (p < 0.001). The corresponding median probabilities calculated by the ERSPC-MRI PM were 9.1% (IQR, 4.2%–14.3%) and 20.2% (IQR, 10.6%–34.1%), respectively, (p < 0.001). Both models yielded significantly higher csPCa predicted risks in men with csPCa than in those without csPCa (p < 0.001). However, violin plots demonstrated a broader distribution of predicted risks for the BCN-MRI PM, whereas the ERSPC-MRI PM generated lower risk estimates and showed greater overlap between the two groups (Figure 1).
Figure 2.
Violin plots illustrating the distribution of predicted csPCa risk in men with and without csPCa detected, assessed with the BCN-MRI PM and ERSPC-MRI PM.
Figure 2.
Violin plots illustrating the distribution of predicted csPCa risk in men with and without csPCa detected, assessed with the BCN-MRI PM and ERSPC-MRI PM.
The overall correlation between BCN-MRI PM and ERSPC-MRI PM probabilities is presented in Figure 3. The Kappa index was 0.143 (95% CI 0.118–0.167), p < 0.001. That means a poor correlation between both csPCa probabilities, even in men with and without csPCa detected. This poor correlation is particularly important within the intermediate-risk range (Figure 3).
3.3. Analysis of Heterogeneity Between Participant Centers.
Characteristics of each participant center are summarized in Table 3. We note that median age and prostate volume, and percentages of suspicious DRE findings and family history of PCa were similar in the three participant centers. However, median serum PSA, and percentages of prior negative biopsy, 5-ARI treatments and PI-RADS distributions were significantly different. The most important variable was the endpoint csPCa detection rate, which was 64% in CB, 55.5% in IAF, and 41.6% in HCUCH, p < 0.001.
3.4. Calibration of BCN-MRI PM and ERSPC-MRI PM.
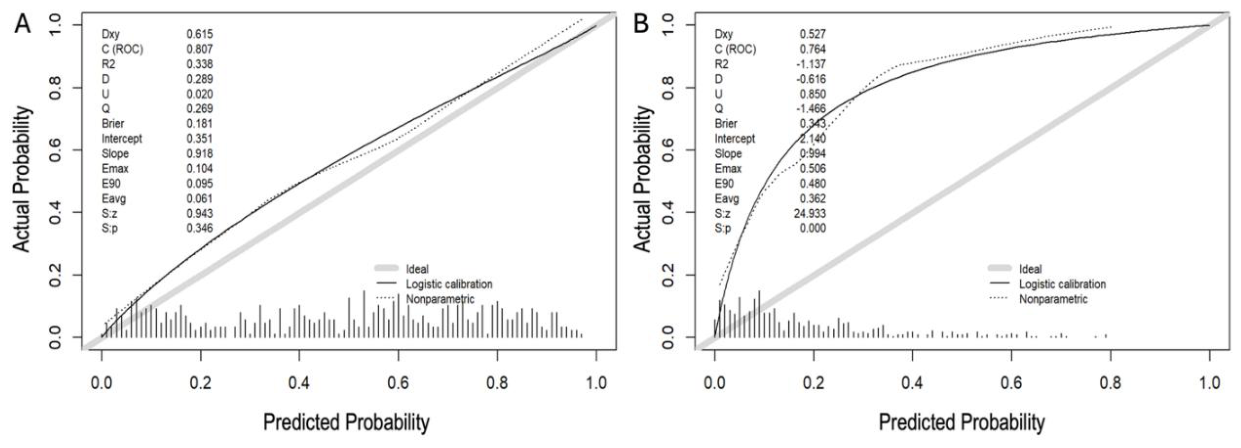
Calibration plots and metrics demonstrated good agreement between predicted and observed probabilities of csPCa for the BCN-MRI PM, whereas the ERSPC-MRI PM was substantially miscalibrated, particularly underestimating risk in the intermediate-probability range (Figure 3). For the BCN-MRI PM, the calibration-in-the-large was 0.351 (95% CI, 0.122–0.241), and the calibration slope was 0.918 (95% CI, 0.725–1.121). In contrast, the ERSPC-MRI PM showed a CITL of 2.140 (95% CI, 1.920–3.430) and a calibration slope of 0.994 (95% CI, 0.704–1.321).
Figure 4.
Calibration plots and corresponding calibration metrics for BCN-MRI PM (A) and ERSPC-MRI PM (B) in predicting csPCa.
Figure 4.
Calibration plots and corresponding calibration metrics for BCN-MRI PM (A) and ERSPC-MRI PM (B) in predicting csPCa.
3.5. Discrimination of csPCa from the BCN-MRI PM and ERSPC-MRI PM.
Discrimination for csPCa was significantly higher for the BCN-MRI PM (AUC of 0.807, 95% CI 0.771-0.843) than for the ERSPC-MRI PM (AUC 0.764, 95% CI 0.724-0.803; p < 0.001) (Figure 5).
3.6. Net Benefit of BCN-MRI PM and ERSPC-MRI PM.
Decision curve analysis (DCAs) demonstrated a greater net benefit for the BCN-MRI PM than for the ERSPC-MRI PM across a wide range of threshold probabilities (Figure 6). The BCN-MRI PM provided a net benefit compared with the strategy of biopsying all men beginning at a 10% threshold probability of csPCa and maintained this benefit across higher threshold probabilities. In contrast, the ERSPC-MRI PM showed a smaller net benefit and only outperformed the biopsy-all strategy at threshold probabilities above 56%.
3.7. Clinical Utility of BCN-MRI PM and ERSPC-MRI PM.
Clinical utility curves (Figure 7) represent the rates of avoided biopsies and missed csPCa cases across the continuous threshold probability points. It is visually observed that area between curves of the BCN-MRI PM is greater than that of ERSPC-MRI PM. Supplementary Table 1 presents the rates of avoided biopsies and missed csPCa cor-responded to each 5% increase of the threshold probability point.
From the clinical point of view, an important challenge is to miss the less acceptable rate of csPCa detection. Comparison of the efficacy of both predictive models can be assessed fixing a selected sensitivity to assess the specificity and rates of avoided biopsies. Specificities at high sensitivity thresholds can be clinically relevant because minimizing missed cases of csPCa is critical when selecting an appropriate threshold probability for recommending prostate biopsy. Table 4 compares the specificities of the BCN-MRI PM and ERSPC-MRI PM at sensitivity levels of 100%, 95%, and 90%. The BCN-MRI PM demonstrated higher specificities at the 95% and 90% sensitivity thresholds; however, these differences did not reach statistical significance.
A sensitivity threshold of 95% ensures that no more than 5% of csPCa cases are missed by either predictive model. At this sensitivity level, a 17% risk threshold for the BCN-MRI PM avoided 21.5% of biopsies, whereas a 5% risk threshold for the ERSPC-MRI PM avoided 16.3% of biopsies, both at the cost of missing 5% of csPCa cases (p = 0.043).
3.8. Performance and Clinical Utility of the BCN-MRI PM and ERSPC-MRI PM According to PI-RADS Categories.
Although the overall utility of the BCN-MRI PM and ERSPC-MRI PM has been established in the study cohort, their performance across PI-RADS categories remains essential. Supplementary Figure 1 presents the violin plots of both risk distributions of men with and without csPCa detected at each PI-RADS category. Similar findings that in overall cohort distribution are seen at each PI-RADS category although increasing the risk across them. ERSPC-MRI PM risks were lower than BCN-MRI PM´s with high overlap between those in men with and without csPCa.
In PI-RADS 2, due to the low number of cases (28 with 2 csPCa cases detected) only discrimination analysis could be performed, showing the BCN-MRI PM an AUC of 0.904 (95% 0.741-1.000) compare with 0,694 (95% CI 0.162-1.000), but not compared (Supplementary Figure 2). In PI-RADS 3, the AUC of BCN-MRI PM was 0.829 (0.740-0.918) compared to 0.672 (95% CI 0.563-0.780), p < 0.001, (Supplementary Figure 3). BCN-MRI PM demonstrated net benefit over biopsy all men from the 5% probability threshold, while the ERSPC did not show net benefit (Supplementary Figure 4). CUCs demonstrated higher area between avoided biopsies and missed csPCa cases for the BCN-MRI PM compare with that of ERSPC-MRI PM (Supplementary Figure 5). In PI-RADS 4, the AUC of BCN-MRI PM was 0.696 (0.759-0.635) compared to 0.666 (95% CI 0.729-0.603), p = 0.279, (Supplementary Figure 6). BCN-MRI PM demonstrated net benefit over biopsy all men from the 40% probability threshold, while the ERSPC did not show net benefit (Supplementary Figure 7). CUCs demonstrated little bigger area between avoided biopsies and missed csPCa cases for the BCN-MRI PM compare with that of ERSPC-MRI PM (Supplementary Figure 8). In PI-RADS 5, the AUC of BCN-MRI PM was 0.722 (0.842-0.602) compared to 0.681 (95% CI 0.574-0.799), p = 0.278, (Supplementary Figure 9). BCN-MRI PM demonstrated net benefit over biopsy all men from the 60% probability threshold, while the ERSPC did not show net benefit (Supplementary Figure 10). CUCs demonstrated little bigger area between avoided biopsies and missed csPCa cases for the BCN-MRI PM compare with that of ERSPC-MRI PM (Supplementary Figure 11).
The rates of avoided biopsies and missed csPCa cases using the overall 95% sensitivity thresholds are showed below.

Table 5.
Saved biopsies and missed csPCa cases according to PI-RADS categories, using the corresponding 95% sensitivity thresholds for the BCN-MRI PM and ERSPC-MRI PM.
Table 5.
Saved biopsies and missed csPCa cases according to PI-RADS categories, using the corresponding 95% sensitivity thresholds for the BCN-MRI PM and ERSPC-MRI PM.
|
PI-RADS score |
BCN-MRI PM (17% threshold) | ERSPC-MRI PM (5% threshold) | ||
|
Saved biopsies n (%) |
Missed csPCa n (%) |
Saved biopsies n (%) |
Missed csPCa n (%) |
|
| 2 | 17/28 (60.7) | 1/2 (50) | 11/28 (38.3) | 1/2(50) |
| 3 | 70/98 (71.4) | 8/25 (32.0) | 62/98(63.3) | 11/25(44.0) |
| 4 | 18/277 (6.5) | 4/162 (2.5) | 15/277 (5.4) | 3/162 (1.9) |
| 5 | 11/137 (6.0) | 2/112 (1.8) | 0/137 (0) | 0/112 (0) |
| All | 116/540 (21.5) | 15/301 (5.0) | 88/540 (16.3) | 15/301 (5.0) |
However, to assess and compare the true clinical utility of BCN-MRI PM and ERSPC-MRI PM we need to fix the appropriate specific sensitivities for csPCa detection across PI-RADS which detecting the overall 95% sensitivity (Table 6). We began establishing a 100% sensitivity for PI-RADS 5, which was reached only by the BCN-MRI PM, avoiding 1.5% of biopsies. We considered to establish 97.5% sensitivity in PI-RADS 4, and 7.6% of biopsies compared to 4.3% using the ERSPC-PM. Thereafter, we consider that 50% sensitivity for previously screened PI-RADS 2 was fine, resulting in 96.4% avoided biopsies for the BCN-MRI PM compared with 89.3% for ERSPC-MRI PM. Finally, we looked for the remain 60% sensitivity to be applied in PI-RADS 3, which allow to avoided 80% of biopsies with the BCN-MRI-PM compared to 64.3% with ERSPC-MRI PM.
3.9. Clinical Utility of the BCN-MRI PM and ERSPC-MRI PM According to Participant Centers.
Because heterogeneity among participant centers have been previously demonstrated, the clinical utility of the overall 95% sensitivity thresholds established for the BCN-MRI PM and ERSPC-MRI PM was evaluated separately for each center (Table 7). We observed that overall, 95% sensitivity thresholds did not correspond to the same sensitivity at each participating center. Nevertheless, the difference between avoided biopsies and missed csPCa cases was consistently greater for the BCN-MRI PM compared for the ERSPC-MRI PM across centers
Additional analyses of discrimination for csPCa (ROCs and AUCs), net benefit (DCAs) and clinical utility (CUCs) for both models according to participating centers are presented in supplementary materials. Discrimination for csPCa was significantly higher for the BCN-MRI PM than for the ERSPC-MRI PM at CB, with an AUC of 0.901 (95% CI, 0.855–0.947) versus 0.838 (95% CI, 0.782–0.893), respectively (p = 0.005; Supplementary Figure S12). At IAF, the BCN-MRI PM also demonstrated significantly better discrimination than the ERSPC-MRI PM, with AUCs of 0.813 (95% CI, 0.759–0.867) and 0.747 (95% CI, 0.686–0.808), respectively (p = 0.002; Supplementary Figure S13). At HCUCH, discrimination was similar between the two models, with an AUC of 0.669 (95% CI, 0.568–0.769) for the BCN-MRI PM and 0.676 (95% CI, 0.577–0.774) for the ERSPC-MRI PM (p = 0.769; Supplementary Figure S14). Decision curve analysis demonstrated a greater net benefit for the BCN-MRI PM than for the ERSPC-MRI PM over the strategy of biopsying all men at CB (Supplementary Figure S15), IAF (Supplementary Figure S16), and HCUCH (Supplementary Figure S17). Likewise, CUCs consistently demonstrated greater clinical utility for the BCN-MRI PM than for the ERSPC-MRI PM across all participating centers (Supplementary Figures S18–S20). Analyses of discrimination for csPCa, net benefit, and clinical utility of the BCN-MRI PM and ERSPC-MRI PM accor-ding to both, participating center and PI-RADS category, were not performed due to the insufficient number of cases.
4. Discussion
The present external validation demonstrates that the BCN-MRI PM maintained good calibration and superior clinical performance compared with the ERSPC-MRI PM in an Ibero-American cohort of men undergoing opportunistic screening for clinically significant prostate cancer (csPCa). Although both models showed good discrimination, the BCN-MRI PM achieved a higher AUC, greater net benefit across clinically relevant threshold probabilities, and a more favorable balance between avoiding unnecessary biopsies and maintaining csPCa detection. In contrast, the ERSPC-MRI PM systematically underestimated the probability of csPCa, particularly among men at intermediate predicted risk.
Several factors may explain the poorer calibration of the ERSPC-MRI PM. Although the development cohorts of the BCN-MRI PM and ERSPC-MRI PM had very similar csPCa detection rates (36.4% and 35.9%, respectively) [22,32], important differences existed between those cohorts and the present validation population. Most notably, only 5.2% of biopsied men in the present cohort had PI-RADS <3 lesions, compared with 21.2% and 17.7% in the development cohorts of the BCN-MRI PM and ERSPC-MRI PM, respectively [22,32]. This discrepancy reflects current recommendations to restrict biopsy in men with PI-RADS < 3 MRI findings to those with persistent clinical suspicion of csPCa, such as elevated PSA density, abnormal digital rectal examination findings, or persistently increasing PSA levels. Consequently, men with PI-RADS < 3 lesions represented a highly selected subgroup, which may have contributed to the observed model miscalibration.
Differences in imaging interpretation and biopsy strategy may also have influenced model performance. The ERSPC-MRI PM was developed using PI-RADS version 1.0, whereas the BCN-MRI PM was based on PI-RADS version 2.0, which is more closely aligned with the PI-RADS version 2.1 classification used in the present cohort. Furthermore, transrectal biopsy was used in the development cohorts of both models, whereas the transperineal approach predominated in the present study [22,32]. These methodological differences may have affected lesion characterization and csPCa detection, thereby influencing model calibration.
The different calibration performance of both models was further reflected in the distribution of predicted risks. Although both models generated significantly higher predicted risks in men with csPCa than in those without csPCa, the ERSPC-MRI PM consistently assigned lower predicted probabilities, with a narrower distribution and greater overlap between patients with and without csPCa. This pattern is consistent with its tendency to underestimate csPCa risk, particularly at intermediate predicted probabilities, and was further supported by the correlation analysis comparing risk estimates from both models. Similar findings have previously been reported in an independent external validation of the BCN-MRI PM [29]. In addition, the current version of the ERSPC-RC was recalibrated in a population with a csPCa detection rate of approximately 20% [12], substantially lower than the 55.7% observed in the present validation cohort. This difference in disease prevalence may have further contributed to the systematic underestimation of risk by the ERSPC-MRI PM.
The superior calibration of the BCN-MRI PM translated into greater clinical utility. Decision curve analysis demonstrated consistently higher net benefit across clinically relevant threshold probabilities, whereas the ERSPC-MRI PM provided only marginal benefit over a biopsy-all strategy, particularly at higher thresholds. Clinical utility curves also favored the BCN-MRI PM, indicating a more favorable trade-off between reducing unnecessary biopsies and maintaining csPCa detection. Because screening strategies should prioritize high sensitivity, we further compared both models at a fixed sensitivity of 95% for csPCa detection. Although the required thresholds differed substantially (17% for the BCN-MRI PM and 6% for the ERSPC-MRI PM), the BCN-MRI PM avoided significantly more biopsies (21.5% vs. 16.5%). Nevertheless, these thresholds corresponded to the lower end of the predicted risk spectrum, where calibration and predicted risks of both models were more similar [29]
Beyond the overall comparison between BCN- and ERSPC-MRI PM, stratification according to PI-RADS categories provided additional insights into their clinical applicability. Previous studies have demonstrated that combining clinical variables with PI-RADS assessment improves MRI-based risk stratification [17,18,19,20,21,22,23,24,25,26,27,28], although most validation studies have focused primarily on PI-RADS 3 lesions [44,45,46,47,48,49,50,51,52,53,54,55]. Our findings indicate that evaluating predictive models across the entire PI-RADS spectrum provides a more comprehensive assessment of their clinical value. Notably, the BCN-MRI PM maintained 100% sensitivity in men with PI-RADS 5 lesions while avoiding a small proportion of unnecessary biopsies, whereas the ERSPC-MRI PM did not achieve complete sensitivity in this subgroup. Similar trends favoring the BCN-MRI PM were observed in PI-RADS 4, 3, and 2 lesions. Although these differences were not statistically significant, they consistently suggested greater clinical usefulness of the BCN-MRI PM across all MRI suspicion categories. Moreover, adapting decision thresholds according to PI-RADS category increased overall biopsy avoidance while maintaining an overall sensitivity of 95%, supporting the use of PI-RADS specific risk-adapted biopsy strategy.
Several limitations should be acknowledged. First, only three participating centers had complete information required to calculate both predictive models, which may have introduced selection bias. Second, the low proportion of biopsied men with PI-RADS < 3 lesions limited the precision of subgroup analyses and reflected contemporary biopsy practices rather than an unselected screening population. Third, heterogeneity among participating centers suggests that center-specific validation stratified by PI-RADS category would provide additional information; however, the number of men within individual centers was insufficient to obtain robust estimates.
Risk prediction models inevitably reflect the characteristics of the populations and clinical practices in which they were developed, and need risk calculators to facilitate their clinical use [56]. Consequently, temporal changes in diagnostic pathways and differences between development and validation cohorts may progressively reduce model calibration, highlighting the need for periodic recalibration and adjustment of decision thresholds [57]. Future developments should focus on dynamic prediction models capable of continuous updating through multicenter data integration [58], machine learning methodologies [59], and federated learning frameworks [36,60,61], enabling robust and continuously validated risk prediction across diverse clinical settings.
5. Conclusions
The BCN-MRI PM demonstrated good calibration in an Ibero-American population with suspected PCa, whereas the ERSPC-MRI PM underestimated the risk of csPCa, particularly at intermediate predicted probabilities. Although both models showed distinct performance patterns, the ERSPC-MRI PM generated lower and narrower predicted probabilities of csPCa, while the BCN-MRI PM achieved superior discrimination, net benefit, and overall clinical utility. This translated into a more favorable balance between avoided biopsies and missed csPCa cases in the overall study population. After applying PI-RADS-specific risk thresholds to maintain appropriate sensitivity, the BCN-MRI PM consistently outperformed the ERSPC-MRI PM across all PI-RADS categories. Nevertheless, its clinical utility varied according to PI-RADS score, being limited in PI-RADS 5, modest in PI-RADS 4, and greatest in PI-RADS 2 and 3. These findings also highlight the need to adjust decision thresholds according to the characteristics of individual participating centers to ensure optimal diagnostic performance.
Supplementary Materials
The following supporting information can be downloaded at the website of this paper posted on Preprints.org, Table S1: Percentage of undetected csPCa and saved biopsies according to a 5% increase threshold for the BCN-MRI PM and ERSPC-MRI PM.; Figure S1. Violin plots showing the distribution of BCN- and ERSPC-MRI PM probabilities for csPCa, in men with and without csPCa, according to PI-RADS category,; Figure S2: Discrimination for csPCa by the BCN-MRI PM and ERSPC-MRI PM in men suspected of having PCa with PI-RADS 2,; Figure S3: Discrimination for csPCa of the BCN-MRI PM and ERSPC-MRI PM in men suspected of having PCa with PI-RADS 3,; Figure S4; Net benefit over biopsying all men or none of BCN-MRI PM and ERSPC-MRI PM, in men with suspected PCa and PI-RADS 3,; Figure S5: Clinical utility in terms of avoided prostate biopsies and missed csPCa in men with suspected PCa and PI-RADS 3,; Figure S6: Discrimination for csPCa by the BCN-MRI PM and ERSPC-MRI PM in men suspected of having PCa with PI-RADS 4,; Figure S7: Net benefit over biopsying all men or none of BCN-MRI PM and ERSPC-MRI PM, in men with suspected PCa and PI-RADS 4,; Figure S8: Clinical utility in terms of avoided prostate biopsies and missed csPCa in men with suspected PCa and PI-RADS 4,; Figure S9. Discrimination for csPCa by the BCN-MRI PM and ERSPC-MRI PM in men suspected of having PCa with PI-RADS 5,; Figure S10: Net benefit over biopsying all men or none of BCN-MRI PM and ERSPC-MRI PM in men with suspected PCa and PI-RADS 5,; Figure S11: Clinical utility in terms of avoided prostate biopsies and missed csPCa,; Figure S12: Discrimination for csPCa by the BCN-MRI PM and ERSPC-MRI PM in men suspected of having PCa at Creu Blanca,; Figure S13: Discrimination for csPCa by the BCN-MRI PM and ERSPC-MRI PM in men suspected of having PCa at Instituto Alexander Fleming,; Figure S14; Discrimination for csPCa by the BCN-MRI PM and ERSPC-MRI PM in men suspected of having PCa at Hospital Clínico de la Universidad de Chile,; Figure S15: Net benefit of the BCN-MRI PM and ERSPC-MRI PM in men suspected of having PCa at Creu Blanca,; Figure S16: Net benefit of the BCN-MRI PM and ERSPC-MRI PM in men suspected of having PCa at Instituto Alexander Fleming; Figure S17: Net benefit of the BCN-MRI PM and ERSPC-MRI PM in men suspected of having PCa at Hospital Clínico de la Universidad de Chile,; Figure S18: Clinical utility in terms of avoided prostate biopsies and missed csPCa in men from Cruz Blanca,; Figure S19: Clinical utility in terms of avoided prostate biopsies and missed csPCa in men from Instituto Alexander Fleming.; Figure S20: Clinical utility in terms of avoided prostate biopsies and missed csPCa in men from Hospital Clínico de la Universidad de Chile.
Author Contributions
Conceptualization, J.M. and N.P.; methodology, B.M.; formal analysis, B.M. and J.M.; data curation, N.P., J.C., T.E.O., J.I.G., M.R.,; writing—original draft preparation, J.M.; writing—review and editing, B.M., N.P., L.R., O.M. and E.T.; supervision, O.M., E.T. and J.M.; project administration, J.M.; funding acquisition, O.M. All authors have read and agreed to the published version of the manuscript.
Funding
This research was funded by the Instituto de Salud Carlos III (SP), grant number PI23/03010.
Institutional Review Board Statement
The study was conducted in accordance with the Declaration of Helsinki, and approved by the Ethics Committee of the Vall d’Hebron Research Institute (protocol code PRAG02/2021, approved on 12 February 2021).
Informed Consent Statement
Informed consent was obtained from all subjects involved in the study.
Data Availability Statement
The data presented in this study are available on request from the corresponding author.
Conflicts of Interest
The authors declare no conflicts of interest.
Abbreviations
The following abbreviations are used in this manuscript:
| AUC | Area under the curve |
| BCN-MRI PM | Barcelona MRI predictive model |
| CI | Confidence interval |
| csPCa | Clinically significant PCa |
| CUC | Clinical utility curve |
| DCA | Decision curve analysis |
| DRE | Digital rectal examination |
| EAU | European Association of Urology |
| ERSPC-MRI PM | European Randomized Screening Prostate cancer MRI predictive model |
| iPCa | Insignificant PCa |
| IQR | Interquartile range |
| MRI | Magnetic resonance imaging |
| PCa | Prostate cancer |
| PI-RADS | Prostate Imaging–Reporting and Data System |
| PSA | Prostate-specific antigen |
| ROC | Receiver operating characteristic |
| TRUS | Transrectal ultrasound |
References
- Bray, F.; Laversanne, M.; Sung, H.; Ferlay, J.; Siegel, R.L.; Soerjomataram, I.; Jemal, A. Global cancer statistics 2022: GLOBOCAN estimates of incidence and mortality worldwide for 36 cancers in 185 countries. CA Cancer J. Clin. 2024, 74, 229–263. [Google Scholar] [CrossRef] [PubMed]
- Schroder, F.H.; Hugosson, J.; Roobol, M.J.; Tammela, T.L.; Ciatto, S.; Nelen, V.; Kwiatkowski, M.; Lujan, M.; Lilja, H.; Zappa, M.; et al. Screening and prostate-cancer mortality in a randomized European study. N Engl. J. Med. 2009, 360, 1320–1328. [Google Scholar] [CrossRef] [PubMed]
- Frånlund, M.; Månsson, M.; Godtman, R.A.; Aus, G.; Holmberg, E.; Kollberg, K.S.; Lodding, P.; Pihl, C.G.; Stranne, J.; Lilja, H.; et al. Results from 22 years of Followup in the Göteborg Randomized Population-Based Prostate Cancer Screening Trial. J. Urol. 2022, 208, 292–300. [Google Scholar] [CrossRef] [PubMed]
- Roobol, M.J.; de Vos, I.I.; Månsson, M.; Godtman, R.A.; Talala, K.M.; den Hond, E.; Nelen, V.; Villers, A.; Poinas, G.; Kwiatkowski, M.; et al. European Study of Prostate Cancer Screening—23-Year Follow-up. N. Engl. J. Med. 2025, 393, 1669–1680. [Google Scholar] [CrossRef] [PubMed]
- Godtman, R.; Holmberg, E.; Lilja, H.; Stranne, J.; Hugosson, J. Opportunistic testing versus organized prostate-specific antigen screening: outcome after 18 years in the Göteborg randomized population-based prostate cancer screening trial. Eur. Urol. 2015, 68, 354–360. [Google Scholar] [CrossRef]
- Van Poppel, H.; Hogenhout, R.; Albers, P.; van den Bergh, R.C.N.; Barentsz, J.O.; Roobol, M.J. Early Detection of Prostate Cancer in 2020 and Beyond: Facts and ecommendations for the European Union and the European Commission. Eur. Urol. 2020, 79, 327–329. [Google Scholar] [PubMed]
- Van Poppel, H.; Roobol, M.J.; Chapple, C.R.; Catto, J.W.F.; N’Dow, J.; Sønksen, J.; Stenzl, A.; Wirth, M. Prostate-specific Antigen Testing as Part of a Risk-Adapted Early Detection Strategy for Prostate Cancer: European Association of Urology Position and Recommendations for 2021. Eur. Urol. 2021, 80, 703–711. [Google Scholar] [CrossRef] [PubMed]
- Cornford, P.; Tilki, D.; van den Bergh, R.C.N.; Eberli, D.; De Meerleer, G.; De Santis, M.; Gillessen, S.; Henry, A.M.; van Leenders, G.J.L.H.; Oldenburg, J.; et al. EAU-EANM-ESTRO-ESUP-ISUP-SIOG Guidelines on Prostate Cancer. 2026. Available online: http://uroweborg/guidelines/ (accessed on 9 June 2026).
- Van Poppel, H.; Hogenhout, R.; Albers, P.; van den Bergh, R.C.N.; Barentsz, J.O.; Roobol, M.J. A European Model for an Organised Risk-stratified Early Detection Programme for Prostate Cancer. Eur. Urol. Oncol. 2021, 4, 731–739. [Google Scholar] [CrossRef] [PubMed]
- Alterbeck, M.; Järbur, E.; Thimansson, E.; Wallström, J.; Bengtsson, J.; Björk-Eriksson, T.; Bjartell, A.; Bratt, O.; Jiborn, T.; Arnsrud Godtman, R. Designing and Implementing a Population-based Organised Prostate Cancer Testing Programme. Eur. Urol. Focus. 2022, 8, 1568–1574. [Google Scholar] [CrossRef] [PubMed]
- Remmers, S.; Kasivisvanathan, V.; Verbeek, J.F.M.; Moore, C.M.; Roobol, M.J.; ERSPC, R.S.G.P.R.E.C.I.S.I.O.N.I.G. Reducing Biopsies and Magnetic Resonance Imaging Scans During the Diagnostic Pathway of Prostate Cancer: Applying the Rotterdam Prostate Cancer Risk Calculator to the PRECISION Trial Data. Eur. Urol. Open Sci. 2022, 36, 1–8. [Google Scholar] [CrossRef] [PubMed]
- Davik, P.; Remmers, S.; Elschot, M.; Roobol, M.J.; Bathen, T.F.; Bertilsson, H. Reducing prostate biopsies and magnetic resonance imaging with prostate cancer risk stratification. BJUI Compass. 2022, 3, 344–353. [Google Scholar] [CrossRef] [PubMed]
- Morote, J.; Borque-Fernando, Á.; Triquell, M.; Abascal, J.M.; Servian, P.; Planas, J.; Mendez, O.; Esteban, L.M.; Tilla, E. A risk-organised model for clinically significant prostate cancer early detection. BJUI Compass. 2023, 4, 420–422. [Google Scholar] [CrossRef] [PubMed]
- Morote, J.; Borque-Fernando, Á.; Esteban, L.E.; Picola, N.; Muñoz-Rodriguez, J.; Paesano, N.; Ruiz-Plazas, X.; Muñoz-Rivero, M.V.; Celma, A.; García-de Manuel, G.; et al. Reducing the demand for magnetic resonance imaging scans and prostate biopsies during the early detection of clinically significant prostate cancer: Applying the Barcelona risk-stratified pathway in Catalonia. Urol. Oncol. 2024, 42, 115.e1–115.e7. [Google Scholar] [CrossRef] [PubMed]
- Hao, S.; Heintz, E.; Östensson, E.; Discacciati, A.; Jäderling, F.; Grönberg, H.; Eklund, M.; Nordström, T.; Clements, M.S. Cost-Effectiveness of the Stockholm3 Test and Magnetic Resonance Imaging in Prostate Cancer Screening: A Microsimulation Study. Eur. Urol. 2022, 82, 12–19. [Google Scholar] [CrossRef] [PubMed]
- Morote, J.; Borque-Fernando, Á.; Esteban, L.M.; Celma, A.; Campistol, M.; Miró, B.; Méndez, O.; Trilla, E. Investigating Efficient Risk-Stratified Pathways for the Early Detection of Clinically Significant Prostate Cancer. J. Pers. Med. 2024, 14, 130. [Google Scholar] [CrossRef] [PubMed]
- Triquell, M.; Campistol, M.; Celma, A.; Regis, L.; Cuadras, M.; Planas, J.; Trilla, E.; Morote, J. Magnetic Resonance Imaging-Based Predictive Models for Clinically Significant Prostate Cancer: A Systematic Review. Cancers 2022, 14, 4747. [Google Scholar] [CrossRef] [PubMed]
- Denijs, F.B.; van Harten, M.J.; Meenderink, J.J.L.; Leenen, R.C.A.; Remmers, S.; Venderbos, L.D.F.; van den Bergh, R.C.N.; Beyer, K.; Roobol, M.J. Risk calculators for the detection of prostate cancer: a systematic review. Prostate Cancer Prostatic Dis. 2024, 27, 544–557. [Google Scholar] [CrossRef] [PubMed]
- Courtney O’Toole, C.; Boakye, N.F.; Hannigan, A.; Jalali, A. Clinical impact of MRI-based risk calculators for prostate cancer diagnosis: a systematic review and meta-analysis. Prostate Cancer Prostatic Dis. 2026, 29, 247–257. [Google Scholar] [PubMed]
- Ramspek, C.L.; Jager, K.J.; Dekker, F.W.; Zoccali, C.; van Diepen, M. External validation of prognostic models: what, why, how, when and where. Clin. Kidney J. 2020, 14, 49–58. [Google Scholar] [CrossRef] [PubMed]
- Diniz, M.A. Statistical methods for validation of predictive models. J. Nucl. Cardiol. 2022, 29, 3248–3255. [Google Scholar] [CrossRef] [PubMed]
- Alberts, A.R.; Roobol, M.J.; Verbeek, J.F.M.; Schoots, I.G.; Chiu, P.K.; Osses, D.F.; Tijsterman, J.D.; Beerlage, H.P.; Mannaerts, C.K.; Schimmöller, L.; et al. Prediction of High-grade Prostate Cancer Following Multiparametric Magnetic Resonance Imaging: Improving the Rotterdam European Randomized Study of Screening for Prostate Cancer Risk Calculators. Eur. Urol. 2019, 75, 310–318. [Google Scholar] [CrossRef] [PubMed]
- Püllen, L.; Radtke, J.P.; Wiesenfarth, M.; Roobol, M.J.; Verbeek, J.F.M.; Wetter, A.; Guberina, N.; Pandey, A.; Hüttenbrink, C.; Tschirdewahn, S.; Pahernik, S.; Hadaschik, B.A.; Distler, F.A. External validation of novel magnetic resonance imaging-based models for prostate cancer prediction. BJU Int. 2020, 125, 407–416. [Google Scholar] [PubMed]
- Chen, R.; Verbeek, J.F.M.; Yang, Y.; Song, Z.; Sun, Y.; Roobol, M.J. Comparing the prediction of prostate biopsy outcome using the Chinese Prostate Cancer Consortium (CPCC) Risk Calculator and the Asian adapted Rotterdam European Randomized Study of Screening for Prostate Cancer (ERSPC) Risk Calculator in Chinese and European men. World J. Urol. 2021, 39, 73–80. [Google Scholar] [CrossRef] [PubMed]
- Petersmann, A.L.; Remmers, S.; Klein, T.; Manava, P.; Huettenbrink, C.; Pahernik, S.A.; Distler, F.A. External validation of two MRI-based risk calculators in prostate cancer diagnosis. World J. Urol. 2021, 39, 4109–4116. [Google Scholar] [CrossRef] [PubMed]
- De Nunzio, C.; Lombardo, R.; Baldassarri, V.; Cindolo, L.; Bertolo, R.; Minervini, A.; Sessa, F.; Muto, G.; Bove, P.; Vittori, M.; et al. Rotterdam mobile phone app including MRI data for the prediction of prostate cancer: A multicenter external validation. Eur. J. Surg. Oncol. 2021, 47, 2640–2645. [Google Scholar] [CrossRef] [PubMed]
- Chandra Engel, J.; Palsdottir, T.; Ankerst, D.; Remmers, S.; Mortezavi, A.; Chellappa, V.; Egevad, L.; Grönberg, H.; Eklund, M.; Nordström, T. External Validation of the Prostate Biopsy Collaborative Group Risk Calculator and the Rotterdam Prostate Cancer Risk Calculator in a Swedish Population-based Screening Cohort. Eur. Urol. Open Sci. 2022, 41, 1–7. [Google Scholar] [CrossRef] [PubMed]
- Davik, P.; Remmers, S.; Elschot, M.; Roobol, M.J.; Bathen, T.F.; Bertilsson, H. Performance of magnetic resonance imaging-based prostate cancer risk calculators and decision strategies in two large European medical centres. BJU Int. 2024, 133, 278–288. [Google Scholar] [PubMed]
- Morote, J.; Borque-Fernando, Á.; Triquell, M.; Campistol, M.; Servian, P.; Abascal, J.M.; Planas, J.; Méndez, O.; Esteban, L.M.; Trilla, E. Comparison of Rotterdam and Barcelona Magnetic Resonance Imaging Risk Calculators for Predicting Clinically Significant Prostate Cancer. Eur. Urol. Open Sci. 2023, 53, 46–54. [Google Scholar] [CrossRef] [PubMed]
- Patel, H.D.; Remmers, S.; Ellis, J.L.; Li, E.V.; Roobol, M.J.; Fang, A.M.; Davik, P.; Rais-Bahrami, S.; Murphy, A.B.; Ross, A.E.; et al. Comparison of Magnetic Resonance Imaging-Based Risk Calculators to Predict Prostate Cancer Risk. JAMA Netw. Open. 2024, 7, e241516. [Google Scholar] [CrossRef] [PubMed]
- Morote, J.; Borque-Fernando, Á.; Triquell, M.; Campistol, M.; Celma, A.; Regis, L.; Abascal, J.M.; Servian, P.; Planas, J.; Mendez, O.; et al. A Clinically Significant Prostate Cancer Predictive Model Using Digital Rectal Examination Prostate Volume Category to Stratify Initial Prostate Cancer Suspicion and Reduce Magnetic Resonance Imaging Demand. Cancers . 2022, 14, 5100. [Google Scholar] [CrossRef] [PubMed]
- Morote, J.; Borque-Fernando, A.; Triquell, M.; Celma, A.; Regis, L.; Escobar, M.; Mast, R.; de Torres, I.M.; Semidey, M.E.; Abascal, J.M.; et al. The Barcelona Predictive Model of Clinically Significant Prostate Cancer. Cancers . 2022, 14, 1589. [Google Scholar] [CrossRef] [PubMed]
- Morote, J.; Borque-Fernando, Á.; Esteban, L.M.; Picola, N.; Muñoz-Rodriguez, J.; Paesano, N.; Ruiz-Plazas, X.; Muñoz-Rivero, M.V.; Celma, A.; Manuel, G.G.; et al. External validation of the Barcelona magnetic resonance imaging predictive model for detecting significant prostate cancer including men receiving 5-alpha reductase inhibitors. World J. Urol. 2024, 42, 393. [Google Scholar] [CrossRef] [PubMed]
- Morote, J.; Paesano, N.; Picola, N.; Muñoz-Rodriguez, J.; Ruiz-Plazas, X.; Muñoz-Rivero, M.V.; Celma, A.; García-de Manuel, G.; Miró, B.; Servian, P.; et al. Validation of the Barcelona-MRI predictive model when PI-RADS v2.1 is used with transperineal prostate biopsies. Int. Braz. J. Urol. 2024, 50, 595–604. [Google Scholar] [CrossRef] [PubMed]
- Paesano, N.; Catalá, V.; Tcholakian, L.; Alomar, X.; Barranco, M.Á.; Hernández-Mancera, J.; Miró, B.; Trilla, E.; Morote, J. Validation of the Barcelona Magnetic Resonance Imaging Predictive Model for Significant Prostate Cancer Detection in Men Undergoing Mapping per 0.5 Mm-Core Targeted Biopsies of Suspicious Lesions and Perilesional Areas. Cancers . 2025, 17, 473. [Google Scholar] [CrossRef] [PubMed]
- Morote, J.; Miró, B.; Regis, L.; Cousin, F.; Duflot, P.; Kolh, P.; Andalò, A.; Gentili, N.; Merloni, F.; Iamurri, A.P.; et al. European validation of the Barcelona magnetic resonance predictive model for significant prostate cancer detection in prostate biopsies. BJUI Compass. 2026, 7, e70198. [Google Scholar] [CrossRef] [PubMed]
- Paesano, N.; Camean, J.; Ringa, M.; López-Silva, M.; Koren, G.; Olmedo, T.E.; Gurovich, J.I.; Bravo-Castro, E.I.; Catalá, V.; Contreras, P.; et al. External Validation and Clinical Impact of the Barcelona Predictive Models for Detecting Significant Prostate Cancer in Prostate Biopsies in an Ibero-American Population. Cancers . 2026, 18, 1810. [Google Scholar] [CrossRef] [PubMed]
- Barentsz, J.O.; Richenberg, J.; Clements, R.; Choyke, P.; Verma, S.; Villeirs, G.; Rouviere, O.; Logager, V.; Futterer, J.J. ESUR prostate MR guidelines 2012. Eur. Radiol. 2012, 22, 746–757. [Google Scholar] [CrossRef] [PubMed]
- Turkbey, B.; Rosenkrantz, A.B.; Haider, M.A.; Padhani, A.R.; Villeirs, G.; Macura, K.J.; Tempany, C.M.; Choyke, P.L.; Cornud, F.; Margolis, D.J.; et al. Prostate Imaging Reporting and Data System Version 2.1: 2019 Update of Prostate Imaging Reporting and Data System Version 2. Eur. Urol. 2019, 76, 340–351. [Google Scholar] [CrossRef] [PubMed]
- Oerther, B.; Engel, H.; Bamberg, F.; Sigle, A.; Gratzke, C.; Benndorf, M. Cancer detection rates of the PI-RADSv2.1 assessment categories: Systematic review and meta-analysis on lesion level and patient level. Prostate Cancer Prostatic Dis. 2022, 25, 256–263. [Google Scholar] [PubMed]
- Epstein, J.I.; Egevad, L.; Amin, M.B.; Delahunt, B.; Srigley, J.R.; Humphrey, P.A.; Grading, C. The 2014 International Society of Urological Pathology (ISUP) Consensus Conference on Gleason Grading of Prostatic Carcinoma: Definition of Grading Patterns and Proposal for a New Grading System. Am. J. Surg. Pathol. 2016, 40, 244–252. [Google Scholar] [CrossRef] [PubMed]
- Epstein, J.I.; Zelefsky, M.J.; Sjoberg, D.D.; Nelson, J.B.; Egevad, L.; Magi-Galluzzi, C.; Vickers, A.J.; Parwani, A.V.; Reuter, V.E.; Fine, S.W.; et al. A Contemporary Prostate Cancer Grading System: A Validated Alternative to the Gleason Score. Eur. Urol. 2016, 69, 428–435. [Google Scholar] [CrossRef] [PubMed]
- Moore, C.M.; Kasivisvanathan, V.; Eggener, S.; Emberton, M.; Fütterer, J.J.; Gill, I.S.; Grubb, R.L., Iii; Hadaschik, B.; Klotz, L.; Margolis, D.; et al. Standards of reporting for MRI-targeted biopsy studies (START) of the prostate: Recommendations from an International Working Group. Eur. Urol. 2013, 64, 544–552. [Google Scholar] [CrossRef] [PubMed]
- Schoots, I.G. MRI in early prostate cancer detection: how to manage indeterminate or equivocal PI-RADS 3 lesions. Transl. Androl. Urol. 2018, 7, 70–82. [Google Scholar] [CrossRef] [PubMed]
- Osses, D.F.; Arsov, C.; Schimmöller, L.; Schoots, I.G.; van Leenders, G.J.L.H.; Esposito, I.; Remmers, S.; Albers, P.; Roobol, M.J. Equivocal PI-RADS Three Lesions on Prostate Magnetic Resonance Imaging: Risk Stratification Strategies to Avoid MRI-Targeted Biopsies. J. Pers. Med. 2020, 10, 10. [Google Scholar] [CrossRef]
- Hermie, I.; Van Besien, J.; De Visschere, P.; Lumen, N.; Decaestecker, K. Which clinical and radiological characteristics can predict clinically significant prostate cancer in PI-RADS 3 lesions? A retrospective study in a high-volume academic center. Eur. J. Radiol. 2019, 114, 92–98. [Google Scholar] [CrossRef] [PubMed]
- Di Trapani, E.; Musi, G.; Ferro, M.; Cordima, G.; Mistretta, F.A.; Luzzago, S.; Bianchi, R.; Cozzi, G.; Alessi, S.; Catellani, M.; et al. Clinical evaluation and disease management of PI-RADS 3 lesions. Analysis from a single tertiary high-volume center. Scand. J. Urol. 2020, 54, 382–386. [Google Scholar] [CrossRef] [PubMed]
- Kan, Y.; Zhang, Q.; Hao, J.; Wang, W.; Zhuang, J.; Gao, J.; Huang, H.; Liang, J.; Marra, G.; Calleris, G.; et al. Clinico-radiological characteristic-based machine learning in reducing unnecessary prostate biopsies of PI-RADS 3 lesions with dual validation. Eur. Radiol. 2020, 30, 6274–6284. [Google Scholar] [CrossRef] [PubMed]
- Yang, S.; Zhao, W.; Tan, S.; Zhang, Y.; Wei, C.; Chen, T.; Shen, J. Combining clinical and MRI data to manage PI-RADS 3 lesions and reduce excessive biopsy. Transl. Androl. Urol. 2020, 9, 1252–1261. [Google Scholar] [CrossRef] [PubMed]
- Maggi, M.; Panebianco, V.; Mosca, A.; Salciccia, S.; Gentilucci, A.; Di Pierro, G.; Busetto, G.M.; Barchetti, G.; Campa, R.; Sperduti, I.; et al. Prostate Imaging Reporting and Data System 3 Category Cases at Multiparametric Magnetic Resonance for Prostate Cancer: A Systematic Review and Meta-analysis. Eur. Urol. Focus. 2020, 6, 463–478. [Google Scholar] [CrossRef] [PubMed]
- Sonmez, G.; Tombul, S.T.; Demirtas, T.; Demirtas, A. Clinical factors for predicting malignancy in patients with PSA <10 ng/mL and PI-RADS 3 lesions. Asia Pac. J. Clin. Oncol. 2021, 17, e94–e99. [Google Scholar] [PubMed]
- Brancato, V.; Aiello, M.; Basso, L.; Monti, S.; Palumbo, L.; Di Costanzo, G.; Salvatore, M.; Ragozzino, A.; Cavaliere, C. Evaluation of a multiparametric MRI radiomic-based approach for stratification of equivocal PI-RADS 3 and upgraded PI-RADS 4 prostatic lesions. Sci. Rep. 2021, 11, 643. [Google Scholar] [CrossRef] [PubMed]
- Görtz, M.; Radtke, J.P.; Hatiboglu, G.; Schütz, V.; Tosev, G.; Güttlein, M.; Leichsenring, J.; Stenzinger, A.; Bonekamp, D.; Schlemmer, H.P.; et al. The Value of Prostate-specific Antigen Density for Prostate Imaging-Reporting and Data System 3 Lesions on Multiparametric Magnetic Resonance Imaging: A Strategy to Avoid Unnecessary Prostate Biopsies. Eur. Urol. Focus. 2021, 7, 325–331. [Google Scholar] [CrossRef] [PubMed]
- Fang, A.M.; Shumaker, L.A.; Martin, K.D.; Jackson, J.C.; Fan, R.E.; Khajir, G.; Patel, H.D.; Soodana-Prakash, N.; Vourganti, S.; Filson, C.P.; Sonn, G.A.; et al. Multi-institutional analysis of clinical and imaging risk factors for detecting clinically significant prostate cancer in men with PI-RADS 3 lesions. Cancer 2022, 128, 3287–3296. [Google Scholar] [CrossRef] [PubMed]
- Deniffel, D.; Perlis, N.; Ghai, S.; Salinas-Miranda, E.; Namdar, K.; Klotz, L.H.; Zlotta, A.; Finelli, A.; Haider, M.A. Optimizing biopsy decisions in PI-RADS 3 lesions: cross-institutional validation of a local clinical risk model. World J. Urol. 2025, 43, 253. [Google Scholar] [CrossRef] [PubMed]
- Van Poppel, H.; Albreht, T.; Basu, P.; Hogenhout, R.; Collen, S.; Roobol, M. Serum PSA-based early detection of prostate cancer in Europe and globally: past, present and future. Nat. Rev. Urol. 2022, 19, 562–572. [Google Scholar] [CrossRef] [PubMed]
- Ramspek, C.L.; Jager, K.J.; Dekker, F.W.; Zoccali, C.; van Diepen, M. External validation of prognostic models: What, why, how,when and where. Clin. Kidney J. 2021, 14, 49–58. [Google Scholar] [PubMed]
- Strobl, A.N.; Vickers, A.J.; Van Calster, B.; Steyerberg, E.; Leach, R.J.; Thompson, I.M.; Ankerst, D.P. Improving patient Prostate cancer risk assessment: Moving from static, globally-applied to dynamic, practice-specific risk calculators. J. Biomed. Inform. 2015, 56, 87–93. [Google Scholar] [CrossRef] [PubMed]
- Checcucci, E.; Rosati, S.; De Cillis, S.; Giordano, N.; Volpi, G.; Granato, S.; Zamengo, D.; Verri, P.; Amparore, D.; De Luca, S.; et al. Machine-Learning-Based Tool to Predict Target Prostate Biopsy Outcomes: An Internal Validation Study. J. Clin. Med. 2023, 12, 4358. [Google Scholar] [CrossRef] [PubMed]
- Nandi, A.; Xhafa, F. A federated learning method for real-time emotion state classification from multi-modal streaming. Methods 2022, 204, 340–347. [Google Scholar] [CrossRef] [PubMed]
- Linardos, A.; Kushibar, K.; Walsh, S.; Gkontra, P.; Lekadir, K. Federated learning for multi-center imaging diagnostics: a simulation study in cardiovascular disease. Sci. Rep. 2022, 12, 3551. [Google Scholar] [CrossRef] [PubMed]
Figure 1.
Flowchart of the study cohort used for the assessment of csPCa risk with the BCN-MRI PM and ERSPC-MRI PM.
Figure 1.
Flowchart of the study cohort used for the assessment of csPCa risk with the BCN-MRI PM and ERSPC-MRI PM.
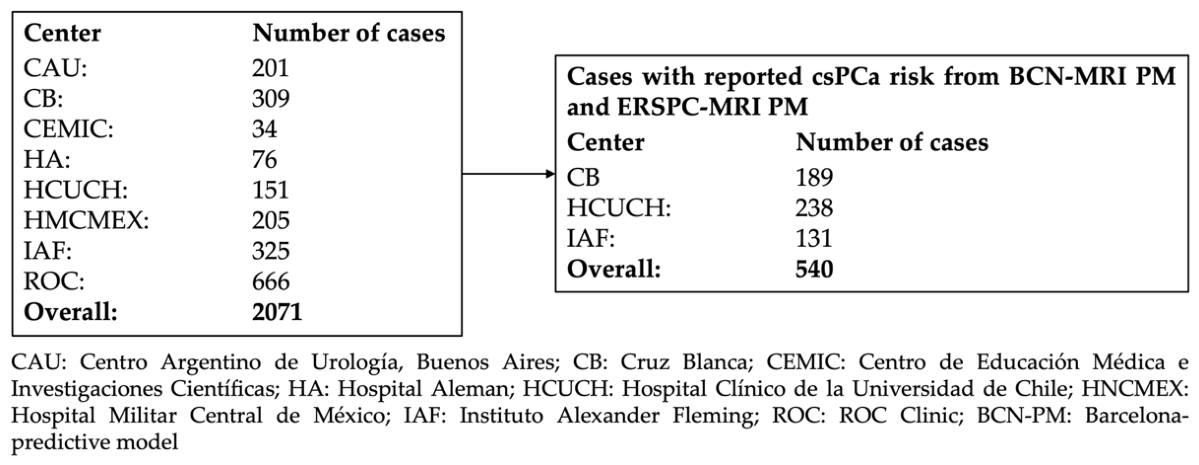
Figure 3.
Correlation between csPCa risks estimates generated by the BCN-MRI PM and ERSPC-MRI PM in men with and without csPCa.
Figure 3.
Correlation between csPCa risks estimates generated by the BCN-MRI PM and ERSPC-MRI PM in men with and without csPCa.
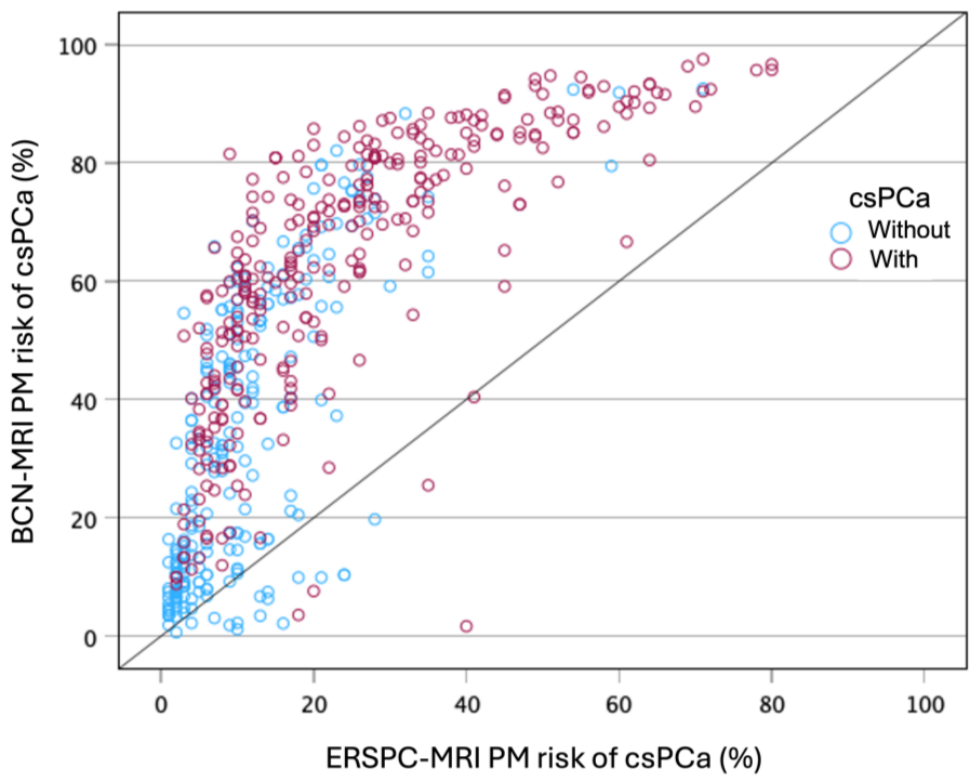
Figure 5.
Receiver Operating Characteristic (ROC) curves showing discrimination of csPCa of BCN-MRI PM and ERSPC-MRI PM.
Figure 5.
Receiver Operating Characteristic (ROC) curves showing discrimination of csPCa of BCN-MRI PM and ERSPC-MRI PM.
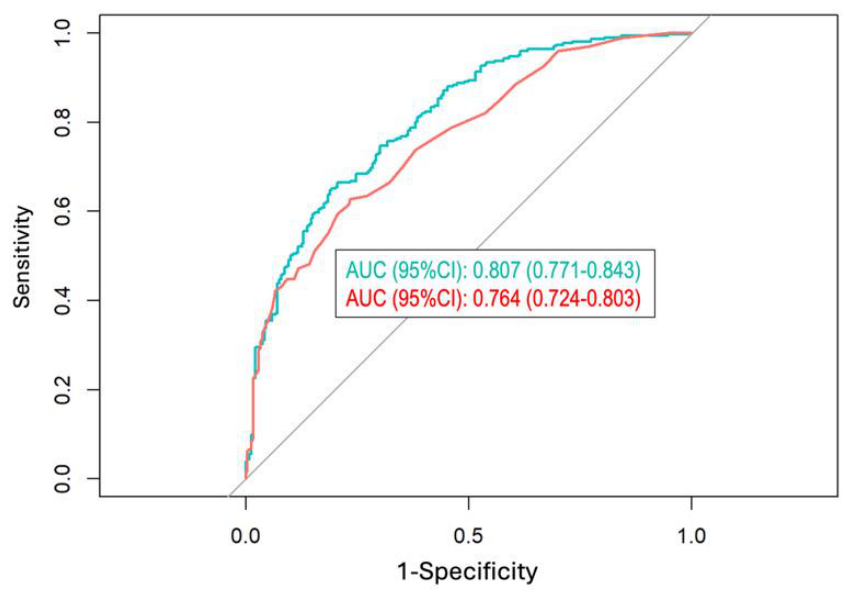
Figure 6.
Decision curve analysis (DCA) comparing the net benefit of the BCN-MRI PM and ERSPC-MRI PM for the detection of clinically csPCa across threshold probabilities, relative to the strategies of biopsying all men or no men.
Figure 6.
Decision curve analysis (DCA) comparing the net benefit of the BCN-MRI PM and ERSPC-MRI PM for the detection of clinically csPCa across threshold probabilities, relative to the strategies of biopsying all men or no men.
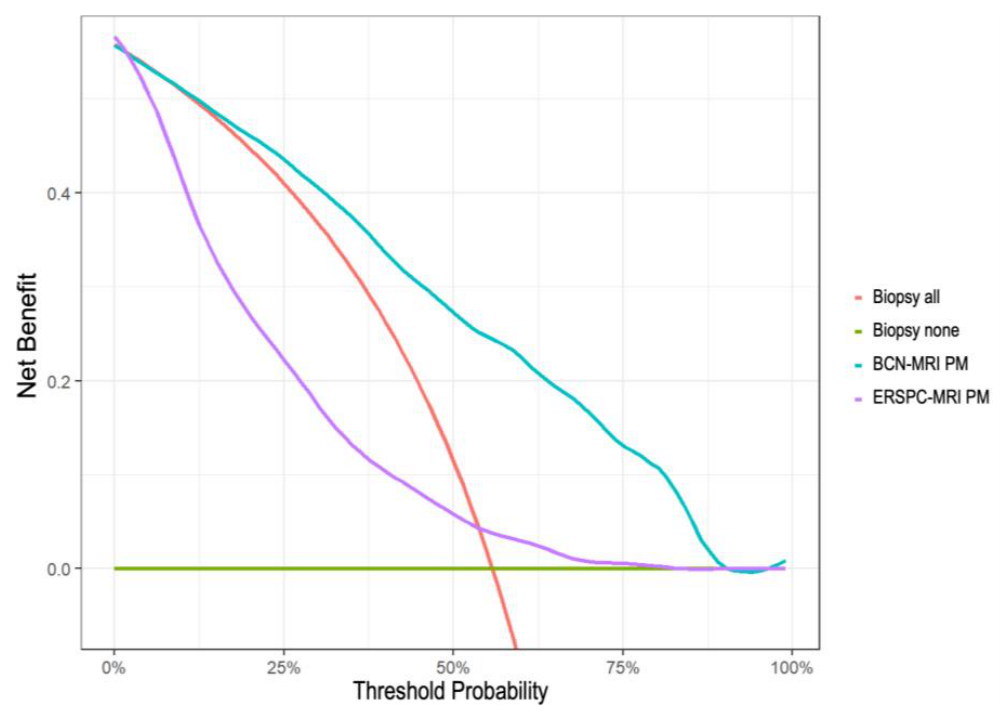
Figure 7.
Clinical utility curves (CUCs) showing the proportions of saved biopsies and missed csPCa cases across the range of threshold probability points.
Figure 7.
Clinical utility curves (CUCs) showing the proportions of saved biopsies and missed csPCa cases across the range of threshold probability points.
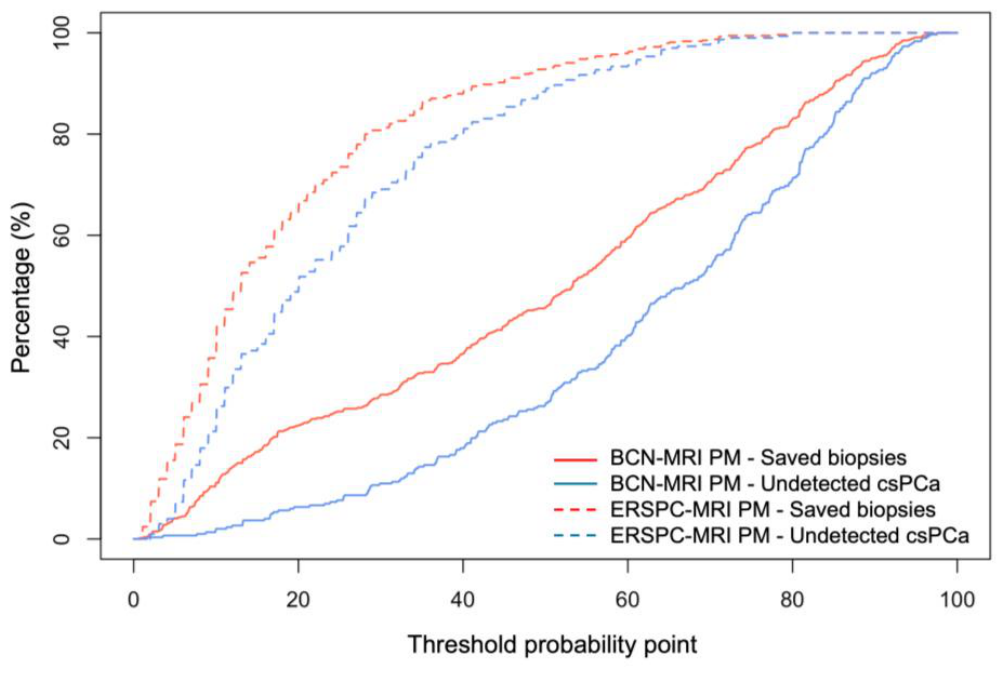
Table 1.
Characteristics of men included in this external validation and comparison of performance of the BCN- and ERSPC-MRI PM.
Table 1.
Characteristics of men included in this external validation and comparison of performance of the BCN- and ERSPC-MRI PM.
| Characteristic | Measurement |
| Number of men, n | 540 |
| Median age, years (IQR) | 66 (61-71) |
| Median serum PSA, ng/mL (IQR) | 7.0 (5.0-9.7) |
| Abnormal DRE, n (%) | 102 (18.9) |
| Prior negative biopsy, n (%) | 103 (19.1) |
| Family history of PCa, n (%) | 59 (10.9) |
| Median prostate volume derived from MRI, mL (IQR) | 50 (36-66) |
| 5-ARI treatment, n (%) | 24 (4.4) |
| MRI at 3 Tesla, n (%) | 299 (55.4) |
| Software MRI-TRUS fusion | 301 (55.7) |
| Transperineal route | 540 (100) |
| PI-RADS v2.1 score | |
| 2, n (%) | 28 (5.2) |
| 3, n (%) | 98 (18.1) |
| 4, n (%) | 277 (51.3) |
| 5, n (%) | 137 (25.4) |
| Detection of csPCa, n (%) | 301 (55.7) |
| n = number; IQR = interquartile range; PSA = prostate specific antigen; DRE = digital rectal examination; MRI = magnetic resonance imaging PI-RADS = prostate imaging reporting and data system; csPCa = clinically significant PCa. | |
Table 2.
Relationship between PI-RADS category and csPCa detection in prostate biopsies.
| Pathology at prostate biopsy | PI-RADS category | All, n (%) | ||||
| 2 | 3 | 4 | 5 | |||
| csPCa, n (%) | 2 (7.1) | 25 (25.5) | 162 (58.5) | 112 (81.8) | 301 (55.7) | |
| All, n (%) | 28 (5.2) | 98 (18.1) | 277 (51.3) | 137 (25.4) | 540 (100) | |
| PI-RADS = prostate imaging-reporting and data system; PCa = prostate cancer; csPCa = clinically significant PCa. | ||||||
Table 3.
Analysis of heterogeneity among the characteristics of participating centers.
| Baseline characteristic | Center | pValue | ||
| CB | IAF | HCUCH | ||
| Number of men, n | 189 | 238 | 113 | - |
| Median age, years (IQR) | 66 (61-73) | 66 (60-71) | 66 (61-70) | 0.431 |
| Median serum PSA, ng/mL (IQR) | 6.8 (4.1-9.5) | 7.6 (4.3-10.0) | 6.4 (4.9-8.5) | 0.003 |
| Abnormal DRE, n (%) | 35(18.5) | 48 (20.2) | 19 (18.6) | 0,745 |
| Prior negative biopsy, n (%) | 52 (27.5) | 44 (18.5) | 7 (6.2) | < 0.001 |
| Family history of PCa, n (%) | 28 (14.8) | 22 (9.2) | 8 (8.0) | 0.098 |
| Median prostate volume derived from MRI, mL (IQR) | 46 (25-63) | 52 (30-70) | 50 (28-64 | 0.130 |
| 5-ARI treatment, n (%) | 0 (0.0) | 11 (4.6) | 13 (11.5) | < 0.001 |
| PI-RADS score | < 0.001 | |||
| 2, n (%) | 23 (12.2) | 1 (0.4) | 4 (3.5) | |
| 3, n (%) | 40 (21.2) | 38 (16.0) | 20 (17.7) | |
| 4, n (%) | 77 (40.7) | 136 (57.1) | 64 (56.6) | |
| 5, n (%) | 49 (25.9) | 63 (26.5) | 25 (22.1 | |
| Overall detection of sPCa, n (%) | 121 (64.0) | 133 (55.9) | 47 (41.6) | < 0.001 |
| CB = Clínica Cruz Blanca; IAF = Instituto Alexander Fleming; HCUCH = Hospital Clínico de la Universidad de Chile; n = number; IQR = interquartile range; PSA = prostate specific antigen; DRE = digital rectal examination; MRI = magnetic resonance imaging PI-RADS = prostate imaging reporting and data system; csPCa = clinically significant PCa. | ||||
Table 4.
Comparison of the specificities of the BCN-MRI PM and ERSPC-MRI PM at sensitivity levels of 100%, 95%, and 90% for the detection of csPCa.
Table 4.
Comparison of the specificities of the BCN-MRI PM and ERSPC-MRI PM at sensitivity levels of 100%, 95%, and 90% for the detection of csPCa.
|
Target Sensitivity (%) |
BCN-MRI PM Specificity (95% CI) |
ERSPC-MRI PM Specificity (95% CI) |
pValue |
| 00 | 0.8 (0.0-2.1) | 5.5 (2.8-8.9) | 0.479 |
| 95 | 38.9 (32.5-45.1) | 30.1 (24.6-35.7) | 0.497 |
| 90 | 48.6 (42.3-55.1) | 33.1 (27.7-39.2) | 0.491 |
| CI = confidence interval | |||
Table 6.
Avoided biopsies and missed csPCa cases according to the PI-RADS categories, using specific thresholds corresponding to 100% sensitivity in PI-RADS 5, 97.5% in PI-RADS 4, 60% for PI-RADS 3, and 50% in PI-RADS 2, which resulted in overall 95% sensitivity.
Table 6.
Avoided biopsies and missed csPCa cases according to the PI-RADS categories, using specific thresholds corresponding to 100% sensitivity in PI-RADS 5, 97.5% in PI-RADS 4, 60% for PI-RADS 3, and 50% in PI-RADS 2, which resulted in overall 95% sensitivity.
|
PI-RADS score |
BCN-MRI PM | ERSPC-MRI PM | ||||
| Threshold (%) |
Saved biopsies n (%) |
Missed csPCa n (%) |
Threshold (%) | Saved biopsies n (%) |
Missed csPCa n (%) |
|
| 2 | 21.1 | 27/28 (96.4) | 1/2 (50) | 21 | 25/28 (89.3) | 1/2(50) |
| 3 4 5 |
18.3 | 78/98 (80.0) | 10/25 (40) | 5 | 63/98(64.3) | 10/25(40.0) |
| 4 | 16.4 | 21/277 (7.6) | 4/162 (2.5) | 6 | 12/277 (4.3) | 4/162 (2.5) |
| 5 | 97.5 | 2/137 (1.5) | 0/112(0) | 80 | 0/137(0) | 0/112 (0) |
| All | - | 128/540 (23.7) | 15/301 (5.0) | - | 100/540 (18.5) | 15/301 (5.0) |
| PI-RADS =prostate imaging-reporting and data system | ||||||
Table 7.
Avoided biopsies and missed csPCa cases according to participant center u-sing the corresponding overall 95% sensitivity thresholds for the BCN-MRI PM and ERSPC-MRI PM.
Table 7.
Avoided biopsies and missed csPCa cases according to participant center u-sing the corresponding overall 95% sensitivity thresholds for the BCN-MRI PM and ERSPC-MRI PM.
|
PI-RADS score |
BCN-MRI PM (17% threshold) | ERSPC-MRI PM (5% threshold) | ||
|
Saved biopsies n (%) |
Missed csPCa n (%) |
Saved biopsies n (%) |
Missed csPCa n (%) |
|
| CB | 53/189 (28.0) | 7/121 (5.8) | 27/189 (14.3) | 2/121 (1.7) |
| IAF 4 5 |
41/238 (17.2) | 6/133 (4.5) | 35/238(14.7) | 10/133 (7.5) |
| HCUCH | 22/113 (19.5) | 2/47 (9.1) | 26/113 (23.0) | 3/47 (6.4) |
| All | 116/540 (21.5) | 15/301 (5.0) | 88/540 (16.3) | 15/301 (5.0) |
Disclaimer/Publisher’s Note: The statements, opinions and data contained in all publications are solely those of the individual author(s) and contributor(s) and not of MDPI and/or the editor(s). MDPI and/or the editor(s) disclaim responsibility for any injury to people or property resulting from any ideas, methods, instructions or products referred to in the content. |
© 2026 by the authors. Licensee MDPI, Basel, Switzerland. This article is an open access article distributed under the terms and conditions of the Creative Commons Attribution (CC BY) license (http://creativecommons.org/licenses/by/4.0/).
Copyright: This open access article is published under a Creative Commons CC BY 4.0 license, which permit the free download, distribution, and reuse, provided that the author and preprint are cited in any reuse.