
Submitted:
15 July 2026
Posted:
16 July 2026
You are already at the latest version
Abstract
Wildfire detection and characterization from space critically depend on accurate thermal infrared measurements across a wide dynamic range. OroraTech’s SAFIRE payloads feature mid-wave infrared (MWIR) and long-wave infrared (LWIR) bands optimized for this purpose, yet the volume and power constraints of many CubeSat platforms preclude the use of onboard calibration sources. This reflects a broader limitation of current Earth observation systems: the absence of robust calibration and validation methodologies at high brightness temperatures relevant to active fires. We evaluate the potential of using thermophysical models (TPM) of the Moon as a vicarious calibration reference for calibration transfer between instruments. The Moon reaches surface temperatures of up to 400 K, offering a stable target in the thermal domain that is visible from many different orbits. Previous research has established the use of TPMs for Moon observations in the infrared; however, uncertainties in surface properties remain, particularly in the mid-wave infrared. We investigate these effects using SAFIRE observations of the lunar surface acquired over a wide range of lunar phase angles (from waxing −81.5° to waning +122.2°). We constrain the TPMs using observations from the Sentinel-3 Sea and Land Surface Temperature Radiometer (SLSTR) fire channels and demonstrate their ability to uncover systematic differences between the calibration of SLSTR-A and SLSTR-B at high brightness temperatures. Applying the same methodology to observations of our SAFIRE payloads yields calibration residuals of 3% to 4% in both MWIR and LWIR bands. These results establish lunar vicarious calibration as a viable approach in the thermal domain for high-temperature applications, providing a pathway toward improved fire radiative power retrievals and enhanced global wildfire monitoring.
Keywords:
thermophysical model (TPM)
; lunar vicarious calibration
; radiometric calibration
; thermal infrared (TIR)
; mid-wave infrared (MWIR)
; wildfire monitoring
; fire radiative power (FRP)
; cross-calibration
1. Introduction
Accurate radiometric calibration at high brightness temperatures remains a fundamental challenge for thermal infrared Earth observation, particularly for small satellite platforms that lack onboard calibration sources. This limitation directly impacts applications such as wildfire detection, where signals often exceed the calibrated range of conventional systems. While vicarious calibration using natural targets offers a potential alternative, suitable references in the thermal domain are scarce. The Moon provides a unique opportunity in this context, combining geometric stability, global observability, and surface temperatures reaching up to 400 K.
The Moon has long served as a radiometric reference for spaceborne instruments because of its geometric stability, lack of atmosphere, long-term photometric consistency and well-known physical and thermal properties. In the visible and near-infrared, disk-integrated irradiance models such as the ROLO framework provide phase- and libration-dependent reflectance predictions suitable for calibration transfer [1]. In the mid-wave and long-wave infrared (MWIR/LWIR), however, the dominant signal is thermal emission rather than reflected sunlight. Consequently, radiometric prediction requires physically based thermophysical modeling of the lunar surface rather than purely photometric approaches such as the modeling of reflectance. State-of-the-art lunar thermophysical models (TPMs) solve the one-dimensional heat conduction equation in a regolith column subject to a time-varying surface energy balance. At the surface, absorbed solar irradiance, thermal reradiation, and conductive flux into the subsurface are balanced; at depth, the boundary is typically assumed thermally insulating or fixed at a geothermal gradient. Diviner observations have demonstrated that the upper lunar regolith is not homogeneous: bulk density and thermal conductivity increase significantly within the upper few centimeters, affecting nighttime cooling rates [2]. Global inversion of Diviner nighttime temperatures has further constrained near-surface thermal inertia and depth-dependent conductivity profiles, providing globally consistent thermophysical parameters for forward modeling [3].
A key source of uncertainty in lunar thermal emission modeling is small-scale surface roughness. Roughness modifies both absorbed solar flux (through facet orientation and shadowing) and emitted radiance (through anisothermality and mutual self-heating). Diviner-based studies have shown that lunar thermal infrared measurements are strongly influenced by RMS slope distributions on millimeter to centimeter scales, and that roughness effects can dominate directional brightness temperature variations [4]. Thermophysical treatments of rough surfaces typically employ statistical facet distributions or crater-based self-heating formalisms originally developed for airless bodies (e.g., beaming models; [5]). These approaches are directly relevant for calibration scenarios where emission angle and phase angle differ from nadir daytime geometries. Topographic self-heating is especially critical in high-latitude or cratered terrain. Earlier crater-resolved thermophysical modeling demonstrated that multiple scattering of both sunlight and thermal infrared radiation within topography can substantially alter surface temperature distributions [6]. Such effects become important when modeling disk-integrated irradiance at large phase angles.
In addition to bulk thermophysical properties, spectral emissivity must be treated carefully in MWIR/LWIR simulation. Diviner-derived Christiansen Feature mapping illustrates that emissivity varies systematically with composition and requires correction for temperature-dependent and photometric effects [7]. Laboratory and modeling studies further show that emissivity measured under ambient terrestrial conditions can differ from that under lunar vacuum and strong vertical thermal gradients. Radiative transfer modeling of near-surface gradients in particulate media demonstrates that thermal emission spectra are modified by the top few hundred microns of regolith, requiring physically consistent treatment in forward models [8]. Experimental validation under simulated lunar conditions confirms that emissivity spectra shift measurably when thermal gradients and vacuum are included [9,10].
Beyond disk-resolved thermophysical studies, several works have explicitly addressed disk-integrated lunar thermal emission for calibration applications. Clementine LWIR data provided early global brightness temperature mapping near 8–9 m, establishing baseline thermal behavior for midday conditions [11]. More recently, full-disk thermophysical modeling has been validated directly against spaceborne infrared sounders. Müller et al. benchmarked a physically based TPM against HIRS lunar intrusion measurements in 19 channels spanning 3.75–15 m and a wide phase-angle range, achieving agreement at the 5% level (and better than 10% at < 5 m) when incorporating wavelength-dependent emissivity and realistic roughness assumptions [12]. This study explicitly positions the Moon as a calibration target for infrared instrumentation and demonstrates that asteroid-style TPM frameworks can be adapted successfully to lunar full-disk irradiance prediction. Complementing this disk-integrated validation, Wohlfarth et al. introduced a combined reflectance and thermal radiance model that treats unresolved roughness using rough fractal surfaces and includes self-scattering, self-heating, and disk-resolved bolometric albedo for whole planetary disks [13]. They validated the approach with disk-resolved lunar observations from Gaofen-4 in the 3.5–4.1 m range (where reflected and thermal components overlap) and with Diviner thermal channels at 8.25 m and 25–41 m, reporting nearly exact agreement; they further demonstrated consistency with BepiColombo/MERTIS lunar flyby radiance profiles and discuss implications for emissivity calibration and thermal-excess correction workflows [13].
Together, these works establish a mature thermophysical modeling framework capable of predicting disk-integrated lunar irradiance in the MWIR and LWIR at calibration-relevant accuracy. In this work, we leverage the models of Müller et al. and Wohlfarth et al. to demonstrate radiometric calibration transfer between the SLSTR and SAFIRE instruments. This approach is particularly relevant for sensors lacking onboard calibration sources and for high-temperature regimes where conventional calibration is limited. We show that lunar thermophysical models enable calibration residuals on the order of a few percent, supporting their use for operational thermal infrared missions.
2. Reference Datasets
This work is based on observations from the Sea and Land Surface Temperature Radiometer (SLSTR) onboard Sentinel-3, as well as the proprietary SAFIRE instrument on-board OroraTech’s satellites. Table 1 summarizes the total count of used observations.
2.1. Lunar Observations of SLSTR
The SLSTR is a dual-view conical scanning radiometer aboard the Sentinel-3A (S3A) and Sentinel-3B (S3B) satellites, developed within the Copernicus programme to provide high-accuracy measurements of sea and land surface temperature. The instrument builds upon the heritage of the (A)ATSR series and is specifically designed for climate-quality observations, with a radiometric stability of 0.1 K/decade and onboard calibration targets [14]. SLSTR features nine spectral bands spanning the visible, near-infrared, short-wave infrared, and thermal infrared regions, with spatial resolutions of 500 m (VIS/SWIR) and 1 km (TIR) at nadir and a swath width of approximately 1400 km. A key characteristic of SLSTR is its dual-view geometry, providing near-nadir and backward views to enable improved atmospheric correction and enhanced temperature retrieval accuracy. The instrument employs a rotating scan mirror, allowing near-simultaneous acquisition across all spectral channels with minimal temporal offset. Radiometric calibration is ensured through onboard blackbody references for the thermal channels and solar diffusers for the reflective bands, supporting its role in long-term climate data records and operational products such as sea surface temperature, land surface temperature, fire radiative power, and aerosol properties. The Optical Mission Performance Cluster (Opt-MPC) of ESA has provided us with observations of the lunar surface from both SLSTR instruments. These lunar observations are done only in the, so called, fire bands, due to their higher saturation brightness temperature. Figure 1 shows the spectral response function of the two fire bands F1 and F2.
Figure 2 shows exemplary lunar observations of SLSTR in the F1 and F2 bands. We use Planck’s law to convert the brightness temperature observations to spectral radiance. The retrieved spectral radiance is defined at the effective wavelength of its respective band. The line-scanner detector of SLSTR oversamples the lunar target in the along-track direction, due to its design for nadir operations. The oversampling in along- (ALT) and across-track (ACT) direction are taken into account in Equation (1) when aggregating the spectral radiance L of the lunar disk in each band. We estimate the oversampling in the ALT direction using the in-situ pitch rate and integration time for each of the N pixels. The IFOV of each observed pixel is identical per observation given the design of the detector and can be factored out from the sum. All lunar observations of SLSTR have been acquired at lunar phase angles between and .
We can describe the uncertainty of the disk-integrated irradiance as shown in Equation (2), assuming near exact knowledge of the IFOV in ACT direction given by the geometry of the sensor and the scene. The uncertainty of the IFOV in ALT direction is driven by the uncertainty of the pitch rate, which we obtain as statistical uncertainties (type A) from the ADCS data at observation time. The uncertainty of the pixel-wise radiance is obtained by propagating the pixel-wise uncertainties of the brightness temperatures as given by the observation. The Algorithm and Theoretical Basis Document (ATBD) [16] for the uncertainties of SLSTR reports around 0.2 K uncertainty for brightness temperatures captured by the fire bands close to 400 K. In practice the radiometric uncertainty of the radiance dominates over the geometric uncertainties driven by the pointing stability of the instrument.
2.2. Lunar Observations of SAFIRE
The SAFIRE instrument is the current generation of TIR imagers developed by OroraTech. Its design was centered around the task of wildfire detection, which put emphasis on long-wave and especially mid-wave thermal infrared bands. Additionally, the imagers were designed to maximise coverage and thus allow for a high revisit rate with fewer spacecraft. The current generation of imagers features three spectral bands at a 200 m GSD with around 420 km swath when looking nadir. The imagers are deployed on a fleet of cubesats in LEO at approximately 550 km height. Our calibration efforts focus on the mid-wave (M0) and second of the long-wave bands (L2) hence their applications in wildfire and land surface temperature products. The spectral response function of each of the used instruments are shown in Figure 3. The MWIR bands show a small leakage in the LWIR region, due to design tradeoffs that we made during the selection of the filter material. The leakage will be removed in future instrument iterations by improved filter design. Unlike SLSTR, we can only observe the lunar surface in one specific spectral band at a given time.
The incident radiance of the lunar surface is converted to an analogue voltage signal by the uncooled microbolometers on the instrument’s focal plane array. The microbolometer pixels respond linearly to incident radiance within their operating range and have a fixed noise floor that is mostly independent of the incoming signal [17]. This is because noise in uncooled microbolometer systems is governed by electrical and thermal fluctuations of the sensor, and not bound to the counting statistics of the individual photons. The raw measurement is corrected for electrical drifts of the readout amplifiers , the self-emission of the uncooled instrument , as well as relative changes in the gains of the individual microbolometer pixels . The absolute radiometric gain converting DN to radiance is then derived during the calibration described by this work. A simplified radiometric model of the SAFIRE imager is described in Equation (3). The thermal self emission is inferred using the temperatures T given by sensors on the telescope structure, as well as temporal dynamics t acquired by taking shutter frames during the observation. Measurements of extended targets when pointing at Earth’s surface further require correction of diffuse straylight contributions, which are omitted in this model. We assume these straylight effects to be negligible as the Moon covers only a small fraction of the instrument’s field of view.
Figure 4 shows an exemplary lunar observation of SAFIRE. We derive residual background, after applying the radiometric model, by averaging the deep space background around the lunar target. The average residual background is subtracted from all pixels in the observation before integration. The disk-integrated spectral irradiance E is derived by summing all N pixels in the lunar observation using the known instantaneous field of view (IFOV) of the respective imager and pixel i as shown in Equation (4).
Preliminary analysis indicates a radiometric uncertainty of approximately 1–2% prior to the application of the gain factor . The full propagation of uncertainties through the SAFIRE radiometric model depends on the uncertainty of , which is itself derived within this work. To avoid circular dependence, the uncertainty associated with is not iteratively propagated within the current analysis. The lunar observations of SAFIRE have been acquired at lunar phase angles between and .
3. Modeling
We test and compare two independently developed thermophysical models (TPMs) within this work. Both models simulate the reflection and emission of thermal radiance from the lunar surface in the mid- to long-wave infrared regime. They share a common physical foundation based on radiative energy balance and subsurface heat conduction, but differ in their treatment of surface roughness, spatial resolution, and radiative transfer. Both models account for the illumination and observing geometries at the time of simulation.
- TPM Müller (2021) [12] models the Moon as a single effective thermal emitter using a disk-integrated formulation and a wavelength-dependent emissivity with a common roughness parameter.
3.1. Shared Physics of Modeling the Lunar Surface
At the core of thermophysical planetary models is the fundamental energy balance equation. At any given point, the surface temperature T is governed by the equilibrium between incident radiation, subsurface conduction, and thermal emission
where is the bolometric albedo, the solar constant at 1 AU, the Stefan–Boltzmann constant, the bolometric emissivity, and k the thermal conductivity. This formulation accounts for secondary radiative contributions from adjacent topography via self-scattering and self-heating similarly to [19]. Figure 5 visualizes the interaction of surface geometry and the different contributions of radiative transfer in the TPM. Note that the bolometric albedo for thermally emitted radiation does not necessarily equal . The last term represents conductive heat flux into the subsurface. The temporal evolution of the temperature profile is described by the one-dimensional heat conduction equation:
where is the bulk density and c the specific heat capacity. Together, they define the thermal inertia , which controls the amplitude and phase of the diurnal temperature cycle. In reality, planetary surfaces are rough, i.e., they exhibit topographic structure down to scales of millimeters and below. These small-scale structures cannot be resolved by infrared detectors. Consequently, the measured radiance at the detector is the superposition of the thermal radiance of multiple facets with individual temperatures and viewing geometries. The thermally emitted spectral radiance thus becomes:
where P denotes the Planck function, is the area of a small surface facet, and denotes whether the facet j can be seen by the observer. The total radiance I that emerges from an individual facet is expressed as the sum of reflected solar and thermally emitted components, governed by illumination, viewing geometry, and surface properties.
Here, denotes the incident solar spectral irradiance, the bidirectional reflectance, and the spectral directional emissivity. The variables i, e, and represent the angles of incidence, emission, and azimuth, respectively, and X is the thermally emitted radiance of a perfect emitter with unresolved surface roughness at temperature T. All in all, rough surfaces lead to deviations from ideal single-temperature blackbody behavior, particularly at large phase angles and at shorter wavelengths at the Wien side of the Planck function. The relative contributions of reflected and emitted radiation are strongly wavelength dependent. Reflected radiation dominates in the visible and near-infrared (NIR), while thermal emission dominates in the thermal infrared. In the transition region between approximately and m, both components contribute significantly and must be treated jointly [20].
3.2. Distinct Features of TPMs
Despite their shared physical basis, the two TPMs differ in their implementation. The model of Müller et al. (2021) has originally been developed for asteroid thermophysical modeling [21,22,23,24] and has been successfully applied to study a variety of Near-Earth Asteroids, Main-Belt Asteroids, and Trans Neptunian Objects. For studying the Moon, the model parameters can simply be adjusted to lunar conditions. Lunar radiance is computed by integrating an oblate spheroidal shape model with its true spin-pole, and assuming global photometric parameters. Surface roughness is modeled with hemispherical segments and parameterized via the rms-slope, including shadowing and mutual heating effects. The model employs an empirically adjusted, wavelength-dependent hemispherical emissivity to reproduce observed disk-integrated radiances. This approach prioritizes computational efficiency and robustness, making it well suited for calibration applications involving spatially unresolved observations.
The model of Wohlfarth (2023) has been primarily designed for disk-resolved simulations of the lunar surface. It spatially resolves the photometric behavior of the lunar surface and models surface roughness with fractal descriptions of subpixel slopes. Each subpixel surface element is treated individually, accounting for its local illumination and viewing geometry. The model includes shadowing, mutual heating, and self-scattering effects, enabling a physically consistent treatment of anisothermality and directional emission. In addition, it explicitly separates reflected and emitted radiance, which is particularly important in the MWIR (< 5 m) where both contributions are significant.
These differences result in complementary strengths. The Müller model provides accurate and efficient predictions of disk-integrated radiance and is therefore well suited for radiometric calibration and cross-instrument comparison. The Wohlfarth model, on the other hand, captures the physical effects of surface roughness and radiative interaction in greater detail, enabling improved interpretation of phase-angle dependencies and spatially resolved observations. In this work, both models are evaluated in the context of lunar vicarious calibration. Their differing levels of physical complexity allow us to assess the sensitivity of calibration results to model assumptions, particularly with respect to emissivity, roughness, and the treatment of mixed reflected and emitted radiance in the mid-wave infrared.
3.3. Previous Validation of TPMs
The TPM Müller [12] was validated using spaceborne observations of the Moon obtained from infrared sounders, in particular lunar intrusion measurements from the High-resolution Infrared Radiation Sounder (HIRS) instrument series. These observations provide disk-integrated radiances of the Moon across multiple spectral channels in the mid- to long-wave infrared, covering a wavelength range from approximately to m and a wide range of phase angles of . The model was evaluated by comparing simulated disk-integrated radiances with measured brightness temperatures across 19 HIRS channels for multiple observation geometries. Particular emphasis was placed on the ability of the model to reproduce the spectral shape and phase-angle dependence of the observed lunar signal. The model employs a wavelength-dependent hemispherical emissivity, which is adjusted to match measured radiances over the full spectral range. Validation results demonstrate that the TPM is capable of reproducing observed lunar radiances with an accuracy on the order of in most thermal infrared channels, with somewhat larger deviations (up to ) in the shorter wavelength range below m. The model was shown to capture the overall phase-angle dependence and spectral behavior of the lunar emission, supporting its applicability for radiometric absolute calibration of spaceborne infrared instruments using disk-integrated observations.
Further, the TPM Wohlfarth [13,18] was previously validated using independent disk-resolved spaceborne observations of the Moon. Lunar observations from the Gaofen-4 geostationary satellite were used for model fitting and validation in the mid-infrared. The dataset consists of repeated disk-resolved observations acquired in 2018 [25] in a single MWIR channel spanning m (centered at m) at approximately spatial resolution. The measurements span moderate phase angles ( to ) and sample the full range of incidence and emergence angles, from at the sub-solar or sub-spacecraft point to at the illuminated or visible limb, respectively. Measurements from the Diviner Lunar Radiometer [26] were used to validate the model in the thermal infrared. Diviner observes reflected solar radiation and lunar thermal emission across nine spectral channels spanning m, including channels sensitive to the Christiansen feature at daytime temperatures and broadband channels capturing long-wavelength emission. Model performance was assessed using nadir observations and Emission Phase Function (EPF) observations, which sample a wide range of emission and azimuth angles under nearly constant solar incidence, providing strong constraints on surface roughness effects. EPF sequences comprise a four-minute pattern of off-nadir pointings, with emission angles varying in nine steps between and and azimuth angles divided into two groups depending on the subsolar position. These multi-angular measurements are particularly suited to test thermal models under varying combinations of incidence, emission, and azimuth angles [27]. For validation, [13,18] used the same EPF datasets as in [27].
3.4. Evaluation of Models
Both TPMs are evaluated for a given tuple of observer position, datetime and spectral band. The models operate at a fixed wavelength grid spacing of 0.1 m over the interval of 3 m to 15 m. The calculated spectral flux is then normalized to the effective wavelength of the respective band by integration over its SRF to obtain an effective spectral flux as shown in Equation (9).
Figure 6 shows the experiment setup by denoting the relationship between the different data sources. The TPMs are calibrated on independent reference observations. The TPM Müller uses data from HIRS to constrain the spectral emissivity over the whole lunar surface as described in [12]. In contrast, the TPM Wohlfarth employs the SLSTR observations in this study to fine-tune its model parametrization. We discuss the results of this in Section 4.
4. Results
In this section we discuss the results of calibration and validation by applying the reference datasets discussed in Section 2 using the TPMs described in Section 3. The two models are handled in distinct ways. We fine-tune the parametrization of TPM Wohlfarth using the observations of SLSTR and then use it to calibrate the radiometric gain of the SAFIRE instruments (see Equation (3)). In contrast, the TPM Müller is evaluated independently without any change in the parametrization discussed in [12].
4.1. Calibration of TPM Wohlfarth Using SLSTR
The directional–hemispherical albedo, , and surface roughness, , are intrinsic parameters that jointly control thermal behavior across wavelengths in thermophysical models. In practice, however, both are sensitive to model formulation and data quality: estimates of vary across studies [28,29,30,31], and surface roughness also slightly differ in the literature [12,13,18,27,32,33]. We therefore treat and as effective parameters, tuning them to absorb model–data discrepancies. This follows the strategy adopted in the TPM Wohlfarth, where the same parameters are adjusted to reproduce observations from Diviner Lunar Radiometer Experiment, GF-4, and MERTIS [18]. We opt for fine-tuning the model parametrization of TPM Wohlfarth as it has been originally obtained for disk-resolved observations and shows elevated residuals in the few percent order against the disk-intregrated SLSTR observations prior to modification.
Here, disk-integrated irradiances from SLSTR are used to constrain these parameters by minimizing the root-mean-square error (RMSE) between modeled and observed irradiances (Figure 8). Due to the computational cost of the model, we employ a grid search over the parameter space. The resulting best-fit parameters are summarized in Table 2. Figure 7 shows the resulting scaled bolometric albedo with an average magnitude of 0.13. The retrieved roughness values should not be interpreted as revised geophysical estimates of the global lunar surface roughness. Recent analyses based on Diviner observations indicate globally representative RMS slopes of approximately 31°–32° [33]. In the present study, acts as an effective calibration parameter within the TPM Wohlfarth formulation, absorbing residual uncertainties related to emissivity, directional reflectance, unresolved roughness effects, and other model assumptions. The lower MWIR value of therefore reflects the parameterization that best reproduces the reference observations within the adopted modeling framework, rather than evidence for a physically smoother lunar surface at these wavelengths. Residual errors are below 3% in the MWIR band and below 1% in the LWIR band, when controlling for outliers in the F2 band. These outliers are likely due to anomalies in the imaging procedure of SLSTR, as the respective quasi-simultaneous observations in the F1 band are not affected. The retrieved parameters indicate a lower effective roughness in the MWIR () compared to the LWIR (), which is consistent with the model validation results of against GF4 and Diviner [18].
Figure 7.
Exemplary model parametrization of the TPM Wohlfarth after its calibration against SLSTR. Left: The bolometric albedo after application of scaling factor . The initial albedo estimate is derived based of observations of the M3 instrument as described in [18]. Right: Exemplary directional emissivity in the MWIR range of a given sample. The emissivity will be slightly different for each model run as it depends on the viewing geometry [13]. The albedo and emissivities are only computed for pixels visible by the observing instrument.
Figure 7.
Exemplary model parametrization of the TPM Wohlfarth after its calibration against SLSTR. Left: The bolometric albedo after application of scaling factor . The initial albedo estimate is derived based of observations of the M3 instrument as described in [18]. Right: Exemplary directional emissivity in the MWIR range of a given sample. The emissivity will be slightly different for each model run as it depends on the viewing geometry [13]. The albedo and emissivities are only computed for pixels visible by the observing instrument.
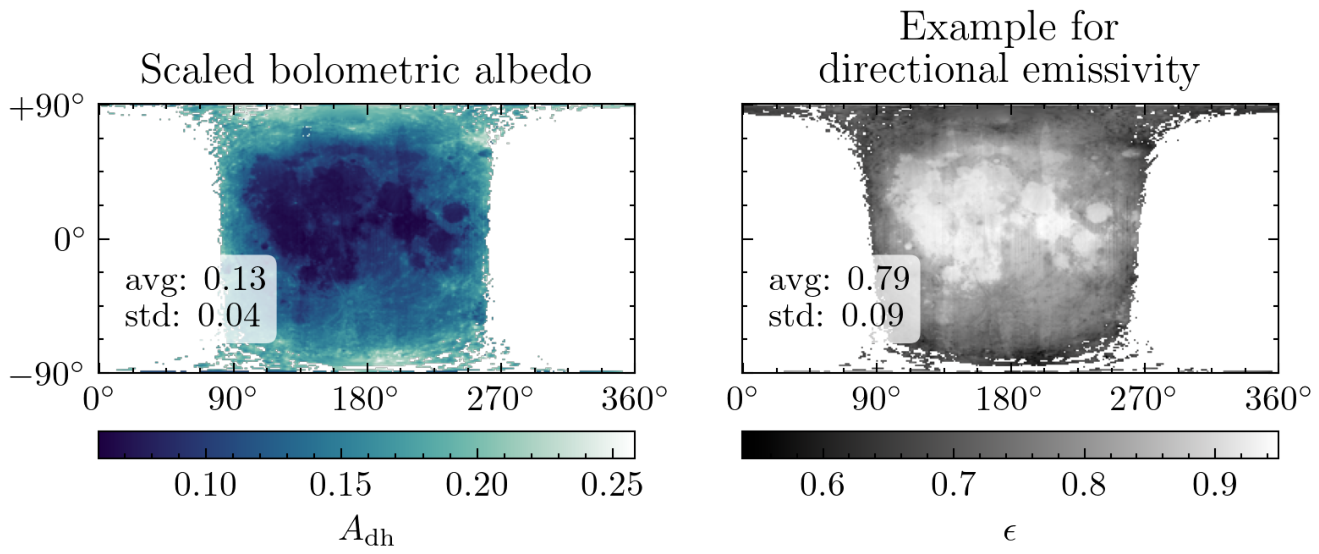
Figure 8.
Calibration residuals of SLSTR observations with the TPM Wohlfarth, 2023. Six outliers in the LWIR range (faint markers) are excluded from the residual analysis, as they are likely caused by operational anomalies during acquisition. The error bars of SLSTR’s disk-integrated flux are well below 1% in both bands and do not account for the systematic differences between S3A and S3B.
Figure 8.
Calibration residuals of SLSTR observations with the TPM Wohlfarth, 2023. Six outliers in the LWIR range (faint markers) are excluded from the residual analysis, as they are likely caused by operational anomalies during acquisition. The error bars of SLSTR’s disk-integrated flux are well below 1% in both bands and do not account for the systematic differences between S3A and S3B.
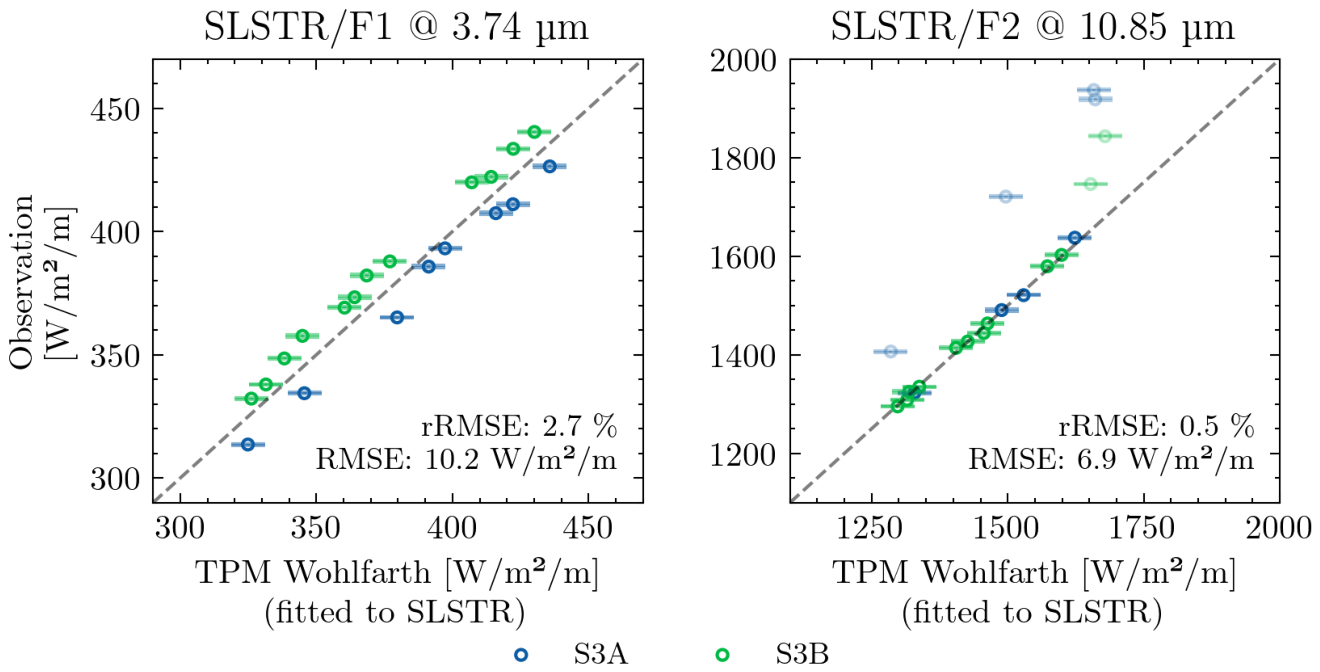
Despite the low residuals, we observe a systematic discrepancy in the calibration of the F1 band between the SLSTR instruments onboard Sentinel-3A (S3A) and Sentinel-3B (S3B). The observed RMSE against the calibrated TPM Wohlfarth of approximately 3% exceeds the reported uncertainty of the on-ground calibration for this band as shown also by the error bars [16,34]. This discrepancy is likely related to increased uncertainty at elevated brightness temperatures, as the instrument calibration is limited to approximately 320 K. Yet, the observed calibration residual of SLSTR/F1 still complies with the original design requirement of the instrument, stating < 3 K for brightness temperatures below 500 K for the fire bands of the instrument [35].
The TPM by Müller [12] follows a different calibration strategy. In that framework, surface roughness () and albedo () are treated as fixed global parameters, and discrepancies between model and observations are primarily compensated through the derivation of a wavelength-dependent spectral emissivity. This approach agrees well with the global surface roughness estimate of 31°-32° for mares and highlands respectively as derived in [33]. While this approach is well suited for spectrally resolved datasets such as HIRS, it is not directly applicable in this study due to the limited spectral sampling of SLSTR, which provides only two thermal bands. Instead, we employ the TPM Müller using its given parametrization as way of validating our results through an independent model. Figure 9 shows the modeling results of both TPMs when compared against the observations from SLSTR. The predictions of TPM Müller show 3.9% RMSE against SLSTR/F1 (MWIR) and 5.6% RMSE against SLSTR/F2 (LWIR). Both models show a similar precision between epochs given their standard deviation of relative flux against SLSTR. The lowered accuracy (elevated rRMSE) in the LWIR band between TPM Müller and SLSTR points towards a disagreement between SLSTR/F2 and HIRS given the models origin of parametrisation. In summary the obtained results mostly agree with previous model validations stating an accuracy < 10% for the MWIR and < 5% for the LWIR region [12].
4.2. Calibration of SAFIRE Using TPM Wohlfarth
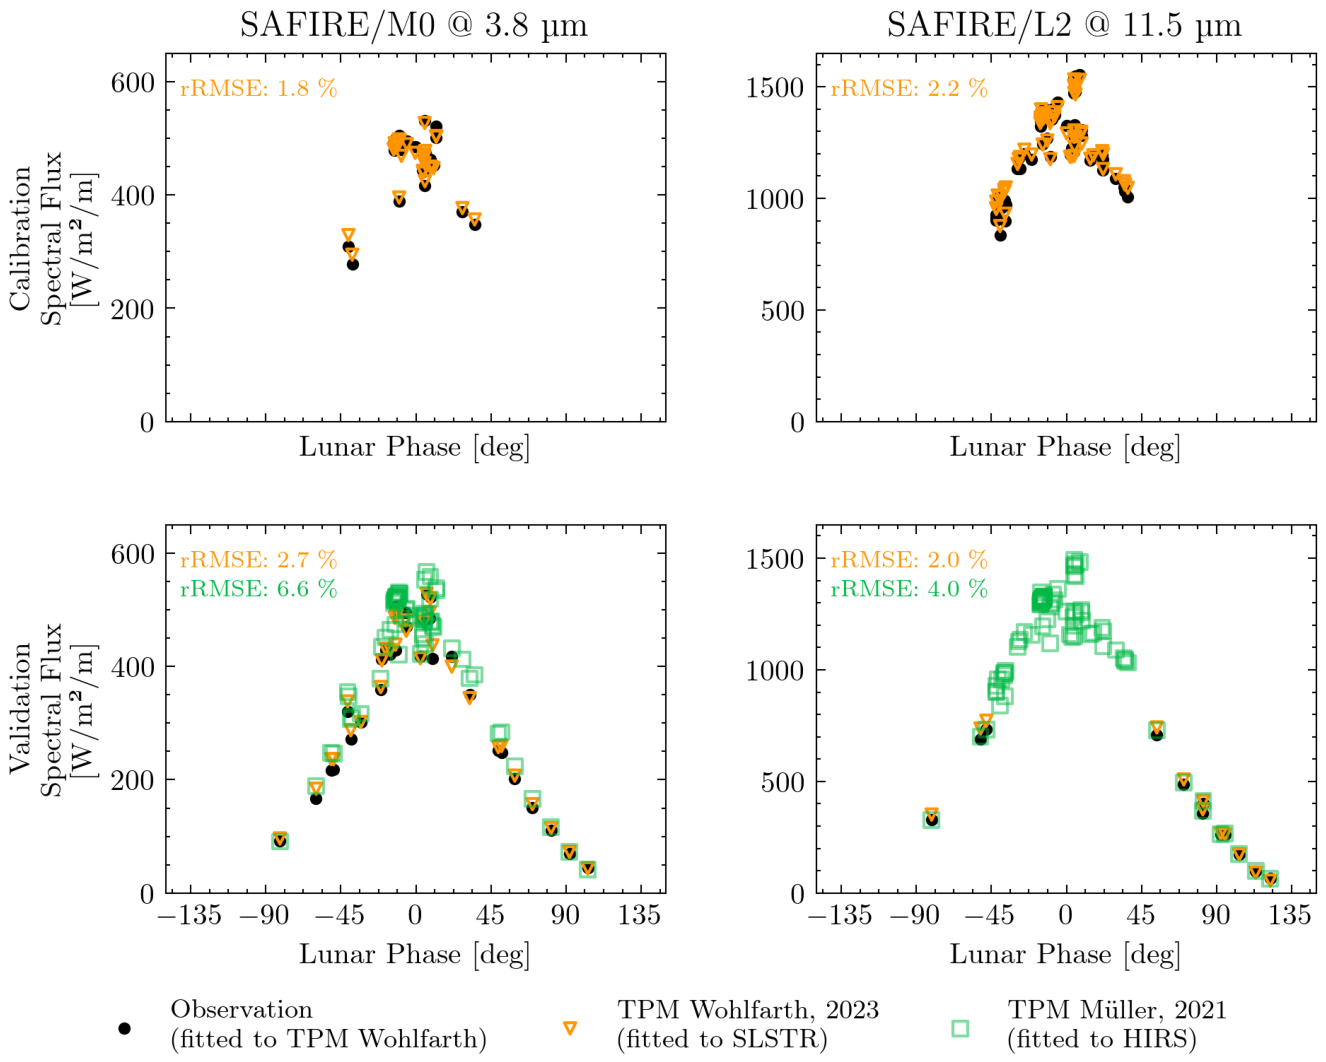
Figure 10 shows the integrated lunar observations of all SAFIRE imagers across a phase angle range of to . For calibration, we selected up to five observations within a phase angle range of ±45° for each imager and band to determine the scalar radiometric gain (see Equation (3)). This number was not chosen as an optimized hyperparameter, but reflects the largest common set of usable lunar observations available for most imager-band combinations in the current dataset. Since the calibration estimates only a single multiplicative gain factor, the problem is not underconstrained even for a small number of observations. Using multiple acquisitions nevertheless reduces sensitivity to individual observation anomalies, pointing uncertainties, and residual background effects, while applying the same selection rule across the fleet avoids introducing sensor-dependent calibration choices. The resulting gain was obtained from the ratio between observed and modeled disk-integrated irradiance over the selected samples. The specific observations used for calibration are listed in Appendix A.
Using this calibration strategy, SAFIRE achieves a residual RMSE of in both bands when calibrating against the TPM Wohlfarth. To estimate the uncertainty associated with the calibration transfer and the resulting scalar gain, we combine the residuals from the SLSTR-based calibration of TPM Wohlfarth with the residuals from the SAFIRE calibration against this model. Treating these residual terms as independent empirical contributions yields a quadrature estimate of for M0 and for L2. This estimate should be interpreted as the uncertainty of the lunar calibration transfer, rather than as a full radiometric uncertainty budget for SAFIRE. The propagated radiometric uncertainty of the SLSTR observations is substantially smaller than the observed model residuals and is therefore not the limiting term; in particular, the F1 residual is dominated by systematic differences between the SLSTR-A and SLSTR-B observations at elevated brightness temperatures.
Validation against the independently parametrized TPM Müller results in larger residuals of approximately in M0 and in L2. These values should not be interpreted as an alternative estimate of the SAFIRE gain uncertainty, but rather as an external consistency check that includes uncertainties of the independent model itself. The larger discrepancy in the MWIR is expected because this spectral range is more sensitive to the treatment of reflected solar radiance, directional emissivity, and surface roughness, and because TPM Müller was not specifically optimized for separating reflected and emitted radiance contributions in this regime. The agreement nevertheless remains within the previously reported validation accuracy of lunar thermal models at wavelengths below 5 m, supporting the consistency of the calibration transfer.
We observe nonlinear deviations between model and observations as a function of lunar phase angle, as shown in the upper row of Figure 11. The model divergence of TPM Wohlfarth at larger phase angles in the L2 band could be caused by inadequate roughness tuning at these geometries. This might be due to the bias of the SLSTR dataset at a fixed lunar phase of around 6°, but would need further investigation to confirm. The origin of the relative falloff outward from phase in both bands remains unexplained but does not impede reasonable accuracy for radiometric calibration.
Similar phase-dependent behavior has been reported in disk-resolved lunar observations [36], which exhibit enhanced beaming at low incidence angles and a pronounced decrease at high incidence. Although disk-integrated observations over a full libration cycle are not directly comparable to disk-resolved varying incidence geometries, both highlight the sensitivity of model performance to the treatment of sub-pixel roughness. At the smallest scales, unresolved grain-scale cavities may enhance near-nadir beaming, further contributing to the residual non-linearity observed at low phase angles.
The bottom row in Figure 11 shows the direct comparison of both TPMs evaluated at the epochs of the SAFIRE dataset. The models exhibit stable agreement within a phase angle range of approximately . Toward larger phase angles, corresponding to lower observed flux levels, both the model-to-observation agreement and the inter-model agreement (Figure 11) degrade nonlinearly. Additionally, a systematic divergence between the models is observed with increasing phase angle, indicating growing sensitivity to differences in model assumptions under more extreme illumination and viewing geometries. The origin of these trends remains to be clarified and will be subject of future work.
Figure 12 shows the mean and standard deviation of the ratio of spectral flux retrieved from both models for the set of SAFIRE observations. The largest divergence between the models is observed in the MWIR region. This is consistent with the increased uncertainty in this spectral interval, arising from less well-characterized surface properties as well as the previously discussed differences between the two models.
5. Discussion
Unlike reflective solar bands, the thermal infrared lacks a widely accepted set of natural calibration references at elevated brightness temperatures. Conventional vicarious calibration approaches typically rely on terrestrial targets such as deserts, oceans, or instrumented ground sites. While these targets are valuable for validating radiometric performance under nominal Earth observation conditions, they rarely reach the brightness temperatures encountered in active wildfire observations and are subject to atmospheric effects, seasonal variability, and uncertainties in surface properties. The Moon provides a complementary reference target that is free from atmospheric interference, exhibits long-term physical stability, and regularly reaches surface temperatures approaching 400 K during the lunar day. In addition, its visibility from a wide range of orbital configurations enables the use of a common radiometric reference across multiple missions and sensor architectures. These characteristics make the lunar surface particularly attractive for calibration activities targeting the high-temperature regime relevant to wildfire detection and fire radiative power retrieval.
5.1. Implications for Lunar Vicarious Calibration
The results indicate that thermophysical models (TPMs) of the lunar surface can support calibration of radiometric gains in the thermal infrared with residuals on the order of to for both MWIR and LWIR bands (Figure 10). This level of agreement is comparable to typical calibration requirements for wildfire monitoring applications and suggests that the Moon can serve as a viable in-flight calibration reference for thermal infrared imagers.
An important implication is that lunar calibration can complement onboard calibration systems. Instruments such as SLSTR employ well-characterized preflight calibration and in-flight blackbody references, yet we observe systematic discrepancies of approximately in the MWIR band (F1) between Sentinel-3A and Sentinel-3B, as well as between SLSTR observations and TPM predictions (Figure 9). This points to increasing uncertainty at elevated brightness temperatures ( K), which are particularly relevant for applications such as wildfire detection.
For instruments without onboard calibration targets, such as SAFIRE, the results suggest that TPM-based calibration transfer can provide radiometric performance within a similar accuracy range (<5 %). This indicates that lunar vicarious calibration may serve not only as a fallback solution, but as a complementary approach in regimes where traditional calibration sources are limited.
A further advantage is the potential for cross-instrument calibration. Because the Moon is observable from a wide range of orbital configurations, it provides a common reference that can support consistency across different missions and sensor designs. This is particularly relevant for constellations such as SAFIRE, where inter-sensor consistency is required for generating uniform data products.
We restrict the application of TPMs to absolute lunar phase angles below given the decreased observation to model towards larger phase angles (see Figure 11). This constrains the time interval for calibration to around 8 days per month.
5.2. Interpretation of Model Differences
The comparison between the TPMs of Wohlfarth and Müller reveals systematic differences in model performance, particularly in the MWIR (see Figure 12). The Wohlfarth model, which accounts for surface roughness, radiative coupling, and the separation of reflected and emitted components, shows closer agreement with SAFIRE observations. This is expected given that the SAFIRE observations are calibrated against this model. The larger MWIR divergence between the models likely reflects differences in the treatment of directional emissivity, roughness-induced thermal beaming, and the separation of reflected and emitted radiance. In contrast, validation of the calibrated observation against the independently parametrized TPM Müller model exhibits slightly elevated residuals, especially in the MWIR band. Still the residuals of both models against both datasets are within the validation performance established by [12] citing < 5% accuracy in the LWIR and < 10% accuracy for shorter wavelengths in the MWIR.
Additionally, we observe increased residuals between TPM Müller and SLSTR in the F2 band (LWIR) as shown in Figure 9. The RMSE of 5.6% exceeds previous modeling results against the long-wave HIRS channels 8 – 12 (6.5 – 12.5 m) that validated to 1 % – 3 % [12]. This could indicate a disagreement in the calibration between SLSTR/F2 and HIRS.
5.3. Phase-Angle Dependence and Unresolved Effects
We observe a clear phase-angle dependence in the model-to-observation agreement (Figure 11). Both TPMs exhibit nonlinear deviations as a function of lunar phase angle, including a relative enhancement near small phase angles and increasing divergence toward larger phase angles when compared against the SAFIRE observations.
The relative enhancement near opposition may be related to a combination of thermal beaming and shadow-hiding effects. Reduced self-shadowing at small phase angles increases the effective emitting area and enhances mutual heating between surface facets. In addition, unresolved subpixel roughness can lead to anisotropic emission that is preferentially directed toward the observer. These effects are only partially captured by simplified roughness parameterizations and may contribute to the observed behavior.
At larger phase angles, the increasing discrepancy between models and observations indicates growing sensitivity to model assumptions under more extreme illumination geometries. We cannot rule out additional effects in SAFIRE instrument related to straylight as these phase-angle dependent trends were not been observed in comparison between TPM Müller and HIRS [12].
5.4. Fundamental Limitations in MWIR Calibration
A central limitation highlighted by this study is the uncertainty in absolute thermal emission of the Moon in the MWIR. Even for well-calibrated reference instruments such as SLSTR, discrepancies between observations and TPM predictions remain at the few-percent level, indicating that the absolute radiometric scale in this spectral range is not yet fully constrained.
This has two implications. First, calibration uncertainties in the MWIR are not solely driven by instrument performance, but also by incomplete knowledge of the reference target itself. Second, it underscores the importance of physically consistent thermophysical modeling, as empirical calibration approaches alone may not capture all relevant effects.
5.5. Operational Considerations and Future Work
From an operational perspective, lunar calibration offers several advantages, including the absence of additional hardware requirements, global observability, and the ability to perform cross-calibration between missions. However, its applicability is currently limited by phase-angle-dependent effects and model uncertainties at extreme geometries.
Future work should focus on improving the physical modeling of the lunar surface, particularly with respect to:
- phase-angle-dependent and thermal beaming effects,
- joint modeling of reflected and emitted radiation in the MWIR,
- improved constraints on spectral emissivity under realistic lunar conditions.
Addressing these challenges will be important for extending lunar calibration to a broader range of observation geometries and improving absolute accuracy in the thermal infrared. The calibration approach presented here addresses the radiometric gain component of the instrument model. Well-calibrated radiometric products in the TIR domain are essential for precise detection and quantification of thermal anomalies on the ground such as wildfires. Additionally derived products include fire radiative power (FRP), land surface temperature (LST) and sea surface temperature (SST). Independent end-to-end validation against Earth observation targets and cross-sensor comparisons is performed as part of ongoing system-level calibration efforts, but is beyond the scope of this work.
6. Conclusions
We show that thermophysical models of the lunar surface can be used for vicarious calibration of thermal infrared imagers, achieving calibration residuals on the order of to in both MWIR and LWIR bands. Using SLSTR observations as a reference, a fleet of SAFIRE instruments is calibrated consistently without reliance on onboard blackbody targets.
The results further indicate that conventional calibration approaches can exhibit limitations at elevated brightness temperatures, as evidenced by systematic discrepancies in the MWIR between SLSTR instruments and between observations and model predictions. In this context, lunar observations provide access to temperature regimes that are not well covered by traditional calibration sources.
At the same time, residual discrepancies between models and observations highlight remaining uncertainties in the absolute thermal emission of the Moon, particularly in the MWIR. These uncertainties currently limit the achievable calibration accuracy and motivate further refinement of thermophysical models.
Overall, lunar vicarious calibration emerges as a practical approach for thermal infrared missions, with particular relevance for small satellite constellations and high-temperature applications such as wildfire monitoring.
Author Contributions
Conceptualization, C.M. and M.S.; methodology, K.W., T.M., M.S. and C.M.; software, C.M. and K.W.; investigation, C.M., J.B., T.M. and D.N.; writing—original draft preparation, C.M.; writing—review and editing, C.M., T.M., J.B., M.S., J.G and K.W.; funding acquisition, J.G. All authors have read and agreed to the published version of the manuscript.
Funding
This research was funded by OroraTech GmbH and ESA under the Copernicus Contributing Missions (CCM) program (4000140883/23/I-EB). The collaboration with VITO Remote Sensing has further been supported in the framework of the PRODEX program of the European Space Agency (4000144717).
Data Availability Statement
The datasets generated and analyzed during this study are publicly available on Zenodo at: https://zenodo.org/records/21297119.
Acknowledgments
We would like to acknowledge the kind support of ESA’s optical Mission Performance Cluster, to provide regular observations of the lunar surface from the SLSTR instruments. This project would not have been possible without the foresight of Diogo Rio Fernandes and Marc Seifert during the early days of development of the SAFIRE instrument. Joris Blommaert & Dirk Nuyts would like to thank the Belgian Federal Science Policy Office (BELSPO) for the provision of financial support in the framework of the PRODEX Programme of the European Space Agency (ESA) (contract No 4000144717).
Conflicts of Interest
The authors declare that Christian Mollière and co-authors affiliated with OroraTech GmbH are employed by a company developing and operating thermal infrared instruments and calibration methods related to this work.
Abbreviations
The following abbreviations are used in this manuscript:
| ATBD | Algorithm Theoretical Basis Document |
| DEM | Digital Elevation Model |
| DN | Digital Number |
| ESA | European Space Agency |
| F1 | MWIR band of SLSTR instrument |
| F2 | LWIR band of SLSTR instrument |
| GSD | Ground Sampling Distance |
| L2 | LWIR band of SAFIRE instrument |
| LEO | Low Earth Orbit |
| LWIR | Long-wave Infrared |
| M0 | MWIR band of SAFIRE instrument |
| MWIR | Mid-wave Infrared |
| Opt-MPC | Optical Mission Performance Cluster |
| RMSE | Root mean square error |
| rRMSE | Relative RMSE |
| SAFIRE | Satellite based Fire Recognition |
| SLSTR | Sea and Land Surface Temperature Radiometer |
| TIR | Thermal Infrared |
| TPM | Thermo-physical Model |
Appendix A. Calibration & Validation of SAFIRE Observations
Figure A1 shows the calibration and validation split used for the SAFIRE observations. For each imager and spectral band, up to five observations within a lunar phase angle range of ±45° were selected for calibration of the radiometric gain. This phase-angle interval was chosen because both thermophysical models exhibit their most stable agreement in this region (Figure 11), while larger phase angles show increasing model divergence and reduced signal levels. The remaining observations were reserved for validation. In the LWIR band, the calibration samples are concentrated near full Moon due to the limited availability of observations per imager within the selected phase-angle interval.
Figure A1.
Comparison of spectral flux from all observations of the 15 SAFIRE imagers against both TPM candidates. The top row shows the observations that have been used for calibration against TPM Wohlfarth. The bottom rows shows the remaining validation samples as well as all samples compared against the independent TPM Müller.
Figure A1.
Comparison of spectral flux from all observations of the 15 SAFIRE imagers against both TPM candidates. The top row shows the observations that have been used for calibration against TPM Wohlfarth. The bottom rows shows the remaining validation samples as well as all samples compared against the independent TPM Müller.
References
- Kieffer, H.H.; Stone, T.C. The Spectral Irradiance of the Moon. The Astronomical Journal 2005, 129, 2887–2901. [CrossRef]
- Vasavada, A.R.; Bandfield, J.L.; Greenhagen, B.T.; Hayne, P.O.; Siegler, M.A.; Williams, J.; Paige, D.A. Lunar equatorial surface temperatures and regolith properties from the Diviner Lunar Radiometer Experiment. Journal of Geophysical Research: Planets 2012, 117. [CrossRef]
- Hayne, P.O.; Bandfield, J.L.; Siegler, M.A.; Vasavada, A.R.; Ghent, R.R.; Williams, J.; Greenhagen, B.T.; Aharonson, O.; Elder, C.M.; Lucey, P.G.; et al. Global Regolith Thermophysical Properties of the Moon From the Diviner Lunar Radiometer Experiment. Journal of Geophysical Research: Planets 2017, 122, 2371–2400. [CrossRef]
- Bandfield, J.L.; Hayne, P.O.; Williams, J.P.; Greenhagen, B.T.; Paige, D.A. Lunar surface roughness derived from LRO Diviner Radiometer observations. Icarus 2015, 248, 357–372. [CrossRef]
- Spencer, J.R. A rough-surface thermophysical model for airless planets. Icarus 1990, 83, 27–38. [CrossRef]
- Vasavada, A. Near-Surface Temperatures on Mercury and the Moon and the Stability of Polar Ice Deposits. Icarus 1999, 141, 179–193. [CrossRef]
- Lucey, P.G.; Greenhagen, B.; Donaldson Hanna, K.; Bowles, N.; Flom, A.; Paige, D.A. Christiansen Feature Map From the Lunar Reconnaissance Orbiter Diviner Lunar Radiometer Experiment: Improved Corrections and Derived Mineralogy. Journal of Geophysical Research: Planets 2021, 126. [CrossRef]
- Millán, L.; Thomas, I.; Bowles, N. Lunar regolith thermal gradients and emission spectra: Modeling and validation. Journal of Geophysical Research 2011, 116. [CrossRef]
- Thomas, I.R.; Greenhagen, B.T.; Bowles, N.E.; Donaldson Hanna, K.L.; Temple, J.; Calcutt, S.B. A new experimental setup for making thermal emission measurements in a simulated lunar environment. Review of Scientific Instruments 2012, 83. [CrossRef]
- Donaldson Hanna, K.L.; Wyatt, M.B.; Thomas, I.R.; Bowles, N.E.; Greenhagen, B.T.; Maturilli, A.; Helbert, J.; Paige, D.A. Thermal infrared emissivity measurements under a simulated lunar environment: Application to the Diviner Lunar Radiometer Experiment. Journal of Geophysical Research: Planets 2012, 117. [CrossRef]
- Lawson, S.L.; Jakosky, B.M.; Park, H.; Mellon, M.T. Brightness temperatures of the lunar surface: Calibration and global analysis of the Clementine long-wave infrared camera data. Journal of Geophysical Research: Planets 2000, 105, 4273–4290. [CrossRef]
- Müller, T.G.; Burgdorf, M.; Alí-Lagoa, V.; Buehler, S.A.; Prange, M. The Moon at thermal infrared wavelengths: a benchmark for asteroid thermal models. Astronomy & Astrophysics 2021, 650, A38. [CrossRef]
- Wohlfarth, K.; Wöhler, C.; Hiesinger, H.; Helbert, J. An advanced thermal roughness model for airless planetary bodies: Implications for global variations of lunar hydration and mineralogical mapping of Mercury with the MERTIS spectrometer. Astronomy & Astrophysics 2023, 674, A69. [CrossRef]
- Coppo, P.; Mastrandrea, C.; Stagi, M.; Calamai, L.; Barilli, M.; Nieke, J. The sea and land surface temperature radiometer (SLSTR) detection assembly design and performance. In Proceedings of the Sensors, Systems, and Next-Generation Satellites XVII; Meynart, R.; Neeck, S.P.; Shimoda, H., Eds. SPIE, 2013, Vol. 8889, p. 888914. [CrossRef]
- NWP SAF / EUMETSAT. Spectral Response Functions — RTTOV Coefficient Files. https://nwp-saf.eumetsat.int/site/software/rttov/download/coefficients/spectral-response-functions/, 2026. Accessed: 2026-02-24. Provides spectral response function data and passband information for sensors used in RTTOV coefficient generation.
- EUMETSAT. SLSTR Level-1 Uncertainties ATBD (Algorithm Theoretical Basis Document), Issue 4.0. Technical Report SLSTR-RAL-EUM-TN-003, European Organisation for the Exploitation of Meteorological Satellites (EUMETSAT), n.d. Accessed: 2026-05-05.
- Wolf, A.; Pezoa, J.E.; Figueroa, M. Modeling and Compensating Temperature-Dependent Non-Uniformity Noise in IR Microbolometer Cameras. Sensors 2016, 16. [CrossRef]
- Wohlfarth, K.S. Computational methods for infrared spectroscopy of airless planetary bodies. PhD thesis, TU Dortmund University, 2025.
- Rozitis, B.; Green, S.F. Directional characteristics of thermal-infrared beaming from atmosphereless planetary surfaces - a new thermophysical model: Characteristics of thermal-infrared beaming. Monthly Notices of the Royal Astronomical Society 2011, 415, 2042–2062. [CrossRef]
- Wu, Y.; Jin, Q.; Li, C.; Xu, T.; Qi, W.; Tan, W.; Li, X.; Shi, Z.; He, H.; Dai, S.; et al. Unveiling the Secrets of the Midinfrared (3–5 μm) Moon. Geophysical Research Letters 2021, 48. [CrossRef]
- Lagerros, J.S.V. Thermal physics of asteroids. I. Effects of shape, heat conduction and beaming. 1996, 310, 1011–1020.
- Lagerros, J.S.V. Thermal physics of asteroids. III. Irregular shapes and albedo variegations. 1997, 325, 1226–1236.
- Lagerros, J.S.V. Thermal physics of asteroids. IV. Thermal infrared beaming. 1998, 332, 1123–1132.
- Mueller, T.G.; Lagerros, J.S.V. Asteroids as far-infrared photometric standards for ISOPHOT. 1998, 338, 340–352.
- Wu, Y.; Jin, Q.; Li, C.; Xu, T.; Qi, W.; Tan, W.; Li, X.; Shi, Z.; He, H.; Dai, S.; et al. Unveiling the Secrets of the Midinfrared (3–5 μm) Moon. Geophysical Research Letters 2021, 48, e2020GL088393. [CrossRef]
- Paige, D.A.; Foote, M.C.; Greenhagen, B.T.; Schofield, J.T.; Calcutt, S.; Vasavada, A.R.; Preston, D.J.; Taylor, F.W.; Allen, C.C.; Snook, K.J.; et al. The Lunar Reconnaissance Orbiter Diviner Lunar Radiometer Experiment. Space Science Reviews 2010, 150, 125–160. [CrossRef]
- Bandfield, J.L.; Hayne, P.O.; Williams, J.P.; Greenhagen, B.T.; Paige, D.A. Lunar surface roughness derived from LRO Diviner Radiometer observations. Icarus 2015, 248, 357–372. [CrossRef]
- Keihm, S.J. Interpretation of the lunar microwave brightness temperature spectrum: Feasibility of orbital heat flow mapping. Icarus 1984, 60, 568–589. [CrossRef]
- Vasavada, A.R.; Bandfield, J.L.; Greenhagen, B.T.; A., P.O.H.M.; Siegler.; Paige, J.P.W.D.A. Lunar equatorial surface temperatures and regolith properties from the Diviner Lunar Radiometer Experiment. Journal of Geophysical Research: Planets 2012, 117. [CrossRef]
- Feng, J.; Siegler, M.A.; Hayne, P.O. New Constraints on Thermal and Dielectric Properties of Lunar Regolith from LRO Diviner and CE-2 Microwave Radiometer. Journal of Geophysical Research: Planets 2020, 125, e2019JE006130. [CrossRef]
- Foote, E.J.; Paige, D.A.; Shepard, M.K.; Johnson, J.R.; Biggar, S. The bidirectional and directional hemispheric reflectance of Apollo 11 and 16 soils: Laboratory and Diviner measurements. Icarus 2020, 336, 113456. [CrossRef]
- Rubanenko, L.; Schorghofer, N.; Greenhagen, B.T.; Paige, D.A. Equilibrium Temperatures and Directional Emissivity of Sunlit Airless Surfaces With Applications to the Moon. Journal Geophysical Research: Planets 2020, 125, e2020JE006377. [CrossRef]
- Jhoti, E.; Powell, T.M.; Bennett, K.; Gallinger, C.; Paige, D.A. Modeling the Lunar Thermal Emission Phase Function With the Diviner Lunar Radiometer. Journal of Geophysical Research: Planets 2026, 131. [CrossRef]
- Smith, D.; Barillot, M.; Bianchi, S.; Brandani, F.; Coppo, P.; Etxaluze, M.; Frerick, J.; Kirschstein, S.; Lee, A.; Maddison, B.; et al. Sentinel-3A/B SLSTR Pre-Launch Calibration of the Thermal InfraRed Channels. Remote Sensing 2020, 12, 2510. [CrossRef]
- Leonardo S.p.A.. SLSTR LQ Datasheet. Technical datasheet, Leonardo S.p.A., 2018. Accessed: 2026-04-10.
- Davidsson, B.J.; Rickman, H.; Bandfield, J.L.; Groussin, O.; Gutiérrez, P.J.; Wilska, M.; Capria, M.T.; Emery, J.P.; Helbert, J.; Jorda, L.; et al. Interpretation of thermal emission. I. The effect of roughness for spatially resolved atmosphereless bodies. Icarus 2015, 252, 1–21. [CrossRef]
Figure 1.
Spectral response functions of both SLSTR instruments on-board Sentinel-3A and 3B [15].
Figure 1.
Spectral response functions of both SLSTR instruments on-board Sentinel-3A and 3B [15].
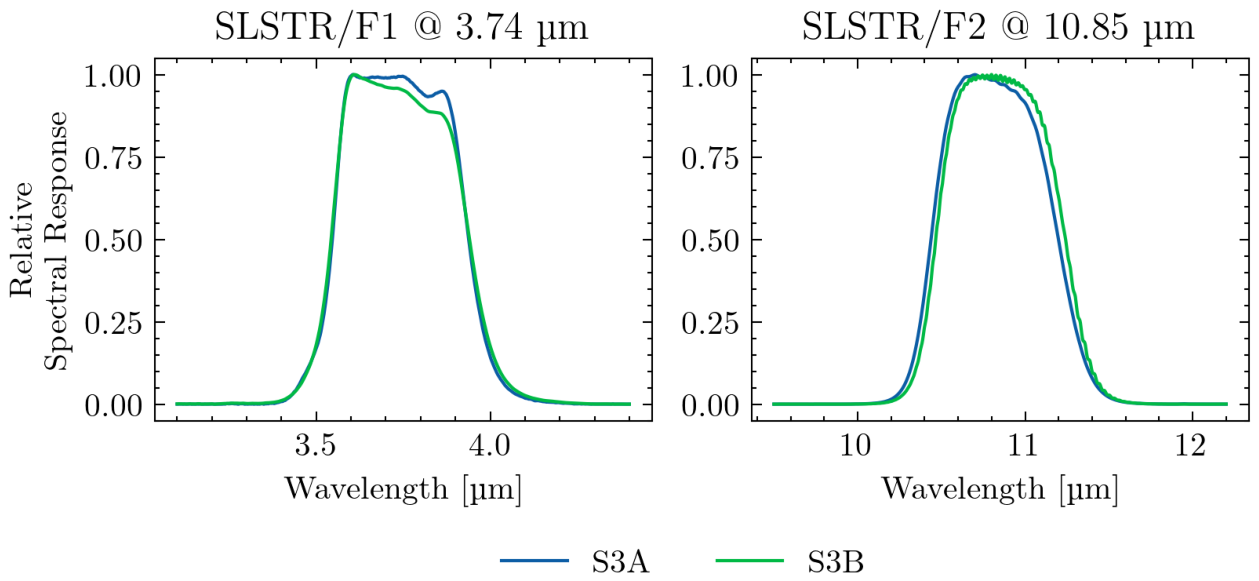
Figure 2.
Exemplary observation of the lunar surface from SLSTR on-board of Sentinel-3B in November, 2023. The two spectral channels can be acquired quasi-simultaneously given the scanning mode of the instrument. The observations were provided by the Opt-MPC.
Figure 2.
Exemplary observation of the lunar surface from SLSTR on-board of Sentinel-3B in November, 2023. The two spectral channels can be acquired quasi-simultaneously given the scanning mode of the instrument. The observations were provided by the Opt-MPC.
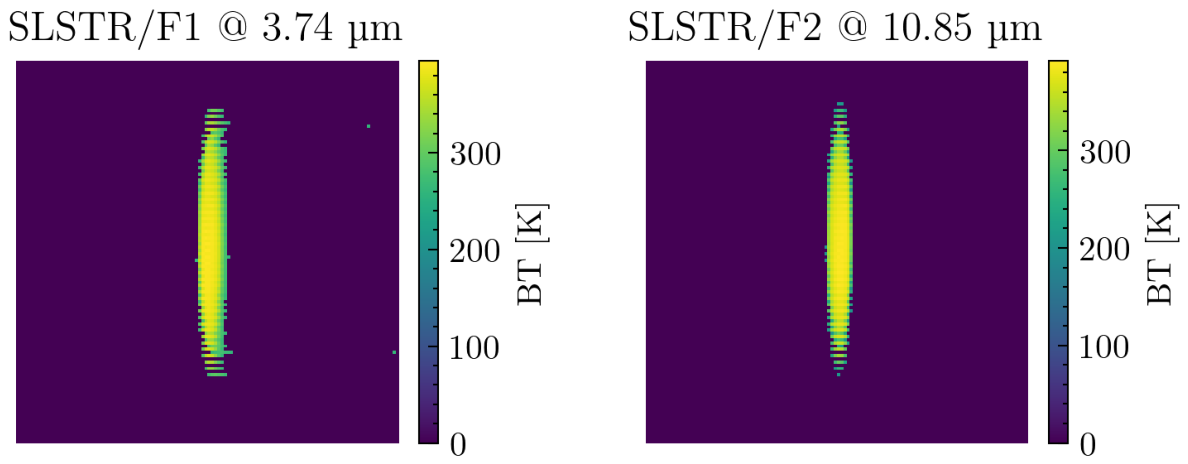
Figure 3.
Mean and standard deviation of the relative spectral response functions of all 15 SAFIRE imagers used in this study. The MWIR filters show a leak in the LWIR spectral range. The leakage has been removed in the latest sensor generation.
Figure 3.
Mean and standard deviation of the relative spectral response functions of all 15 SAFIRE imagers used in this study. The MWIR filters show a leak in the LWIR spectral range. The leakage has been removed in the latest sensor generation.
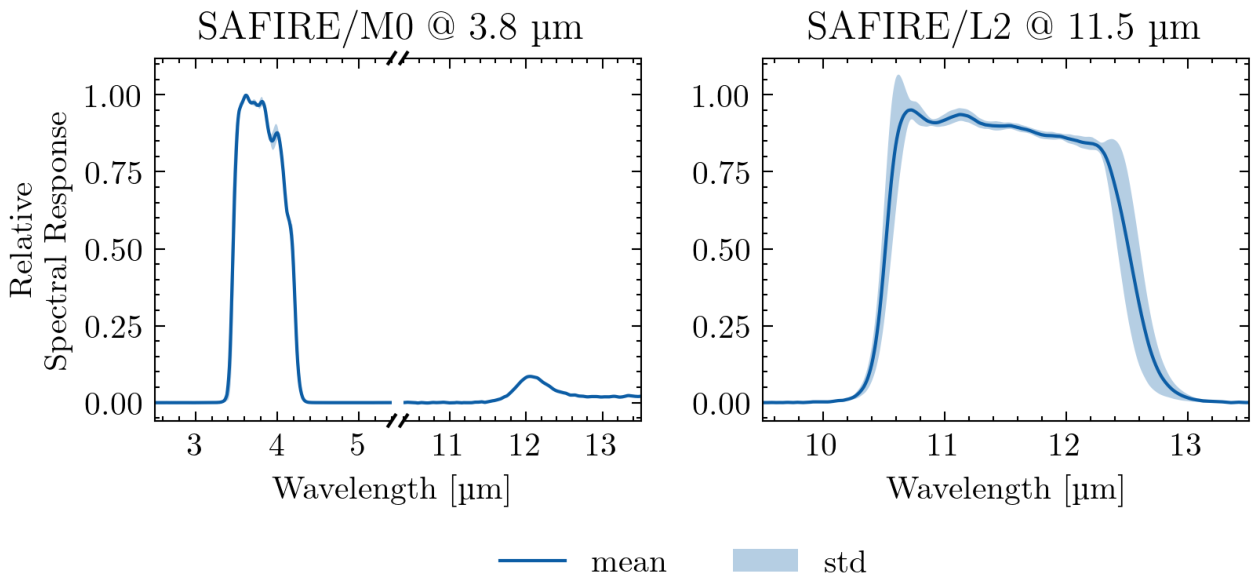
Figure 4.
Exemplary observations of the lunar surface as seen from SAFIRE on-board of FOREST-2 for two different dates in 2025. The samples were corrected by applying the radiometric gain derived by this work. The M0 sample was taken at and the L2 sample at lunar phase respectively.
Figure 4.
Exemplary observations of the lunar surface as seen from SAFIRE on-board of FOREST-2 for two different dates in 2025. The samples were corrected by applying the radiometric gain derived by this work. The M0 sample was taken at and the L2 sample at lunar phase respectively.
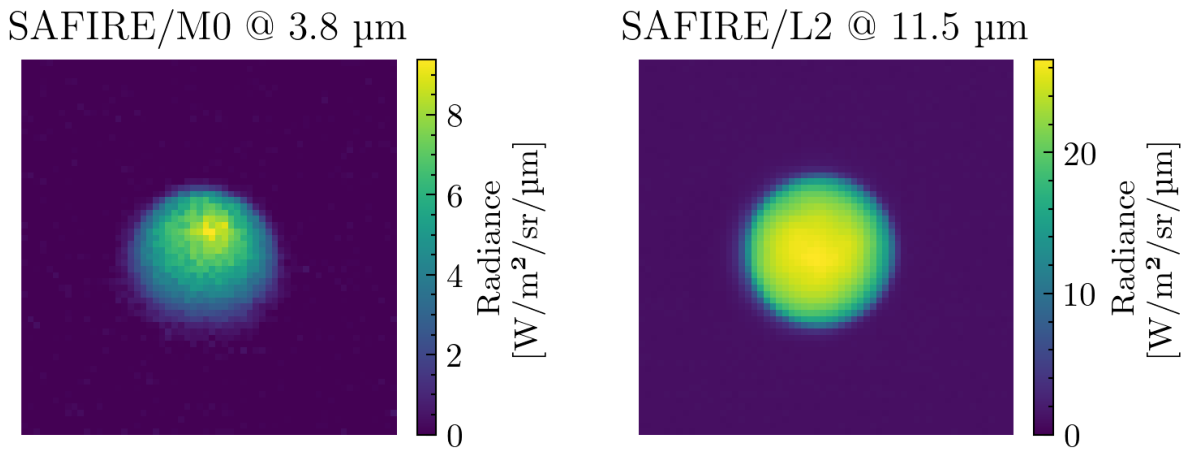
Figure 5.
Geometric conventions for a thermal roughness model of TPM Wohlfarth. Left: the planetary model is divided into N facets indexed with n. Middle: Each facet is associated with a fractal surface with M = 200 × 200 elements with edge width 1 mm. Right: Relationship between physical quantities. Adopted from [13] and [19].
Figure 5.
Geometric conventions for a thermal roughness model of TPM Wohlfarth. Left: the planetary model is divided into N facets indexed with n. Middle: Each facet is associated with a fractal surface with M = 200 × 200 elements with edge width 1 mm. Right: Relationship between physical quantities. Adopted from [13] and [19].
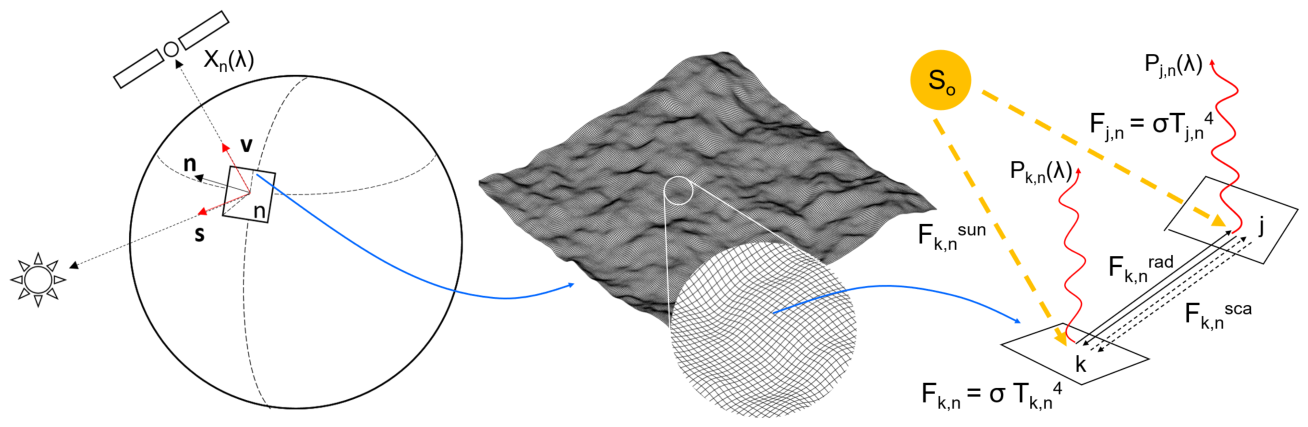
Figure 6.
Relationship between data sources in this study. The TPM Wohlfarth is used to transfer radiometric calibration from SLSTR onto the SAFIRE platform. The TPM Müller is employed as an independent source for means of validation. The phase angle range is indicated for each dataset.
Figure 6.
Relationship between data sources in this study. The TPM Wohlfarth is used to transfer radiometric calibration from SLSTR onto the SAFIRE platform. The TPM Müller is employed as an independent source for means of validation. The phase angle range is indicated for each dataset.
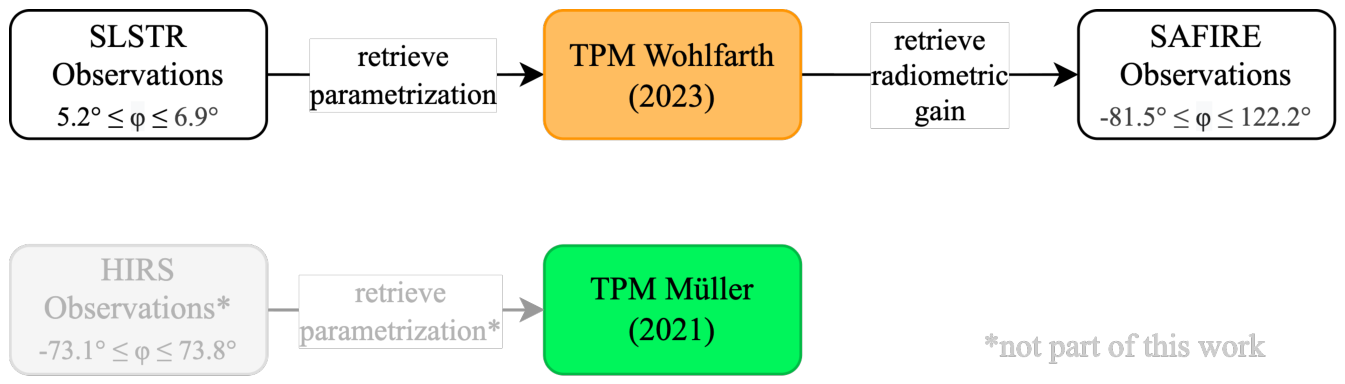
Figure 9.
Comparison of the relative flux of two TPM models against SLSTR observations after calibration of TPM Wohlfarth against SLSTR. TPM Müller has not been modified and predicts the disk-integrated flux at the epochs of the SLSTR observations based on its native parametrization. The mean and standard deviation of relative flux is given for each model. Outliers in the F2 band are denoted as grey markers.
Figure 9.
Comparison of the relative flux of two TPM models against SLSTR observations after calibration of TPM Wohlfarth against SLSTR. TPM Müller has not been modified and predicts the disk-integrated flux at the epochs of the SLSTR observations based on its native parametrization. The mean and standard deviation of relative flux is given for each model. Outliers in the F2 band are denoted as grey markers.
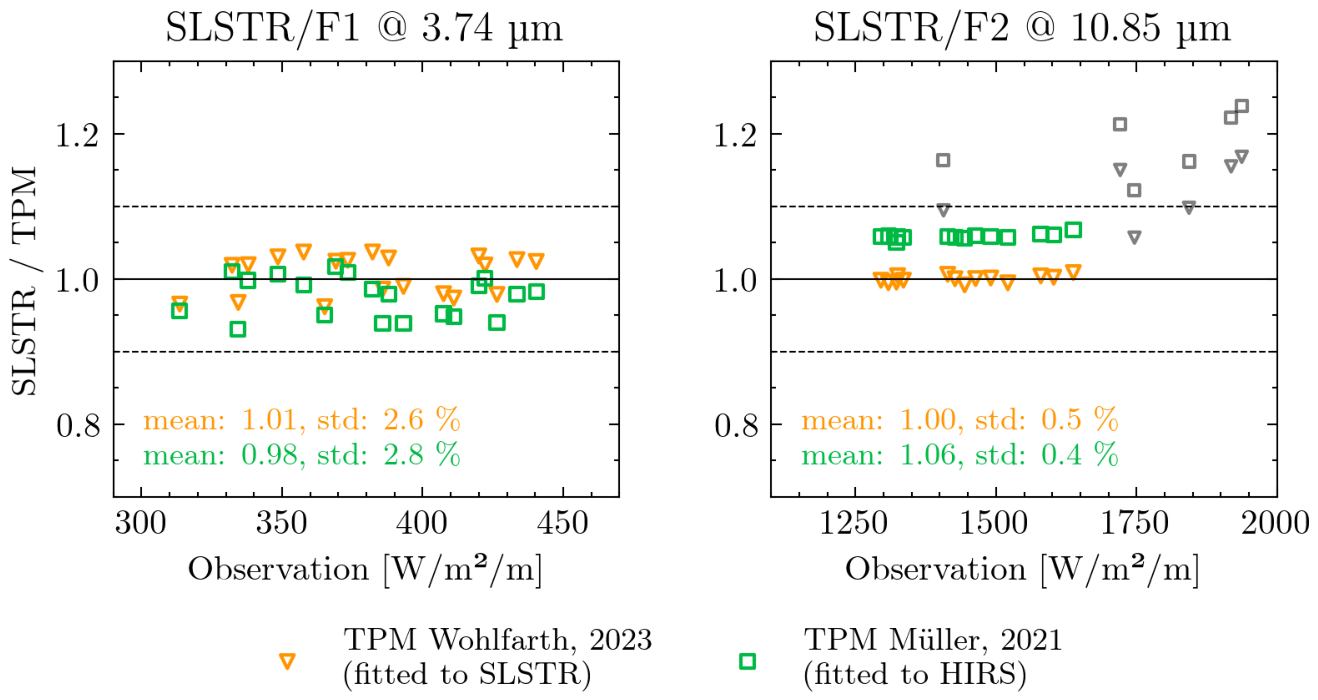
Figure 10.
Comparison of spectral flux from all observations of the SAFIRE imagers against both TPM candidates. The figures include both calibration samples and validation samples. The SAFIRE imagers have been calibrated against TPM Wohlfarth. The relative RMSE (rRMSE) is normalized to the mean of all observations. A detailed calibration and validation split is shown in Figure A1.
Figure 10.
Comparison of spectral flux from all observations of the SAFIRE imagers against both TPM candidates. The figures include both calibration samples and validation samples. The SAFIRE imagers have been calibrated against TPM Wohlfarth. The relative RMSE (rRMSE) is normalized to the mean of all observations. A detailed calibration and validation split is shown in Figure A1.
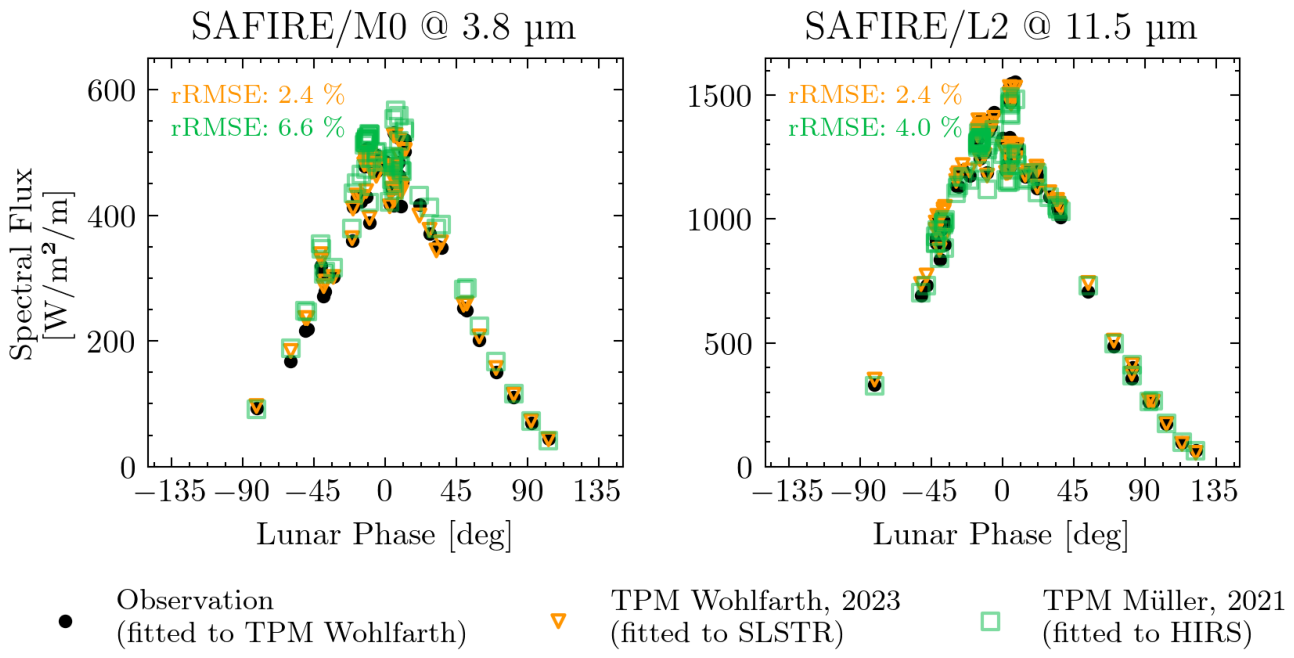
Figure 11.
Top: Comparison of relative flux from all SAFIRE observations against both TPM candidates after calibration of SAFIRE against TPM Wohlfarth. Bottom: Comparison of relative flux from TPM Wohlfarth and TPM Müller for all SAFIRE observational epochs. The mean and standard deviations are given for all sets of relative flux.
Figure 11.
Top: Comparison of relative flux from all SAFIRE observations against both TPM candidates after calibration of SAFIRE against TPM Wohlfarth. Bottom: Comparison of relative flux from TPM Wohlfarth and TPM Müller for all SAFIRE observational epochs. The mean and standard deviations are given for all sets of relative flux.
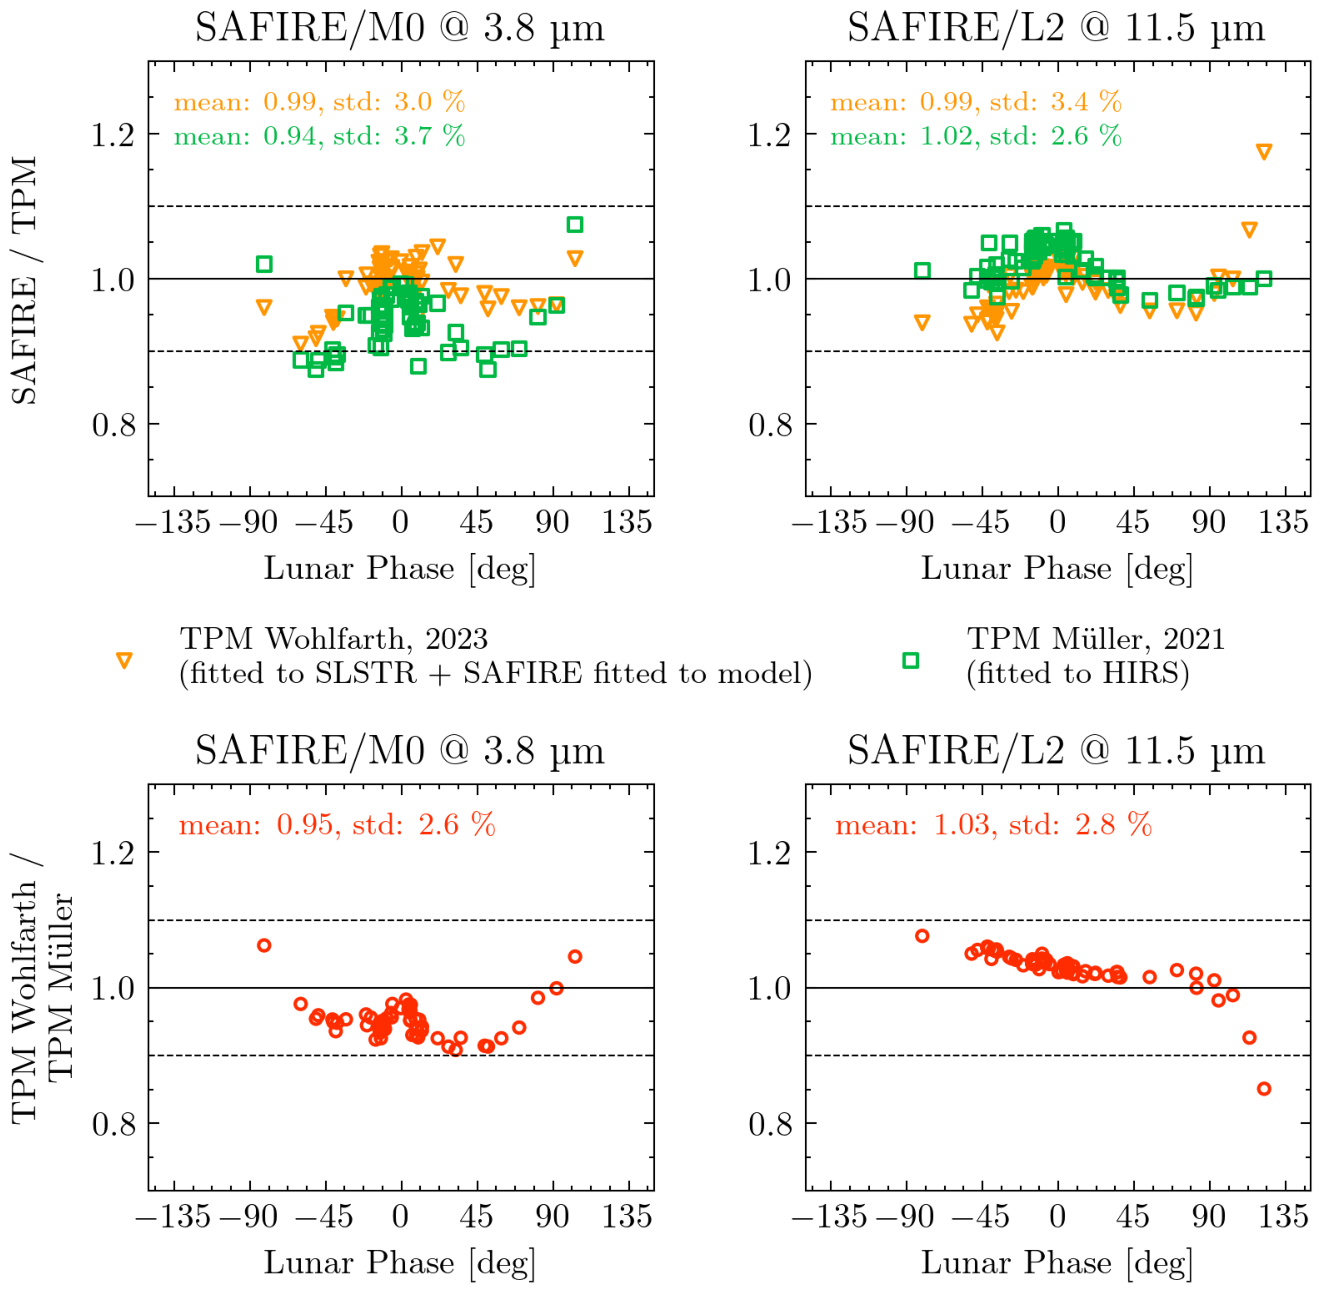
Figure 12.
Comparison of mean and standart deviation of the ratio of spectral flux from both model candidates. The models were evaluated for the 64 epochs of the SAFIRE/M0 dataset. The spectral response functions of SAFIRE are indicated in gray.
Figure 12.
Comparison of mean and standart deviation of the ratio of spectral flux from both model candidates. The models were evaluated for the 64 epochs of the SAFIRE/M0 dataset. The spectral response functions of SAFIRE are indicated in gray.
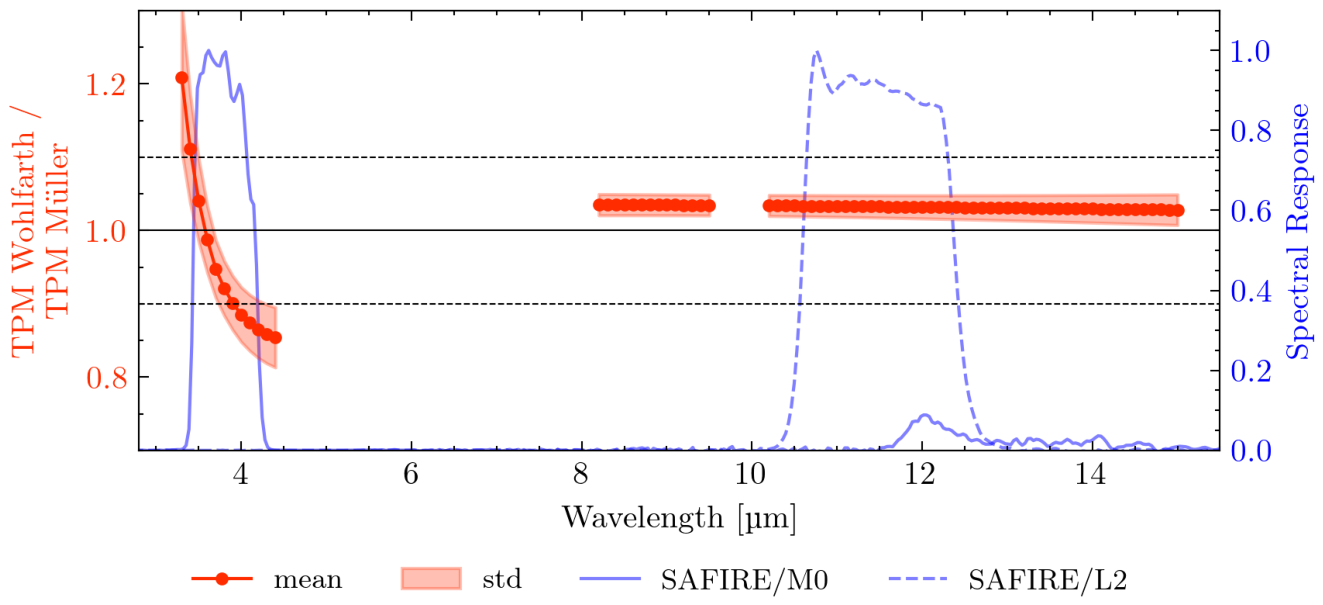

Table 1.
Total count of lunar observations from different instruments in the used reference datasets.
Table 1.
Total count of lunar observations from different instruments in the used reference datasets.
| Instrument | # Sensors | # Obs. MWIR |
# Obs. LWIR |
Datetime Range |
Lunar Phase Angle Range |
|---|---|---|---|---|---|
| SLSTR | 2 | 20 | 20 | 2023/08/31 – 2025/08/09 |
– |
| SAFIRE | 15 | 65 | 83 | 2024/05/30 – 2025/10/08 |
– |
Table 2.
Results of parameter grid search for the calibration of TPM Wohlfarth against SLSTR. The effective emissivity in the MWIR range is inferred by the TPM during runtime based on the mapped bidirectional reflectance estimate obtained from the HAPKE model [13] (see Figure 7 for exemplary values). In contrast, reflectance is neglected in the LWIR part of the TPM. It is therefore run with a scalar emissivity value for the entire lunar disk that is subject to calibration against SLSTR.
Table 2.
Results of parameter grid search for the calibration of TPM Wohlfarth against SLSTR. The effective emissivity in the MWIR range is inferred by the TPM during runtime based on the mapped bidirectional reflectance estimate obtained from the HAPKE model [13] (see Figure 7 for exemplary values). In contrast, reflectance is neglected in the LWIR part of the TPM. It is therefore run with a scalar emissivity value for the entire lunar disk that is subject to calibration against SLSTR.
| MWIR Range | LWIR Range | |||
| Parameter | Optimal | Search Range | Optimal | Search Range |
| Albedo Scaling | 1.1 | 0.8 - 2.1 | 1.1 | 0.8 - 2.1 |
| Roughness | - | - | ||
| Emissivity | inferred | - | ||
Disclaimer/Publisher’s Note: The statements, opinions and data contained in all publications are solely those of the individual author(s) and contributor(s) and not of MDPI and/or the editor(s). MDPI and/or the editor(s) disclaim responsibility for any injury to people or property resulting from any ideas, methods, instructions or products referred to in the content. |
© 2026 by the authors. Licensee MDPI, Basel, Switzerland. This article is an open access article distributed under the terms and conditions of the Creative Commons Attribution (CC BY) license (http://creativecommons.org/licenses/by/4.0/).
Copyright: This open access article is published under a Creative Commons CC BY 4.0 license, which permit the free download, distribution, and reuse, provided that the author and preprint are cited in any reuse.


