

Submitted:
14 July 2026
Posted:
15 July 2026
You are already at the latest version
Abstract
Against the intertwined strategic backdrop of China’s “dual carbon” initiative and high-quality urbanization drive, this paper systematically investigates the coupling coordination relationship and evolutionary trends between urbanization development and carbon emission efficiency across the 11 provincial-level administrative regions of the Yangtze River Economic Belt (YREB). Based on a constructed multi-dimensional comprehensive evaluation index system for urbanization and carbon emission systems, three mainstream econometric and simulation methods are adopted, including the entropy weight method, coupling coordination degree model, and system dynamics model to empirically examine the spatiotemporal evolution characteristics of urbanization-carbon emission coupling coordination during the period 2000–2021 and further predict its dynamic development trajectories for 2022–2032. The empirical results indicate that, first, the overall urbanization level of the YREB presents a fluctuating upward trend over the study period, with spatial urbanization serving as the core driving pillar. Meanwhile, the comprehensive carbon emission index increases steadily with pronounced and persistent regional heterogeneity across the region. Second, the regional coupling coordination degree demonstrates a continuous improving trend, while the developmental gaps among the eastern, central, and western sub-regions gradually diminish over time; Shanghai consistently maintains a pioneering level of coupling coordination throughout the whole period. Third, the upward evolution of coupling coordination is projected to sustain from 2022 to 2032. By 2032, all provincial-level regions in the YREB will achieve notable progress in coordinated development, with the majority entering the stage of good or superior coordination. On this basis, this study puts forward targeted policy implications for accelerating the low-carbon transformation of urbanization and promoting balanced and coordinated regional development in the YREB, which provides practical references for advancing the region’s sustainable transition and facilitating the realization of national “dual carbon” goals.
Keywords:
Yangtze river economic belt
; urbanization
; carbon emissions
; coupling coordination degree
; trend prediction
1. Introduction
Against the dual strategic backdrop of the carbon peaking and carbon neutrality goals as well as the high-quality development of urbanization, China has achieved remarkable progress in urbanization construction. The national urbanization rate reached 67% in 2024, placing China in the mid-to-late stage of rapid development as defined by the Northam curve. Processes including population migration, industrial transformation, and spatial expansion are still advancing continuously. Urbanization constitutes a complex systematic project [1].China has experienced population migration, a shift in industrial structure, growth in economic activity, an expansion of built-up areas, and an improvement in living standards [2].However, the conflict between urbanisation and carbon emissions is becoming increasingly apparent: research shows that cities are the primary source of over 80% of global carbon emissions [3].More than half of the world’ s population lives in cities, accounting for 70% of carbon dioxide emissions. In China, energy consumption in urban and town areas accounts for 75.15% of total energy use [4], and factors such as land-use changes and fossil fuel consumption during the urbanisation process have intensified the pressure to reduce carbon emissions [5];Meanwhile, the agglomeration effect of urbanization, incentives for technological innovation, and the dissemination of low-carbon concepts also provide potential pathways for carbon emission reduction, forming a dual effect of carbon increase and carbon abatement [6]. Promoting the development of green urbanization and a low-carbon economy is regarded as the key to achieving regional sustainable development [7].
Existing literature has extensively examined the relationship between urbanisation and carbon emissions. Existing studies show that in the measurement of urbanization level, Li Jianbao et al. adopted the single indicator of population urbanization rate to evaluate urbanization level, and analyzed the spatio-temporal coupling coordination degree between population urbanization and energy consumption-related carbon dioxide emissions in Jiangsu Province. The results indicate that the coupling coordination degree between the two shows an overall upward trend [8]. Lu Jing constructed an evaluation index system for the development level of new-type urbanization by comprehensively selecting 24 indicators covering six dimensions, namely population development, economic development, residents’ living standards, social development, ecological environment, and urban–rural integration. The study revealed that China’ s new-type urbanization level has maintained a continuous upward trend with obvious spatial imbalance [9]. In terms of the measurement of carbon emission level, Zheng Han et al. adopted total carbon emissions to quantify carbon emission levels to highlight the impact of population size on carbon emissions [10]. Song et al. established a low-carbon level evaluation index system using the comprehensive index method from four dimensions including population and public services [11].Regarding the correlation between urbanization and carbon emissions, Wang et al. found a positive linear relationship between urbanization and carbon emissions in China [12]; Xu et al. verified an Environmental Kuznets Curve relationship between land-economic urbanization and carbon emissions in the Pearl River Delta [13]; Muhammad et al. concluded that the inverted U-shaped relationship only exists in upper-middle-income countries [14].In terms of research on coupling coordination degree, the coupling coordination model has been widely applied at multiple spatial scales from national to county levels. For instance, Dong et al. analyzed the coupling relationship between urbanization and ecological environment in Mongolia [15]; Zhao et al. revealed that the dynamic coupling between urbanization and ecological environment in the Yangtze River Delta conforms to an S-shaped curve [16]; He et al. found that the coordination degree between the two systems in Shanghai has evolved from severely unbalanced to highly coordinated [17]. Nevertheless, relevant studies focusing on the coupling coordination between urbanization and carbon emissions remain relatively limited. The mainstream methods for the prediction of coupling coordination degree mainly include the BP neural network, ARIMA model, Markov chain, and grey prediction model. Among them, Xu Xiaoying et al. combined the BP neural network and ARIMA model to forecast the evolutionary trend of coupling coordination degree in the next five years [18].In terms of the application of system dynamics in the field of urbanization and carbon emissions, system dynamics is adept at analyzing the interactive effects of elements within complex systems and has been widely applied to urbanization development, energy consumption, carbon emission prediction, and policy scenario simulation. For example, Wen et al. constructed a system dynamics model to simulate carbon neutrality pathways [19]; Yang et al. predicted China’s carbon emission levels during 2005–2050 [20]; Gu et al. simulated urbanization and energy consumption under different scenarios [21]. Nevertheless, most existing studies focus merely on the separate prediction of urbanization or carbon emissions, while few efforts have been devoted to forecasting the dynamic trend of their coupling coordination degree.
The major contributions of this study are summarized as follows. First, a multi-dimensional comprehensive evaluation system is constructed by adopting the entropy weight method for objective weight assignment, which effectively improves the comprehensiveness and scientific rigor of the evaluation framework. Second, this study integrates the coupling coordination degree model and the system dynamics (SD) model to systematically investigate the spatiotemporal evolutionary characteristics of the coupling coordination relationship between urbanization and carbon emissions across 11 provincial-level administrative regions in the Yangtze River Economic Belt during 2000–2021. This approach addresses the research gap in existing literature regarding the long-term, multi-dimensional quantitative analysis of their interactive coupling coordination in the study area. Third, this study innovatively employs the SD model to predict the coupling coordination degree between urbanization and carbon emissions. With key variables calibrated via the ARIMA model and curve fitting techniques, this research achieves accurate trend forecasting for the period 2022–2032. This hybrid forecasting framework overcomes the methodological limitations of conventional single prediction approaches, providing prospective theoretical references and practical implications for the low-carbon and sustainable urbanization development of the study region.
2. Materials and Methods
2.1. Data Sources and Processing
This study adopts energy consumption data from the Energy Statistical Yearbook covering the period of 2000–2021, with the prediction interval set as 2022–2032.To eliminate the effects of inflation, all price-related data has been adjusted for price changes. Furthermore, given that some variables contain missing data, linear interpolation has been used to address this. Data on energy consumption and standard coal coefficients are both sourced from the China Energy Statistical Yearbook for the period 2001–2021.All data is sourced from official government channels and is accurate and reliable. In this study, carbon emission factors were adopted to calculate carbon content and carbon oxidation rate. Meanwhile, the average low heating value provided in the China Energy Statistical Yearbook was applied for calorific value estimation. Relevant socio-economic variables, such as industrial structure, energy mix, urbanisation levels and energy consumption, are calculated using historical data collected over the years.
2.2. Development of an Indicator Framework
2.2.1. Calculation of Indicator Weights Using the Entropy Weighting Method
In this study, the entropy weight method is adopted for indicator weighting, so as to provide a solid basis for multi-index comprehensive evaluation.
2.2.2. Development of the Evaluation Indicator System and Results of Weighting Calculations
Referring to relevant existing studies, this study constructs a comprehensive evaluation index system for urbanization with a total of 16 specific indicators across four dimensions: population urbanization, economic urbanization, social urbanization, and spatial urbanization. The specific indicators and their corresponding weights are presented in Table 1.
Drawing on relevant research, this study constructs a comprehensive evaluation index system for carbon emissions from four dimensions, namely population carbon emissions, economic carbon emissions, energy carbon emissions, and carbon sink capacity, with a total of 10 specific indicators. The detailed indicators and their corresponding weights are presented in Table 2.
2.2.3. Development of the Evaluation Indicator System and Results of Weighting Calculations
For the calculation of carbon emissions from fossil energy consumption in 11 provinces (municipalities) from 2000 to 2021, the carbon emission factor method provided by the IPCC was adopted, with specific values shown in Table 3. The formula is expressed as follows:
Where Ce denotes carbon dioxide emissions from energy consumption; the subscript d denotes the disaggregated energy type; the subscript d denotes the disaggregated energy type;Ed denotes the consumption of fossil energy d;NCVd denotes the average net calorific value of energy d;CCd denotes the carbon content of energy d;Od denotes the carbon oxidation rate of energy d,and 4412 represents the conversion coefficient between carbon dioxide and carbon.
Subsequently, the total carbon emissions of each province and municipality in the Yangtze River Economic Belt from 2000 to 2021 were calculated by integrating energy consumption data and carbon emission factors. The detailed calculation results are presented in Table 4, and the temporal variation trend of total carbon emissions is illustrated in Figure 1.
2.3. Research Methods
2.3.1. Coupling Coordination Model
The coupling coordination degree model involves the calculation of three indicators, namely coupling degree, coordination degree, and coupling coordination degree.
Step 1: Calculate the coupling coefficient C.
In the formula, C denotes the coupling degree, U1 denotes the comprehensive evaluation index of urbanization, and U2 denotes the comprehensive evaluation index of carbon emissions. The coupling degree ranges from 0 to 1. When the calculated coupling degree is closer to 1, the dispersion between subsystems is smaller, indicating a stronger interaction between the systems, and vice versa.
Step 2: Calculate the coordination coefficient T.
In the formula, α and β refer to the importance of the development of the urbanization system and the carbon emission system, respectively, and their sum should be equal to 1. In this study, the two systems are assumed to be equally important in their development; therefore, equal weights are assigned, that is,α=β=0.5.
Step 3: Calculate the coupling coordination.
Step 4: Classification of coupling coordination levels. Establishing classification criteria for coordination levels based on the magnitude of coupling coordination degree facilitates the evaluation of the coupling coordination relationship between systems. Drawing on previous studies, this study divides the coupling coordination degree into four stages with a total of ten levels, as detailed in Table 5.
2.3.2. System Dynamics Model
This study takes the provincial regions of the Yangtze River Economic Belt as the spatial boundary of the system, covering 11 provinces and municipalities. Based on the interaction between systems, various indicators from the evaluation index system of urbanization and carbon emissions are selected as the main system variables, together with other relevant factors. The classification results of subsystems and specific factors are presented in Table 6.
In this study, Vensim PLE software was employed to draw the causal loop diagram of urbanization and carbon emissions for the 11 provinces and municipalities in the Yangtze River Economic Belt, as shown in Figure 2. This diagram helps to identify the interactive relationships of key variables between the two major systems of urbanization and carbon emissions.
Based on the causal loop diagram summarized above, this study employed Vensim PLE software to construct the stock-flow diagram for system dynamics. Figure 3 only presents the stock-flow diagram of Zhejiang Province as an example. According to the characteristics of the model, this study selected eight core indicators: population growth rate, urban population density, urban registered unemployment rate, urbanization rate, GDP growth rate, total output value of the primary industry, number of doctors per 10,000 people, and carbon productivity. Focusing on these core indicators, the interactions among different subsystems in the system dynamics model are described in detail to reveal the complex dynamic relationships between them.
In terms of parameter calibration and equation formulation, this study calibrates model variables primarily through the direct assignment method, regression analysis, ratio analysis, and table function approach. The core functional equations governing key model relationships are summarized in Table 7.
3. Results
3.1. Analysis of the Results of Coupling Coordination Calculations
Based on the simulation outputs of the coupling coordination degree model, this study derives the projected coupling coordination degrees of urbanization and carbon emissions for the 11 provincial-level administrative regions in the Yangtze River Economic Belt, with detailed calculation results presented in Table 8. To visualize the spatiotemporal evolution of coupling coordination levels, four representative years (2000, 2007, 2014, and 2021) are selected for spatial mapping via ArcGIS software, and the visualized evolutionary patterns are displayed in Figure 4. The empirical results demonstrate that the coupling coordination degree between urbanization and carbon emissions across the study area presents a fluctuating upward trend, reflecting a sustained overall improvement in the coordinated development level of urbanization and carbon emission systems.
3.2. Coupled and Coordinated Forecasting of Urbanisation and Carbon Emissions
3.2.1. Scenario
This study adopts the minimum indicator values defined under the 14th Five-Year Plan as the benchmark parameters, as listed in Table 9. To ensure scientific trend forecasting, key variables are calibrated using the autoregressive integrated moving average (ARIMA) time-series model and curve fitting approaches. Subsequent system dynamics model simulations are implemented to generate the projected indicator values required for coupling coordination calculation. These simulated values are finally imported into the coupling coordination degree model to derive the future evolutionary trends of urbanization-carbon emission coupling coordination in the Yangtze River Economic Belt. The integrated application of the two models enables robust scientific forecasting of future developmental trajectories and facilitates an in-depth interpretation of the interactive nexus between urbanization development and carbon emission dynamics.
3.2.2. Analysis of Prediction Results
Based on the aforementioned scenario settings and model simulations, this study predicts the coupling coordination degree between urbanization and carbon emissions across the 11 provincial-level administrative regions of the Yangtze River Economic Belt, with detailed numerical results presented in Table 10. To intuitively visualize the evolutionary trajectories of future development, Figure 5 further illustrates the historical variations and predicted changes in the coupling coordination degree. The simulation results reveal that the overall coupling coordination level of the study area displays a steady upward trend, while the developmental gaps among eastern, central, and western regions gradually diminish over time. This evidence indicates that the interactive coupling relationship between urbanization and carbon emissions has been continuously optimized, driven by social progress, technological innovation, and improved energy utilization efficiency.
By 2032, the coupling coordination degree between urbanization and carbon emissions across all provincial-level administrative regions in the Yangtze River Economic Belt is projected to maintain an overall upward trajectory. All regions will experience measurable progress in their coupling coordination levels, with the majority of regions expected to reach the favorable coordination grade or above.
4. Discussion
4.1. Evolution Characteristics and Internal Interaction Mechanisms of the Urbanization-Carbon Emission System
The Environmental Kuznets Curve (EKC) theory posits an inverted U-shaped staged relationship among urbanization, economic development and carbon emissions. The STIRPAT model decomposes carbon emission drivers into multiple dimensions including population, affluence, technology and urban spatial patterns, and has evolved into a core theoretical framework for research on the nexus between urbanization and carbon emissions. This study reveals that the urbanization level of the Yangtze River Economic Belt exhibits a sustained fluctuating upward trend, with spatial urbanization acting as its primary supporting dimension; carbon emissions grow at a moderate pace and display prominent temporal characteristics with distinct regional differentiation. The above findings mutually verify and further revise the classical theories as well as the conclusions proposed by numerous domestic scholars.
In terms of the matching degree with the STIRPAT theoretical framework, Wang et al. constructed a multi-dimensional Spatial Durbin Model based on panel data covering 30 provincial-level regions of China from 2008 to 2014. Their empirical results verified that population urbanization, land urbanization and economic urbanization all exert positive driving effects on carbon emissions, with population scale acting as the dominant carbon-increasing factor. Moreover, the carbon emission elasticity coefficients of different urbanization dimensions present significant disparities. Such findings are highly consistent with the four-dimensional decomposition logic adopted in this research. Nevertheless, the research period of Wang’s study ended in 2014, which fails to capture the long-term effects of policy transformation. By extending the research timeframe to the post-implementation stage of energy conservation, emission reduction and Yangtze River ecological protection policies, the present study identifies that population agglomeration facilitates the sharing of public infrastructure and the popularization of low-carbon consumption among residents, which gradually generates emission-reduction dividends. This outcome revises the one-sided conclusion drawn by Wang et al., which only emphasizes the unidirectional carbon-promoting effect of population expansion.
Combined with the staged characteristics of the Environmental Kuznets Curve (EKC), Li et al. adopted a sample dataset covering 13 prefecture-level cities in Jiangsu Province from 2006 to 2017. Their empirical outcomes revealed that population urbanization and economic expansion boost carbon emissions, while industrial restructuring and technological advancement hold considerable emission abatement potential. The regional coupling coordination degree exhibited a year-on-year upward trend, accompanied by a spatial pattern where the southern region outperformed the northern counterpart. Such temporal regularities align well with this study’s findings regarding the synchronous growth of urbanization and carbon emissions as well as the continuous improvement of coordination levels across the entire Yangtze River Economic Belt. Nevertheless, Li’s research merely centered on the single dimension of population urbanization and failed to distinguish the heterogeneous impacts exerted by spatial, economic and social urbanization. By contrast, the present study verifies that spatial urbanization acts as the primary supporting dimension within the urbanization system under the riverine development mode of the Yangtze River Economic Belt, thereby addressing the limitation of insufficient multi-dimensional decomposition in Li’s prior work.
4.1.1. Heterogeneous Impacts of Four-Dimensional Urbanization on Carbon Emissions and Dominant Formation Mechanisms of Spatial Urbanization
Both Li et al. and Wang et al. argued that the expansion of total population directly raises residential energy consumption and significantly boosts regional carbon emissions, yet they only identified the short-term carbon-promoting effect of population growth. By extending the long time-series dataset, the present study reveals that population urbanization exerts dual-sided influences on carbon emissions: in the short run, the energy consumption gap between urban and rural areas drives the growth of carbon emissions; nevertheless, sustained population agglomeration generates scale effects from public transit, centralized heating and shared infrastructure. In the subsequent stage, the popularization of low-carbon advocacy and energy-efficient household appliances, alongside the normalization of residents’ green travel, gradually unlocks emission abatement dividends from the population dimension. These finding complements and refines the complete evolutionary mechanism of population urbanization, which features carbon emission growth in the initial stage followed by emission mitigation in the long term.
Both Wang and Lu consistently verified that the rising proportion of the secondary industry exacerbates carbon emissions, whereas service sector upgrading and technological innovation constitute countervailing forces for emission mitigation. In the upper and middle reaches of the Yangtze River Economic Belt, namely Sichuan-Chongqing, Hunan and Hubei, energy-intensive riverine industries including iron and steel manufacturing and chemical production are densely agglomerated, and economic expansion thus generates rigid upward pressure on carbon emissions. By contrast, the Yangtze River Delta in the downstream region has undergone continuous industrial relocation and prioritized high-end manufacturing and service industries, yielding a steady decline in carbon intensity per unit output. Such spatial disparities across eastern and western sub-regions echo the sub-regional findings on sustainable development of the Yangtze River Delta proposed by Ma et al.
Both Zhao and Xu contended that investment in social public services, environmental governance and ecological finance can continuously ameliorate regional ecological conditions. Rooted in environmental protection regulations, low-carbon education and the equalization of urban-rural public services, social urbanization restrains industrial pollutant discharge and guides residents to adopt low-carbon behaviors. It counteracts diverse carbon-promoting factors throughout the entire research period and constitutes the sole sustainable emission-mitigating subsystem among the four urbanization dimensions. This result is highly consistent with the conclusions regarding the social subsystem documented in existing coupling-relevant literature.
Fan et al. pointed out that unregulated urban spatial expansion and infrastructure construction substantially boost carbon emissions from the construction and transportation sectors, whereas compact spatial layouts and ecological corridors deliver emission mitigation effects. A county-scale investigation conducted by Li similarly verified that land urbanization exerts a significant positive driving effect on carbon emissions and follows an inverted U-shaped evolutionary trajectory. This study further refines the unique bidirectional mechanisms prevailing in the Yangtze River Basin. On the carbon-promoting path, riverine industrial parks, cross-river expressways and port new towns continuously encroach upon cultivated land and forest land, triggering a sharp surge in fossil fuel consumption for building materials and transportation alongside massive loss of carbon sinks. On the emission-mitigating path, riverine wetlands, riverside greenbelts and intensive new town planning jointly enhance carbon sequestration capacity. The bidirectional contradictory effects of spatial urbanization are far more pronounced than those of the other three urbanization dimensions.
4.1.2. Peculiarities of Carbon-Promoting and Emission-Mitigating Dual Effects within the River Basin Economic Belt
Comparisons with Homologous Domestic Regions In terms of single urban agglomerations represented by the Yangtze River Delta Urban Agglomeration: this region boasts mature industrial systems and saturated urban spatial patterns, resulting in mild carbon growth pressure triggered by spatial expansion and alleviated contradictions between the dual carbon effects. By contrast, the upper and middle reaches of the Yangtze River Economic Belt remain in the stage of extensive outward expansion, where crude development continuously generates carbon-promoting impacts. The coexistence of high-carbon and low-carbon development modes within the basin forms differentiated dual-effect conflicts that cannot be observed in standalone urban agglomerations. From the perspective of eastern provincial administrative regions, the internal industrial and territorial spatial layouts exhibit high homogeneity, leading to balanced intensity of the game between carbon-promoting and emission-mitigating effects. The Yangtze River traverses eastern, central and western China, with intensive emission-mitigating forces dominating the downstream reaches and space expansion acting as the primary carbon-boosting driver in the middle and upper reaches. Intense disparities in the strength of internal dual-effect conflicts are formed, accompanied by prominent gradient differentiation. When compared with northern river basins, which are dominated by coal energy and suffer from scarce ecological carbon sinks, carbon losses induced by urban expansion can hardly be offset, resulting in long-term antagonism within the urban-carbon system. Benefiting from its inherent fluvial ecological endowment, the Yangtze River Economic Belt possesses stronger emission-reduction buffer capacity and achieves a faster growth rate of coupling coordination degree.
Comparisons with Foreign Major River Economic Belts. For the Rhine River Economic Belt, urbanization in developed economies has accomplished the phase of extensive spatial expansion, so spatial urbanization generates no additional carbon-promoting pressure. Its industrial system is dominated by high-end service sectors and low-carbon manufacturing, where emission-mitigating effects take the leading position without long-term dynamic trade-off processes. Such conditions differ fundamentally from the Yangtze River Economic Belt, which is still undergoing rapid urbanization. In the Mississippi River Basin, territorial land is scattered with low-density urban sprawl across the region, yet its energy mix features a high proportion of natural gas, leading to weak rigid growth in carbon emissions. By comparison, the Yangtze River Economic Belt in China boasts abundant coal reserves but suffers from insufficient oil and gas resources. Coupled with decades of continuous expansion of riverine cities and large-scale land exploitation, carbon emission pressure will persist into the future. Accordingly, the balancing process featuring mutual restriction and trade-offs between urbanization advancement and carbon abatement will last far longer.
4.2. Spatiotemporal Evolution Patterns of Coupling Coordination Degree and Driving Factors of Regional Disparities
4.2.1. Intrinsic Causes of Spatial Differentiation in Coupling Coordination: Interactive Effects of Location Endowments, Economic Foundations and Industrial Layouts
Location endowments shape factor circulation and the threshold for low-carbon development. Taking cross-border regions of Mongolia as a research case, Dong et al. illustrated that inland arid and geographically isolated locations incur high costs for factor mobility and hinder the spillover of environmental protection technologies, locking urbanization and ecosystems in a severe long-term decoupled state. Such logic of locational constraints fully fits the development realities of the upper and middle reaches of the Yangtze River. The Yangtze River Delta in the downstream region boasts riverine and coastal access as well as a hub for river-sea combined transportation, alongside prominent opening-up advantages. These strengths facilitate the continuous agglomeration of low-carbon technologies and high-end industrial factors, enabling the full exertion of emission-mitigation effects generated by urban agglomeration. Consequently, its coupling coordination level ranks first across the entire basin. This finding aligns with the research outcomes on the Yangtze River Delta Urban Agglomeration reported by Zhao and Wang, which verifies that coastal cities gain prominent locational dividends, featuring a higher weight of economic urbanization and more sufficient investment in environmental governance responses. In contrast, Yunnan, Guizhou, Sichuan and Chongqing are nestled in inland mountainous terrain with limited external transportation corridors and scarce inflows of foreign-funded low-carbon projects. Their inherent ecological vulnerability further amplifies carbon losses induced by urban expansion, forming innate bottlenecks for coupled development. Central provincial regions including Hunan, Hubei and Anhui enjoy navigable Yangtze waterways yet lag behind in receiving industrial and technological spillovers from coastal areas, forming an intermediate transitional tier that lays the spatial foundation for gradient differentiation across the whole basin.
Economic foundations determine the disparities in investment capacity for green governance. When estimating the weights of the coupling system in the Yangtze River Delta, Zhao and Wang found that economic urbanization acts as the core supporting indicator of the urbanization system. Regions with higher per capita fiscal revenue tend to allocate more funds to environmental governance and new energy infrastructure, thereby achieving a higher level of coupling coordination. Jiangsu, Zhejiang and Shanghai in the downstream reaches of the Yangtze River register remarkably higher per capita GDP and accumulated local fiscal resources. They synchronously construct sewage treatment facilities, carbon sink green spaces and wind-solar power infrastructure alongside urban development. By contrast, central and western provinces including Sichuan, Guizhou and Yunnan prioritize fiscal expenditure on transportation infrastructure and new district expansion, resulting in insufficient budget for environmental protection and emission abatement. The increased carbon emissions caused by urban expansion cannot be effectively offset, leaving these regions trapped in a low coupling coordination state over the long term. Using Shanghai as a single-city case, He et al. further verified that the weight of the ecological response subsystem rises substantially in regions with advanced economic development, which can continuously offset the carbon pressure arising from urbanization. This finding further explains the economic drivers behind the high coordination in the downstream reaches and systemic decoupling in the upper reaches of the Yangtze River.
Industrial layouts lead to distinct disparities in regional carbon constraint intensity. Based on panel data of 65 countries along the Belt and Road Initiative, Muhammad and Long confirmed that the agglomeration of energy-intensive heavy and chemical industries substantially raises carbon emissions and exacerbates the decoupling between urbanization and environmental systems. This conclusion fits well with the industrial spatial differentiation across the Yangtze River Economic Belt. The Yangtze River Delta in the downstream reaches continues to phase out high-carbon capacities such as iron and steel and chemical industries, and prioritizes the development of high-end manufacturing and producer services, resulting in a steady decline in carbon intensity per unit GDP. By comparison, the upper and middle reaches develop riverine heavy chemical industrial parks relying on local mineral and water resources and undertake the relocation of traditional high-carbon industries from eastern regions. The expansion of spatial urbanization in these areas meanwhile drives up fossil fuel consumption. Through city-level comparative analysis of the Yangtze River Delta, Zhao and Wang revealed a significant negative correlation between the degree of industrial heavyization and coupling coordination degree. This finding precisely interprets the fundamental industrial logic behind the persistently low coupling levels in the upper and middle reaches of the Yangtze River, where heavy and chemical industries are highly concentrated.
4.2.2. Discrepancies in Temporal Evolution Curves: S-shaped Pattern of Urban Agglomerations Versus Sustained Growth Trend of the Yangtze River Basin
Zhao and Wang conducted dynamic coupling estimation for 16 cities in the Yangtze River Delta over the period 1980–2013. The results indicate that the evolution of regional coupling coordination follows a full S-shaped trajectory: it rises slowly under low-level symbiosis in the early phase, undergoes accelerated adaptation in the middle phase, and sees a growth slowdown in the late phase due to the carrying capacity ceilings of land and population. He et al. adopted Shanghai, a major metropolis, as the research sample and likewise confirmed that the coupling between urbanization and ecological systems evolves through three sequential S-shaped stages: decoupling, adaptation and moderated growth. Both studies share the same underlying mechanism. Urban agglomerations feature confined geographical boundaries with rigid upper limits on the carrying capacity of built-up areas, population and industries. As the space for extensive urban expansion gradually diminishes, the momentum for improving coupling coordination fades in the later stage, and the evolutionary curve eventually levels off into a stable plateau.
In sharp contrast to the S-shaped pattern observed in the above-mentioned urban agglomerations, the coupling coordination degree of the Yangtze River Economic Belt maintained a steady upward trend from 2000 to 2021 without inflection points or stagnation. Combined with existing theories, three distinctive driving forces are summarized as follows. First, the Yangtze River stretches across the three major terrain ladders of eastern, central and western China. Vast undeveloped spaces for new urban districts and industrial parks remain available in central and western regions including Sichuan-Chongqing, Yunnan-Guizhou, Anhui and Jiangxi, resulting in no carrying capacity constraints, which differs fundamentally from the land-saturated status of the Yangtze River Delta. Second, continuous industrial gradient transfer takes place across the basin. Low-carbon technologies and service industry models originating from the downstream areas spill over to the upper reaches, continuously generating new momentum for the growth of coupling coordination and breaking the bottleneck of industrial solidification prevalent in mature urban agglomerations. Third, targeted river basin ecological policies have been increasingly strengthened. Unified emission reduction constraints across the entire region deliver long-term benefits. By comparison, studies by He and Zhao solely focused on mature urban agglomerations that lack support from cross-regional collaborative policies. Sulaman and Long conducted research across countries with different income levels and concluded that middle- and low-income regions undergoing gradient development possess long-term growth potential in coupling performance. This viewpoint is highly consistent with the developmental characteristics of the Yangtze River Basin.
4.3. Validity and Application Value of the Combined Model Integrating System Dynamics and Coupling Coordination
4.3.1. Methodological Comparison: Limitations of Single Time-Series Models and Unique Advantages of the Integrated SD-Coupling Coordination Model
Most existing studies on urbanization and carbon emissions adopt statistical models such as panel regression, BP neural networks and standalone time-series fitting for temporal analysis. In their prediction research on coupling relationships within the Yangtze River Delta, Xu Xiaoying and Chen Mi solely applied the BP neural network model. Reliant on numerical fitting based on historical data, such models only capture superficial statistical correlations between variables, while failing to depict internal causal transmission chains and dynamic feedback mechanisms within the system, which leads to notable methodological deficiencies. First, conventional time-series models operate as black-box fitting tools. They can merely output predicted values of coupling coordination degree but hardly interpret how factors including industry, energy, population and urban space interact and impose mutual bidirectional constraints. Second, these models are incapable of scenario simulation for policy intervention. They only extrapolate trends following historical development trajectories and cannot simulate abrupt systemic changes triggered by external policy shocks, such as ecological regulation, industrial relocation and the promotion of new energy sources. In contrast, system dynamics (SD) studies conducted by Lei et al. and Yang et al. have verified that the core strength of the SD model lies in its capacity to decompose the overall system into four subsystems: society, economy, energy and carbon sinks. It establishes multiple causal feedback loops and clearly identifies transmission paths among variables including population size, per capita GDP, industrial structure, energy intensity and the share of clean energy. Accordingly, the model fulfills dual functions of mechanism interpretation and scenario simulation. This study integrates the system dynamics (SD) model with the coupling coordination model to establish a complete analytical framework ranging from static spatiotemporal measurement to dynamic mechanism simulation, which effectively remedies the drawbacks of conventional single statistical models. First, the coupling coordination model quantifies provincial coupling coordination levels across years and objectively depicts the spatial differentiation of coupling status in the Yangtze River Economic Belt. Second, the causal loops of the SD model are adopted to interpret the bidirectional transmission logic of carbon promotion and mitigation driven by the four dimensions of urbanization, and distinguish the dynamic game between short-term antagonism and long-term synergy. This framework is highly consistent with the modeling concept of the multi-loop system covering society, economy, energy and carbon emissions proposed by Yang et al. In their nationwide SD simulation for carbon neutrality, Lei et al. pointed out that the STIRPAT model can only statically identify elasticity coefficients and fails to reflect year-by-year dynamic feedback among variables, whereas the SD model is capable of capturing the interactive changes of factors over long cycles. This conclusion provides direct theoretical support for the methodological innovation of the hybrid model adopted in this research. Compared with predictions relying merely on the BP neural network, the integrated coupling-SD framework retains the strengths of the entropy method and coupling model in objectively measuring spatiotemporal patterns. Meanwhile, it unpacks the internal black box of the system via SD, thereby realizing the integration of pattern characterization, mechanism decomposition and policy simulation.
4.3.2. Rationality of Model Parameters and Scenario Assumptions
In their national energy-carbon emission system dynamics (SD) model, Yang et al. assigned segmented values to parameters including population growth rate, growth rates of three industries, coal consumption growth rate and carbon sink conversion coefficients based on national statistical yearbooks and energy plans. They conducted error verification via historical data backcasting, with simulation errors controlled within 5%. This parameter calibration approach is fully adopted in the present study. The weights of the urbanization subsystem in this research follow the indicator weighting logic of the entropy method proposed by Xu and Chen, covering the dimensions of innovation, coordination, green development and sharing. Emission coefficients related to carbon emissions, as well as conversion coefficients for carbon sinks of cultivated land, forest land and wetlands, strictly comply with the calculation criteria of Lei et al. and align with the IPCC guidelines for carbon emission accounting. All historical parameters are fitted using statistical data of provinces and cities along the Yangtze River from 2000 to 2021 to complete historical simulation validation. Accordingly, the reliability of parameters is jointly supported by published literature and empirical data.
Lei et al. established three phased scenarios including carbon peaking, accelerated emission reduction and carbon neutrality, while Yang et al. designed five simulation scenarios: baseline, technological innovation, infrastructure development, residential behavior and comprehensive regulation. Drawing on their phased classification framework and tailored policies for the Yangtze River Economic Belt, this study formulates three scenarios, namely the baseline scenario, green transition scenario and strict ecological regulation scenario. The baseline scenario maintains the historical trends of industrial development, energy consumption and urban expansion observed from 2000 to 2021. The green transition scenario complies with the mandatory targets for declining energy consumption per unit GDP and rising share of non-fossil energy stipulated in the 14th Five-Year Plan. The strict regulation scenario incorporates special policies concerning the phase-out of energy-intensive industries along the river basin, river basin ecological compensation and construction of clean energy bases. The growth rate of industries, reduction scale of coal consumption and expansion scale of wind and solar energy under the three scenarios are all derived from quantitative targets in the national 14th Five-Year Plan and corresponding plans of the eleven provincial-level regions along the Yangtze River. This method avoids the drawback of subjective parameter setting adopted in some previous studies, enabling simulation results to better reflect the actual low-carbon development of river basins in China and rendering the predictions practically supportive for policy formulation.
4.3.3. Promotion and Application Value of the Integrated SD-Coupling Coordination Model Across Regions
Existing studies on coupling relationships in the Yellow River Basin and Beijing-Tianjin-Hebei Urban Agglomeration generally focus on describing static spatial patterns while lacking dynamic mechanism simulation. This model can construct causal loops adapted to the coal-dominated energy structure and characteristics of resource-based cities in northern China, and quantify the convergence effect of the transformation of energy-intensive industries on coupling coordination.
Current domestic research often separates spatial pattern measurement from dynamic prediction methods, focusing merely on spatiotemporal analysis of coupling relationships or conducting standalone carbon emission simulation. This study integrates the two types of models to establish a standardized analytical framework. The complete workflow proceeds sequentially: applying the entropy method to comprehensively evaluate two major subsystems, adopting coupling coordination and spatial analysis to characterize spatiotemporal differentiation, and constructing causal loops via system dynamics (SD) to carry out multi-scenario prediction. The whole procedure is standardized and reproducible. It can provide a unified and normative technical paradigm for subsequent research on the coupling between urbanization and carbon emissions at provincial, urban agglomeration and river basin scales, and effectively address the fragmentation and simplification of methodologies in existing literature.
4.4. Multidimensional Research Expansion and Prospects for Further Studies
Based on the findings of this study, future research can be further advanced from multiple perspectives, including improving the indicator system, refining spatial scales, expanding research areas and optimizing the system dynamics model.
Future research can fully incorporate quantitative indicators related to carbon sinks, such as land carbon sequestration, carbon capture and carbon storage. This will further improve the comprehensive evaluation framework for the two subsystems of urbanization and carbon emissions and enrich indicator dimensions. Supported by a more complete indicator system, in-depth quantitative analysis can be conducted on the evolutionary rules of coupling coordination between the two systems.
In terms of spatial scales, on the basis of provincial macroscopic analysis, subsequent research can be extended to smaller research units such as prefecture-level and county-level administrative regions. It can conduct refined measurement and trend prediction of coupling coordination, explore differentiated internal mechanisms within regions, and formulate more targeted and implementable zonal development policies. In terms of research scope, the analysis can go beyond the single case of the Yangtze River Economic Belt and include all provincial-level regions nationwide as samples for cross-regional comparative studies. This helps summarize the general patterns and heterogeneous characteristics of the coupled evolution between urbanization and carbon emissions under different territorial spatial layouts.
For the optimization of the system dynamics model, researchers can first expand model variables and extend system boundaries to better conform to the actual operational logic of economic, energy and urban development, so as to improve simulation accuracy. Furthermore, differentiated policy scenarios can be established for each province and city. The model can quantitatively assess how changes in industrial, energy and urban factors affect coupling coordination levels across regions, and provide targeted policy suggestions accordingly. This will enhance the model’s capacity to support decision-making for regional low-carbon development.
5. Conclusions
Taking 11 provincial-level administrative regions within the Yangtze River Economic Belt as research samples, this paper establishes a comprehensive evaluation index system for multi-dimensional urbanization and carbon emissions. Based on the coupling coordination degree model and system dynamics model, this study systematically investigates the spatiotemporal characteristics of the coupling and coordinated development between urbanization and carbon emissions during 2000–2021, and further predicts its evolutionary trends from 2022 to 2032. The primary findings of this study are summarized as follows:
Urbanization and carbon emissions exhibit distinct differentiated evolutionary trends. From 2000 to 2021, the overall urbanization level of the Yangtze River Economic Belt presented a fluctuating upward trajectory, with four subsystems—population, economy, society, and space—achieving coordinated progressive development. Among these subsystems, spatial urbanization occupied the dominant weight position and constituted the core pillar supporting regional urbanization development. In contrast, the comprehensive carbon emission index grew at a relatively moderate pace, accompanied by pronounced regional heterogeneity across the study area. Notably, the population-related carbon emission index has witnessed an ameliorating trend since 2012, indicating that low-carbon transformation has achieved preliminary effectiveness at the population dimension.
The overall coupling coordination degree demonstrates a fluctuating upward trend, alongside a progressively converging spatial pattern. Spatially, the traditional ladder-like developmental hierarchy of “eastern region > central region > western region” has been gradually broken. Driven by the robust growth in central and western areas, the long-standing regional developmental imbalance has been steadily ameliorated. Shanghai consistently maintains a leading level throughout the study period, with its 2021 coupling coordination degree scoring 0.806, which places the city in the favorable coordination stage. Despite the relatively weak developmental foundations of western provincial regions including Guizhou and Yunnan, these areas exhibit prominent growth potential, contributing to the continuous narrowing of regional disparities across the study area.
The coupling and coordinated development of the research system presents a promising future prospect. System dynamics model predictions reveal that the provincial coupling coordination degree within the Yangtze River Economic Belt will maintain a continuous upward trend from 2022 to 2032, accompanied by a further reduction in regional disparities. By 2032, all provincial-level administrative regions in the Belt will accomplish an upgrade in their coupling coordination levels. Specifically, Shanghai’s coupling coordination degree is projected to reach 0.954, while Zhejiang Province will attain a value of 0.900. Central provinces including Anhui and Jiangxi, as well as western regions such as Chongqing and Sichuan, will gradually step into the favorable coordination stage. Ultimately, the majority of provincial-level administrative regions are expected to achieve favorable coordination or even higher levels, essentially forming a sound pattern of regional coordinated development across the Yangtze River Economic Belt.
On the basis of the research conclusions, this study formulates relevant policy suggestions to drive the low-carbon urbanization transition and balanced regional development across the Yangtze River Economic Belt, so as to underpin the attainment of China’s carbon peaking and carbon neutrality goals.
Strengthen support for less urbanized regions and advance urbanization in light of local conditions. To tackle uneven urbanization across provinces, scale up investment in infrastructure and upgrade public facilities covering transport, water and power supply. optimize urban planning and land use, rationalize spatial layout and prevent excessive urban sprawl. improve public services including education and healthcare to elevate residents’ living standards and sense of happiness.
Strengthen interregional cooperation to promote coordinated regional development. First, deepen cooperation and exchanges among eastern, central and western China by tightening economic links and advancing resource sharing and economic collaboration. Second, press ahead with industrial restructuring and optimization tailored to each region’s industrial features and strengths. promote the orderly flow of production factors, encourage the transfer of competitive industries and technologies to less developed areas, boost local development potential, and realize complementary advantages and coordinated growth. Finally, establish and improve intergovernmental cooperation mechanisms, strengthen policy coordination and communication, and jointly formulate development plans, policies and measures to further advance regional coordinated development.
Strengthen carbon emission supervision and assessment to advance low-carbon economic transformation. First, enhance energy management. Promote the development and utilization of green energy, improve energy efficiency, lower carbon emission intensity, and disseminate cleaner production technologies, this will gradually reduce dependence on traditional high-carbon energy sources such as coal and foster low-carbon development. Second, boost technological innovation and industrial upgrading, reduce dependence on high-carbon sectors and optimize the industrial structure. shift away from the high-carbon development model, curb carbon emissions and raise industrial added value. Finally, tighten carbon emission regulation. Establish a carbon emissions trading system to steer adjustments to industrial structure and energy consumption, so as to effectively control carbon emissions.
Author Contributions
Conceptualization, H.W. and D.F.; methodology, H.W., W.X. and Y.Z.; software, H.W., W.X. and Y.Z.; validation, H.W., D.F. and Y.Z.; formal analysis, H.W. and D.F.; investigation, H.W., W.X. and Y.Z.; resources, H.W. and D.F.; data curation, H.W., W.X. and Y.Z.; writing—original draft preparation, W.X. and Y.Z.; writing—review and editing, H.W. and D.F.; visualization, H.W. and Y.Z.; supervision, H.W.; project administration, H.W. and D.F.; funding acquisition, H.W. and D.F. All authors have read and agreed to the published version of the manuscript.
Funding
Humanities and Social Science Fund of Ministry of Education of China (grant number 22YJA630096).
Data Availability Statement
The raw data supporting the conclusions of this article will be made available by the authors on request.
Acknowledgments
The authors wish to express heartfelt gratitude to the anonymous reviewers and the editors of this article for their invaluable comments.
Conflicts of Interest
The authors declare no conflicts of interest.
References
- Zhao, L.; Fang, C. Distribution Dynamics and Driving Mechanism of China’s Provincial New Urbanization Development Level[J]. J. Quant. Technol. Econ. (In Chinese) 2019, 36(5), 44–64. [Google Scholar] [CrossRef]
- Ma, Y. M.; Wu, Y. M.; Wu, B. J. Comprehensive Evaluation of Sustainable Urban Development of Yangtze River Delta Based on Entropy Method and Quadrant Method[J]. Econ. Geogr. (In Chinese) 2015, 35(6), 47–53. [Google Scholar] [CrossRef]
- Fan, Q. F.; Wang, J. C.; Wang, J. Emission reduction effect of urban spatial structure evolution: Internal mechanism and China’s experience[J]. Urban Probl. (In Chinese) 2021, (12), 87–96. [Google Scholar] [CrossRef]
- Wang, F.; Qin, Y. H.; Liu, J. A study on the influencing factors of carbon emissions from the perspective of multi-dimensional urbanization[J]. China Popul. Resour. Environ. (In Chinese) 2017, 27(9), 151–161. [Google Scholar] [CrossRef]
- OUYANG, X.; LIN, B. Carbon dioxide (CO₂) emissions during urbanization: A comparative study between China and Japan [J]. J. Clean. Prod. 2017, 143, 356–368. [Google Scholar] [CrossRef]
- SUN, W.; HUANG, C. How does urbanization affect carbon emission efficiency? Evidence from China [J]. J. Clean. Prod. 2020, 272. [Google Scholar] [CrossRef]
- Zhang, R. Q.; Li, P. H.; Xu, L. P. Effects of urbanization on carbon emission from land use in Xinjiang and their coupling relationship. Acta Ecol. Sin. (In Chinese) 2022, 42(13), 5226–5242. [Google Scholar] [CrossRef]
- Li, J. B.; Huang, X. J.; Chuai, X. W. Spatial-temporal Pattern and Influencing Factors of Coupling Coordination Degree Between Urbanization of Population and CO2 Emissions of Energy Consumption in Jiangsu Province [J]. Econ. Geogr. (In Chinese) 2021, 41(5), 57–64. [Google Scholar] [CrossRef]
- Lu, J. Decomposition of regional differences and analysis of driving factors in China’s new urbanization development[J]. Stat. Decis. (In Chinese) 2022, 38(9), 79–83. [Google Scholar] [CrossRef]
- Han, Z.H.E.N.G.; Lihong, G.U.O. External effects of low-carbon city pilot on carbon emissions of adjacent non-pilot cities [J]. China Popul. Resour. Environ. (In Chinese) 2022, 32(7), 71–80. [Google Scholar] [CrossRef]
- SONG, Q.; ZHOU, N.; LIU, T.; et al. Investigation of a “coupling model” of coordination between low-carbon development and urbanization in China [J]. Energy Policy 2018, 121, 346–354. [Google Scholar] [CrossRef]
- WANG, Z.; CUI, C.; PENG, S. How do urbanization and consumption patterns affect carbon emissions in China? A decomposition analysis [J]. J. Clean. Prod. 2019, 211, 1201–1208. [Google Scholar] [CrossRef]
- XU, Q.; DONG, Y.-X.; YANG, R. Urbanization impact on carbon emissions in the Pearl River Delta region: Kuznets curve relationships [J]. J. Clean. Prod. 2018, 180, 514–523. [Google Scholar] [CrossRef]
- MUHAMMAD, S.; LONG, X.; SALMAN, M.; et al. Effect of urbanization and international trade on CO2 emissions across 65 belt and road initiative countries [J]. Energy 2020, 196. [Google Scholar] [CrossRef]
- DONG, S.; ZHENG, J.; LI, Y.; et al. Quantitative Analysis of the Coupling Coordination Degree Between Urbanization and Eco-environment in Mongolia [J]. Chin. Geogr. Sci. 2019, 29(5), 861–871. [Google Scholar] [CrossRef]
- ZHAO, Y.; WANG, S.; ZHOU, C. Understanding the relation between urbanization and the eco- environment in China’s Yangtze River Delta using an improved EKC model and coupling analysis [J]. Sci. Total Environ. 2016, 571, 862–875. [Google Scholar] [CrossRef] [PubMed]
- HE, J.; WANG, S.; LIU, Y.; et al. Examining the relationship between urbanization and the eco- environment using a coupling analysis: Case study of Shanghai, China [J]. Ecol. Indic. 2017, 77, 185–193. [Google Scholar] [CrossRef]
- Xu, X. Y.; Chen, M. Coupled Coordination and Spatial Association of Resource & Environment and High-quality Development: Analysis Based on the Data in the Yangtze River Delta Urban Agglomeration[J]. J. South-Cent. Minzu Univ. (Humanities and Social Sciences) (In Chinese) 2023, 43(9), 137–147+187. [Google Scholar] [CrossRef]
- WEN, L.; ZHANG, J.; SONG, Q. Q. A scenario analysis of Chinese carbon neutral based on STIRPAT and system dynamics model [J]. Environ. Sci. Pollut. Res. 2022, 29(36), 55105–55130. [Google Scholar] [CrossRef] [PubMed]
- YANG, H. H.; LI, X.; MA, L. W.; et al. Using system dynamics to analyse key factors influencing China’s energy-related CO2 emissions and emission reduction scenarios [J]. J. Clean. Prod. 2021, 320, 16. [Google Scholar] [CrossRef]
- GU, C.; YE, X.; CAO, Q.; et al. System dynamics modelling of urbanization under energy constraints in China [J]. Sci. Rep. 2020, 10(1). [Google Scholar] [CrossRef] [PubMed]
- Qian, Z. Q.; Han, J. Y. Coupling Process and Mechanism of New-type Urbanization and Low-carbon Development in Yangtze River Delta Urban Agglomeration[J]. Resour. Environ. Yangtze Basin (In Chinese) 2023, 32(11), 2285–2297. [Google Scholar] [CrossRef]
- XIAO, Y.; ZHONG, J.-L.; ZHANG, Q.-F.; et al. Exploring the coupling coordination and key factors between urbanization and land use efficiency in ecologically sensitive areas: A case study of the Loess Plateau, China [J]. Sustain. Cities Soc. 2022, 86, 104148. [Google Scholar] [CrossRef]
- SHEN, L.; HUANG, Y.; HUANG, Z.; et al. Improved coupling analysis on the coordination between socio-economy and carbon emission [J]. Ecol. Indic. 2018, 94, 357–366. [Google Scholar] [CrossRef]
- Jiang, J. K.; Zhu, S. L.; Cao, J. C.; et al. Analysis of Coupling Coordination between New Urbanization and Carbon Emission Level: A Case Study of Shandong Province[J]. Ecol. Econ. (In Chinese) 2023, 39(3), 76–82. [Google Scholar]
- Wang, Y. J.; Jiang, C. T.; Jiang, C. L. Can New-type Urbanization and Low-carbon Economy Be Pushed Coordinately? Empirical Research Based on 284 Prefecture-level Cities[J]. Financ. Trade Res. (In Chinese) 2021, 32(9), 32–46. [Google Scholar] [CrossRef]
- JIANG, J.; ZHU, S.; WANG, W.; et al. Coupling coordination between new urbanisation and carbon emissions in China [J]. Sci. Total Environ. 2022, 850. [Google Scholar] [CrossRef] [PubMed]
- HE, J.; WANG, S.; LIU, Y.; et al. Examining the relationship between urbanization and the eco- environment using a coupling analysis: Case study of Shanghai, China [J]. Ecol. Indic. 2017, 77, 185–193. [Google Scholar] [CrossRef]
- LI, D.; CAO, L.; ZHOU, Z.; et al. Coupling coordination degree and driving factors of new-type urbanization and low-carbon development in the Yangtze River Delta: Based on nighttime light data [J]. Environ. Sci. Pollut. Res. 2022, 29(54), 81636–81657. [Google Scholar] [CrossRef] [PubMed]
- ZHANG, Z.; LI, Y. Coupling coordination and spatiotemporal dynamic evolution between urbanization and geological hazards–A case study from China [J]. Sci. Total Environ. 2020, 728, 138825. [Google Scholar] [CrossRef] [PubMed]
- ZHENG, J.; HU, Y.; BOLDANOV, T.; et al. Comprehensive assessment of the coupling coordination degree between urbanization and ecological environment in the Siberian and Far East Federal Districts, Russia from 2005 to 2017 [J]. PeerJ 2020, 8, e9125. [Google Scholar] [CrossRef] [PubMed]
- DING, T.; CHEN, J.; FANG, Z.; et al. Assessment of coordinative relationship between comprehensive ecosystem service and urbanization: A case study of Yangtze River Delta urban Agglomerations, China [J]. Ecol. Indic. 2021, 133, 108454. [Google Scholar] [CrossRef]
- MA, S.; LI, Z.; LI, L.; et al. Coupling coordination degree spatiotemporal characteristics and driving factors between new urbanization and construction industry: evidence from China [J]. In Engineering Construction and Architectural Management; 2022. [Google Scholar]
- HAN, B.; MA, Z.; WU, M.; et al. Simulation research on the coordinated development path of urbanization and real estate market using system dynamics in Chongqing City, Southwest China [J]. Ecol. Indic. 2022, 143. [Google Scholar] [CrossRef]
- LIAO, S.; WU, Y.; WONG, S. W.; et al. Provincial perspective analysis on the coordination between urbanization growth and resource environment carrying capacity (RECC) in China [J]. Sci. Total Environ. 2020, 730, 138964. [Google Scholar] [CrossRef] [PubMed]
- Zheng, Q. Impact of scientific and technological innovation on new-type urbanization: An empirical analysis based on panel threshold model[J]. Urban Probl. (In Chinese) 2017, (6), 25–35. [Google Scholar] [CrossRef]
- Qin, Z. W.; Nie, X. Q. Spatial and Temporal Evolution and Drivers of Coordinated Development of Urbanization Efficiency and Water Resources Efficiency in the Yangtze River Economic Belt[J]. Resour. Environ. Yangtze Basin (In Chinese) 2023, 32(11), 2237–2253. [Google Scholar] [CrossRef]
- Zhang, X. R.; Wang, Z. B. Comprehensive Evaluation of Regional Urbanization Differences Based on PP-DEA Model[J]. China Popul. Resour. Environ. (In Chinese) 2012, 22(2), 130–135. [Google Scholar] [CrossRef]
- Zhu, Z. C.; Liu, B.; He, J. Measurement and Analysis of Coordinated Development of Rural Revitalization, New Urbanization and Ecological Environment in China[J]. Inq. Into Econ. Issues (In Chinese) 2022, (7), 13–28. [Google Scholar]
- Geng, N. N.; Shao, X. Y. Research on Coupling Coordination of Ecological Environment-Tourism Industry-Urbanization in the Yellow River Basin[J]. Econ. Probl. (In Chinese) 2022, (3), 13–19. [Google Scholar] [CrossRef]
- Mei, Gai; Fuxiang, Zhang. Regional Carbon Emissions, Eco-nomic Development and Environmental Protection Coupling in Liaoning Province. Sci. Geogr. Sin. (In Chinese) 2018, 38(5), 764–772. [Google Scholar] [CrossRef]
- ZHANG, Y.; LI, Y.; WEI, Y. Understanding the relation between the socio-economic development and CO₂ emission of 76 contracting countries in The Paris Agreement [J]. Environ. Dev. Sustain. 2023, 25(12), 14131–14153. [Google Scholar]
- Tan, Y. X.; Li, X. S.; Yu, J. Research on the Coupling Coordination Effect and Driving Factors of Technology Diffusion, Market, Environment Multiple System for Renewable Energy[J]. Nanjing J. Soc. Sci. (In Chinese) 2023, (9), 30–40+50. [Google Scholar] [CrossRef]
- Qiu, G. H.; Ding, M. G. Low-Carbon Development Level Evaluation under the Scope of Ecological Civilization: A Case of Sichuan Province [J]. Ecol. Econ. (In Chinese) 2016, 32(11), 204–209. [Google Scholar]
- Liao, C. B. QUANTITAITVE JUDGEMENT AND CLASSIFICATION SYSTEM FOR COORDINATED DEVELOPMENT OF ENVIRONMENT AMD ECONOMY———A Case Study of the City Group in the Pearl River Delta[J]. Trop. Geogr. (In Chinese) 1999, (2), 76–82. [Google Scholar] [CrossRef]
- Wang, Y.; Sun, R. X. Impact of land use change on coupling coordination degree of regional water-energy-food system: A case study of Beijing-Tianjin-Hebei Urban Agglomeration[J]. J. Nat. Resour. (In Chinese) 2022, 37(3), 582–599. [Google Scholar] [CrossRef]
Figure 1.
Total Provincial Carbon Emissions in the Yangtze River Economic Belt.
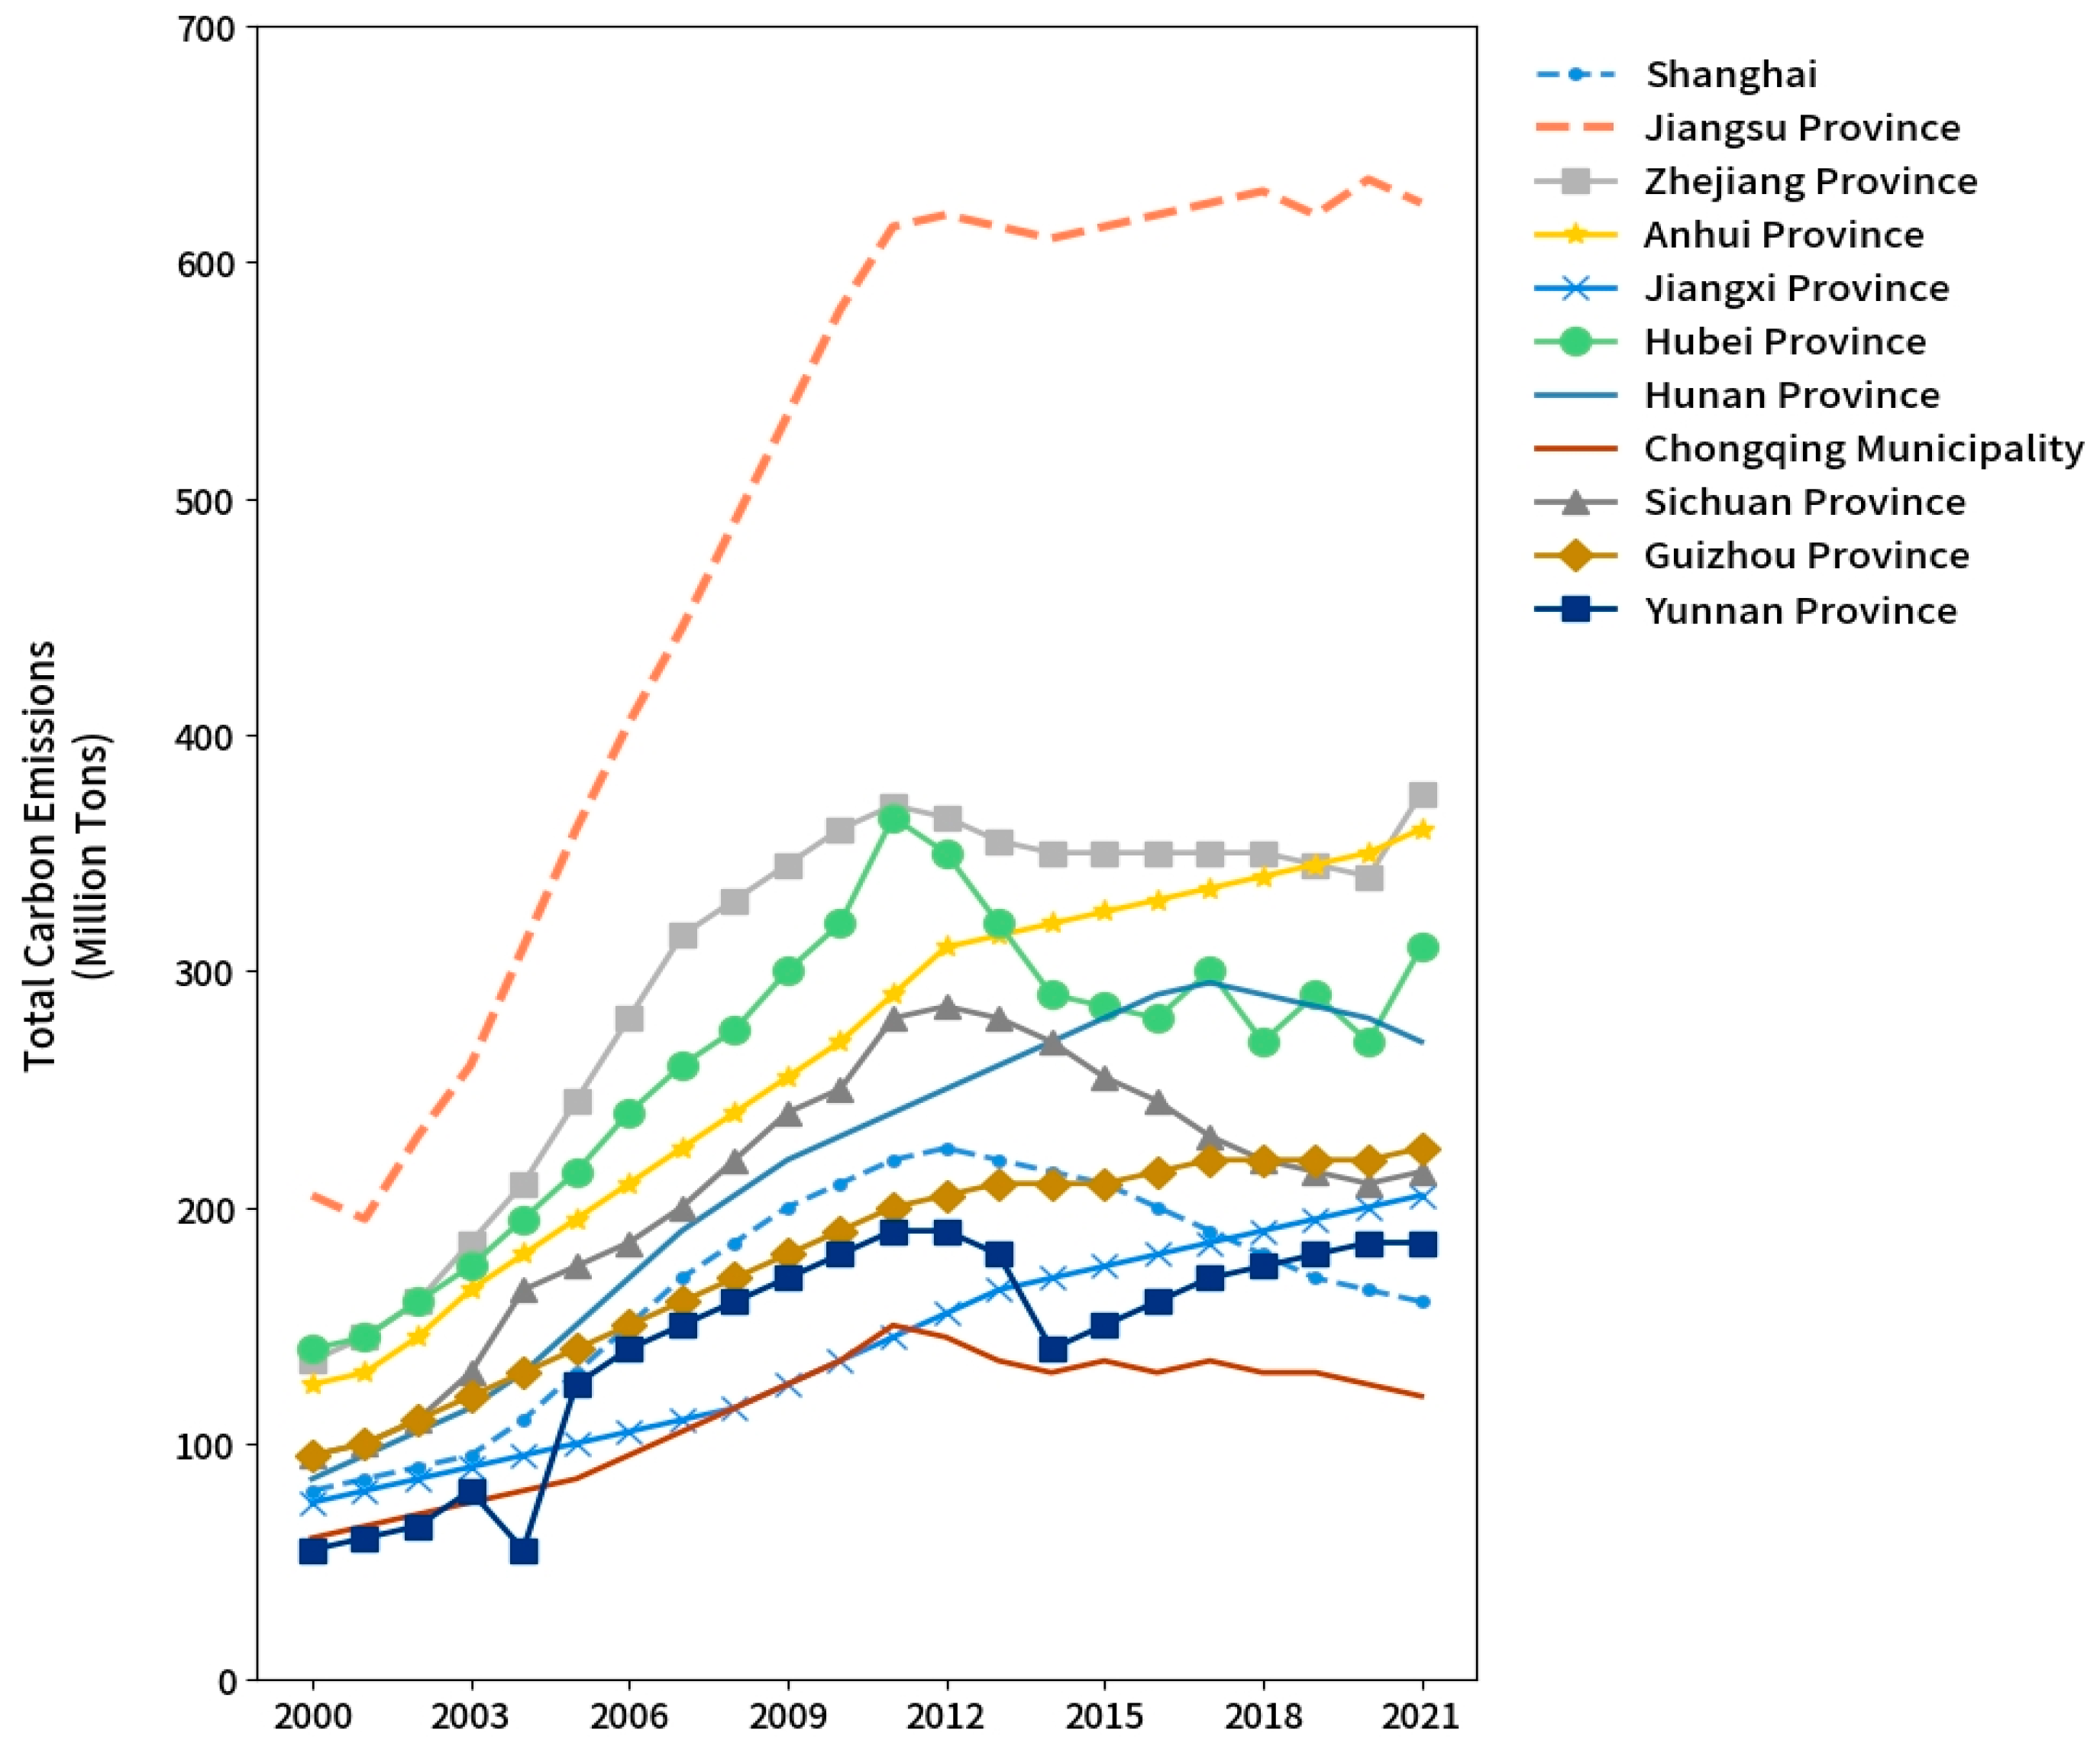
Figure 2.
Causal Loop Diagram of the System Dynamics Model for Urbanization and Carbon Emissions.
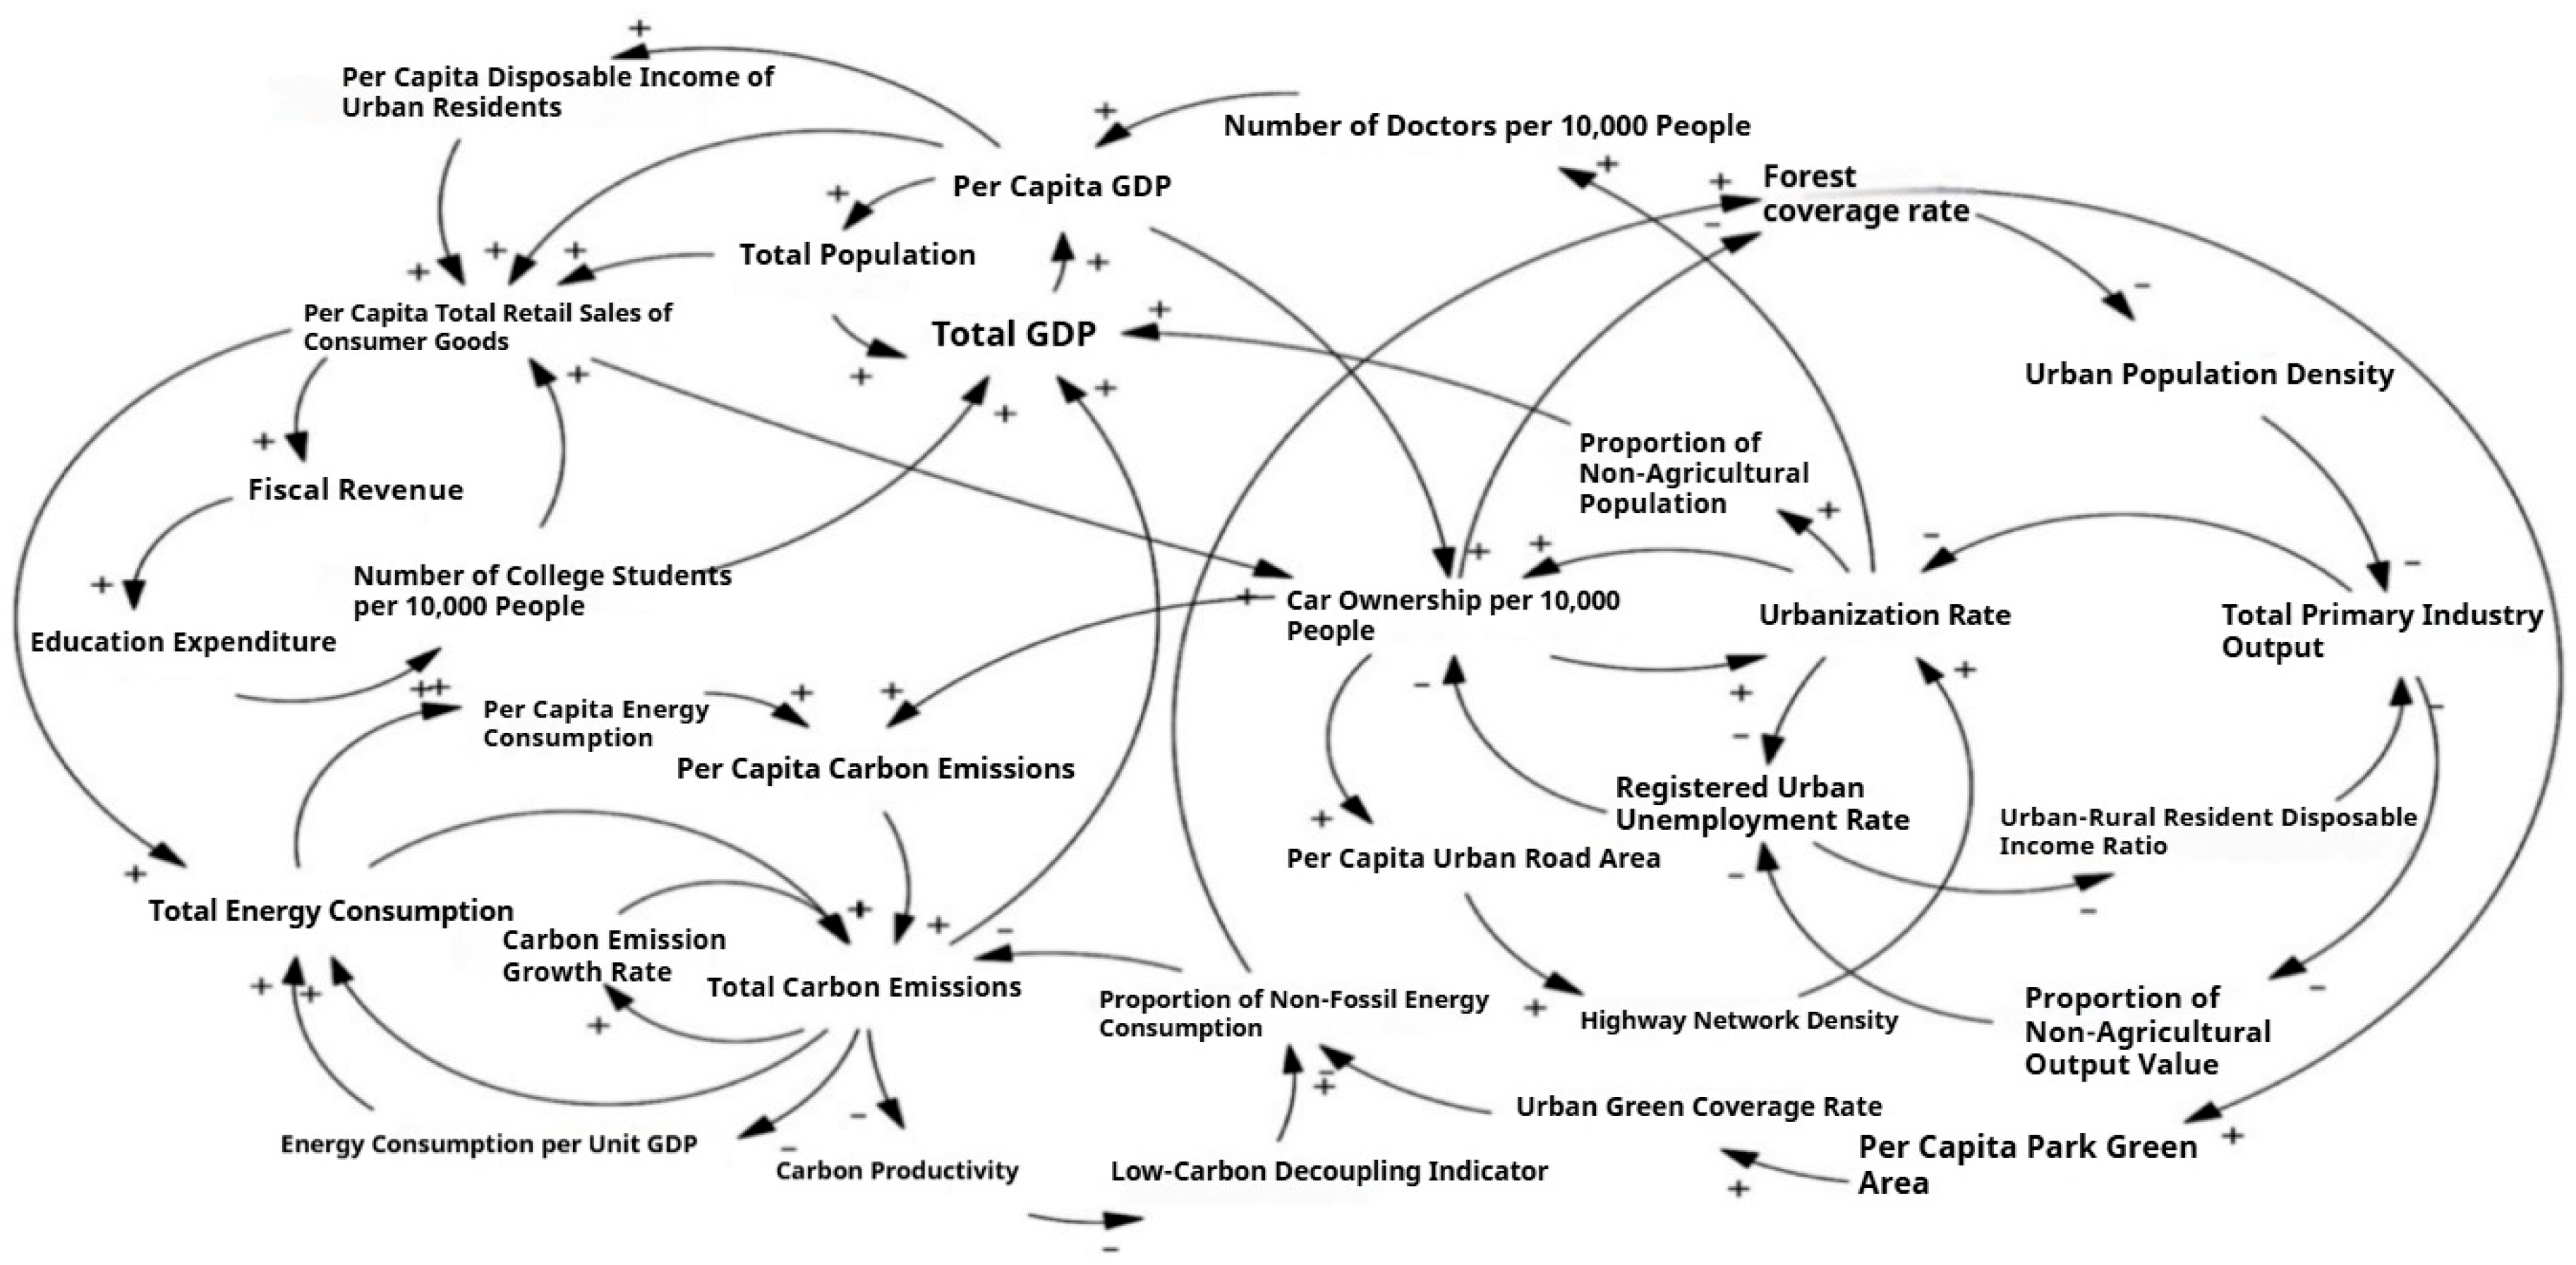
Figure 3.
Stock-Flow Diagram of Urbanization and Carbon Emissions in Zhejiang Province.
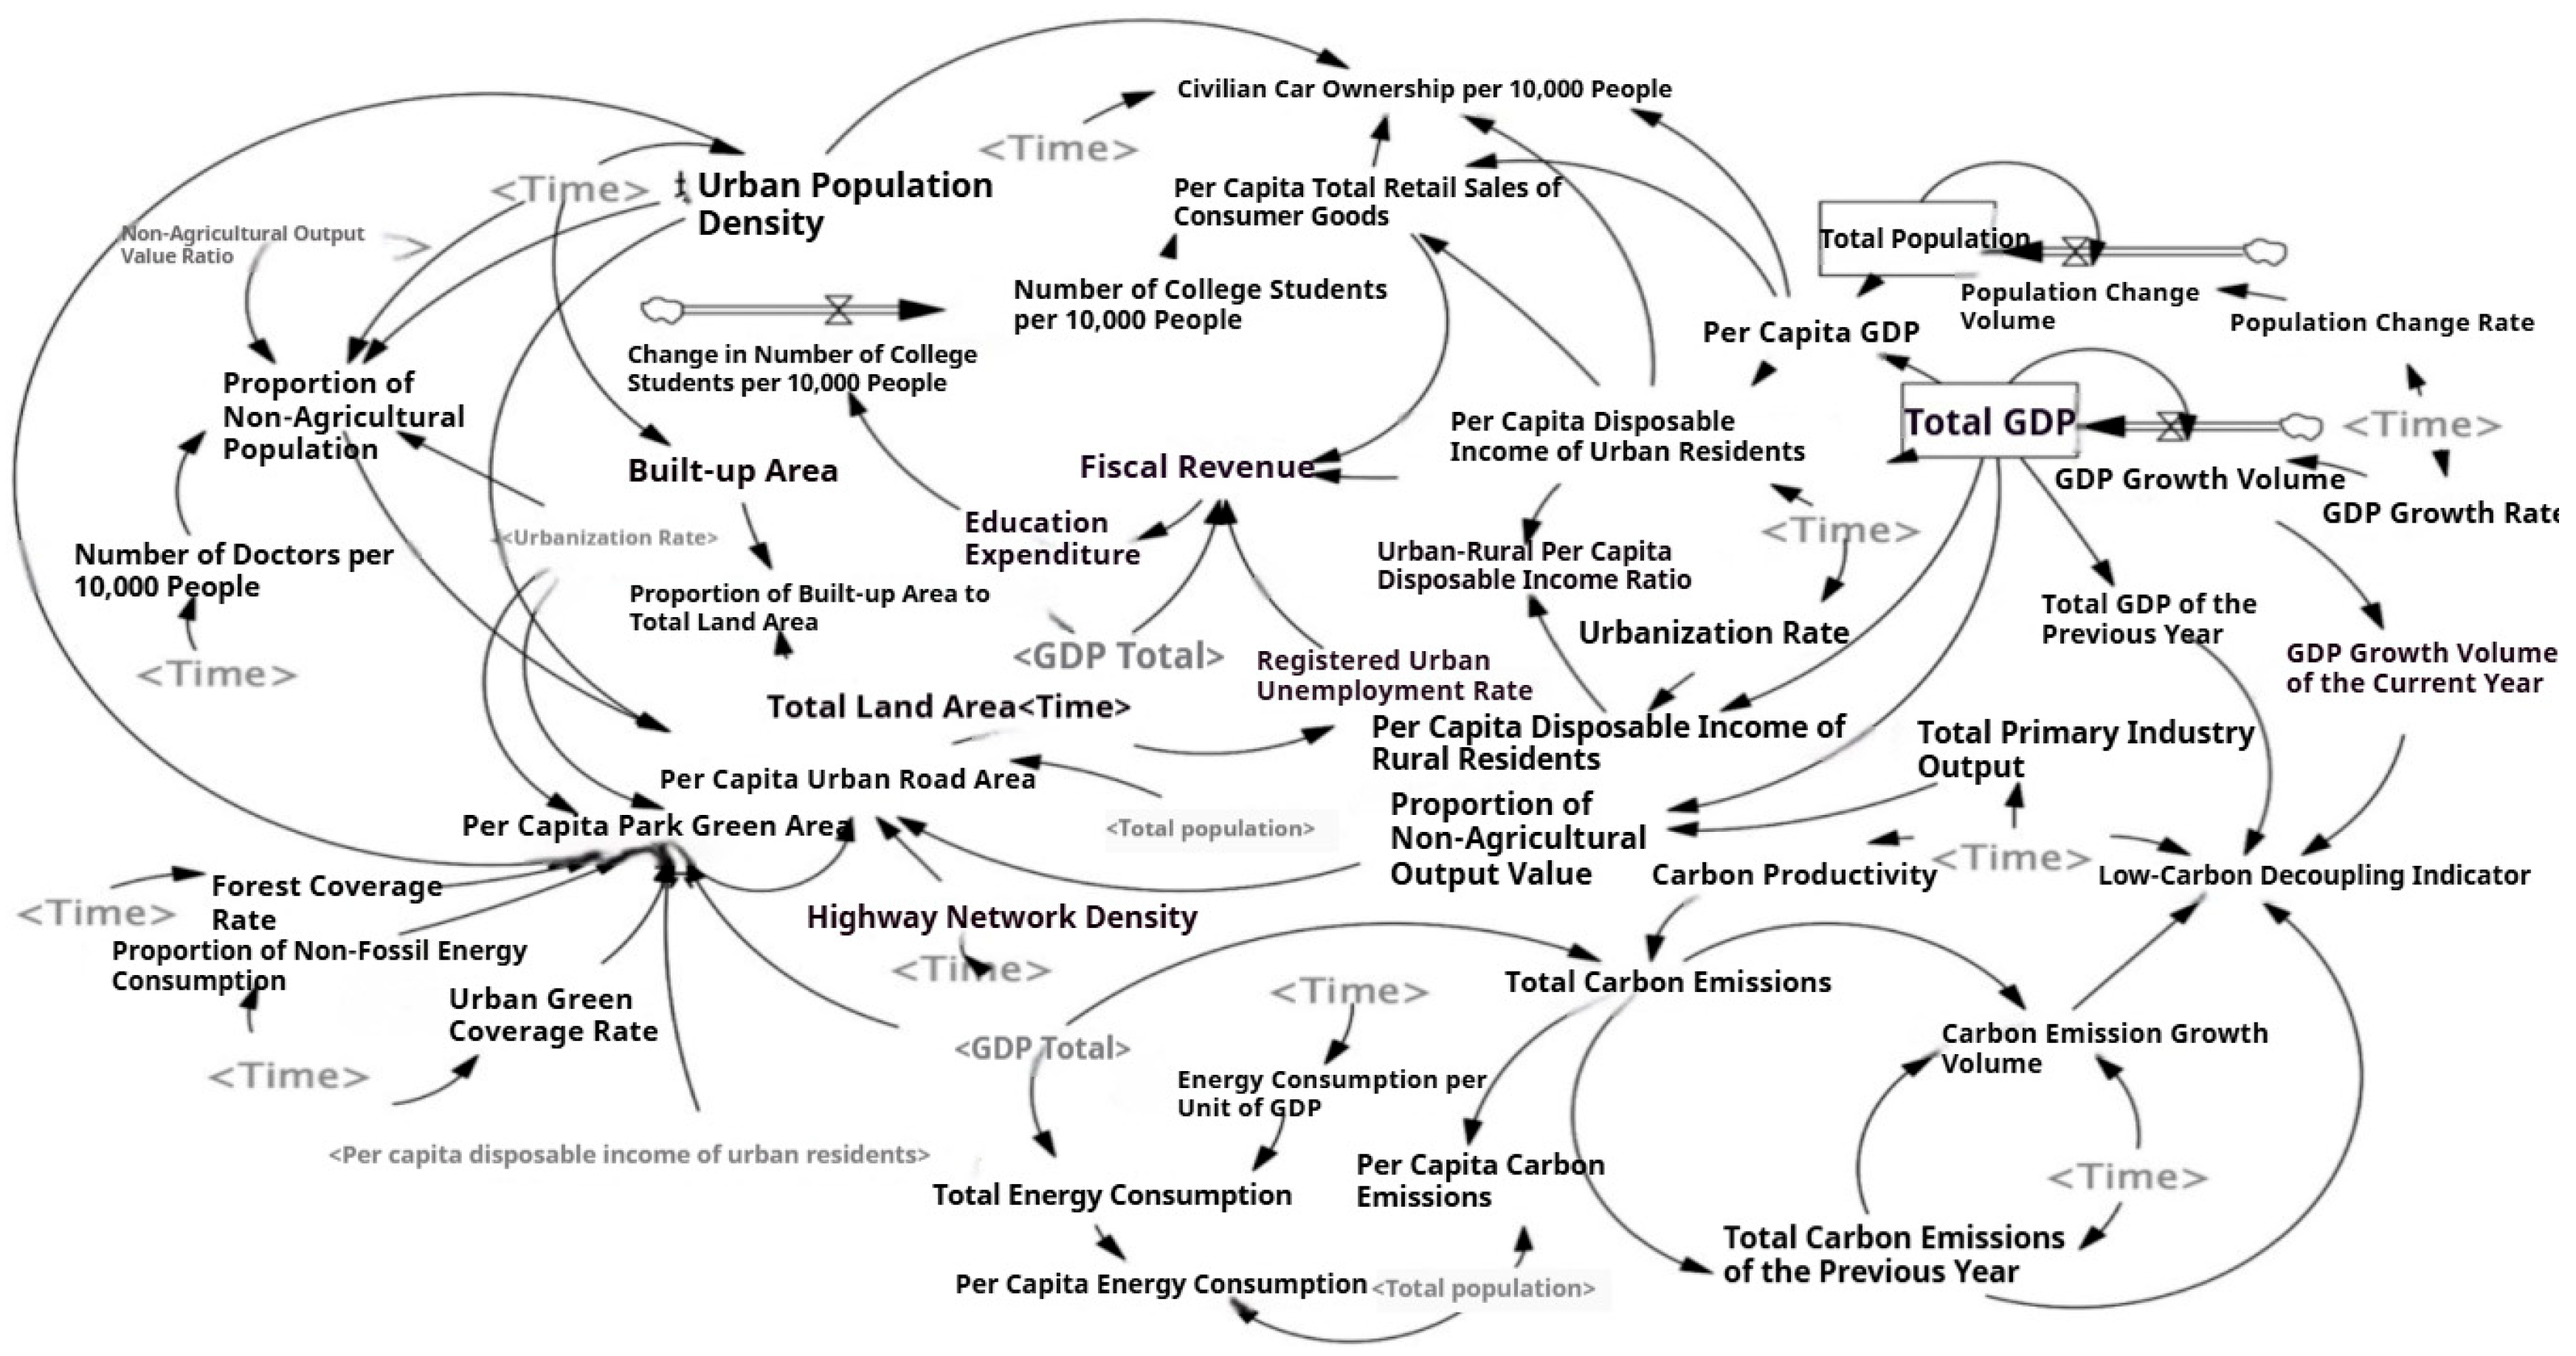
Figure 4.
Spatiotemporal Evolution of Provincial Coupling Coordination Degree in the Yangtze River Economic Belt.
Figure 4.
Spatiotemporal Evolution of Provincial Coupling Coordination Degree in the Yangtze River Economic Belt.
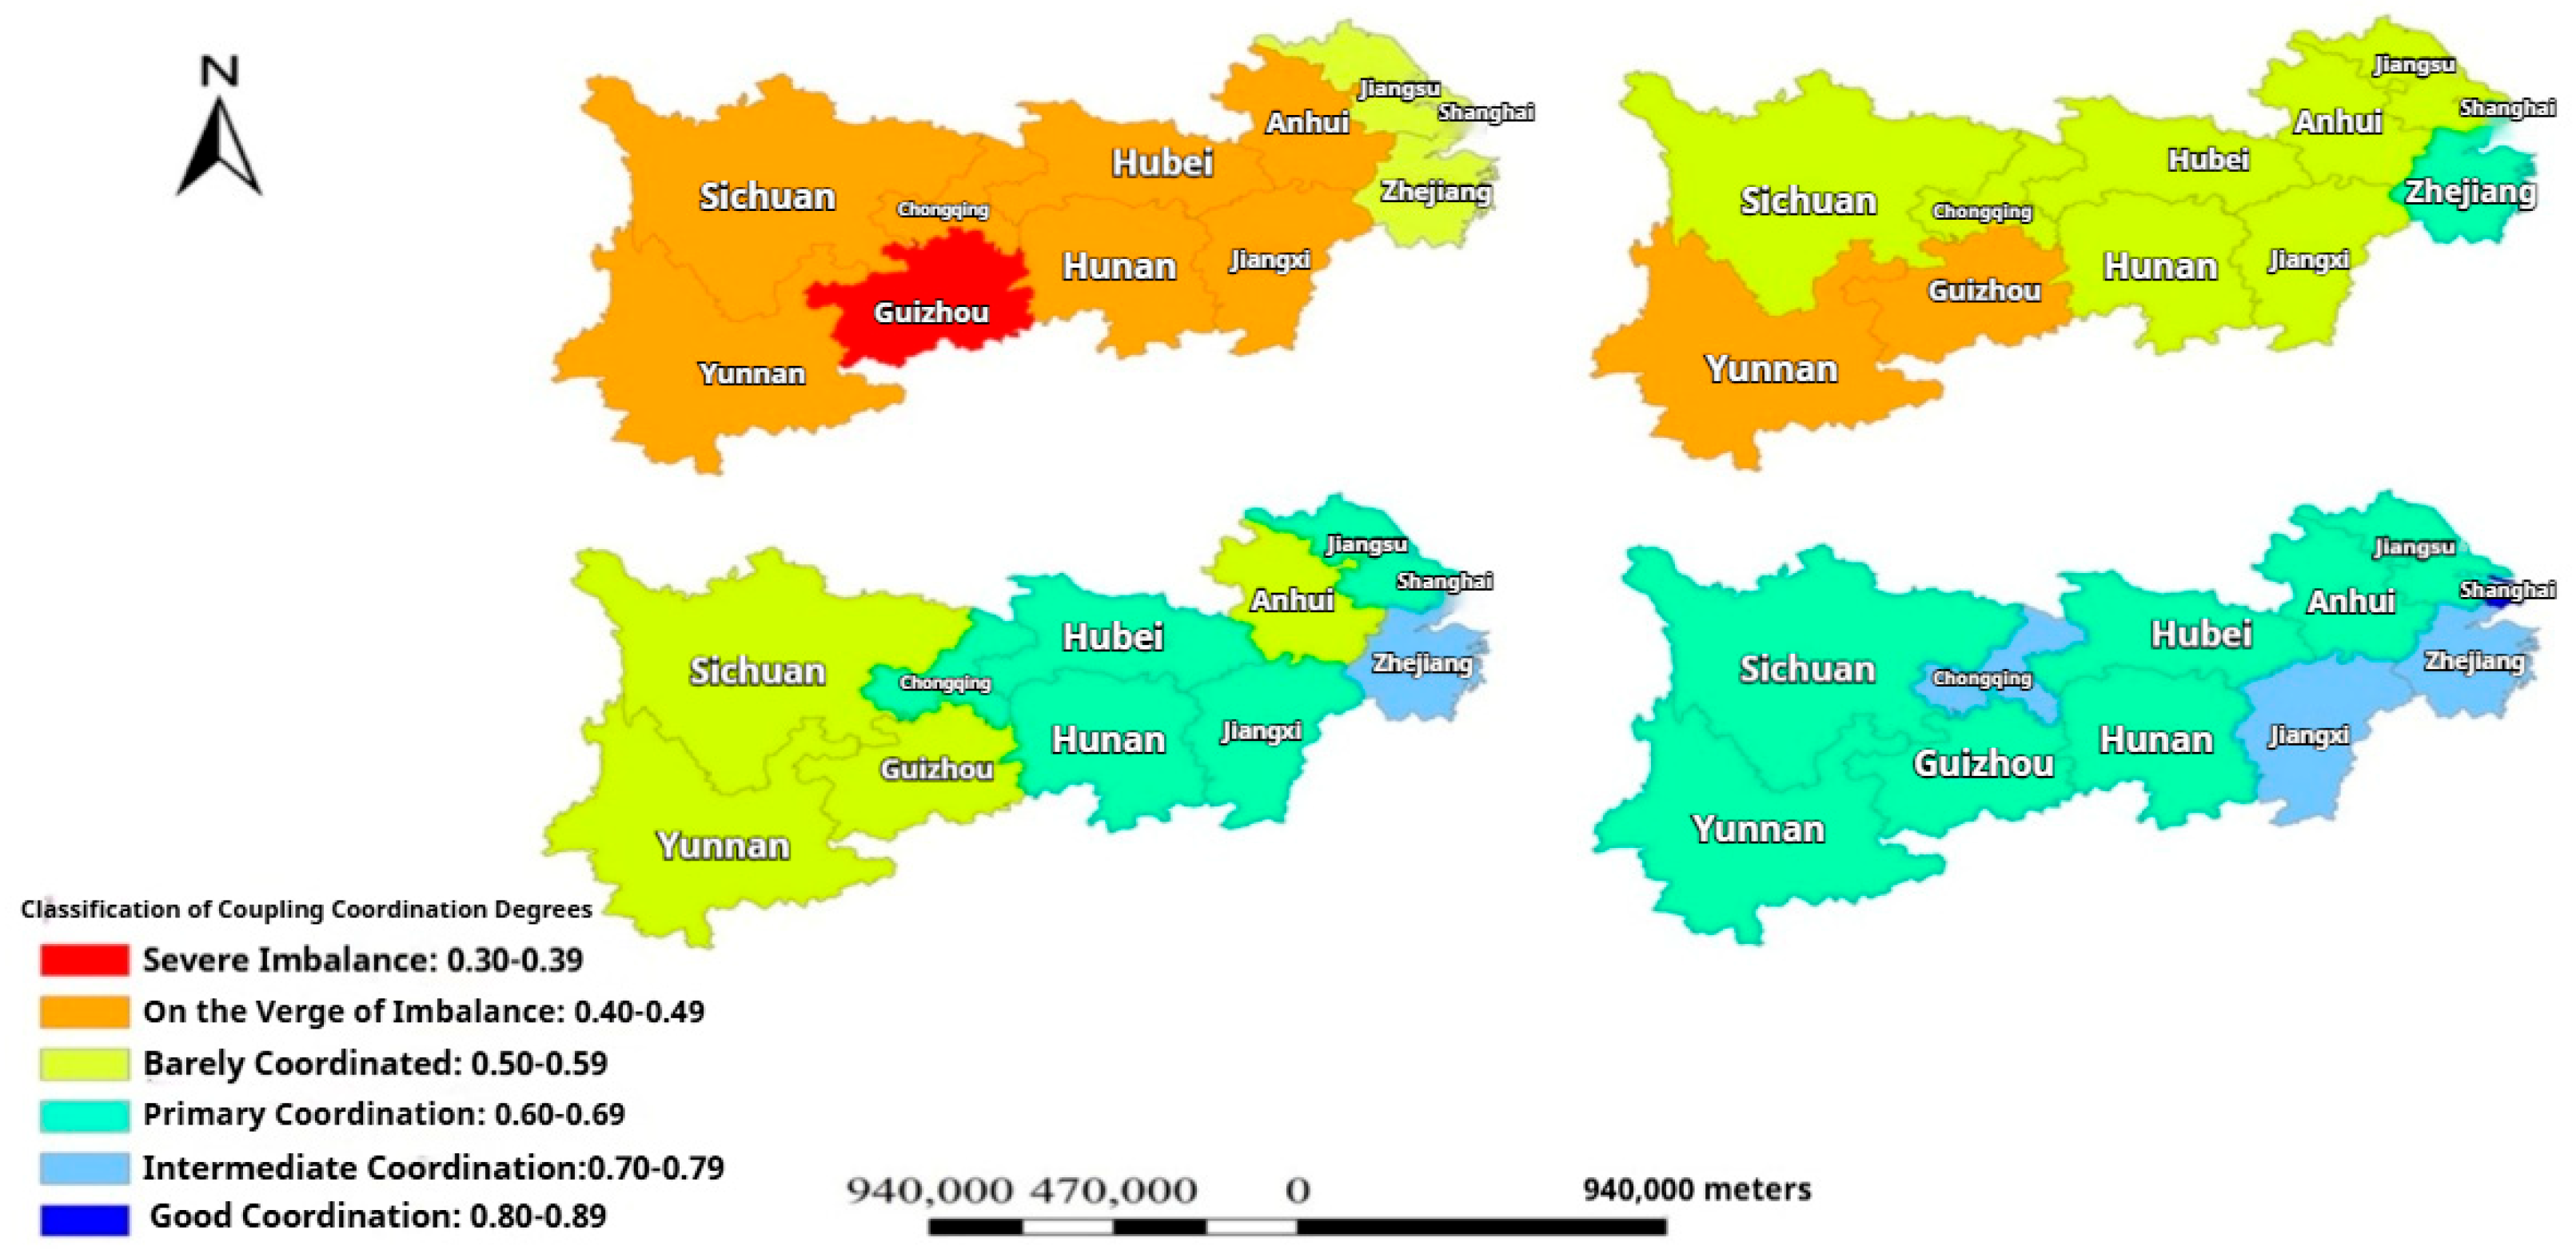
Figure 5.
Coupling Coordination Degree Between Provincial Urbanization and Carbon Emissions in the Yangtze River Economic Belt (2000–2032).
Figure 5.
Coupling Coordination Degree Between Provincial Urbanization and Carbon Emissions in the Yangtze River Economic Belt (2000–2032).
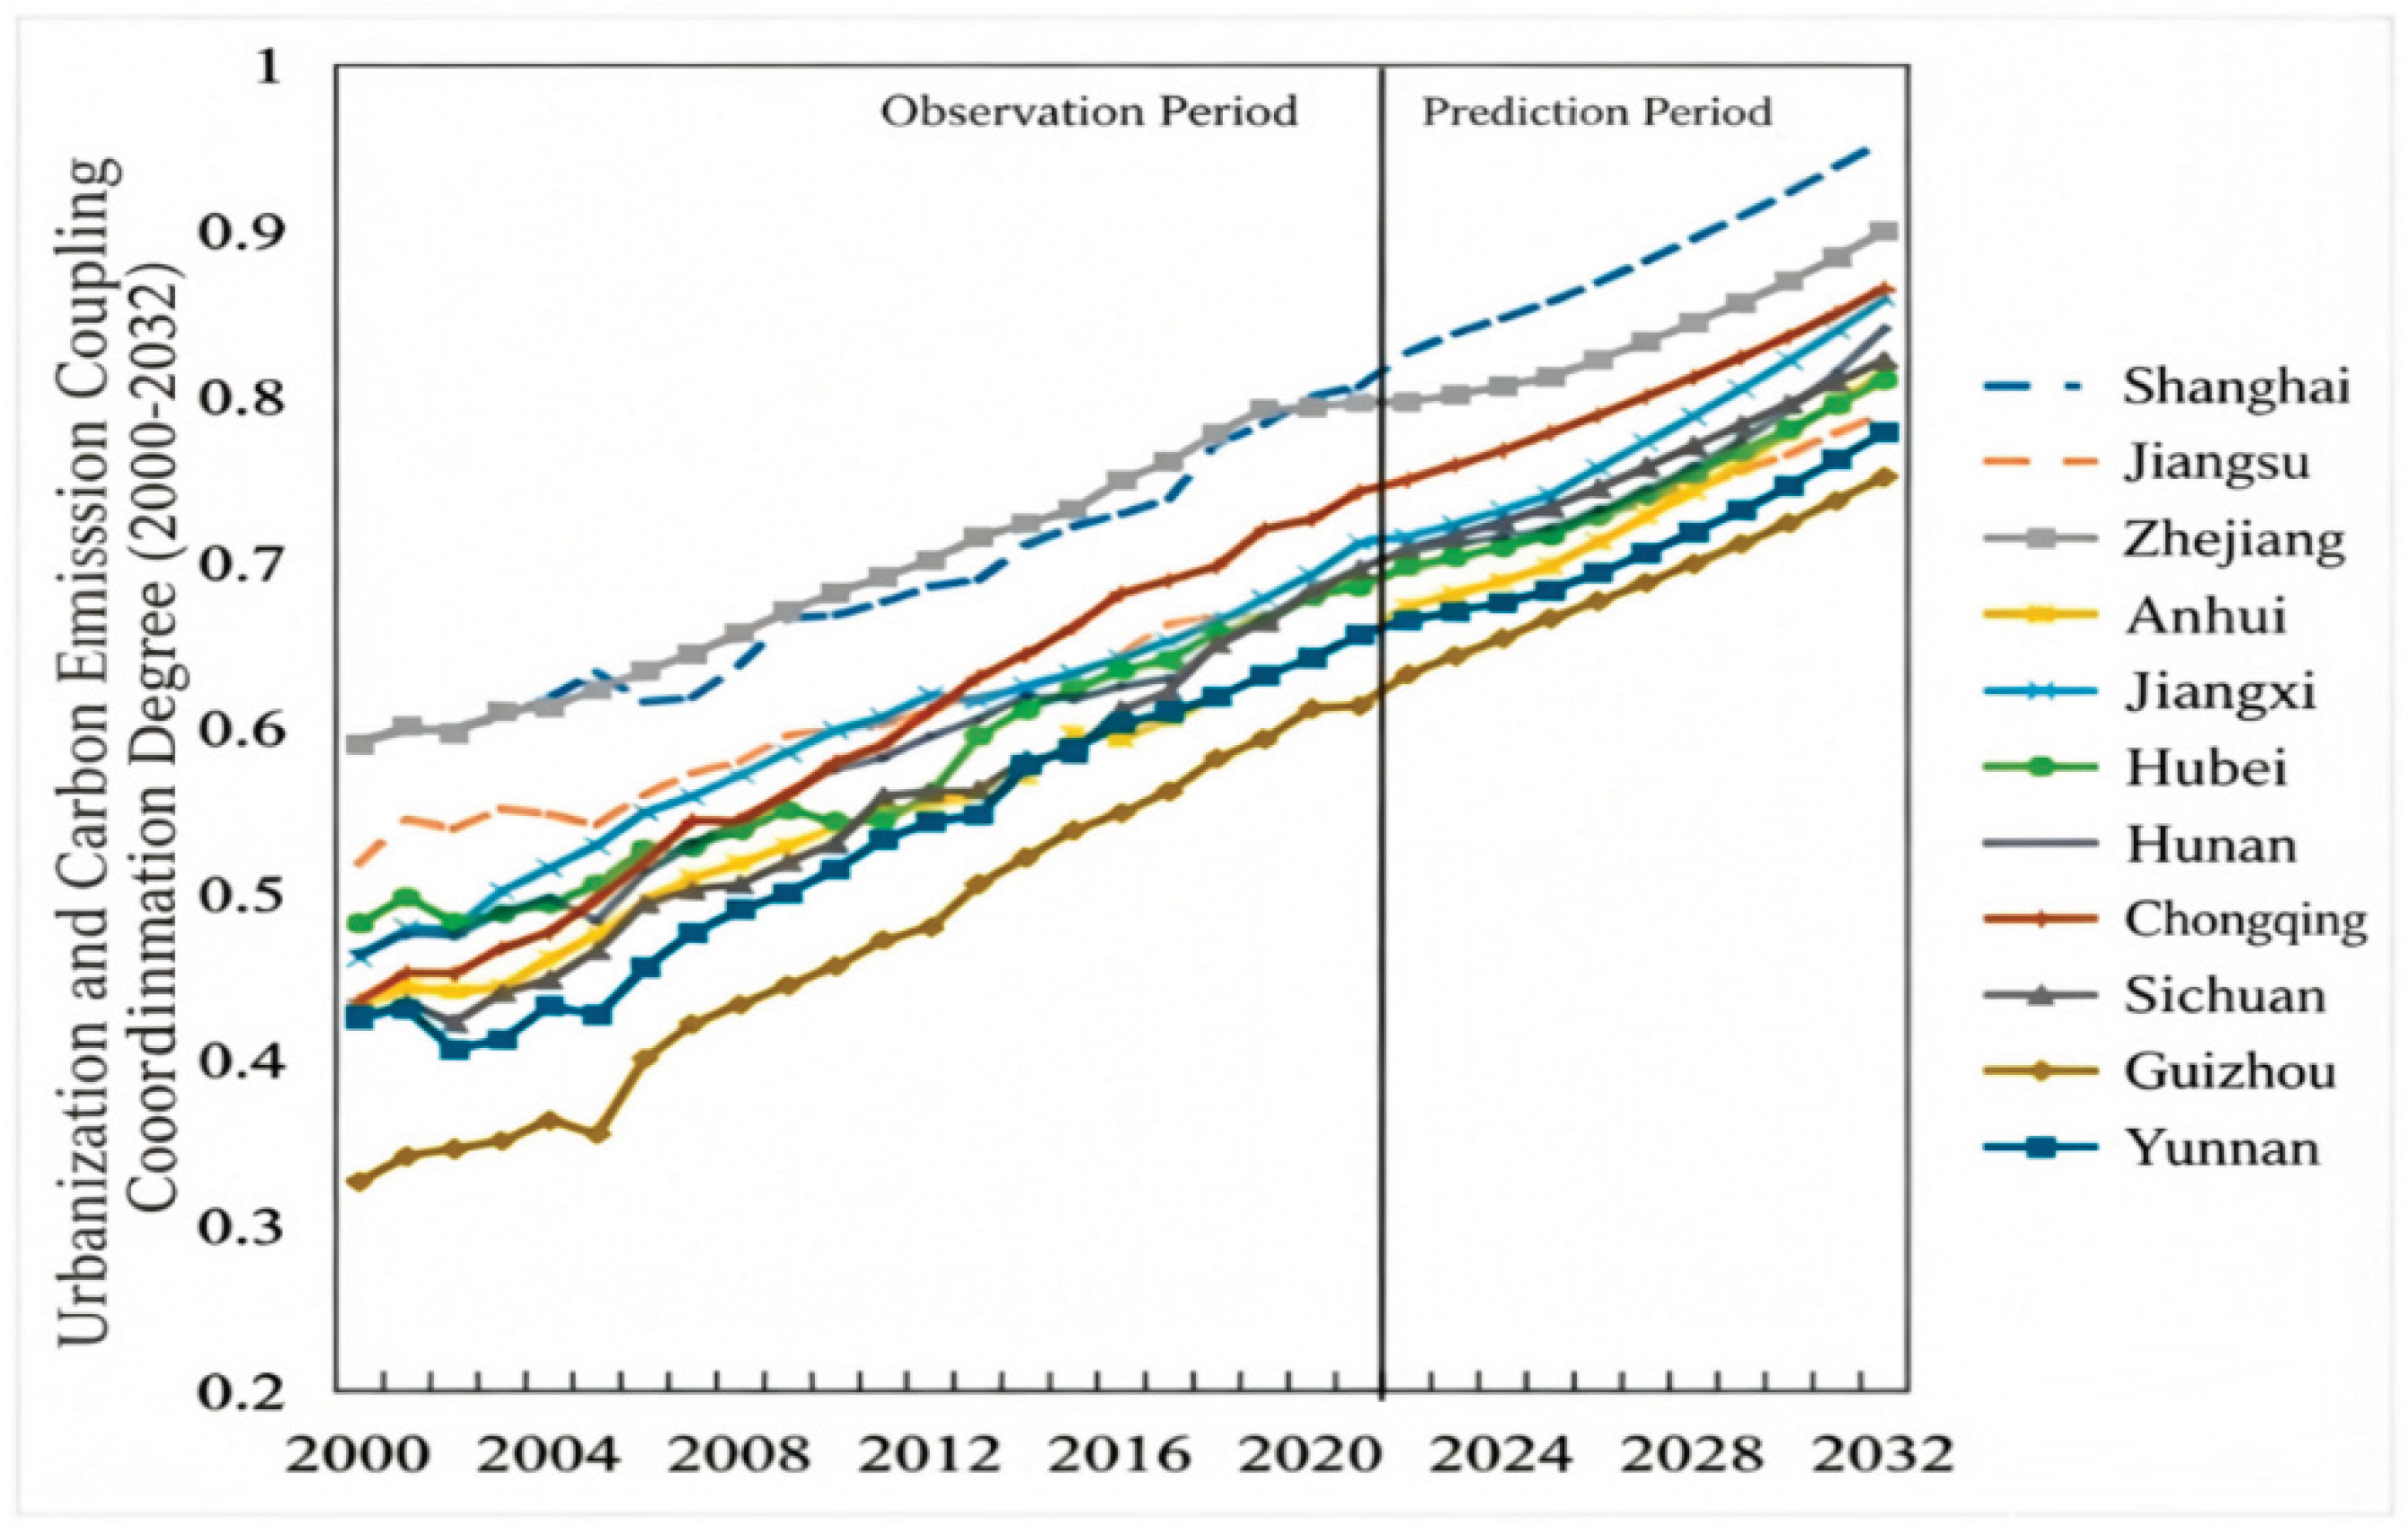

Table 1.
Table 1. Evaluation Index System of Urbanization.
| Criterion Layer | Weight | Indicator Layer | No. | Unit | Attribute | Reference Effect |
|---|---|---|---|---|---|---|
| Population Urbanization | 10.9% | Urban Population Density Urbanization Rate |
A1 | Persons/Square Kilometer | Positive | [7,25,26,27,30,31,32] |
| Proportion of Non-agricultural Population | A2 | % | Positive | [23,25,17,27,30] [31,33,34,35] |
||
| Registered Urban | A3 | % | Positive | [16,17] | ||
| Unemployment Rate | A4 | % | Negative | [25,26] | ||
| Economic Urbanization | 20.40% | Per Capita GDP | A5 | Yuan per capita | Positive | [7,16,17,30,32,34,35,36] |
| Proportion of Non-agricultural Output Value | A6 | % | Positive | [26,30,34,36] | ||
| Per Capita Disposable Income of Urban Residents | A7 | Yuan | Positive | [23,25,27,36] | ||
| Ratio of Per Capita Disposable Income between Urban and Rural Residents | A8 | % | Negative | [22,29] | ||
| Social Urbanization | 29.37% | Per Capita Total Retail Sales of Consumer Goods | A9 | 10,000 Yuan | Positive | [7,27,16,30,37] |
| Number of Doctors per 10,000 People | A10 | Persons | Positive | [23,25,27,16,17] | ||
| Number of College Students per 10,000 People | A11 | Persons | Positive | [23,25,36] | ||
| Number of Civil Vehicles per 10,000 People | A12 | Vehicles | Positive | [25] | ||
| Spatial Urbanization | 39.34% | Per Capita Urban Road Area | A13 | Square Meters | Positive | [30,33,36] |
| Proportion of Built-up Area to Total Land Area | A14 | % | Positive | [16,17] | ||
| Highway Network Density | A15 | % | Positive | [38] | ||
| Per Capita Park Green Space Area | A16 | Hectares per 10,000 People | Positive | [39,40] |
Table 2.
Evaluation Index System of Carbon Emissions.
| Criterion Layer | Weight | Indicator Layer | Code | Unit | Attribute | Reference Effect |
|---|---|---|---|---|---|---|
| Population Carbon Emission | 18.28% | Per Capita Carbon Emissions | B1 | Tons per capita | Negative | [24,25,27,29,41,42,11] |
| Per Capita Energy Consumption | B2 | Tons of standard coal per person | Negative | [24,25] | ||
| Economic Carbon Emission | 24.32% | Carbon Productivity | B3 | Yuan per ton | Positive | [29,41] |
| Low-carbon Decoupling Index | B4 | —— | Negative | [29] | ||
| Energy Carbon Emission | 32.37% | Total Carbon Emissions | B5 | Ten Thousand Tons | Negative | [25,27] |
| Total Energy Consumption | B6 | Ten Thousand Tons of Standard Coal | Negative | [24,25] | ||
| Energy Consumption per Unit GDP | B7 | Tons of Standard Coal per Ten Thousand Yuan | Negative | [25][11] | ||
| Proportion of Non-fossil Energy Consumption | B8 | % | Positive | [24] | ||
| Carbon Sink Capacity | 25.03% | Forest Coverage Rate | B9 | % | Positive | [43] |
| Urban Green Coverage Rate | B10 | % | Positive | [44] |
Table 3.
Energy Carbon Emission Factors.
| Energy Type | Average Net Calorific Value (kJ/kg) |
Carbon Content (tC/Tj) |
Carbon Oxidation Rate (%) |
Emission Factor |
|---|---|---|---|---|
| Raw Coal | 20908 | 26.37 | 93 | 1.88 |
| Washed Clean Coal | 26344 | 25.41 | 93 | 2.28 |
| Other Washed Coal | 8363 | 25.41 | 93 | 0.72 |
| Briquette | 20908 | 33.56 | 93 | 2.39 |
| Gangue | 5234 | 25.77 | 93 | 0.46 |
| Coke | 28435 | 29.42 | 93 | 2.85 |
| Coke Oven Gas | 17354 | 13.58 | 99 | 0.86 |
| Blast Furnace Gas | 3768 | 70.80 | 99 | 0.97 |
| Converter Gas | 5227 | 49.60 | 99 | 0.94 |
| Other Gases | 5227 | 13.58 | 99 | 0.26 |
| Other Coking Products | 28435 | 29.42 | 93 | 2.85 |
| Crude Oil | 41816 | 20.08 | 98 | 3.02 |
| Gasoline | 43070 | 18.90 | 98 | 2.93 |
| Kerosene | 43070 | 19.60 | 98 | 3.03 |
| Diesel Oil | 42652 | 20.20 | 98 | 3.10 |
| Fuel Oil | 41816 | 21.10 | 98 | 3.17 |
| LPG (Liquefied Petroleum Gas) | 50179 | 17.20 | 98 | 3.10 |
| Refinery Dry Gas | 45998 | 18.20 | 99 | 3.04 |
| Other Petroleum Products | 41816 | 20.00 | 98 | 3.01 |
| Natural Gas | 38931 | 15.32 | 99 | 2.17 |
| LNG (Liquefied Natural Gas) | 51498 | 17.20 | 98 | 3.18 |
Table 4.
Total Provincial Carbon Emissions of the Yangtze River Economic Belt (2000–2021).
| Province Year |
Shang hai |
Jiangsu | Zhe jiang |
An hui |
Jiang xi |
Hu bei |
Hu nan |
Chongqing | Si chuan |
Gui zhou |
Yunnan |
|---|---|---|---|---|---|---|---|---|---|---|---|
| 2000 | 122 | 210 | 130 | 123 | 52 | 141 | 77 | 62 | 97 | 85 | 51 |
| 2001 | 126 | 192 | 141 | 131 | 56 | 136 | 76 | 56 | 98 | 85 | 58 |
| 2002 | 133 | 217 | 152 | 116 | 59 | 160 | 88 | 60 | 113 | 89 | 69 |
| 2003 | 141 | 239 | 170 | 175 | 72 | 167 | 100 | 60 | 148 | 113 | 83 |
| 2004 | 155 | 310 | 209 | 160 | 82 | 184 | 113 | 60 | 165 | 127 | 55 |
| 2005 | 152 | 396 | 247 | 156 | 88 | 189 | 179 | 72 | 156 | 147 | 128 |
| 2006 | 179 | 420 | 280 | 173 | 99 | 225 | 201 | 79 | 159 | 171 | 144 |
| 2007 | 190 | 443 | 315 | 188 | 109 | 251 | 220 | 87 | 184 | 179 | 153 |
| 2008 | 193 | 460 | 320 | 214 | 111 | 254 | 222 | 111 | 214 | 171 | 153 |
| 2009 | 174 | 477 | 325 | 236 | 114 | 274 | 230 | 117 | 235 | 191 | 172 |
| 2010 | 191 | 526 | 343 | 244 | 138 | 319 | 247 | 136 | 239 | 192 | 182 |
| 2011 | 200 | 606 | 366 | 265 | 151 | 366 | 275 | 154 | 249 | 200 | 188 |
| 2012 | 193 | 620 | 360 | 302 | 149 | 355 | 274 | 144 | 278 | 217 | 189 |
| 2013 | 193 | 617 | 358 | 318 | 161 | 293 | 264 | 125 | 290 | 211 | 181 |
| 2014 | 179 | 607 | 344 | 320 | 164 | 288 | 258 | 136 | 287 | 204 | 168 |
| 2015 | 177 | 613 | 350 | 320 | 172 | 285 | 273 | 136 | 272 | 204 | 143 |
| 2016 | 179 | 625 | 348 | 330 | 178 | 281 | 278 | 127 | 250 | 207 | 146 |
| 2017 | 181 | 624 | 352 | 336 | 189 | 290 | 296 | 130 | 251 | 221 | 163 |
| 2018 | 167 | 617 | 346 | 345 | 196 | 285 | 279 | 133 | 215 | 213 | 168 |
| 2019 | 167 | 637 | 333 | 348 | 199 | 304 | 280 | 123 | 224 | 220 | 174 |
| 2020 | 157 | 616 | 323 | 343 | 197 | 272 | 268 | 119 | 213 | 206 | 184 |
| 2021 | 169 | 651 | 373 | 359 | 194 | 307 | 273 | 124 | 219 | 225 | 186 |
Table 5.
Classification of Coupling Coordination Degree Levels.
| Coordination Stage | Coupling Coordination Index | Coupling Coordination Level | Coordination Stage | Coupling Coordination Index | Coupling Coordination Level |
|---|---|---|---|---|---|
| High Coupling Level | 0.90~1.00 0.80~0.89 0.70~0.79 |
Superior Coordination Good Coordination Intermediate Coordination |
Antagonistic Stage |
0.40~0.49 0.30~0.39 0.20~0.29 |
On the Verge of Dyscoordination Mild Dyscoordination Moderate Dyscoordination |
| Running-in Stage | 0.60~0.69 | Primary Coordination | Low Coupling Level | 0.10~0.19 | Severe Dyscoordination |
| 0.50~0.59 | Barely Coordinated | 0.00~0.09 | Extreme Dyscoordination |
Table 6.
System Boundary.
| Subsystem | System Elements | Subsystem | System Elements | |
|---|---|---|---|---|
| Population Urbanization Subsystem |
Urban population density Urbanization rate Proportion of non-agricultural employment Registered urban unemployment rate Total population Population change rate Population change volume |
Economic Urbanization Subsystem | Per capita GDP Proportion of non-agricultural output value Per capita disposable income of urban residents Ratio of urban to rural residents’ disposable income Total primary industry output value Disposable income of rural residents Total GDP of the previous year GDP growth in the current year |
|
| Spatial Urbanization Subsystem | Per capita urban road area Proportion of built-up area to total land area Highway network density Per capita park green area Built-up area Total land area |
|||
|
Energy Carbon Emission Subsystem |
Total energy consumption Proportion of non-fossil energy consumption Total carbon emissions of the previous year Carbon emission growth volume Total carbon emissions Energy consumption per unit GDP |
|||
|
Social Urbanization Subsystem |
Per capita retail sales of consumer goods Number of doctors per 10,000 people Number of college students per 10,000 people Number of civilian vehicles owned per 10,000 people Change in the number of college students per 10,000 people Expenditure Fiscal revenue |
|||
| Carbon Sequestration Capacity Subsystem | Forest coverage rate Urban green coverage rate |
|||
| Economic Carbon Emission Subsystem | Low-carbon decoupling index Carbon productivity |
|||
| Population Carbon Emission Subsystem | Per capita carbon emissions Per capita energy consumption |
Table 7.
System Parameters and Equation Settings.
| Variables | Equations |
|---|---|
| GDP Growth Total GDP Total GDP of Previous Year Total Carbon Emissions of Previous Year Population Change Total Population Per Capita GDP Per Capita Park Green Area Per Capita Retail Sales of Consumer Goods Per Capita Carbon Emissions Per Capita Energy Consumption Low-carbon Decoupling Index Per Capita Disposable Income of Rural Residents Total Land Area Urban-rural Disposable Income Ratio Built-up Area Proportion of Built-up Area to Total Land Area Education Expenditure Current Year GDP Growth Number of College Students per 10,000 People Change in Number of College Students per 10,000 People Civil Vehicle Ownership per 10,000 People Carbon Emission Growth Total Carbon Emissions Total Energy Consumption Fiscal Revenue Proportion of Non-agricultural Output Value Proportion of Non-agricultural Employment Population |
GDP Growth Rate×Total GDP INTEG(GDP Growth) DELAY1(Total GDP , 1 ) IF THEN ELSE(Time=2000 , 0 , DELAY1(Total Carbon Emissions, 1 )) Population Change Rate×Total Population INTEG(Population Change) Total GDP/Total Population×10000 EXP(-0.0858475×LN(Proportion of Non-fossil Energy Consumption)+0.758463×LN(Urban Green Coverage Rate)-3.82741×LN(Forest Coverage Rate×100)-3.12608×LN(Per Capita Disposable Income of Urban Residents)-0.249275×LN(Urban Population Density)+0.0783972×LN(Urbanization Rate)+1.64597×LN(Total GDP)+28.7516) EXP(-2.88787×LN(Per Capita GDP)+1.30698×LN(Per Capita Disposable Income of Urban Residents)+28.7552×LN(LN(Per Capita GDP))-0.0520381×LN (Number of College Students per 10,000 People)-49.7547) Total Carbon Emissions/Total Population Total Energy Consumption/Total Population IF THEN ELSE(Time=2000 , 0 , Carbon Emission Growth/Total Carbon Emissions of Previous Year/Current Year GDP Growth×Total GDP of Previous Year) 2557.03+2830.39×Urbanization Rate + Total GDP×0.054 105500 Per Capita Disposable Income of Urban Residents/Per Capita Disposable Income of Rural Residents 0.2304×(Time-1999)×(Time-1999)×(Time-1999) - 8.1949× (Time-1999)×(Time-1999)+ 185.31×(Time-1999)+ 774.19 Built-up Area/Total Land Area EXP(0.807266×LN(Fiscal Revenue)+ 0.046941×LN(Total GDP)- 0.77523) DELAY1(GDP Growth,1 ) INTEG(Change in Number of College Students per 10,000 People) WITH LOOKUP(Education Expenditure) IF THEN ELSE(Time<=2011 , 0.4998×(Time-1999)×(Time- 1999)×(Time-1999)-2.4677×(Time-1999)×(Time-1999) +47.913×(Time-1999)+94.87 , EXP( 1.2339×LN(Per Capita GDP) +2.48515×LN(Per Capita Disposable Income of Urban Residents)-0.0882137×LN(Urban Population Density)-2.34524×LN(Per Capita Retail Sales of Consumer Goods)-29.6562)) IF THEN ELSE(Time=2000,0, Total Carbon Emissions-Total Carbon Emissions of Previous Year) Total GDP /Carbon Productivity×10000 Total GDP× Energy Consumption per Unit GDP EXP(0.0503053×LN(Total GDP)+0.0174563×LN(Registered Urban Unemployment Rate)+0.0179109×LN(Per Capita Retail Sales of Consumer Goods)+0.839011×LN (Per Capita Disposable Income of Urban Residents)-2.27423) 1-Total Output Value of Primary Industry /Total GDP IF THEN ELSE(Time=2012, 0.999252, IF THEN ELSE(Time=2014, 0.999456, EXP(-0.00182716×LN(Urban Population Density) +0.00765323×LN(Urbanization Rate)-0.0184199×LN(Number of Doctors per 10,000 People)+0.312442×LN(Proportion of Non-agricultural Output Value)+0.0888412))) |
Table 8.
Coupling Coordination Degree Values of Provincial Urbanization and Carbon Emissions in the Yangtze River Economic Belt.
Table 8.
Coupling Coordination Degree Values of Provincial Urbanization and Carbon Emissions in the Yangtze River Economic Belt.
| Year | Shanghai | Jiangsu | Zhejiang | Anhui | Jiangxi | Hubei |
|---|---|---|---|---|---|---|
| 2000 | 0.593 | 0.518 | 0.590 | 0.432 | 0.462 | 0.483 |
| 2001 | 0.599 | 0.545 | 0.601 | 0.444 | 0.480 | 0.498 |
| 2002 | 0.600 | 0.539 | 0.597 | 0.442 | 0.479 | 0.483 |
| 2003 | 0.607 | 0.551 | 0.611 | 0.444 | 0.502 | 0.489 |
| 2004 | 0.618 | 0.548 | 0.613 | 0.461 | 0.516 | 0.494 |
| 2005 | 0.634 | 0.542 | 0.624 | 0.476 | 0.529 | 0.506 |
| 2006 | 0.616 | 0.560 | 0.635 | 0.496 | 0.550 | 0.527 |
| 2007 | 0.619 | 0.573 | 0.645 | 0.510 | 0.559 | 0.528 |
| 2008 | 0.638 | 0.579 | 0.658 | 0.519 | 0.572 | 0.538 |
| 2009 | 0.667 | 0.595 | 0.671 | 0.529 | 0.586 | 0.551 |
| 2010 | 0.669 | 0.599 | 0.682 | 0.540 | 0.599 | 0.544 |
| 2011 | 0.676 | 0.602 | 0.692 | 0.550 | 0.607 | 0.545 |
| 2012 | 0.686 | 0.611 | 0.701 | 0.554 | 0.620 | 0.560 |
| 2013 | 0.690 | 0.619 | 0.716 | 0.559 | 0.616 | 0.596 |
| 2014 | 0.711 | 0.624 | 0.723 | 0.572 | 0.626 | 0.611 |
| 2015 | 0.722 | 0.633 | 0.732 | 0.597 | 0.634 | 0.624 |
| 2016 | 0.729 | 0.644 | 0.750 | 0.594 | 0.642 | 0.635 |
| 2017 | 0.738 | 0.663 | 0.761 | 0.605 | 0.652 | 0.641 |
| 2018 | 0.773 | 0.668 | 0.778 | 0.619 | 0.664 | 0.658 |
| 2019 | 0.784 | 0.666 | 0.793 | 0.631 | 0.679 | 0.665 |
| 2020 | 0.801 | 0.681 | 0.794 | 0.644 | 0.693 | 0.680 |
| 2021 | 0.806 | 0.687 | 0.797 | 0.656 | 0.712 | 0.686 |
| Year | Hunan | Chongqing | Sichuan | Guizhou | Yunnan | Average |
| 2000 | 0.465 | 0.436 | 0.424 | 0.327 | 0.427 | 0.469 |
| 2001 | 0.476 | 0.453 | 0.434 | 0.342 | 0.430 | 0.482 |
| 2002 | 0.475 | 0.452 | 0.422 | 0.346 | 0.406 | 0.477 |
| 2003 | 0.490 | 0.467 | 0.441 | 0.351 | 0.412 | 0.488 |
| 2004 | 0.498 | 0.477 | 0.448 | 0.364 | 0.433 | 0.497 |
| 2005 | 0.484 | 0.498 | 0.466 | 0.355 | 0.427 | 0.504 |
| 2006 | 0.513 | 0.520 | 0.494 | 0.401 | 0.456 | 0.524 |
| 2007 | 0.530 | 0.544 | 0.503 | 0.422 | 0.477 | 0.537 |
| 2008 | 0.546 | 0.543 | 0.506 | 0.433 | 0.491 | 0.548 |
| 2009 | 0.561 | 0.560 | 0.520 | 0.445 | 0.500 | 0.562 |
| 2010 | 0.576 | 0.580 | 0.530 | 0.456 | 0.515 | 0.572 |
| 2011 | 0.582 | 0.590 | 0.559 | 0.472 | 0.533 | 0.582 |
| 2012 | 0.595 | 0.611 | 0.562 | 0.480 | 0.544 | 0.593 |
| 2013 | 0.605 | 0.631 | 0.563 | 0.506 | 0.548 | 0.604 |
| 2014 | 0.620 | 0.645 | 0.581 | 0.522 | 0.578 | 0.619 |
| 2015 | 0.618 | 0.661 | 0.585 | 0.539 | 0.588 | 0.630 |
| 2016 | 0.625 | 0.682 | 0.612 | 0.549 | 0.602 | 0.642 |
| 2017 | 0.630 | 0.689 | 0.622 | 0.562 | 0.610 | 0.652 |
| 2018 | 0.650 | 0.698 | 0.651 | 0.582 | 0.619 | 0.669 |
| 2019 | 0.665 | 0.721 | 0.664 | 0.594 | 0.632 | 0.681 |
| 2020 | 0.682 | 0.726 | 0.684 | 0.612 | 0.642 | 0.694 |
| 2021 | 0.696 | 0.743 | 0.696 | 0.614 | 0.657 | 0.704 |
Table 9.
Partial Constrained and Expected Indicators During the 14th Five-Year Plan Period in Provincial Areas of the Yangtze River Economic Belt.
Table 9.
Partial Constrained and Expected Indicators During the 14th Five-Year Plan Period in Provincial Areas of the Yangtze River Economic Belt.
| Region Provincial |
GDP Growth Rate(%) | Urbanization Rate(%) | Reduction in Energy Consumption per Unit GDP (%) | Reduction in CO₂ Emissions per Unit GDP (%) | Unemployment Rate(%) | Number of Licensed Physicians per 1,000 Population persons |
|---|---|---|---|---|---|---|
| Shanghai | 5.00 | — | 13.50 | 18.00 | 5.50 | — |
| Jiangsu Province | 5.50 | 75 | 13.50 | 18.00 | 5.00 | 3.90 |
| Zhejiang Province | 5.50 | 75 | 13.50 | 18.00 | 5.50 | 4.30 |
| Anhui Province | 6.50 | 62 | 13.50 | 18.00 | 5.50 | 3.60 |
| Jiangxi Province | 7.00 | 64 | 13.50 | 18.00 | 5.50 | 2.70 |
| Hubei Province | 6.50 | 65 | 13.50 | 18.00 | 6.00 | 3.10 |
| Hunan Province | 6.00 | 63 | 13.50 | 18.00 | 5.50 | 2.95 |
| Chongqing Municipality | 6.00 | 73 | 13.50 | 18.00 | 5.50 | 3.60 |
| Sichuan Province | 6.00 | 60 | 13.50 | 18.00 | 6.00 | 2.85 |
| Guizhou Province | 7.00 | 58 | 13.50 | 18.00 | 5.50 | 3.00 |
| Yunnan Province | 7.50 | 60 | 13.50 | 18.00 | 5.50 | 3.00 |
Table 10.
Predicted Values of Coupling Coordination Degree between Urbanization and Carbon Emissions (2022–2032).
Table 10.
Predicted Values of Coupling Coordination Degree between Urbanization and Carbon Emissions (2022–2032).
| Province Year |
Shanghai | Jiang su |
Zhejiang | Anhui | Jiangxi | Hubei | Hunan | Chong qing |
Sichuan | Guizhou | Yun nan |
||||
|---|---|---|---|---|---|---|---|---|---|---|---|---|---|---|---|
| 2022 | 0.827 | 0.696 | 0.797 | 0.673 | 0.716 | 0.698 | 0.707 | 0.750 | 0.708 | 0.633 | 0.665 | ||||
| 2023 | 0.838 | 0.702 | 0.801 | 0.681 | 0.723 | 0.703 | 0.711 | 0.759 | 0.716 | 0.644 | 0.670 | ||||
| 2024 | 0.847 | 0.710 | 0.807 | 0.689 | 0.732 | 0.709 | 0.715 | 0.768 | 0.725 | 0.655 | 0.676 | ||||
| 2025 | 0.857 | 0.718 | 0.812 | 0.698 | 0.741 | 0.716 | 0.721 | 0.778 | 0.733 | 0.667 | 0.683 | ||||
| 2026 | 0.869 | 0.727 | 0.823 | 0.713 | 0.757 | 0.728 | 0.732 | 0.789 | 0.745 | 0.677 | 0.694 | ||||
| 2027 | 0.882 | 0.737 | 0.833 | 0.728 | 0.773 | 0.741 | 0.744 | 0.800 | 0.758 | 0.688 | 0.706 | ||||
| 2028 | 0.896 | 0.746 | 0.845 | 0.744 | 0.788 | 0.754 | 0.758 | 0.812 | 0.771 | 0.699 | 0.718 | ||||
| 2029 | 0.909 | 0.755 | 0.857 | 0.760 | 0.805 | 0.767 | 0.774 | 0.824 | 0.783 | 0.711 | 0.732 | ||||
| 2030 | 0.924 | 0.765 | 0.870 | 0.777 | 0.822 | 0.781 | 0.792 | 0.837 | 0.796 | 0.724 | 0.746 | ||||
| 2031 | 0.939 | 0.778 | 0.884 | 0.796 | 0.840 | 0.795 | 0.815 | 0.851 | 0.809 | 0.737 | 0.762 | ||||
| 2032 | 0.954 | 0.788 | 0.900 | 0.815 | 0.859 | 0.810 | 0.841 | 0.865 | 0.822 | 0.752 | 0.779 | ||||
Disclaimer/Publisher’s Note: The statements, opinions and data contained in all publications are solely those of the individual author(s) and contributor(s) and not of MDPI and/or the editor(s). MDPI and/or the editor(s) disclaim responsibility for any injury to people or property resulting from any ideas, methods, instructions or products referred to in the content. |
© 2026 by the authors. Licensee MDPI, Basel, Switzerland. This article is an open access article distributed under the terms and conditions of the Creative Commons Attribution (CC BY) license (http://creativecommons.org/licenses/by/4.0/).
Copyright: This open access article is published under a Creative Commons CC BY 4.0 license, which permit the free download, distribution, and reuse, provided that the author and preprint are cited in any reuse.


