
Submitted:
13 July 2026
Posted:
14 July 2026
You are already at the latest version
Abstract
This study responds to the call to apply the Impression Management Narrative Reporting (IMNR) Index to a larger sample, extending its application to the top 40 JSE-listed companies in South Africa. While prior literature has established the presence of impression management (IM) in narrative reports of JSE-listed companies, no study has quantitatively measured its level using multiple IM tactics combined into a single metric. Using content analysis, secondary data were collected from CEO letters to shareholders in annual or integrated reports. A purposive sample of 26 companies was analysed following the IMNR Index methodology. The findings reveal a median IMNR score of 5.20 (out of 8), indicating high levels of IM. Tone manipulation emerged as the dominant tactic (median 0.90), followed by rhetoric (0.83) and readability (0.81), while comparison was the least used tactic (0.38). These results confirm that CEOs of JSE-listed companies engage in IM strategies, consistent with Agency Theory and Signalling Theory. The study demonstrates the practical relevance of the IMNR Index in emerging market contexts and contributes to the literature by providing quantitative evidence of IM prevalence in CEO communications. Investors should approach CEO letters with scepticism, as high IM levels and tone manipulation may obscure underlying performance. Regulators should consider enhanced disclosure guidelines and potential assurance requirements for narrative reports. Audit committees must exercise active formal oversight to ensure integrity, balance, and faithful representation in these disclosures.
Keywords:
impression management (IM)
; Johannesburg stock exchange (JSE)
; CEOs’ letters
1. Introduction
Corporate narrative reporting has become an integral component of contemporary corporate reporting, complementing traditional financial statements by providing qualitative insights into an organisation's strategy, governance, risks, opportunities and future prospects. Narrative disclosures enhance the usefulness of financial reporting by reducing information asymmetry between management and stakeholders, thereby promoting transparency and facilitating informed investment and governance decisions (Leung et al., 2015; Beattie, 2014). With the increasing adoption of integrated reporting globally, narrative reporting has assumed a strategic role in communicating how organisations create value over the short, medium and long term (International Integrated Reporting Council, 2013; Setia et al., 2015). However, unlike audited financial statements, narrative disclosures rely substantially on managerial judgement and discretion, creating opportunities for management to shape stakeholders' perceptions of corporate performance rather than providing a completely faithful representation of organisational reality (Solomon & Maroun, 2012). Consequently, the credibility and reliability of corporate narrative reporting have become important concerns for researchers, regulators and investors alike.
The strategic use of narrative disclosures to influence stakeholders' perceptions is commonly referred to as impression management (IM). Impression management has been described as a communication strategy through which organisations seek to influence how stakeholders perceive corporate performance (Mankayi et al., 2023). Within corporate reporting, IM may manifest through selective disclosure of favourable information, attributional explanations, optimistic language, readability manipulation, rhetorical devices and the omission or obscuring of unfavourable information ( Dhludhlu et al., 2022). These practices compromise the qualitative characteristics of faithful representation, neutrality and completeness that underpin high-quality financial reporting (International Accounting Standards Board, 2018), thereby potentially misleading investors and impairing efficient capital allocation (Leung et al., 2015; Cho, Michelon, Patten, & Roberts, 2015). As a result, impression management has emerged as a prominent research stream within accounting and corporate reporting literature.
The importance of examining impression management is particularly evident within the South African corporate reporting environment. South Africa has long been recognised as an international leader in integrated reporting following the introduction of the King III and subsequently King IV Codes of Corporate Governance, together with the International Integrated Reporting Framework, which require JSE-listed companies to produce integrated reports or explain their non-compliance (Setia et al., 2015; Solomon & Maroun, 2012; Siwendu et al., 2024). While these developments have significantly enhanced the quality and scope of corporate reporting, concerns remain regarding the credibility of voluntary narrative disclosures that accompany audited financial statements (Leung et al., 2015). These concerns have been reinforced by several high-profile corporate failures involving JSE-listed companies, including EOH, Steinhoff, Tongaat Hulett and AYO Technology, where deficiencies in corporate reporting raised broader questions regarding transparency, governance and accountability. Although these corporate scandals primarily related to financial reporting irregularities, they simultaneously highlighted the importance of scrutinising accompanying narrative disclosures, which remain largely unaudited despite their influence on stakeholder decision-making.
Narrative disclosures play a critical role in assisting investors to interpret financial performance, assess future prospects and evaluate corporate risks (Leung et al., 2015). Nevertheless, because these disclosures are predominantly principles-based and contain substantial voluntary content, they also provide management with opportunities to employ impression management strategies (Yasseen et al., 2019). Previous studies have shown that management frequently uses narrative reporting to emphasise positive organisational achievements while minimising or obscuring unfavourable information ( Dhludhlu et al., 2022). Furthermore, the flexibility inherent in language makes narrative reports particularly susceptible to manipulation through linguistic and rhetorical techniques (Mlawu et al., 2023b). Such practices may reduce transparency, weaken investor confidence and ultimately contribute to the misallocation of capital (Dadanlar et al., 2024; Leung et al., 2015).
Within the South African context, empirical evidence increasingly confirms the presence of impression management among JSE-listed companies. Studies by Dhludhlu et al. (2022) and Mankayi et al. (2023) found evidence of impression management in board chairpersons' statements contained in integrated reports, while Nel et al. (2022) demonstrated that both chairpersons' and CEOs' letters exhibit impression management characteristics, although chairpersons generally employ more optimistic reporting styles. Phesa et al. (2025) further argue that the board chairperson's statement remains one of the most influential sections of an integrated report because of its prominence and visibility to stakeholders. Despite these important contributions, existing research has largely concentrated on identifying the existence of impression management rather than quantifying its magnitude or systematically evaluating the specific tactics employed within CEO communications. Moreover, most South African studies have focused on board chairpersons' statements, leaving CEO letters comparatively underexplored despite the CEO's primary responsibility for communicating organisational strategy and operational performance to stakeholders (Du Toit & Esterhuyse, 2021).
This study addresses these limitations by applying the Impression Management Narrative Reporting (IMNR) Index developed by Czajkowska (2023) to the CEO letters of the top 40 JSE-listed companies. Unlike previous South African studies, this research quantitatively measures the extent of impression management while simultaneously identifying the specific impression management tactics employed by CEOs. In doing so, the study responds directly to Czajkowska's (2023) recommendation that the IMNR Index be applied to larger samples and different forms of narrative reporting. The study therefore extends the international literature by providing one of the first comprehensive applications of the IMNR Index within a developing economy characterised by mandatory integrated reporting. Furthermore, it contributes to the South African corporate reporting literature by shifting attention from board chairpersons' statements to CEO letters, thereby providing new empirical evidence regarding managerial communication practices within JSE-listed companies. From a practical perspective, the findings will assist investors, regulators, auditors, governance practitioners and standard setters in identifying narrative reporting practices that may compromise transparency and informed decision-making.
Accordingly, this study seeks to answer the following research question:
To what extent is impression management present in the CEO letters of the top 40 JSE-listed companies, and which impression management tactics are most frequently employed?
To address this question, the study pursues two objectives. First, it determines the Impression Management Narrative Reporting (IMNR) Index scores for the CEO letters of the top 40 JSE-listed companies. Second, it identifies and evaluates the impression management tactics most frequently employed within these narrative disclosures using the IMNR Index. The study contributes both methodologically and empirically to the literature by extending the application of the IMNR Index, providing quantitative evidence on the prevalence of impression management within CEO communications, and enriching the limited body of research examining impression management in integrated reporting within emerging markets, particularly South Africa.
The remainder of this paper is organised as follows. Section 2 reviews the literature on impression management, corporate narrative reporting and the theoretical foundations underpinning the study. Section 3 describes the research methodology and the application of the IMNR Index. Section 4 presents and discusses the empirical findings, while the final section concludes by outlining the study's implications for corporate reporting practice, policy and future research. Section 5 concludes the study by presenting the key findings and conclusions, highlighting the study's theoretical and practical contributions, offering recommendations for policy and practice, acknowledging the study's limitations, and identifying directions for future research.
2. Literature Review
This section provides a detailed discussion of the literature relevant to the current study and theoretical framework. The literature review is organised thematically around the theoretical and empirical literature that discusses the various elements of the Impression Management Narrative Reporting (IMNR) index. The first section focuses on the theoretical framework underpinning this study, namely Agency Theory and Signalling Theory, highlighting the relevance of both to the phenomenon of impression management (IM). The section that follows focuses on the empirical literature on IM, and the final section concludes this section, highlighting the research gap.
2.1. Theoretical Framework
2.1.1. Agency Theory
Agency Theory is centred on how an agent, in the form of the company's Board of Directors (BOD), is hired by the principal, namely the shareholders of the company. Things may not always go as planned, resulting in deviations from planned performance; this is when they might be tempted to engage in dishonest financial and narrative disclosures. Depending on a company's financial performance, the Chief Executive Officer (CEO) may manipulate the tone of the issued narrative reports (Mlawu et al., 2023b). Therefore, when financial performance improves, the CEO's use of a positive tone in the narrative reports also improves, and when financial performance decreases, the use of a positive tone in the CEOs' narrative reports also declines (Mlawu et al., 2023b). Agency Theory as relating to problems that arise in a firm owing to the separation of ownership and management, the main issue being whether managers act and make decisions in the best interests of the owners and as such are not exploiting the information asymmetry gap to engage in impression management tactics.
Yasseen et al. (2019) stated that there is conflict of interest between principals and agents. In discussing how IM in annual reports undermines corporate transparency, Yasseen et al. (2019) state that the conflict of interest that exists between the principal and the agent often arises from the misalignment of the principal's goals with those of the agent. Agents typically pursue short-term profit-making goals owing to the performance-based remuneration policies that management is often subject to, whereas shareholders focus on long-term value creation and capital appreciation. For example, managers are willing to sacrifice the long-term success of a company in order to gain great short-term performance in alignment to their short tenure.
2.1.2. Signalling Theory
Impression management tactics may send incorrect signals to investors, as they rely on information provided in corporate narratives . Kothari, Li, and Short (2009) found that favourable disclosures reduce a firm's cost of capital, while unfavourable disclosures increase it. Unfaithful narrative disclosure through IM tactics may send mixed signals to investors. Le and Nguyen (2024) found that managers transmit signals to reduce information asymmetry, with well-performing companies using more positive language and poor performers using less positive tones. The length of narrative reports may signal IM presence, though lengthy reports may obfuscate readers (Aghamolla & Smith, 2024). For this study, signalling is observed through companies engaging in IM tactics and sending misleading signals to stakeholders. Although this study centres on two theoretical frameworks, Agency Theory is more aligned with this research as its links to impression management can be distinctly established (Nel et al., 2022).
2.2. Empirical Literature
In the context of the current research, IM is analysed from the CEO's point of view. In most cases, the CEO feels the need to engage in IM tactics if negative factors affect the company's operations (Yasseen et al., 2019). The negative aspects could be hidden from stakeholders, for example, when the company has engaged in earnings management.
As narrative reports from companies have become longer and more sophisticated, the threat of IM has also significantly increased in these reports. The synthetic indicator of IM measures the extent to which IM introduces bias into financial reporting (Brennan, Guillamon-Saorin, & Pierce, 2009). The Impression Management Narrative Reporting (IMNR) index is based on Brennan's measure of IM. It includes 11 common IM tactics, allowing for an IM score to be expressed quantitatively (Czajkowska, 2023).
The IMNR index divides 11 elements into three groups: content management (subject, tone management, selection, explanation, comparison), communication management (readability, rhetorical manipulation, emphasis), and text presentation management (appearance, presentation form, location) (Czajkowska, 2023). The subject or theme is a topic discussed in the CEO's letter, with each theme identified and allocated positive or negative points. Tone management determines the tone used by the CEO (Bozzolan, Cho, & Michelon, 2015), while explanation involves attributing successes and failures to internal and external causes. Selection and comparison involve identifying numbers lower or higher than previous periods and making comparisons in the text. Readability is assessed using the Fog index (Loughran & McDonald, 2014). Rhetoric focuses on phrases engaging readers and rhetorical figures, emphasis identifies repeated words, and text presentation analyses font, bold text, and information location (Czajkowska, 2023). The following IM tactics are key:
Subject Management: A subject is a topic repeated in the text, with broader topics narrowed to specific ones. Content analysis determines the frequency of words and patterns (Iazzi, Papa, Palladino, & Lamusta, 2025), aligning with the IMNR index's approach. Content analysis is valuable in accounting research (Guthrie & Abeysekera, 2006). Iazzi et al. (2025) provide insights into IM in Italian sustainability reports, applicable to South African JSE-listed companies where integrated reporting is compulsory. Content analysis offers rigorous document analysis and subjectivity can be mitigated through word counting (Humble & Mozelius, 2022).
Tone Management: An auxiliary list of keywords and emotion words identifies positive and negative contributions, with context determining meaning (Czajkowska, 2023). The Optimism Index, ranging from -1 to +1, measures tone (Fadavi & Hillert, 2024). García-Sánchez, Suárez-Fernández, and Martínez-Ferrero (2019) found that managers use positive words to manipulate perceptions. Melloni, Stacchezzini, and Lai (2016) found overly optimistic business model sections, reflecting IM strategies. Phesa and Sibanda (2023) found both profitable and non-profitable JSE-listed companies employ IM in chairperson's statements. Du Toit and Esterhuyse (2021) found optimism as a dominant narrative style among South African CEOs' letters.
Explanation: Companies attribute positive outcomes to internal causes and negative outcomes to external causes to maintain credibility (Aerts, 2005). Content analysis identified attributional events in Belgian directors' reports. Yasseen, Moola-Yasseen, and Padia (2017) found JSE-listed companies attribute positive performance internally and negative performance externally. Shaikh, Varachia, and Myeza (2024) found South African State-owned entities use internal and external attribution, employing a scoring technique that supports quantifying IM (Czajkowska, 2023).
Selection and Comparison: Spanish companies used positive benchmarks as IM tactics. The comparison tactic aligns with retrospective sense-making (Jones, Melis, Gaia, & Aresu, 2020). Selection involves identifying numbers higher or lower than previous periods (Czajkowska, 2023).
Readability: Readability ensures reports are understandable to reasonably educated persons. The Fog index determines if management obfuscates poor performance, dominating other indexes due to convenient calculation and regulatory recognition. Mankayi et al. (2023) found JSE-listed chairperson's reports difficult to read, suggesting Plain English Handbook adoption.
Rhetoric: Aerts and Yan (2017) identified three rhetorical styles in CEOs' letters: empathetic assertiveness, cautious sense giving, and rational appeal, serving as IM tools with varying effectiveness.
Emphasis : Repetition can enhance understandability or obfuscate content. Positive writing styles emphasise favourable information while omitting unfavourable events (Sandberg & Holmlund, 2015). Makhlouf (2024) highlights emphasis as repetition of statements or numbers to emphasise positive contributions.
Text Presentation : Visual materials influence stakeholder perceptions and maintain organisational legitimacy (Usmani, Davison, & Napier, 2020). Visual elements evoke trust and compassion (Davison, 2015).
2.3. Gap in the Literature
Phesa and Sibanda (2023) and Yasseen et al. (2017) provide insights into IM in narrative reports, but no metric combines multiple IM tactics to express IM levels in JSE-listed companies. IM tactics in State-owned entities, but no study has applied the IMNR index to CEOs' letters in South Africa. Enslin, Du Toit, and Puane (2025) combined readability and tone analysis, finding unreadable reports with biased tones. The discourse on IM should extend by combining quantitative analysis with existing IM strategy research.
2.4. Summary
A poorly performing CEO may exploit information asymmetry to provide inaccurate information (Mlawu, Matenda, & Sibanda, 2023b), worsened by a BOD lacking oversight characteristics. Agency Theory relates to performance metrics pressuring CEOs to engage in IM tactics. Aligning principal and agent goals limits such tactics. Companies employing IM disadvantage information users, as Signalling Theory suggests investor behaviour is influenced by provided information, leading to misaligned decisions. This section reviewed literature situating IM within Agency Theory and Signalling Theory, highlighting methods to establish IM presence and identifying the research gap.
3. Methodology
The section highlighted the theoretical and empirical literature relevant to the current study. This study relies on the generalisability and practical relevance of the methods introduced by Czajkowska (2023) when developing the Impression Management Narrative Reporting (IMNR) index to calculate Impression Management (IM) scores for Polish listed companies. However, it is now being applied to the top 40 JSE-listed companies, but only in a certain section of the integrated report or annual report. According to Van der Geest and van Pelt (2022), a direct replication replicates all experimental material and procedures as closely as possible to the original study, testing whether the original experiment holds up over time using a different sample. This study replicates the study of Czajkowska (2023) to see if it holds true in a different geographical region, precisely in developing country. This section discusses the research philosophy, research design, research population, research sample, and data collection, validation, and analysis methods.
3.1. Research Philosophy and Research Paradigm
This study used the interpretivist tool of textual analysis for data collection and coding. Content analysis was the main method through which data were collected for determining each element of the IMNR index; however, qualitative data collected and coded were further analysed using the IMNR index to measure and assess the level of IM present in each CEO's letter. The index, a quantitative tool, can be distinctly classified into the positivist research paradigm. Although it possessed characteristics of both interpretivist and positivist paradigms, this study is aligned with and well-rooted in the positivist paradigm. Owing to the nature of this study, the quantitative research approach was adopted, as it provided an in-depth understanding of the presence of IM and its levels in the selected sample. The IMNR index tallies scores of each element to determine the extent to which IM is present in each report. This study is grounded in the deductive approach, as it best assists in addressing the research questions. The ontology of this study is the belief that IM is a measurable phenomenon; however, methods of measuring it must be critically tested in different contexts.
3.2. Research Design
The replication of methods and procedures used to determine IMNR index scores of Polish-listed companies was done to collect and analyse data, present results, and conclude on the applicability of the IMNR Index to the top 40 JSE-listed companies. According to van der Geest and van Pelt (2022), the accounting research community continues to signal that little value is placed on replication research, and it remains an awkward topic. However, replication involves a thorough and lengthy research process that involves following the original research study with meticulous detail.
3.3. Content Analysis as a Quantitative Approach
This study employed content analysis as a data collection and coding method. Content analysis as a technique for identifying explicit and operationally defined categories, involving the analysis of words, sentences, and units of measurement to capture the amount of wording. A study of IM warrants the use of manual content analysis. While manual content analysis was employed, computer-assisted analysis techniques were also utilised to collect and transform raw data into a form that can be analysed manually.
3.4. Data Coding
Chakraborty and Bhattacharjee (2020) find that manual content analysis of corporate narrative disclosures can be difficult, complex, and time-consuming, leading researchers to shift to computer-assisted means. The coding for each element of the IMNR index has been replicated from Czajkowska (2023). For the subject element, positive or negative topics are awarded one point each (Czajkowska, 2023). Tone coding awards a point each time a positive or negative keyword appears. Explanation identifies causes of success and failure attributable to internal or external factors. Selection involves coding numbers to determine if they are higher or lower than in the preceding period (Czajkowska, 2023). Comparison entails searching for comparisons within the report. Readability is measured using the Fog Index. For rhetorical IM, three methods are proposed: expressions engaging the reader, reinforcing and reducing keywords, and rhetorical figures (Czajkowska, 2023). Emphasis is coded by identifying repetitions. Text presentation elements (font, presentation form, location) serve as weights for other elements, adding up to 1.5 points, with location weighted if appearing in headings or first paragraphs (Czajkowska, 2023).

Table 1.
Methods for determining rhetorical impression management.
| Reader engaging phrases | Words that reinforce keywords | Words that reduce keywords | Rhetorical figures |
|---|---|---|---|
| It can be noticed; it can be seen; it is worth noting; it should be noted; it must be noticed; it must be seen | Above average, crucial, decisive, enormous, essential, excellent, exceptional, factual, important, intense, large, outstanding, profound, rapid, real, significant, special, strong, undoubted | A little, imperceptible, insignificant, irrelevant, little, minimal, slight, slightly, small, unimportant, weak | Anaphora, hyperbole, metaphor |
Source: Czajkowska (2023).
Each word, phrase, or figure of speech is awarded 1 point, with favourable rhetorical figures and reader-engaging phrases considered positive. Reinforcing desirable information is positive; reinforcing undesirable information is negative. Emphasis is coded by identifying repetitions occurring at least twice in the same context, with one point per repetition (Czajkowska, 2023). The text presentation group (font, presentation form, location) serves as weights for other elements, adding up to 1.5 points. Location is weighted if elements appear in first paragraphs, first sentences, or headings (Czajkowska, 2023). For example, a positive keyword may receive 0.5 points for different font, 0.5 for being in a box, and 0.5 for paragraph placement.
Table 2.
Summary of coding techniques of IMNR element identification.
| Group | Impression Management Strategic Studies | Method | Measure |
|---|---|---|---|
| Content Management | Subject | The identification of positive, negative, and neutral topics | The number of positive and negative topics |
| Tone | Coding of positive and negative keywords and emotion words | The number of positive and negative keywords and emotion words | |
| Explanation | Coding of internal and external causes of successes and failures | The number of explanations of successes due to internal causes and failures due to external causes (positive) and explanations of successes due to external causes and failures due to internal causes (negative) | |
| Selective content | Method 1: Coding for numbers higher or lower than those in the previous corresponding reporting period Method 2: Coding for qualitative information that is more or less favourable than in the previous corresponding reporting period |
Number of higher or lower numbers or qualitative information than in the previous reporting period | |
| Comparability | Coding for favourable and unfavourable comparisons | Number of favourable and unfavourable comparisons | |
| Communication Management | Readability | Fog index calculation to determine the readability of each letter | Fog index value |
| Rhetorical impression management | Method 1: Identification of phrases that engage the reader Method 2: Identification of reinforcing keywords and reducing keywords Method 3: Identification of rhetorical figures (for example, anaphora, metaphor, hyperbole) |
Number of engaging phrases, reinforcing or reducing words, and rhetorical figures | |
| Emphasis | Identification of repetition of words, text fragments, and information | Number of repetitions | |
| Text presentation | Font | Analysis for font differences (for example, size, typeface, colour, bold, underlining) | Weights |
| Presentation form | Identification of distinctive forms of text presentation (for example, tables, diagrams, and frames) | ||
| Location | Analysis for distinctive locations (for example, first paragraph, beginning of first paragraph, or heading) |
Source: Czajkowska (2023).
3.5. The Impression Management Narrative Reporting Index as a Quantitative Approach
The IMNR index quantifies IM presence and identifies dominant tactics. Each element is measured by occurrence count (except readability), with a maximum of one point per element, plus up to 1.5 weight points for text presentation.
Value of IMNR index element = (sum of positive measures – sum of negative measures) / (sum of positive measures + sum of negative measures)
The readability tactic is determined using the Gunning FOG Index: Gunning Fog Index = 0.4 x (Total words / Total sentences) + 100 x (complex words / Total words)
The Fog index is considered appropriate for estimating readability of specialised and technical reports (Bifulco, Caserio, di Donato, & Trucco, 2025). The sum total of the eight elements determines the overall IMNR Index score:
IMNR Index = Subject + Tone + Explanation + Selection + Comparison + Readability + Rhetoric + Emphasis, (Czajkowska, 2023).
The IMNR index score ranges from -8 to 8 as an ordinal measure (Czajkowska, 2023), expressing relative position rather than exact differences (Lalla, 2017). Despite concerns about sum scales, summative rating scales are widely accepted in research.
3.6. Research Population and Research Sample
The population comprised JSE top 40 companies drawn from 280 JSE-listed entities (JSE, 2025), selected based on public interest, wide tradability, and high market capitalisation The JSE is Africa's oldest stock exchange and key for foreign investment. A purposive sampling approach (Obilor, 2023) was used, also common in quantitative research. After evaluating narrative reports, 14 companies were excluded due to missing CEO letters, interim/acting CEOs, combined titles, or co-written letters, resulting in a final sample of 26 companies ,more than double Czajkowska's (2023) sample of ten. Purposive sampling disallows generalisation, so findings apply only to the sample (Obilor, 2023).
3.7. Data Collection Methods and Instruments
Data were collected from official corporate websites, with CEO letters extracted from annual or integrated reports (Veltri & Silvestri, 2020). PDF pages were converted to Word using Optical Character Recognition. Secondary data were sourced from annual reports (Mlawu, Matenda, & Sibanda, 2023a), with content analysis employing word and statement counts (Makhlouf, 2024). To ensure validity and reliability, the study replicated a peer-reviewed design using secondary data signed by BODs, with ethical clearance obtained (00032257). Quality was assessed through internal/external validity, reliability, and objectivity. Researcher bias was mitigated via standardised procedures and self-criticism (Yoon & Uliassi, 2022), following original methodology with documented deviations to preserve rigour (Singh, Ang, & Leong, 2003).
3.8. Chapter Summary
This section provided details on the research design and methodology used in this study, clearly stating the approach used to achieve the study's objectives. The population and sampling technique adopted were discussed, as well as the data collection procedure, data analysis method, and validity and reliability of the data. The next section focuses on data analysis and presentation of results.
4. Data Results and Analysis
The last section presented the research methodology and design. This section presents the data and discusses the findings. A simple tabulation approach provided basic statistical information about the sample. Values of each IMNR Index element and total combined scores were tabulated. Raw data from content analysis were subjected to formulas to facilitate calculation of each element value. Incorporated median calculation in their study linking IM and information asymmetry; the present study similarly utilised median to present IM extent. The research objectives were to determine IMNR Index scores for the top 40 JSE-listed companies and examine the most used IM tactics. The section incorporates interpretation and discussion of research findings.
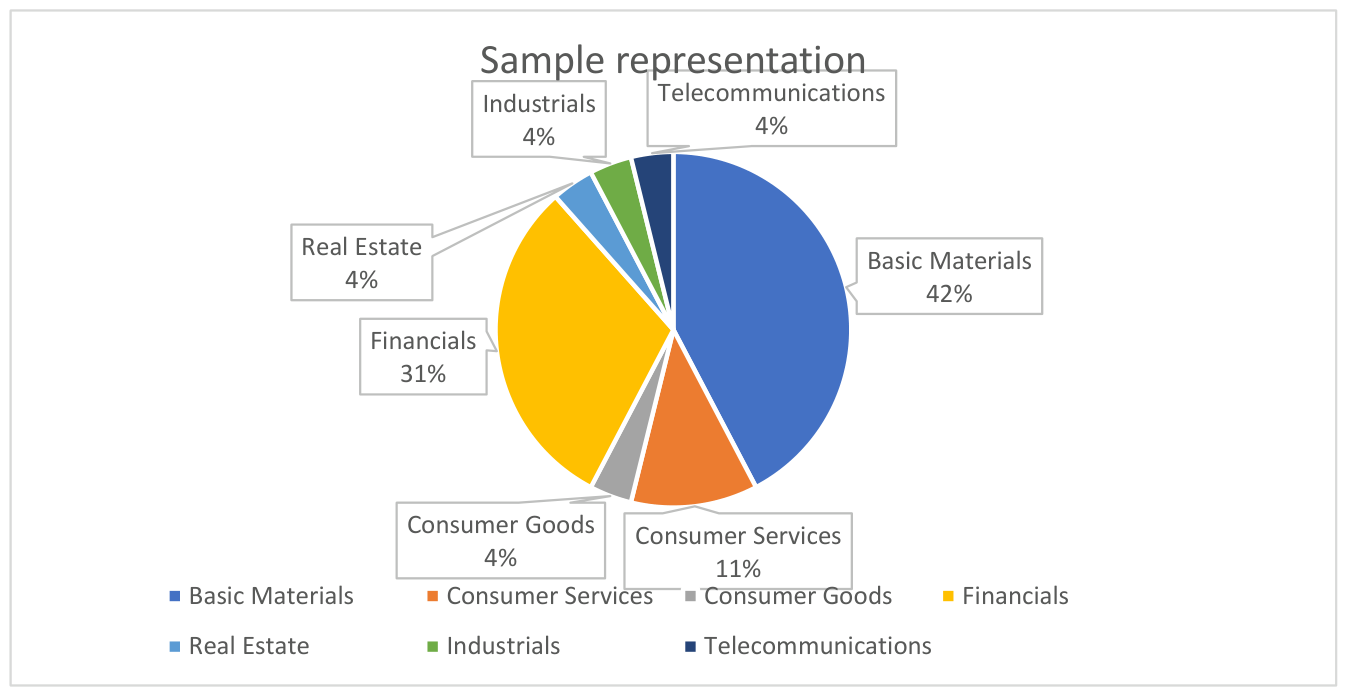
The total population of top 40 JSE-listed companies was reduced to 26 companies, as discussed in Section 3.6. Company names are not disclosed; however, JSE listing sectors are disclosed. The most represented sector is Basic Materials (42.31%), followed by Financials (30.77%), Consumer Services (11.54%), with Consumer Goods, Real Estate, Industrials, and Telecommunications forming 3.85% each.
4.1. Analysis of Data and Empirical Research Findings
Sürücü and Maslakci (2020) submit that meaningfulness and appropriateness of data determine research validity. Two research questions guided the study: "What are the IMNR Index scores of the JSE top 40 companies?" and "What is the most used IM tactic?" Rigorous content analysis determined each element's value.
Figure 1.
Composition of each sector in the final sample (Rounded to nearest percentage). Source: Own creation.
Figure 1.
Composition of each sector in the final sample (Rounded to nearest percentage). Source: Own creation.
4.2. To Determine the IMNR Index Scores for the JSE-Listed Top 40 Companies
All IMNR index values are positive, indicating presence of IM. Table 3 presents interpretation of IM levels.
The highest IMNR score was Company 6 (6.53, Consumer Services), scoring 1.00 for Subject. The lowest was Company 25 (2.80, Basic Materials), with negative values for Selection (-0.14) and Comparison (-0.20). Table 4 presents results.
Figure 2.
A graphical presentation of the IMNR Index results distribution. Source: Own creation.
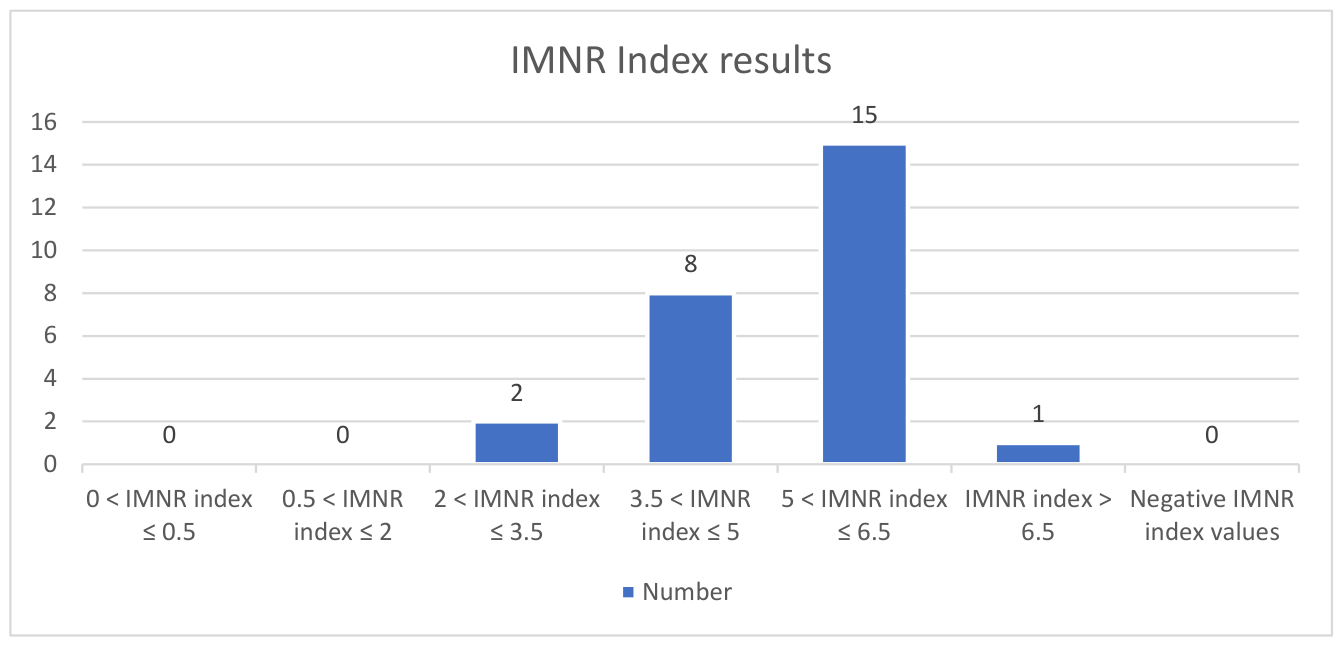
The median IMNR index value is 5.20, indicating high levels of IM. These findings corroborate Nel et al. (2022), who found evidence of IM in CEO and chairperson letters of JSE-listed companies. The median of 5.20 also confirms Du Toit and Esterhuyse's (2021) findings of IM presence in South African CEO letters. The acceptable IM level is hard to define; scores should be analysed with financial statements and other qualitative factors (Czajkowska, 2023), though this is beyond the current scope.
4.3. To Evaluate the Most Used IM Tactics by the Top 40 JSE-Listed Companies
The statistical values of each of the eight main elements of the IMNR index taking into account any weighting contributed by the text presentation elements are presented in Table 5 below.
5. Discussion
The most dominant IM tactic is tone manipulation (median 0.90, mean 0.87), followed by rhetoric (median 0.83, mean 0.81), and readability (median 0.81, mean 0.82). The least used tactic is comparison (median 0.38, mean 0.35). Subject, tone, selection, rhetoric, and emphasis each achieved maximum scores of 1.00, indicating only positive information was presented. The lowest element scores were -0.43 (Selection) and -0.33 (Comparison), indicating more unfavourable information presented. Standard deviation was lowest for readability (0.10), indicating clustered data, while selection had the highest (0.40), indicating wider spread.
Enslin, Du Toit, and Puane (2025) note that narrative tone can influence stakeholders and introduce bias. Tone manipulation being dominant is unsurprising, as CEO letters are essentially self-performance evaluations. Tone manipulation is determined using the optimism index. These findings reinforce Mlawu et al. (2023b), who found JSE CEO letter tones are manipulated in relation to financial performance. Phesa and Sibanda (2023) determined that board chairpersons of profitable JSE-listed companies use a more positive tone as an IM strategy. Misleading information can erode investor confidence, affecting capital raising and economic growth in emerging economies.
Analysis revealed the most prevalent presentation form tactic was different font size, colour, or style, followed by location (keywords in headings or first paragraphs). Tables, diagrams, and frames were rarely used. Mlawu et al. (2023b) highlight that tone manipulation may result in information asymmetry. Melloni et al. (2016) note managers have more information than investors. Leung et al. (2015) found narrative reports may close the information asymmetry gap or serve as vehicles for IM.
The median IMNR score of 5.20 indicates high IM levels, confirming CEOs engage in IM by exploiting information asymmetry. Tone manipulation being the dominant tactic reiterates the link between IM and Agency Theory (Nel et al., 2022). The high median score and tone manipulation dominance support using CEO letters as signals to stakeholders. Ngcizela, Phesa, and Arulanandam (2024) explain that management may use information as a signal to receivers as an IM strategy. Le and Nguyen (2024) argue tone presence is influenced by Signalling Theory, with tone manipulation providing evidence of the link between IM and Signalling Theory, where CEOs use overly optimistic tones to potentially mislead users.
6. Summary
This section presented results of the replication study of the IMNR index on the top 40 JSE-listed companies. Findings revealed a median value of 5.20, indicating high IM levels. Tone manipulation was the most common tactic, with comparison being least used. Through manual content analysis of 26 CEO letters, significant interference in reporting entity image was determined. The findings link IM to Agency Theory and Signalling Theory, with tone manipulation presenting overly optimistic information. Overall findings support existing literature identifying IM strategy use in JSE-listed company narrative reports (Phesa & Sibanda, 2023; Yasseen et al., 2017). The next section presents the conclusion of the study, encapsulating the key conclusions, reinforcing the contribution, covering limitations, offering recommendations, and pointing toward future research.
7. Conclusions
The study replicated the IMNR index on a larger sample (26 companies) from the top 40 JSE-listed companies, applying it to CEO letters to shareholders. Rooted in Agency Theory and Signalling Theory, the study employed manual content analysis to identify index elements and determine the median of IMNR values. The main purpose was top answer the research question of ,What are the IMNR index scores of the JSE top 40 companies? The median score is 5.20, indicating high levels of IM (maximum score 8), confirming CEO use of IM strategy consistent with Du Toit and Esterhuyse (2021).
Further, a second part of the research question of: What is the most commonly used IM tactic?, the data revealed tone manipulation as the most dominant tactic (median 0.90, mean 0.87), followed by rhetorical manipulation (median 0.83, mean 0.81). Comparison was the least used tactic. It is recommended that CEOs must exercise fairness and balance, avoiding excessive optimism while enhancing clarity. Further, enhanced disclosure guidelines must be introduced legislatively to complement the IIRC framework, potentially mandating assurance for narrative reports. Audit committees must be actively involved in formal oversight of narrative reports to promote accountability and integrity and users must exercise scepticism, not taking information at face value but verifying where possible.
The study’s limitations should be noted, manual content analysis introduced subjectivity; effort was made to mitigate this through careful application of coding techniques following the original methodology. Futher, generalisability is limited by the purposive sampling technique; findings apply only to the sample. Future research may focus on establish a dictionary of specific keywords for IMNR index elements specific to JSE-listed reporting styles to reduce subjectivity. Also, on the identification of relationships between IMNR index scores and quantitative values such as CEO tenure or observe scores longitudinally with financial performance changes, consider company-specific qualitative factors and their effect on IMNR index scores over time, incorporate more comprehensive statistical analysis of each IMNR element value and total scores, use artificial intelligence technology, such as natural language processing tools, to detect index elements and focus on IM in the context of ESG reporting, sustainable development, and climate change.
References
- Aerts, W. (2005). Picking up the pieces: Impression management in the retrospective attributional framing of accounting outcomes. Accounting, Organizations and Society, 30(6), 493-517.
- Aerts, W., & Yan, B. (2017). Rhetorical impression management in the letter to shareholders and institutional setting: A metadiscourse perspective. Accounting, Auditing & Accountability Journal, 30(2), 404-432.
- Aghamolla, C., & Smith, K. (2024). Managers' choice of disclosure complexity. Journal of Accounting and Economics,77(1), 101637.
- Al-Sayani, Y. M., & Al-Matari, E. M. (2023). Corporate governance characteristics and impression management in financial statements: A further analysis. Malaysian evidence. Cogent Social Sciences, 9(1), 2209987.
- Beattie, V. (2014). Accounting narratives and the narrative turn in accounting research: Issues, theory, methodology, methods and a research framework. The British Accounting Review, 46(2), 111-134.
- Bifulco, G., Caserio, C., di Donato, F., & Trucco, S. (2025). Does sustainable performance matter for non-financial disclosure readability? A Fog-Index analysis on Italian listed companies. Corporate Social Responsibility and Environmental Management, 32(1), 1-15.
- Bozzolan, S., Cho, C. H., & Michelon, G. (2015). Impression management and organizational audiences: The Fiat Group case. Journal of Business Ethics, 126(1), 143-165.
- Brennan, N. M., Guillamon-Saorin, E., & Pierce, A. (2009). Methodological insights: Impression management: Developing and illustrating a scheme of analysis for narrative disclosures – A methodological note. Accounting, Auditing & Accountability Journal, 22(5), 789-832.
- Cho, C. H., Michelon, G., Patten, D. M., & Roberts, R. W. (2015). CSR disclosure: The more things change...? Accounting, Auditing & Accountability Journal, 28(1), 14-35.
- Czajkowska, A. (2023). Impression Management Narrative Reporting Index (IMNR) as a synthetic indicator of impression management in narrative reports. European Research Studies Journal, 26(1), 1-20.
- Davison, J. (2015). Visualising accounting: An interdisciplinary review and synthesis. Accounting and Business Research,45(6-7),757-791.
- Dhludhlu, S., et al. (2022). Dhludhlu, N., Phesa, M., & Sibanda, M. (2022). Impression Management during the Covid-19 Pandemic: A Comparative Analysis of the Chairperson’s Statement by JSE-Listed Profitable and Least Profitable Companies. Journal of Accounting and Finance in Emerging Economies, 8(4), 501-514.
- Du Toit, E., & Esterhuyse, L. (2021). Narrative styles and institutional isomorphism in South African CEOs' shareholder letters. The African Journal of Information and Communication, 27, 1-17.
- Enslin, Z., Du Toit, E., & Puane, M. F. (2025). The readability and narrative tone of risk and risk management disclosures for South African listed companies. Journal of Accounting in Emerging Economies, 15(1), 224-241.
- García-Sánchez, I. M., Suárez-Fernández, Ó., & Martínez-Ferrero, J. (2019). Female directors and impression management in sustainability reporting. International Business Review, 28(3), 1-15.
- Guthrie, J., & Abeysekera, I. (2006). Content analysis of social, environmental reporting: what is new?. Journal of Human Resource Costing & Accounting, 10(2), 114-126.
- Humble, N., & Mozelius, P. (2022, May). Content analysis or thematic analysis: Similarities, differences and applications in qualitative research. In European conference on research methodology for business and management studies (Vol. 21, No. 1, pp. 76-81).
- Iazzi, A., Papa, A., Palladino, R., & Lamusta, S. (2025). Evaluating Companies' Impression Management Tactics in Mandatory Sustainability Reporting. Business Strategy and the Environment, 34(6), 6828-6848.
- International Accounting Standards Board (IASB). (2018). Conceptual Framework for Financial Reporting. IFRS Foundation.
- Jones, M. J., Melis, A., Gaia, S., & Aresu, S. (2020). Impression management and retrospective sense-making in corporate annual reports: Banks’ graphical reporting during the global financial crisis. International Journal of Business Communication, 57(4), 474-496.
- JSE. (2025). JSE Listed Companies. Johannesburg Stock Exchange.
- Kothari, S. P., Li, X., & Short, J. E. (2009). The effect of disclosures by management, analysts, and business press on cost of capital, return volatility, and analyst forecasts: a study using content analysis. The Accounting Review, 84(5), 1639-1670.
- Lalla, M. (2017). Fundamental characteristics and statistical analysis of ordinal variables: A review. Quality & Quantity, 51(1), 435-458.
- Tran, L. T. H., Tu, T. T. K., Nguyen, T. T. H., Nguyen, H. T. L., & Vo, X. V. (2023). Annual report narrative disclosures, information asymmetry and future firm performance: evidence from Vietnam. International Journal of Emerging Markets, 18(2), 351-375.
- Leung, S., Parker, L., & Courtis, J. (2015). Impression management through minimal narrative disclosure in annual reports. The British accounting review, 47(3), 275-289.
- Loughran, T., & McDonald, B. (2014). Measuring readability in financial disclosures. the Journal of Finance, 69(4), 1643-1671.
- Makhlouf, M. H. (2024). Audit committee and impression management in financial annual reports: evidence from Jordan. EuroMed Journal of Business, 19(3), 462-485.
- Mankayi, S., Matenda, F. R., & Sibanda, M. (2023). An analysis of the readability of the chairman’s statement in South Africa. Risks, 11(3), 54.
- Melloni, G., Stacchezzini, R., & Lai, A. (2016). The tone of business model disclosure: an impression management analysis of the integrated reports. Journal of Management & Governance, 20(2), 295-320.
- Mlawu, L., Matenda, F. R., & Sibanda, M. (2023). Linking financial performance with CEO statements: Testing impression management theory. Risks, 11(3), 55.
- Nel, G. F., Arendse-Fourie, S. L., & Ontong, J. M. (2022). The association between optimism and future performance: Evidence of impression management from chief executive officer and chairperson letters. South African Journal of Business Management, 53(1), 3183.
- NGCIZELA, A., PHESA, M., & ARULANANDAM, B. (2024). THE POWER OF WORDS: DECODING THE NEXUS OF IMPRESSION MANAGEMENT TACTICS IN SOUTH AFRICAN SOES'ANNUAL REPORTS THAT SHAPE STAKEHOLDER PERCEPTION. ILOMATA INTERNATIONAL JOURNAL OF TAX AND ACCOUNTING Учредители: Yayasan Ilomata, 5(3), 807-829.
- Obilor, E. I., Okah-Tim, E. J., & Akwawo, U. K. (2023). International Journal of Spectrum Research in Education & Humanities (IJSREH). interventions, 1, 88-560.
- Phesa, M., & Sibanda, M. (2022). A manifestation of impression management in corporate reporting in jse top 40 listed companies. Journal of Business and Social Review in Emerging Economies, 8(4), 669-682.
- Phesa, M., Sibanda, M., Matenda, F. R., & Gumede, Z. (2025). Impression management tactics in the chairperson’s statement: A systematic literature review and avenues for future research. Journal of Risk and Financial Management, 18(5), 270.
- Sandberg, M., & Holmlund, M. (2015). Impression management tactics in sustainability reporting. Social Responsibility Journal, 11(4), 677-689.
- Setia, N., Abhayawansa, S., Joshi, M., & Huynh, A. V. (2015). Integrated reporting in South Africa: some initial evidence. Sustainability Accounting, Management and Policy Journal, 6(3), 397-424.
- Shaikh, S., Varachia, Z., & Myeza, L. (2024). Integrated Reports of Impression Management Techniques of the South African State-Owned Enterprises. Journal of Public Administration, 59(1), 130-150.
- Singh, K., Ang, S. H., & Leong, S. M. (2003). Increasing replication for knowledge accumulation in strategy research. Journal of Management, 29(4), 533-549.
- Siwendu, T. O., & Ambe, C. M. (2024). A systematic literature review on transparency in executive remuneration disclosures and their determinants. Journal of Risk and Financial Management, 17(10), 466.
- Solomon, J., & Maroun, W. (2012). Integrated reporting: the new face of social, ethical and environmental reporting in South Africa?
- Sürücü, L. (2020). Validity and reliability in quantitative research. Business & management studies: an international journal.
- Usmani, M., Davison, J., & Napier, C. J. (2020, October). The production of stand-alone sustainability reports: visual impression management, legitimacy and “functional stupidity”. In Accounting Forum (Vol. 44, No. 4, pp. 315-343). Routledge.
- van der Geest, J., & van Pelt, V. Replications can help improve relevance of accounting experiments.
- Veltri, S., & Silvestri, A. (2020). The value relevance of corporate financial and nonfinancial information provided by the integrated report: A systematic review. Business Strategy and the Environment, 29(8), 3038-3054.
- Yasseen, Y., Mohamed, W., & Moola-Yasseen, M. (2019). The use of impression management practices in the chairman’s statements in South African annual reports: An agency theory perspective. Communicare: Journal for Communication Sciences in Southern Africa, 38(1), 37-56.
Table 3.
Levels of impression management.
| Level | Value | Description |
|---|---|---|
| Neutral impression management | 0 < index score ≤ 0.5 | The absence of any intentional interference with the impression of the entity created by the published information |
| Negligible | 0.5 <index score ≤ 2 | Negligible level of impression management |
| Low | 2 <index score ≤ 3.5 | Low level of impression management |
| Moderate | 3.5 <index score ≤ 5 | Moderate level of impression management |
| High | 5 <index score ≤ 6.5 | Significant interference in the image of the reporting entity is presented in the report. |
| Very high | index score > 6.5 | A very high level of influence on impressions created by reporting information |
| Negative | Negative IMNR index values | Actions aimed at creating a negative image are rare and insignificant, with only a few cases of actions intended to deteriorate the image. |
Source: Czajkowska (2023).
Table 4.
Results of the impression management narrative reports index.
| Letter number | Sector | Subject | Tone | Explanation | Selection | Comparison | Readability | Rhetoric | Emphasis | IMNR Index Value |
|---|---|---|---|---|---|---|---|---|---|---|
| Company 1 | Basic Materials | 0.68 | 0.87 | 0.45 | 0.31 |
0.33 | 0.87 | 0.91 | 0.92 | 5.35 |
| Company 2 | Basic Materials | 0.63 | 0.90 | 0.64 | 0.71 | -0.33 | 0.91 | 1.00 | 0.58 | 5.03 |
| Company 3 | Basic Materials | 0.72 | 0.68 | 0.56 | 0.33 | 0.33 | 0.73 | 0.85 | 0.85 | 5.26 |
| Company 4 | Consumer Services | 0.62 | 0.83 | 0.62 | 0.33 | -0.11 | 0.81 | 0.87 | 0.50 | 4.47 |
| Company 5 | Consumer Goods | 0.82 | 0.94 | 0.67 | 0.33 | 0.33 | 0.73 | 0.82 | 0.76 | 5.41 |
| Company 6 | Consumer Services | 1.00 | 0.95 | 0.57 | 0.83 | 0.82 | 0.79 | 0.63 | 0.94 | 6.53 |
| Company 7 | Financials | 0.56 | 0.91 | 0.49 | 0.67 | 0.33 | 0.79 | 0.41 | 0.90 | 5.05 |
| Company 8 | Basic Materials | 0.48 | 0.50 | 0.56 | 0.14 | 0.20 | 0.72 | 0.76 | 0.88 | 4.24 |
| Company 9 | Basic Materials | 0.76 | 0.80 | 0.59 | 0.18 | 0.33 | 0.76 | 0.69 | 0.68 | 4.79 |
| Company 10 | Basic Materials | 0.62 | 1.00 | 0.41 | 0.67 | 0.56 | 0.57 | 1.00 | 0.93 | 5.75 |
| Company 11 | Basic Materials | 0.45 | 0.69 | 0.38 | 0.33 | 0.43 | 0.98 | 0.73 | 0.08 | 4.08 |
| Company 12 | Financials | 0.54 | 0.89 | 0.60 | 0.75 | 0.50 | 0.80 | 0.85 | 0.50 | 5.42 |
| Company13 | Basic Materials | 0.27 | 0.96 | 0.70 | -0.09 | 0.67 | 0.93 | 0.62 | 0.67 | 4.74 |
| Company 14 | Basic Materials | 0.78 | 0.75 | 0.69 | -0.43 | 0.43 | 0.90 | 0.61 | 0.85 | 4.58 |
| Company 15 | Financials | 0.45 | 0.85 | 0.56 | 0.71 | 0.43 | 0.99 | 0.71 | 0.77 | 5.48 |
| Company 16 | Financials | 0.60 | 1.00 | 0.67 | 1.00 | 0.50 | 0.73 | 1.00 | 1.00 | 6.50 |
| Company 17 | Financials | 0.56 | 0.80 | 0.45 | 0.75 | 0.33 | 0.87 | 0.83 | 0.22 | 4.81 |
| Company 18 | Financials | 0.11 | 0.89 | 0.11 | 0.38 | -0.20 | 0.82 | 0.73 | 0.15 | 3.00 |
| Company19 | Financials | 0.85 | 1.00 | 0.25 | 1.00 | 0.60 | 0.91 | 0.85 | 0.86 | 6.32 |
| Company 20 | Real Estate | 0.50 | 1.00 | 0.33 | 1.00 | 0.60 | 0.81 | 0.83 | 0.97 | 6.05 |
| Company 21 | Consumer Services | 0.48 | 0.96 | 0.70 | 1.00 | 0.60 | 0.91 | 0.83 | 0.78 | 6.27 |
| Company 22 | Basic Materials | 0.33 | 0.92 | 0.33 | 0.33 | 0.20 | 0.86 | 0.91 | 0.64 | 4.53 |
| Company 23 | Financials | 0.10 | 0.95 | 0.64 | 1.00 | 0.60 | 0.79 | 0.91 | 1.00 | 5.99 |
| Company 24 | Industrials | 0.65 | 0.87 | 0.41 | 0.57 | 0.50 | 0.66 | 0.86 | 0.83 | 5.35 |
| Company 25 | Basic Materials | 0.36 | 0.67 | 0.38 | -0.14 | -0.20 | 0.83 | 0.79 | 0.11 | 2.80 |
| Company 26 | Telecommunications | 0.33 | 1.00 | 0.55 | 1.00 | 0.33 | 0.80 | 1.00 | 0.13 | 5.14 |
Source: Own creation.
Table 5.
Descriptive statistics of IMNR Index elements.
| Subject | Tone | Explanation | Selection | Comparison | Readability | Rhetoric | Emphasis | |
|---|---|---|---|---|---|---|---|---|
| Mean | 0.55 | 0.87 | 0.51 | 0.53 | 0.35 | 0.82 | 0.81 | 0.67 |
| Median | 0,56 | 0,90 | 0,56 | 0,62 | 0,38 | 0,81 | 0,83 | 0,78 |
| Minimum | 0.10 | 0.50 | 0.11 | -0.43 | -0.33 | 0.57 | 0.41 | 0.08 |
| Maximum | 1.00 | 1.00 | 0.70 | 1.00 | 0.82 | 0.99 | 1.00 | 1.00 |
| Standard deviation | 0.22 | 0.13 | 0.15 | 0.40 | 0.29 | 0.10 | 0.14 | 0.30 |
Source: Own creation.
Disclaimer/Publisher’s Note: The statements, opinions and data contained in all publications are solely those of the individual author(s) and contributor(s) and not of MDPI and/or the editor(s). MDPI and/or the editor(s) disclaim responsibility for any injury to people or property resulting from any ideas, methods, instructions or products referred to in the content. |
© 2026 by the authors. Licensee MDPI, Basel, Switzerland. This article is an open access article distributed under the terms and conditions of the Creative Commons Attribution (CC BY) license (http://creativecommons.org/licenses/by/4.0/).
Copyright: This open access article is published under a Creative Commons CC BY 4.0 license, which permit the free download, distribution, and reuse, provided that the author and preprint are cited in any reuse.