
Submitted:
13 July 2026
Posted:
14 July 2026
You are already at the latest version
Abstract
The prevailing paradigm attributing biotic mass extinctions to Large Igneous Province (LIP)-driven global hyperthermia and oceanic anoxia faces a fundamental sedimentological paradox: coal seams and carbonaceous shales — indicative of cool-temperate climates — are systematically developed in the strata of all five major Phanerozoic extinction events, while typical hot-climate indicators such as red beds and evaporites are conspicuously absent from those same intervals. This contradiction strongly suggests that the climatic backdrop of extinction intervals may be cold rather than hot. To test this possibility, we apply an a priori, falsifiable lithological criterion — the Cold Rule — that is independent of geochemical proxies. Taking coal and carbonaceous shales as cool-temperate indicators and red beds and evaporites as tropical indicators, we systematically compile published stratigraphic successions from key sections of all five mass extinctions, assign lithology to climate zones bed by bed, and examine three independent lines of evidence: climate reverse cycles, the timing of coal measures relative to extinction pulses, and the latitudinal differentiation of extinction. Each mass extinction event records a complete climate reverse cycle from red beds (warm stage) through evaporites (arid-hot stage) and coal and carbonaceous shales (cool-temperate stage) to cold-zone or glacial conditions at the extinction horizon, across all five events. The horizons of coal and carbonaceous shale development consistently predate the main extinction pulse, indicating that they represent the climatic prelude to extinction rather than synchronous products of a hyperthermal–anoxic crisis. Extinction intensity is highest at mid-latitudes, while low-latitude equatorial regions serve as relative biological refugia; extinction timing displays a systematic progression from high latitudes through mid-latitudes to low latitudes. On the basis of this primary sedimentological evidence, we propose the "Cooling-Driven Mass Extinction" hypothesis. Its causal chain operates through two timescales: in the short term, volcanic eruptions and/or bolide impacts trigger abrupt cooling through stratospheric aerosol forcing; in the long term, low temperatures suppress organic matter decomposition and enhance carbon burial efficiency, initiating a positive feedback in which cooling lowers atmospheric CO₂ and drives further cooling, ultimately contracting climate zones until the cold zone invades mid-to-low latitudes and triggers ecosystem collapse. This hypothesis accommodates all five mass extinctions within a single climate-driven framework. Its core predictions — that cool-temperate lithologies must predate the extinction horizon, that extinction timing must display a latitudinal progression from high to low latitudes, and that tropical lithological indicators must be systematically absent at extinction boundaries — have received preliminary empirical support in the data analysis presented here and are directly testable by future high-resolution stratigraphic work.
Keywords:
mass extinction
; Cold Rule
; climate reverse cycle
; latitudinal differentiation
; carbon burial
; Large Igneous Province
1. Introduction
Earth’s five Phanerozoic mass extinction events — especially the end-Permian (~252 Ma) and end-Cretaceous (~66 Ma) — represent the most dramatic turnovers in the history of life, and understanding their causal mechanisms is critical for assessing modern biodiversity crises (Schulte et al., 2010; Shen et al., 2011). The prevailing paradigm attributes these extinctions to a cascade of global hyperthermia and oceanic anoxia driven by Large Igneous Provinces (LIPs): short-term massive CO₂ emissions from LIP eruptions cause extreme warming, stall ocean circulation, trigger widespread anoxia, and ultimately drive extinction. This hypothesis gains apparent support from the geochronological coincidence between LIP activity and multiple extinction boundaries (Schlanger and Jenkyns, 1976; Arthur et al., 1988; Courtillot and Renne, 2003; Blackburn et al., 2013; Burgess and Bowring, 2015; Schoene et al., 2015; Sun W D and Liao R Q, 2020).
However, this mainstream hypothesis cannot account for a systematic contradiction in the sedimentary record: coal seams and carbonaceous shales are widely developed in strata immediately preceding and following all five mass extinctions, while typical hot-climate indicators — red beds, bauxites, and evaporites — are conspicuously absent from those same intervals. If global hyperthermia were the climatic backdrop of extinction, the abundant occurrence of coal and carbonaceous shale directly contradicts the fundamental physical principle that high temperatures accelerate organic matter decomposition and strongly inhibit carbon burial. This lithological inconsistency is both global and systematic, strongly suggesting that the climatic backdrop of mass extinctions may be cold rather than hot.
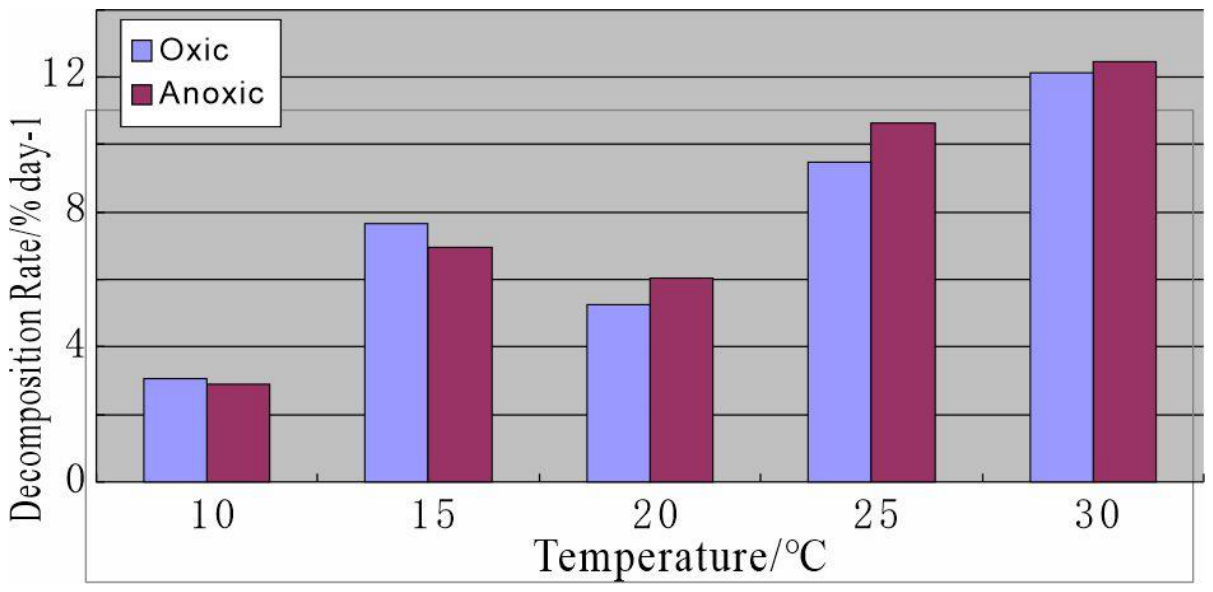
Resolving this contradiction requires an a priori lithological criterion independent of geochemical proxies — one whose validity rests on direct sedimentological evidence rather than on proxy calibrations subject to inadequately constrained prior assumptions. Over the past two decades, δ¹⁸O, TEX₈₆, and related proxies have repeatedly classified these organic-matter-rich intervals as products of hyperthermal events (Dal Corso et al., 2012; Hu X M et al., 2020; Judd et al., 2024; Zhao et al., 2025), yet these proxies have never been subjected to systematic correction for non-climatic biases. Physical experiments confirm that temperature exerts a far greater control on organic matter decomposition than redox state — a temperature increase from 10 °C to 30 °C raises mineralization rates by 3–4 times, whereas the difference between oxic and anoxic conditions at the same temperature is less than 10% (Wei et al., 2014; Chen et al., 2020), (see Section 2, Evidence 6). The “Cold Rule” proposed by Mao et al. (2025) provides precisely such a criterion: cross-validated by five independent lines of evidence, coal and carbonaceous shale are confirmed as faithful records of cool-temperate climate (mean annual temperature <5 °C), while red beds and evaporites are reliable indicators of hot climates (MAT >14 °C). The present study therefore advocates replacing the “Oxygen Rule” — in which anoxia is the primary control on organic matter preservation (Strøm, 1939; Tissot, 1979) — with the Cold Rule as the foundation for understanding carbon burial dynamics. Temperature is the primary controlling factor; redox conditions are secondary. This theoretical reorientation is the logical starting point for re-examining the climatic causes of mass extinctions.
The core question of this study is therefore: did the five mass extinctions occur during global hyperthermal periods, or during global cooling periods? This question connects to a spatial pattern that the hyperthermal hypothesis cannot explain internally: multiple mass extinctions show a distribution in which high latitudes went extinct first and extinction intensity decreases toward the equator, with low-latitude tropical regions serving as relative biological refugia (Wu et al., 2024). Under a hyperthermal scenario, the equatorial zone — most sensitive to further warming — should have suffered the most severe extinction; the opposite pattern is observed. The Cold Rule model — global cooling drives equatorward contraction of climate zones, producing severe environmental change at mid-latitudes and relative buffering at low latitudes — provides a logically consistent explanation for this spatiotemporal sequence.
This study further notes that the climatic legacy of mass extinction events is rooted in a fundamental asymmetry of the carbon cycle. During cooling periods, Cold Rule-driven carbon burial slowly accumulates vast organic carbon reservoirs over millions of years. When mass extinction destroys the biological carbon pump, the accumulated carbon can be released within tens of thousands to hundreds of thousands of years; yet reconstruction of carbon-fixing capacity requires millions of years or longer, constrained by the tempo of biological evolution. This order-of-magnitude difference in timescales — millions of years accumulating, tens of thousands releasing, millions reconstructing — is the deep cause of prolonged post-extinction greenhouse warming and severely lagged ecological recovery.
To address these questions, published stratigraphic sequences from key sections of all five mass extinction events are systematically compiled; lithological assemblages are identified layer by layer and assigned to climate zones using climate-sensitive lithologies — coal and carbonaceous shale versus red beds and evaporites — as a criterion independent of geochemical proxies. The study tests whether a unified reverse cycle from red beds and evaporites to coal and carbonaceous shale is present approaching each extinction boundary, and precisely determines the temporal relationship between the main extinction horizon and the underlying coal measures. On this basis, we propose the “Cooling-Driven Mass Extinction” hypothesis as a testable alternative to the hyperthermal–anoxia paradigm, and evaluate its core spatial prediction — a latitudinal progression in extinction timing from high to low latitudes — against available high-precision geochronological data. The overall research framework is summarized in Figure 1: starting from the sedimentological paradox, the Cold Rule is applied as an independent lithological benchmark, and through three tests (climate reverse cycle, coal-measure timing, and latitudinal progression) the unified “Cooling-Driven Mass Extinction” hypothesis is proposed.
2. The Cold Rule: A Lithological Benchmark with Multiple Independent Validations
The Cold Rule is an empirical criterion linking lithological assemblages to climate zones: coal and carbonaceous shale indicate cool-temperate, cold-humid climate (mean annual temperature, MAT <5 °C); red beds and bauxites indicate tropical climate (MAT >20 °C); evaporites indicate subtropical arid zones (MAT 14–20 °C) (Mao et al., 2025). This criterion is not a simple extrapolation from modern conditions but is grounded in cross-validation across six independent lines of evidence summarized in Table 1. The following provides a brief overview of each line of evidence; full documentation is given in Mao et al. (2025).
The Cold Rule is explicitly falsifiable, committing to the following conditions under which it would be refuted: (1) Modern falsification: if sustained net peat accumulation (rather than transient burial) were found in a modern climate zone with MAT >15 °C, the core mechanism of low-temperature-dominated carbon burial would fail; (2) Temporal falsification: if the coal measures of any extinction were found not to predate the main extinction pulse, the “coal-as-prelude” prediction would be falsified; (3) Spatial falsification: if mid-latitude extinction intensity were systematically no higher than at low latitudes, the “latitudinal progression” prediction would be falsified. These conditions, their testing methods, and current status are summarized in Table 2; all are directly testable through high-resolution stratigraphy and modern depositional monitoring, without recourse to geochemical proxies.
Figure 3.
Comparative experiment on organic matter decomposition rate under varying temperature and redox conditions in lake surface sediments. Decomposition rate increases ~3–4× as temperature rises from 10 °C to 30 °C, while the difference between oxic and anoxic conditions at the same temperature is <10% (after Wei et al., 2014; Chen et al., 2020).
Figure 3.
Comparative experiment on organic matter decomposition rate under varying temperature and redox conditions in lake surface sediments. Decomposition rate increases ~3–4× as temperature rises from 10 °C to 30 °C, while the difference between oxic and anoxic conditions at the same temperature is <10% (after Wei et al., 2014; Chen et al., 2020).
In this study the Cold Rule serves as an external verification benchmark independent of geochemical proxies. Its core value is that it provides a direct, lithology-based test that any paleoclimate reconstruction should be able to satisfy: if a reconstruction assigns a hyperthermal interpretation to a stratigraphic interval that contains coal or carbonaceous shale and lacks red beds and evaporites, it conflicts with first-order sedimentological evidence. The Cold Rule does not exclude other influences on coal distribution — such as plant evolutionary stage or paleogeographic configuration — but requires that any such influence be explicitly evaluated and justified where the lithological record conflicts with geochemical interpretations. Furthermore, the application of the Cold Rule in the early Paleozoic (particularly before the Ordovician, when land plants had not yet diversified) requires caution. For marine black shales, the climate-indicator significance should be cross-validated against independent glacial evidence (tillites, dropstones) rather than inferred from the shale itself.
A potential challenge to the Cold Rule comes from Bao et al. (2026), who attributed the latitudinal migration of coal-forming environments between the Paleozoic and Mesozoic to plant evolutionary factors — specifically the limited water-transport capacity of Carboniferous ferns and the appearance of white-rot fungi — and inferred a tropical temperature background (~25 °C) for Late Paleozoic equatorial coal formation in South China. Two observations qualify this interpretation. First, the paleoclimate reconstructions that underpin Bao et al.’s temperature estimate carry known systematic biases in the Paleozoic (discussed in Section 6.3), and their reliability requires independent lithological cross-validation. Second, the Late Paleozoic equatorial coal interval coincides precisely with the Carboniferous–Permian glaciation, when Gondwana developed the largest ice sheet of the Phanerozoic; under such ice-house conditions, low temperatures extended to near-equatorial latitudes, satisfying the cold threshold required for carbon burial. Plant evolution constrains the geographic range of coal-forming organisms; the Cold Rule constrains the temperature threshold for carbon burial efficiency. The two operate on different variables and are not mutually exclusive. The findings of Bao et al. (2026) are therefore not contradictory to the Cold Rule: Late Paleozoic equatorial coal formation represents carbon burial achieved by the dominant plant groups of the time in near-equatorial humid environments under global ice-house conditions, which does not negate the role of low temperatures in driving carbon burial efficiency. This growth–preservation distinction is sharpened by a temporal control on a single plate: the South China Plate remained at near-equatorial paleolatitudes from the Late Carboniferous to the Late Permian (Lin J L, 1987; Wu H N et al., 1990), yet formed little coal during the warmer Late Carboniferous and developed thick Longtan Fm. coal measures only as global cooling intensified in the Late Permian. With latitude — and thus the growth setting for coal-forming plants — held essentially constant, this shift from non-coal-forming to coal-forming tracks temperature-controlled preservation rather than plant geography, promoting temperature from a background factor to the decisive switching variable.
The bilateral distribution of coal in the Late Paleozoic — equatorial coal in South China alongside polar coal in Antarctica and Siberia (Isbell et al., 2003) — provides the strongest single test of the Cold Rule framework. Modern Arctic permafrost stores 1,500–1,700 Pg C (Hugelius et al., 2014), confirming that carbon storage is highest precisely where temperatures are lowest. The traditional warm-wet coal model faces an irresolvable contradiction with polar coal: if coal requires tropical high temperatures, polar coal is inexplicable. Under the Cold Rule, both polar and equatorial coal are markers of the cool-temperate zone position — polar coal records the cool-temperate zone expanding into formerly cold polar regions as the ice sheet contracted, while equatorial coal records the cool-temperate zone expanding toward the equator as global cooling intensified. The simultaneous development of both during the Carboniferous–Permian glaciation is the bilateral climate-zone compression expected under global ice-house conditions: the cool-temperate zone expanded both equatorward and poleward as the cold zone contracted from above and the subtropical zone retreated from below. Coal marks the position of the cool-temperate zone, not the presence of high temperatures.
Independent sedimentological validation of the red-bed–tropical-climate criterion comes from Liu et al. (2024a, 2024b), who documented widespread purple-red marine carbonates (Pagoda Fm. and related units) in South China and the Tarim Basin during the Middle to early Late Ordovician (Darriwilian–early Katian), when the South China Plate occupied low paleolatitudes (~10°S–20°S). Global paleoclimate reconstructions consistently identify this interval as the Phanerozoic’s maximum marine transgression and one of its strongest greenhouse climate episodes. The red carbonates developed within this independently confirmed tropical backdrop constitute direct sedimentological evidence for the red-bed–tropical-climate association, entirely independent of the Cold Rule’s own validation framework (Table 1). Critically, the South China Plate remained near the equator throughout the transition from this greenhouse maximum to the Hirnantian glaciation (Chen et al., 2004); this climate change therefore cannot be attributed to plate-drift-driven latitudinal shift, but reflects a genuine migration of global climate zones.
Mao X P et al. (2026) conducted a systematic tracking of the spatiotemporal distribution of Jurassic coal and red beds globally and identified a key pattern: in the Early Jurassic, coal and red beds developed stably at high and low latitudes respectively, without spatial overlap; from the Middle to Late Jurassic, as climate cooled, both belts migrated equatorward in a paired fashion. This “paired coal–red bed migration” demonstrates that even during the Jurassic–Cretaceous greenhouse interval, the accumulation and preservation of organic carbon remained under strict latitudinal–temperature threshold control, with the coal-development belt consistently confined to the relatively low-temperature zone distant from the equator. If high organic carbon deposition were controlled solely by “anoxia,” it would not display such a systematic latitudinal migration pattern. This observation is consistent with the Cold Rule prediction that carbon burial requires cool-temperate (<5 °C) conditions and provides a unified explanatory framework for coal formation during greenhouse background periods.
Additional independent support comes from several research groups working in different regions and time intervals. Lu et al. (2025), studying the Lower Cambrian Qiongzhusi Fm. shales in the Weiyuan area, found that high organic carbon intervals do not correspond to warm climate but to lower degrees of chemical weathering under cold, dry conditions, indicating that organic matter enrichment was controlled by low-temperature preservation rather than high productivity. Shao et al. (2024), in a systematic analysis of multiple thick coal seams in the Ordos Basin spanning the late Carboniferous to early Permian glacial interval, found that peatlands with higher net primary productivity developed during cooling stages rather than during interglacial greenhouse conditions, further supporting the coupling between low temperatures and enhanced carbon burial efficiency. These independent lines of evidence, from the Cambrian and the Carboniferous–Permian transition respectively, indicate that the relationship revealed by the Cold Rule has cross-era universality. Modern process observations are consistent: Gudasz et al. (2010), Lundin et al. (2015), and Boscolo-Galazzo et al. (2021) independently confirmed from lakes, high-latitude wetlands, and the ocean twilight zone respectively that low temperature is the core controlling factor for long-term organic carbon preservation.
3. Data and Methods
3.1. Data Sources
All stratigraphic, lithological, fossil, and paleolatitude data were compiled from published literature; no new field sampling or laboratory testing was conducted. Data fall into three categories: (1) modern and historical validation data for the Cold Rule; (2) key section data for the five mass extinction events (LOME, F-F, PTB, T-J, K-Pg); and (3) latitudinal differentiation comparison data. Only publicly available descriptive information — lithological descriptions, stratigraphic sequences, and fossil zone assignments — was used; no original raw analytical data tables were incorporated.
Present-day observational and Mesozoic–Cenozoic geological data used to validate the Cold Rule are drawn from the following sources. Modern sediment TOC latitudinal distribution data are from the Global Lakes and Wetlands Database (GLWD), the Global Soil Organic Carbon Map (GSOCmap), and measured Chinese data (after Mao et al., 2025). Global latitudinal statistics of coal, evaporites, and red beds since the Permian are from Ziegler et al. (2003) and Parrish et al. (1982), with Figure 2 modified after Ziegler et al. (2003). Organic matter mineralization temperature-control experiment data are from Chen et al. (2020) and Wei et al. (2014).
Key section data for each of the five events are as follows: LOME — primarily the Upper Yangtze region, after Rong et al. (2012), Chen et al. (2004), Shen J J et al. (2023), and Xu J L (2024); F-F — primarily the Rhenish Massif, Germany, and the Moroccan Meseta, after Wang Y Y et al. (2020) and Kaiser et al. (2006); End-Permian — primarily South China and global correlation sections, after Shen et al. (2011), Li S Z et al. (2024), and Mou et al. (2024); End-Triassic — primarily the Xujiahe Fm. (Sichuan Basin) and Yanchang Fm. (Ordos Basin), after Mao X P et al. (2026), Mou et al. (2024), and Haq et al. (1987); K-Pg — primarily global representative sections including North America and the Deccan region, India, after Schulte et al. (2010), Scotese et al. (2021), and Schoene et al. (2015). Latitudinal comparison data follow the plate reconstruction model of Scotese et al. (2021); extinction intensity and time-sequence data are from Wu et al. (2024), Shen et al. (2011), and Li X S et al. (2023).
3.2. Climate-Sensitive Lithological Criteria
The lithology–climate zone correspondences applied in this study follow the Cold Rule (Section 2), which recognizes four climate zones on the basis of climate-sensitive sedimentary assemblages. Tropical conditions (MAT >20 °C) are indicated by red clastic rocks, red and purplish-red carbonates, bauxites, and carbonate reefs with associated reef limestones — collectively the red lithological series. Subtropical arid-belt conditions (MAT 14–20 °C) are indicated by evaporites (gypsum, rock salt) and organic-poor shales — the white lithological series. Cool-temperate cold-humid conditions (MAT <5 °C) are indicated by coal and carbonaceous shale (TOC >2%) — the black lithological series. Cold and polar conditions (MAT ≤0 °C, glacial) are indicated by tillites, dropstones, and cold-water shelly limestones with impoverished fauna, of which the Hirnantian Guanyinqiao Bed is the type example used in this study.
Where a stratigraphic unit contains mixed lithologies, classification follows the lithology with the most unambiguous climate-zone signal. Where no lithology carries a clear climate-zone signal, the unit is excluded from countercycle identification.
3.3. Data Integration and Analysis
Analysis proceeded in four steps. First, lithological standardization: described lithologies were converted into color codes (R/W/B/Blue) per Section 3.2. Second, climate countercycle identification: each mass extinction event was examined for the complete or partial red-to-white-to-black-to-blue cooling sequence. Third, temporal relationship determination: biostratigraphic zones or high-precision isotopic ages were used to establish the relative timing of coal measures versus the main extinction pulse. Fourth, latitudinal comparative analysis: sections were divided into high (>60°), mid (30–60°), and low latitude (<30°) groups and compared for extinction intensity and timing. High-latitude regions commonly have incomplete stratigraphic records due to glacial erosion and non-preservation, so their extinction signals may be underrepresented; the main extinction record is more reliably reflected in complete mid-latitude sequences.
All analyses were conducted independently of geochemical temperature proxies (δ¹⁸O, TEX₈₆, Mg/Ca, etc.) to avoid circular reasoning.
3.4. Summary Data Table
To present clearly the data sources and lithology–climate zone identification results for the key sections of each event, the five mass extinction events are summarized in Table 3. The table lists, for each event, the representative section location, paleolatitude, stratigraphic sequence (younger to older), main lithologies, climate zone assignments (R/W/B/Blue per Section 3.2), and primary data sources. Climate zone sequences read in the same direction as the stratigraphic sequences. Notes on the Blue designation for each event and the mechanistic basis for the K-Pg Blue assignment are provided in the table note below.
4. Results
4.1. Late Ordovician Mass Extinction (LOME)
The Upper Yangtze stratigraphy provides a complete record for testing the climatic causation of mass extinctions (Table 3 and Table 4). The sequence records a complete red-to-white-to-black cooling countercycle: from the tropical red Pagoda Limestone stage, the climate cooled progressively through the subtropical Linxiang Limestone to the cool-temperate Wufeng black shales, with climate zones migrating continuously southward. After the glaciation, a warming positive cycle developed, progressing from the Long-1 black shale through the Long-2 lean shale and Xiaoheba sandstone to the Rongxi red beds. The complete lithological sequence, climate zone assignments, and cycle stages are detailed in Table 4.
The basal Pagoda and Linxiang limestones (including purplish-red intervals) developed during the Middle to early Late Ordovician — the interval of the greatest marine transgression of the Phanerozoic and a confirmed greenhouse climate maximum (Liu et al., 2024a, 2024b). The red carbonates developed within this confirmed tropical backdrop provide independent evidence for the red-bed–tropical-climate association. The cooling trend advanced beyond the Wufeng Fm. into the Guanyinqiao Bed — a product of the Hirnantian glaciation (Chen et al., 2004; Shen J J et al., 2023) — during which the first Phanerozoic mass extinction occurred.
The Wufeng–Longmaxi Fm. represents marine black shale, genetically distinct from continental coal measures. Independent evidence — glacial deposits and sharp sea-level fall — has confirmed this interval as the third Phanerozoic glaciation (Sun W D and Liao R Q, 2020), so the cold-climate interpretation rests on independent glacial evidence rather than on the climate-indicator properties of the black shale itself. The organic enrichment mechanism is consistent with the Cold Rule: low temperatures suppress microbial decomposition, enabling net organic carbon accumulation, as confirmed by the modern observation that POC export flux in high-latitude ocean basins exceeds that of low-latitude regions.
Constrained by this independent glacial evidence, the mass extinction did not occur during the Wufeng organic-rich shale stage (cool-temperate zone) but in the overlying Guanyinqiao Bed (cold zone/glacial). The Wufeng and Long-1 black shale units bracket the extinction horizon, corresponding to the cooling phase and the deglaciation phase respectively (Mei X M and Cai C F, 2024). These organic-matter-rich deposits are the prelude to the mass extinction and the marker of subsequent warming, while the extinction itself corresponds to the arrival of the cold zone. This temporal distinction — cool-temperate black shales preceding, and post-glacial black shales following, the cold-zone extinction horizon — is the defining stratigraphic signature of the cooling-driven model at the LOME boundary.
4.2. Late Devonian Frasnian–Famennian Extinction (F-F)
The F-F mass extinction is associated with widespread development of black shales at and around the extinction boundary (Table 3). The Lower and Upper Kellwasser black shale horizons bracket the main extinction level (Wang Y Y et al., 2020). In South China, the late Frasnian is characterized by carbonate platform sedimentation; by the early Famennian, black shales and cherts are widespread. At reference sections in the Rhenish Massif, Germany, and the Moroccan Meseta, a clear carbonate-to-black-shale lithological transition is visible (Kaiser et al., 2006).
The stratigraphic succession records the cooling portion of the climate countercycle, from the warm-stage carbonate platform through the cool-temperate black shales to the cold-zone extinction horizon. The late Frasnian carbonate platform, developed under warm-temperate to subtropical conditions, represents the pre-extinction warm stage. At the onset of the Kellwasser event, this platform was succeeded by cool-temperate black shale deposition, indicating that cooling preceded the main extinction pulse. As cooling continued, cold-zone conditions developed, triggering the main F-F extinction. The Viluy LIP (Courtillot and Renne, 2003) acted as the cooling trigger and amplifier: the short-term volcanic winter effect initiated cooling, while subsequent enhanced carbon burial under low temperatures sustained the cooling trend (see Section 5.2 for the full mechanism). Post-F-F recovery is marked by a return to carbonate platform conditions in the early Famennian, consistent with the post-extinction warming pattern observed across all five events.
4.3. End-Permian Mass Extinction
The end-Permian extinction (~PTB) is the largest Phanerozoic biotic crisis, eliminating >90% of marine species and ~70% of terrestrial vertebrates (Shen et al., 2011). Traditional explanations attribute it to Siberian LIP CO₂ emissions causing global hyperthermia and oceanic anoxia. The sedimentary record, however, is inconsistent with this interpretation at multiple scales.
The mid-to-late Permian stratigraphy records a complete climate countercycle (Table 3; see also Table 1, Evidence 3): the sequence passes from Mid-Permian tropical carbonates and red beds (Qixia Fm.), through the Mid-Permian late Gufeng Fm. black shale, which records the onset of cooling, to the thick Late Permian Longtan/Dalong Fm. coal measures under cool-temperate conditions, culminating in the cold-zone PTB boundary layer. Although the scale of carbon burial during this interval does not reach the Early Permian glacial peak, it records the establishment of a sustained cooling trend. The Late Permian Longtan/Dalong Fm. (Wujiaping–Changhsing stages) constitutes a thick coal-measure succession (Li S Z et al., 2024); the overlying Lower Triassic Feixianguan Fm. red beds signal post-extinction climatic recovery.
The Emeishan LIP (~260 Ma) and Siberian LIP (~252 Ma) eruptions triggered successive phases of cooling through stratospheric aerosol forcing and subsequent carbon burial enhancement (see Section 5.2 for the full mechanism). The Gufeng Fm. black shale represents the early lithological response to this cooling; the Longtan/Dalong coal measures are products of a cold-humid climate, not of hyperthermal anoxia.
The vertical lithological succession provides an internal test of the hyperthermal hypothesis. The Longtan/Dalong coal measures are immediately overlain, across the PTB boundary, by the Feixianguan red beds — a lithology the mainstream paradigm itself recognizes as indicative of hyperthermal conditions. If the coal measures are also products of extreme heat and anoxia, then two diametrically opposed lithologies within the same section are assigned an identical climate interpretation, which is internally inconsistent. The Cold Rule resolves this succession as a coherent cycle progressing from cool-temperate conditions (Longtan/Dalong coal measures) through the cold-zone extinction horizon (PTB boundary layer) to post-extinction tropical recovery (Feixianguan red beds).
The hyperthermal hypothesis also fails a spatial prediction test. If Siberian LIP CO₂ emissions raised tropical sea surface temperatures by ~10–15 °C (Sun Y et al., 2012), climate zones should have shifted markedly poleward, warming formerly cold high-latitude regions and thereby initiating carbon burial there. The predicted stratigraphic consequence — widespread latest Permian–Early Triassic coal measures and black shales at high latitudes — is not observed: Early Triassic organic-rich sediments in Siberia and the Canadian Arctic are sparse and limited in extent, while low-latitude regions are dominated by thick red beds and evaporites indicative of hot, arid conditions. Under a hyperthermal scenario, the tropics should have experienced the most severe extinction — contradicting the well-documented pattern of low-latitude refugia at the PTB (Wu et al., 2024).
High-precision U-Pb geochronology confirms that the PTB extinction was not globally synchronous but followed a clear latitudinal progression: high-latitude Gondwana regions collapsed earliest (~252.31 Ma) and equatorial regions latest (~251.88 Ma), spanning nearly one million years (Shen et al., 2011; Wu et al., 2024). The ~30 Myr long-term Permian cooling trend and the million-year-scale latitudinal progression of the extinction are complementary rather than contradictory: long-term cooling progressively compressed climate zones toward the tropics, pushing the global ecosystem toward a critical threshold. The Siberian LIP eruption then provided the final thermal perturbation that pushed high-latitude ecosystems across the cold-zone threshold, but this threshold was not crossed simultaneously at all latitudes — high-latitude regions collapsed first, while low-latitude regions were not reached by the expanding cold zone until hundreds of thousands of years later. The PTB mass extinction was therefore not an instantaneous global event but a spatially progressive process, with high-latitude collapse preceding equatorial collapse by nearly one million years.
This high-to-low-latitude diachronous pattern is itself an independent test distinguishing “death by heat” from “death by cold.” If hyperthermal lethality were correct, equatorial low latitudes — with the greatest warming and highest absolute temperatures — should have collapsed first, while high latitudes became refugia; the record shows the opposite (Wu et al., 2024). The high-resolution SIMS oxygen-isotope record of Chen et al. (2016) further shows that the ~10 °C rapid warming occurred after the main extinction pulse — lagging the negative carbon-isotope excursion by ~81 kyr and the extinction onset by ~23 kyr — indicating that warming was a later participant, not the cause. That record also documents a pronounced early-Changhsingian cooling event (~8 °C, ~0.2 Myr), consistent with the Cold Rule’s predicted pre-extinction equatorward expansion of the cool-temperate zone (Chen et al., 2016). The direction of spatial progression is thus itself the discriminant: the warming hypothesis predicts equatorial regions die first, the cooling hypothesis predicts high latitudes die first, and the evidence supports the latter.
4.4. End-Triassic Mass Extinction
The end-Triassic mass extinction (T-J boundary) broadly coincides with the eruption of the Central Atlantic Magmatic Province (CAMP) (Blackburn et al., 2013). Traditional explanations attribute the extinction to global hyperthermia, marine acidification, and anoxia caused by CAMP CO₂ emissions. The Triassic lithological record, however, is inconsistent with a hyperthermal interpretation.
The entire Triassic sequence records a systematic red-to-white-to-black cooling countercycle (Table 3; Mao X P et al., 2026). Early Triassic red clastic rocks (Feixianguan Fm. in the Sichuan Basin, Liujiagou Fm. in the Ordos Basin) record tropical hot conditions; Middle Triassic evaporites (Leikoupo Fm. in the Sichuan Basin) record the subtropical arid belt. Late Triassic thick continental coal measures (Xujiahe Fm. in the Sichuan Basin, Yanchang Fm. in the Ordos Basin) then record cool-temperate cold-humid conditions. This systematic lithological progression represents a sustained ~50 Myr cooling process (252–201 Ma). Throughout the Late Triassic (Carnian to Rhaetian), global sea level fell continuously and continental coal-bearing sediments developed widely within and around Pangaea (Haq et al., 1987; Hallam, 1992), indicating a global regression consistent with climate-driven cooling.
The end-Triassic mass extinction occurred at the terminal point of this long-term cooling trend. The Late Triassic Xujiahe/Yanchang coal measures indicate that cool-temperate conditions had already been established; as cooling continued to the T-J boundary, cold-zone conditions developed, triggering the mass extinction. Consistent with the volcanic cooling mechanism described in Section 5, the CAMP eruption acted as a cooling trigger and amplifier through stratospheric aerosol forcing rather than as a hyperthermal driver — the role traditionally assigned to it. Early Jurassic climatic warming marked the onset of a new warming cycle.
4.5. End-Cretaceous Mass Extinction (K-Pg)
The end-Cretaceous mass extinction is closely associated with two triggering mechanisms — eruption of the Deccan LIP (Schoene et al., 2015) and the Chicxulub bolide impact (Schulte et al., 2010) — the stratigraphic context of which is summarized in Table 3.
The Cretaceous as a whole was a greenhouse interval, lacking a multi-million-year gradual cooling prelude comparable to those preceding the other four extinctions. At the K-Pg boundary itself, however, Scotese et al. (2021) identified a short-lived but pronounced cooling episode. Sulfate aerosols from the Deccan eruptions, together with impact ejecta and combustion products from the Chicxulub event, generated a sustained reduction in solar insolation lasting months to years, triggering volcanic and impact winters that caused acute short-term cooling and severe reduction in photosynthetically active radiation (Schulte et al., 2010; Schoene et al., 2015).
The K-Pg extinction represents direct entry into cold-zone conditions through abrupt short-term cooling, without the gradual cool-temperate prelude recorded by the other four events. This accounts for the absence of thick precursor coal measures at the K-Pg boundary: the cooling duration was insufficient to generate geologically recognizable coal-forming intervals, and the organic carbon response is restricted to thin organic-matter-rich deposits near the boundary layer. The ultimate mechanism — cold-zone conditions causing primary productivity collapse and ecosystem failure — is common to all five events, though the pathway to cold-zone conditions differs fundamentally for K-Pg. Independent lithological testing of this mechanism in the K-Pg record requires higher-resolution sedimentological investigation. Climatic recovery in the early Paleogene marked the onset of a new warming trend, consistent with the post-extinction pattern of climatic rebound observed after each of the five events.
4.6. Lithological Test of Mesozoic–Cenozoic Hyperthermal Events
To further test the universality of the Cold Rule and evaluate whether the hyperthermal events recognized by traditional geochemical proxies are consistent with the lithological record, five typical Mesozoic–Cenozoic events were selected (end-Permian, TOAE, OAE1a/OAE2, CPE, PETM) and tested against actual mid-to-low-latitude lithological development. Results are shown in Table 5.
Hu X M et al. (2020) show that both positive δ¹³C excursions (OAE1a, OAE2) and negative excursions (PTB, TOAE, PETM) have been interpreted as hyperthermal — a framework that accommodates two opposing geochemical signals without making distinct predictions for each and is therefore not independently falsifiable on geochemical grounds alone. Taking the PTB as an illustrative case: Joachimski et al. (2012) document a δ¹⁸O decrease of ~2‰ at the end-Permian (~8 °C warming), yet this negative excursion intensifies further into the Early Triassic. If δ¹⁸O negative excursions indicate warming, the Early Triassic should be significantly warmer than the PTB; yet the Early Triassic is already the most widely accepted hot period in the Phanerozoic, with globally abundant red bed development. The PTB “hyperthermal” label therefore has no independent δ¹⁸O support but relies on a pre-assumed thermal background. This suggests that δ¹⁸O alone cannot provide an independent calibration of warming magnitude at the PTB. More broadly, these observations indicate that in certain intervals geochemical proxy interpretations have been prioritized over contradictory lithological evidence, warranting reassessment of the relative evidential weight accorded to each.
Only the PETM event’s mid-to-low-latitude lithologies (Arctic coal/carbonaceous shale; mid-latitude red beds) are broadly consistent with a hyperthermal interpretation. The mid-to-low-latitude strata of the PTB, TOAE, and CPE events contain coal and carbonaceous shale — cold-humid climate products — rather than the tropical red beds or bauxites expected under hyperthermal conditions. During OAE1a/OAE2, high-latitude coal and black shale alongside low-latitude red beds is precisely the latitudinal differentiation predicted by the Cold Rule under cold-zone expansion, not globally uniform tropical conditions. Taken together, these results indicate that the hyperthermal interpretation of these events lacks consistent lithological support. The Cold Rule framework, by contrast, accounts for all four non-PETM events as cold-climate intervals and correctly predicts the latitudinal differentiation observed during OAE1a/OAE2.
5. The Cooling-Driven Mass Extinction Hypothesis: A Unified Framework
5.1. Hypothesis Statement
Based on the Cold Rule framework and the lithological tests of the five mass extinctions, we propose the “Cooling-Driven Mass Extinction” hypothesis. The causal chain operates through three sequential stages. In the short term, LIP eruptions and/or bolide impacts generate volcanic or impact winters through stratospheric sulfate aerosols, triggering abrupt cooling; ice sheet expansion and increased albedo sustain and amplify this cooling. In the long term, low temperatures suppress organic matter mineralization, shifting the carbon cycle toward net organic carbon accumulation; atmospheric CO₂ declines, the greenhouse effect weakens, and cold climate becomes self-reinforcing. Ultimately, climate zones contract toward the equator; as the cold zone expands into mid-to-low latitudes, habitats collapse and mass extinction ensues.
Three core points follow from this causal chain.
First, the proximate cause of mass extinction is habitat loss and ecosystem collapse driven by equatorward expansion of the cold zone. Primary producers — the energetic foundation of marine and terrestrial food webs — generally lack the capacity for rapid equatorial migration; as cold-zone conditions invade formerly temperate latitudes, the collapse of primary productivity cascades upward through primary consumers, secondary consumers, and apex predators in sequence. Even organisms with migratory capacity cannot survive the loss of their food base. Cold-zone conditions, with extreme low temperatures and very short growing seasons, are inherently unsuitable for sustaining high biomass, and ecosystems at mid-latitudes have neither sufficient time to adapt physiologically nor adequate space to migrate equatorward as the tropical zone itself is simultaneously compressed.
Second, coal and carbonaceous shale are the lithological prelude to mass extinction, not its climatic backdrop. In all five mass extinctions except K-Pg, the extinction occurred during a further cooling stage after the coal measures had already developed. Coal measures are the lithological marker of climate reaching the cool-temperate zone; the extinction itself is the result of the cold zone arriving subsequently. This temporal ordering — cool-temperate lithologies preceding the extinction horizon — constrains the causal direction: a scenario in which extinction causes cooling would produce the opposite sequence, with the cooling signal appearing after rather than before the extinction. The consistent observation of coal measures predating the extinction horizon across all five events is therefore not a coincidence but a mechanistic prediction of the cooling-driven model.
Third, Large Igneous Provinces act as cooling triggers and amplifiers rather than as drivers of hyperthermal conditions. The short-term stratospheric aerosol effect initiates cooling; the long-term positive feedback between low temperatures and enhanced carbon burial efficiency — cooling → suppressed organic matter decomposition → enhanced carbon burial → atmospheric CO₂ decline → further cooling — sustains and locks in cold climate. The CO₂ released by volcanism can, through these combined effects, be offset or exceeded by the subsequently enhanced carbon sink.
5.2. Physical Mechanism: Volcanism and Climate Cooling
Volcanic eruptions affect climate through effects that operate on two distinct timescales. The short-term effect (months to years) involves SO₂ oxidation to stratospheric sulfate aerosols, which attenuate incoming shortwave radiation and cool the surface — the volcanic winter effect, confirmed by the 1991 Pinatubo eruption (~0.5 °C global cooling; Lucht et al., 2002).
The long-term climate effect of volcanism is more complex. The prevailing view holds that volcanic CO₂ dominates after aerosols dissipate, driving warming. However, recent evidence suggests that long-term cooling may prevail instead. Cooling triggers ice sheet expansion, raising global albedo and sustaining the temperature decrease. Critically, cooling itself directly enhances organic carbon burial efficiency: low temperatures suppress microbial organic matter mineralization by 3–4× over the 10 °C–30 °C range (Wei et al., 2014; Chen et al., 2020), enabling net organic carbon accumulation in sediments over geological timescales.
Unlike the mainstream productivity-driven carbon burial model, the Cold Rule framework does not require explosive growth in marine primary productivity. Instead, it invokes a preservation efficiency advantage: cold regions achieve higher carbon storage than warm regions even when net primary productivity is lower, because decomposition rates are disproportionately reduced (Mao et al., 2025). Modern cool-temperate peatlands and lakes systematically exhibit higher TOC than tropical equivalents regardless of productivity, confirming this relationship.
As cooling continues, the cool-temperate zone expands equatorward, enlarging the geographic area of efficient carbon burial. Global carbon burial therefore accelerates through two simultaneous effects — increasing preservation efficiency and expanding areal extent — transferring large quantities of atmospheric CO₂ to the sedimentary sphere. This initiates a positive feedback in which cooling enhances preservation efficiency, accelerating carbon burial, lowering atmospheric CO₂, and driving further cooling.
Two independent case studies support this mechanism. The first concerns the Emeishan LIP (ELIP, ~260 Ma): during this eruption atmospheric CO₂ did not rise but fell significantly, from ~700 ppm to ~350 ppm (Shen J H et al., 2026), with subsequent development of thick Longtan/Changxing coal measures in South China, indicating that the volcanic activity triggered net carbon sink conditions. The second case involves Late Ordovician volcanism: widespread K-bentonites and ash layers in the Wufeng–Longmaxi black shales confirm intermittent large-scale eruptions (Hu Y H et al., 2009; Du X B et al., 2022), while independent glacial evidence — tillites and sharp sea-level fall — confirms the coeval Hirnantian glaciation as the third Phanerozoic glaciation (Sun W D and Liao R Q, 2020). Because glacial deposits are a geological marker of glaciation established entirely independently of the Cold Rule, this case provides external validation of the volcanic–cooling–carbon burial mechanism.
Initiation of this positive feedback requires that cooling persist long enough for low-temperature inhibition of organic matter decomposition to accumulate in the sedimentary record. The K-Pg event illustrates this threshold condition. Short-term cooling from the Chicxulub impact and Deccan volcanism lasted only years to decades — the stratospheric lifetime of sulfate aerosols — well below the threshold for long-term carbon burial feedback. Once aerosol effects dissipated, continued Deccan CO₂ emissions drove long-term warming. The K-Pg event therefore produced no thick precursor coal measures; its organic carbon response is restricted to centimetre-to-decimetre-scale beds at the boundary layer. This inverse relationship between cooling duration and carbon burial scale corroborates a core prediction of the feedback model.
Independent support comes from Mei X M and Cai C F (2024), whose systematic study of Chinese marine source rocks shows that the main Proterozoic and Paleozoic source rock intervals concentrate in deglaciation periods — immediately after leaving the cold zone, when climate remained relatively cold. This finding is temporally consistent with the Cold Rule prediction and provides cross-validation from hydrocarbon source rock research independent of the extinction record.
The Cold Rule predicts that where short-term aerosol-driven cooling triggers carbon burial enhancement sufficient to exceed volcanic CO₂ warming, atmospheric CO₂ should undergo a net decrease — a prediction preliminarily supported by the ELIP record (Shen J H et al., 2026). This mechanism does not preclude short-term warming before the feedback is initiated, when CO₂ forcing temporarily dominates. Why the Siberian LIP’s large CO₂ emissions left no clear long-term warming signal remains an open question. The carbon burial positive feedback mechanism described above is currently semi-quantitative; its threshold conditions and timescales require numerical testing through coupled carbon cycle–climate models.
Taken together, these lines of evidence indicate that Large Igneous Provinces act as cooling triggers and amplifiers rather than as hyperthermal drivers. The CO₂ released by volcanism can, through the combined short-term aerosol effect and long-term enhancement of carbon burial efficiency, be offset or exceeded by the subsequently enhanced carbon sink (Mao X P et al., 2026).
5.3. Unified Explanation for the Five Extinctions
Each of the five Phanerozoic mass extinction events can be accommodated within the cooling-driven framework, with the lithological sequence of each recording a recognizable stage of the same causal chain.
The Late Ordovician (LOME) event was driven by the combined effect of Gondwana ice sheet expansion and coeval volcanism (Hu Y H et al., 2009; Du X B et al., 2022), which produced the Wufeng organic-rich black shales under cool-temperate conditions and subsequently drove the ecosystem into the Hirnantian cold zone, triggering the first Phanerozoic mass extinction.
The Late Devonian F-F event was initiated by Viluy LIP volcanism (Courtillot and Renne, 2003), which caused the carbonate platform to give way to Kellwasser black shales under cool-temperate conditions and then to cold-zone conditions at the main extinction horizon.
The end-Permian extinction was driven by the successive eruptions of the Emeishan and Siberian LIPs. Cooling initiation is recorded by the Gufeng Fm. black shale, which gave way to the thick Longtan/Dalong coal measures under cool-temperate conditions before the PTB cold-zone boundary was reached and the largest Phanerozoic mass extinction occurred.
The end-Triassic event followed a ~50 Myr Triassic cooling trend amplified by CAMP eruption (Blackburn et al., 2013). The Xujiahe/Yanchang coal measures record the cool-temperate stage, followed by cold-zone conditions at the T-J boundary and the associated mass extinction.
The K-Pg event differs from the preceding four in pathway but not in ultimate mechanism. Deccan volcanism combined with the Chicxulub bolide impact triggered abrupt short-term cooling sufficient to push the ecosystem directly into cold-zone conditions without the gradual cool-temperate prelude recorded by the other four events. Because the cooling lasted only years to decades — the approximate stratospheric lifetime of sulfate aerosols — it was insufficient to generate geologically recognizable coal measures; the organic carbon response is restricted to centimetre-to-decimetre-scale organic-matter-rich beds at the boundary layer, which lies below the Cold Rule’s lithological recognition threshold. The underlying physical mechanism — solar radiation attenuation causing cooling and primary productivity collapse — is the same as in the preceding four events, but independent lithological testing of this mechanism in the K-Pg record requires higher-resolution sedimentological investigation.
6. Discussion
6.1. Carbon Cycle Asymmetry: Deep Mechanism of Post-Extinction Climate Effects
The foregoing argument has addressed the Cooling-Driven Mass Extinction hypothesis from the perspectives of lithological records and spatiotemporal distribution. A deeper question remains: why does post-extinction greenhouse warming persist far longer than the direct effects of any volcanic pulse? The end-Permian mass extinction was followed by a ~7 Myr “coal gap” (250–243 Ma) (Retallack et al., 1996) and prolonged extreme greenhouse conditions whose duration far exceeds any known volcanic aerosol residence time. The answer lies in the intrinsic dynamics of the carbon cycle. The carbon burial mechanism revealed by the Cold Rule implies a fundamental asymmetry between the formation and release of organic carbon reservoirs: there is a severe temporal mismatch between the timescales of carbon accumulation and carbon release. During cooling intervals, Cold Rule-driven carbon burial operates continuously and efficiently over millions of years, slowly building vast organic carbon stores in the lithosphere (Sigman and Boyle, 2000). When a mass extinction event destroys the ecosystem and structurally collapses the biological carbon pump, the accumulated carbon reservoir is oxidized and released within tens of thousands to hundreds of thousands of years — accumulation requires millions of years, release requires only tens of thousands.
More critically, reconstruction of the ecological carbon-fixing capacity cannot proceed synchronously with carbon release. The sequential steps of key species evolutionary innovation, community structure assembly, and biogeographic dispersal are each contingent on the preceding step, their rates governed by the intrinsic tempo of biological evolution (Chen and Benton, 2012). This reconstruction requires millions of years or longer. The post-extinction warming period is therefore an unequal race: on one side, the ignited carbon reservoir releases and carbon accumulates as burial capacity is lost; on the other, the carbon-fixing function is only slowly being reassembled. Carbon is released at a rate of tens of thousands of years while the carbon-fixing function recovers at a rate of millions of years — this speed differential determines both the duration and intensity of the greenhouse effect and the irreversibility of warming. At the close of the last deglaciation, northern peatland carbon sinks lagged ice-sheet retreat by millennia — North American peat initiation reached 50% completion nearly 3,000 years after the Laurentide ice sheet had halved (Gorham et al., 2007), and Hudson Bay Lowlands peat development lagged by a median of ~3,500 years (Glaser et al., 2004). On geological timescales, inner-shelf ecological recovery across the Ordovician–Silurian transition in South China lasted ~3 Myr (Tang et al., 2025), and the Early Triassic global coal gap ~7 Myr (Retallack et al., 1996).
The comparison between the Carboniferous–Permian (C-P) transition and the PTB illustrates how the proximity of the coal-forming belt to the equator scales with extinction severity. Using present-day latitudes (Parrish et al., 1982; Ziegler et al., 2003), the main C-P coal belt was located at 35–50°N (North China Taiyuan Fm. thick coals) and 25–35°S (eastern Australia coal measures); the South China Liangshan Fm. coals (today ~20–30°N) were of poor quality and sporadic distribution, at the southern margin of the coal-forming belt at the time. By the Late Permian, the main coal belt had migrated southward to 20–30°N (Longtan/Dalong Fm. thick coal measures in South China), approaching the equator. This migration indicates that the magnitude of global cooling before the PTB was far greater than at the C-P transition, and that the cool-temperate zone had expanded more extremely toward the equator, compressing the global ecosystem to a state closer to the collapse threshold. When the coal-forming belt was still distant from the equator (C-P transition), extinction severity was relatively moderate; when it had approached the equator (PTB), the subsequent extinction became the largest of the Phanerozoic. The proximity of the coal-forming belt to the equator is positively correlated with extinction severity — a spatial signal corroborating the cooling-driven framework independently of the carbon burial mechanism. Furthermore, the continuity of the carbon-fixing pump itself differs fundamentally between these events: at the C-P transition, the core lycopsid and cordaitalean lineages continued to dominate coal formation after the extinction, maintaining the structural integrity of the carbon pump and preventing a prolonged coal gap; at the PTB, the carbon pump collapsed structurally and required millions of years to recover, producing the ~7 Myr coal gap (Retallack et al., 1996). The K-Pg event represents an intermediate state with partial pump damage. The three events therefore form a complete severity gradient — intact pump, structurally collapsed pump, and partially damaged pump respectively — whose post-extinction recovery speed is jointly determined by the magnitude of climate compression before the extinction and the degree of ecosystem damage, rather than by the absolute temperature of the climatic background.
6.2. Comparison with the Mainstream Hyperthermal–Anoxia Hypothesis
The cooling-driven hypothesis differs from the hyperthermal–anoxia hypothesis in explanatory scope, internal consistency, and testability across six dimensions.
First, the cooling hypothesis is internally self-consistent with the lithological record: coal and carbonaceous shale are the predicted products of cool-temperate conditions, and their systematic association with mass extinction boundaries is explained directly, without invoking additional assumptions. The hyperthermal hypothesis must resort to oceanic anoxia to explain organic-matter-rich sediments, yet cannot account for the absence of tropical lithological indicators in the same intervals.
Second, the spatial pattern of mass extinctions is consistent with equatorward cold-zone expansion rather than with global warming. Modern terrestrial biomass peaks in the tropics and is minimal at the poles; if extreme heat were the cause of extinction, equatorial regions should have suffered most. The documented pattern of low-latitude refugia and mid-to-high-latitude extinction maxima is the opposite of this expectation, and is consistent with the cold-zone expansion scenario.
Third, most mass extinctions are accompanied by large-scale marine regression (Hallam, 1992). Sea-level fall is a direct and self-consistent consequence of ice sheet growth under cooling; the hyperthermal hypothesis lacks a straightforward mechanism for explaining globally synchronous short-term regressions at extinction boundaries.
Fourth, the cooling hypothesis is falsifiable. It predicts that the stratigraphic sequence approaching every mass extinction boundary should record a cooling countercycle from red beds (warm stage) through evaporites (arid stage) and coal and carbonaceous shale (cool-temperate stage) to cold-zone indicators, and that this sequence should appear synchronously or near-synchronously on global plates. Discovery of a mass extinction horizon occurring within a red-bed stage, with no overlying coal measures or cold-zone indicators, would falsify the hypothesis at that location.
Fifth, high-frequency red-to-black-to-red lithological alternations in the mid-Cretaceous — exemplified by oceanic red beds (CORBs) developed immediately above and below OAE2 black shales in the Tethyan domain (Wang et al., 2005) — present a physical challenge to the hyperthermal–anoxia framework. Restoring fully oxic deep-water conditions after an episode of global oceanic stagnation requires large-scale ocean circulation reorganization; given that pelagic sedimentation rates are typically on the order of millimetres per thousand years, the timescale represented by a several-metre red–black–red cycle is far shorter than that required for such reorganization to occur globally and repeatedly. The Cold Rule interprets these alternations as the natural lithological expression of large-amplitude climate oscillations, requiring no ad hoc assumptions about repeated collapse and re-establishment of global thermohaline circulation.
Sixth, and importantly, the cooling hypothesis does not displace other factors invoked by the mainstream paradigm — it provides the initiating force that generates them. Ice sheet expansion causes marine regression and continental shelf exposure, destroying shallow-marine habitats; low temperatures enhance carbon burial, altering marine geochemistry; climate zone compression forces ecosystem collapse and may intensify anoxia in restricted basins. The cooling-driven hypothesis is therefore an integrative framework that subsumes existing mechanisms within a unified climatic context, rather than a competing alternative that requires them to be abandoned.
6.3. Ambiguity of Geochemical Proxies
Geochemical proxies (δ¹⁸O, δ¹³C, TEX₈₆) used in current paleoclimate reconstructions exhibit significant multiple-solution ambiguity, and their conclusions require independent verification benchmarks (Mao et al., 2025; Mao X P et al., 2026). Four specific issues illustrate this ambiguity.
(1) LeGrande and Schmidt (2006) demonstrate that modern seawater δ¹⁸O꜀ is positively correlated with sea surface temperature — tropical low-latitude seawater has higher δ¹⁸O꜀, while cold high-latitude seawater has lower δ¹⁸O꜀ (as shown in Figure 4) — opposite to the carbonate–water fractionation relationship established in laboratory closed-system experiments (Epstein et al., 1953). The constant global seawater δ¹⁸O assumption in the Shackleton (1975) equation ignores spatiotemporal variation caused by salinity, freshwater input, evaporative enrichment, and ice-sheet volume changes, potentially reversing the spatial pattern of calculated temperatures relative to reality. Uncorrected oxygen isotope data therefore cannot serve as a valid benchmark for testing the hypothesis advanced in this paper.
The Permian case exposes a deeper difficulty. Placed alongside the lithological evidence, the Permian δ¹⁸O record (Cisuralian–Guadalupian–Lopingian) shows a near-monotonic rise, whereas the distribution of coal measures and red beds indicates multi-cyclic cold–warm–cold–frigid fluctuations — the two diverge sharply. The cause is the extreme sensitivity of oxygen isotopes to local meltwater contamination from oscillating ice-sheet margins: as Permian coal measures advanced equatorward (lithology indicating global cooling), ice sheets expanded equatorward in step, and seas adjacent to the ice front received isotopically light glacial meltwater that drove carbonate δ¹⁸O systematically negative — an apparent “warming” signal — with the reverse during retreat. The “monotonic rise” is therefore the spatiotemporal projection of an ice-margin-tracking dilution effect rather than a change in global mean temperature, and it cannot be removed by any global-mean correction.
(2) δ¹³C also exhibits multiple-solution ambiguity. In events already classified as hyperthermal by other proxies, both positive and negative excursions can find adaptive explanations (e.g., negative excursions attributed to volcanogenic light carbon, positive excursions attributed to organic carbon burial; after Hu X M et al., 2020), enabling the same hypothesis to accommodate two opposing signals and thereby reducing falsifiability.
(3) Judd et al. (2024), fitting a global temperature curve from 150,000 geochemical data points, and Li et al. (2022), reconstructing a temperature sequence for the past 540 Myr through climate modelling and geochemical data assimilation, produced two curves of highly similar shape, both reaching the conclusion that the modern era is the coldest period of the Phanerozoic. This conclusion conflicts sharply with the geological record: if the modern were indeed the coldest, Quaternary glacial coverage should exceed that of the late Paleozoic glaciation — contradicted by the fact that the Carboniferous–Permian glaciation produced a Gondwanan ice sheet far larger than anything in the Quaternary. Scotese (2021), after integrating non-geochemical evidence such as glacial deposits and sea-level changes, corrected this discrepancy, placing the coldest interval at the Carboniferous–Permian boundary. The failure of Judd et al. (2024) and Li et al. (2022) to incorporate these independent geological constraints demonstrates that geochemical-proxy-only paleoclimate integration, however large the dataset or complex the model, cannot circumvent the systematic biases introduced by underlying assumptions. Data accumulation cannot substitute for verification of prior assumptions.
(4) Recent Phanerozoic temperature curves reconstructed from δ¹⁸O and related proxies (e.g., Scotese et al., 2021; Judd et al., 2024) represent leading achievements in current paleoclimate reconstruction, yet show significant divergence from independent lithological records at several critical intervals. A representative case: the Middle Ordovician (Darriwilian–Sandbian) is characterized globally by maximum Phanerozoic marine transgression and widespread marine red beds and bauxitic weathering products at low latitudes — the sedimentary record unambiguously points to an intense greenhouse interval, yet the temperature curves show no corresponding high-temperature signal. This systematic discrepancy exposes three challenges facing the δ¹⁸O method in the early Paleozoic: (i) ancient seawater δ¹⁸O composition cannot be independently constrained, and small changes in this parameter cause large swings in calculated temperatures; (ii) well-preserved Early Paleozoic biogenic shells are scarce, limiting data representativeness; and (iii) diagenetic overprinting signals are difficult to isolate. Furthermore, these temperature curves typically incorporate lithological data as climate-zone constraints during construction, yet their outputs are sometimes used in reverse to question the climate-indicator significance of the very lithological evidence that constrained them — a model built with lithological constraints being used to deny the independence of the lithological evidence. Scotese (2021) himself explicitly noted that a single geochemical proxy cannot independently reconstruct reliable paleotemperature curves and that the distribution of climate-sensitive sediments is an indispensable independent constraint. Two specific cases illustrate the divergence: the Scotese et al. (2021) curve indicates the Late Jurassic was the coldest Jurassic interval with a temperature range of only ~6–8 °C, whereas the spatiotemporal distribution of Jurassic coal and red beds in eastern China indicates the Early Jurassic was coldest and the Late Jurassic warmest, with paired coal and red-bed belts migrating poleward as climate warmed (Mao X P et al., 2026), implying a range far exceeding 10 °C; and for the Hirnantian glaciation, both Judd et al. (2024) and Li et al. (2022) reconstruct temperatures ~8 °C warmer than today, in obvious contradiction to widespread tillites, dropstones, and sharp sea-level fall documented for that interval (Sun W D and Liao R Q, 2020). These divergences demonstrate that geochemical-proxy paleoclimate reconstruction contains inadequately constrained prior assumptions that require an independent lithological benchmark for external validation.
The guiding methodological principle is that when geochemical reconstructions conflict with lithological evidence, the shorter interpretive chain of sedimentary records should be accorded higher methodological priority. Lithology is the direct material record of climatic conditions during deposition, requiring far fewer intermediate assumptions than geochemical proxies — which require sequential steps of seawater chemistry assumption, fractionation coefficient calibration, diagenetic correction, and global signal extraction before a temperature estimate is produced.
This principle can be illustrated by analogy with geophysical surveys. Geophysical field measurements can be corrected through rigorous terrain, density, and spatial processing to extract valid signals, because the correction parameters are currently measurable. Paleoceanographic proxy methods face the opposite situation: the correction parameters required — ancient ocean circulation patterns, regional water budgets, evaporation–precipitation balances — are themselves past unknowns that cannot be independently measured and must be assumed simultaneously with the temperature being estimated (Strain and Tan, 1993; Schmidt, 1998). Using uncorrected δ¹⁸O data directly as paleotemperature is therefore methodologically lacking the equivalent of a geophysical correction step. In the present study, lithological sequences are treated as primary evidence; δ¹⁸O and related indicators are used as auxiliary reference when their cooling direction is consistent with the lithological record, and deferred to the lithological benchmark when they conflict.
This argument does not deny the important contributions of geochemical proxies to paleoclimate research — it identifies their multiple-solution ambiguity and sensitivity to prior assumptions as grounds for requiring cross-validation rather than independent authority. Because geochemical indicators exhibit this ambiguity, different proxies sometimes produce inconsistent results (Table 5, column 2). Geochemical proxies and lithological records are complementary: proxies provide quantitative temperature estimates and high-resolution temporal signals that lithological methods cannot; lithological assemblages provide spatial coverage and interpretive independence that proxy methods cannot. The two approaches are most powerful when used together under an explicit evidential hierarchy. We therefore advocate a lithological benchmark combined with geochemical calibration as the standard multi-proxy strategy: when both lines of evidence converge, conclusions are most reliable; when they conflict, the shorter interpretive chain of the sedimentary record should take methodological priority. We encourage the paleoclimate community to treat climate-sensitive lithological assemblages as mandatory a priori benchmarks in the construction and validation of proxy-based temperature reconstructions.
6.4. Spatial Differentiation: Core Predictions and Tests
The cooling-driven hypothesis predicts a fundamentally different spatial pattern of mass extinctions compared to the hyperthermal–anoxia hypothesis (Table 6):
Supporting evidence for the cooling-driven spatial predictions: (1) LOME: South China (low latitude) extinction intensity significantly lower than Baltic/Laurentian plates (mid-high latitude) (Chen et al., 2004; Wu et al., 2024). (2) End-Permian: High-precision U-Pb dating shows high-latitude Gondwana extinctions preceded low-latitude equatorial regions by up to tens of thousands of years (Shen et al., 2011; Wu et al., 2024). (3) OAE2: Black shale deposition initiated at high latitudes and progressively spread to lower latitudes (Li Z Y et al., 2023)—consistent with cold zone expansion, not oceanic anoxia spreading. (4) K-Pg: Freshwater ecosystems less affected; low-latitude rivers and lakes served as important biological refugia (Alvarez et al., 1980).
6.4.1. Theoretical Predictions
The equatorward migration of climate zones during global cooling generates a predictable spatial gradient in extinction timing and intensity. Under the cooling-driven hypothesis, three latitudinal zones are expected to respond differently, and their responses together define a progressive time sequence that constitutes the section’s primary testable prediction.
High-latitude regions (>60°N/S) are predicted to experience the earliest extinctions, but to yield the most incomplete stratigraphic records. These regions were already in the cool-temperate or cold zone before the onset of extinction-level cooling; during global cooling they first entered conditions of perennial glaciation or polar ice coverage, with organisms going extinct or being forced to migrate equatorward at the onset of cooling. Because high-latitude biomass was originally low and physical ice-sheet erosion caused stratigraphic gaps or truncation, their extinction signals are relatively incomplete in the fossil record, and the key transitional horizons are commonly absent.
Mid-latitude regions (30–60°N/S) are predicted to be the zone of most intense extinction. These regions originally hosted warm-temperate and subtropical ecosystems — the core areas of global biodiversity. During global cooling, the cool-temperate zone expands equatorward to cover mid-latitudes, replacing the original warm-temperate and subtropical ecosystems; as the cold zone subsequently advances, biological habitats collapse entirely. Because mid-latitudes represent the leading edge of equatorward climate zone migration, environmental change is most rapid and intense there. Organisms have neither sufficient time to adapt physiologically to cold nor adequate space to migrate equatorward, as the tropical zone itself is simultaneously being compressed. Extinction rates are consequently highest and the stratigraphic signal strongest at mid-latitudes.
Low-latitude regions (<30°N/S) are predicted to serve as biological refugia, with relatively attenuated extinction intensity. The tropical zone near the equator receives the highest solar insolation and benefits from strong tropical convection and oceanic heat capacity, allowing it to maintain relatively warm conditions even as global cooling compresses the overall climate system. These low-latitude regions constitute the last viable refuge for displaced organisms. Only when cooling reaches an extreme level — as at the peak of the Hirnantian glaciation — does the cold-zone front reach near-equatorial latitudes, generating significant extinction signals at low latitudes.
The three latitudinal responses together predict a progressive extinction time sequence: high latitudes go extinct first, mid-latitudes follow, and low latitudes are affected last. The time difference between these zones can be evaluated through comparison of relative Last Appearance Datum (LAD) horizons across sections at different paleolatitudes. The incompleteness of the fossil record means that the LAD from a single section does not equal the actual local extinction time — the Signor–Lipps effect will cause LADs to appear earlier than the true extinction horizon. However, the relative LAD differences between sections at different paleolatitudes can still reliably indicate the directional order and spatial progression of extinction, provided that taphonomic biases are broadly similar across sections being compared.
6.4.2. Significance as Testable Predictions
The spatial differentiation predictions provide clear testability for the cooling-driven hypothesis. The hypothesis predicts: (1) in any mass extinction event, coal and carbonaceous shale development should advance progressively from high to low latitudes over time; (2) the appearance of the main extinction horizon should likewise display a similar progressive sequence; and (3) the extinction intensity of low-latitude sections should be systematically lower than that of contemporaneous mid-to-high-latitude sections. If future global correlation studies consistently find extinction intensity at low latitudes higher than at mid-to-high latitudes, or if coal measures do not display a spatiotemporal sequence of progressive expansion toward lower latitudes, the cooling-driven hypothesis will be falsified.
The existing explanations offered by the hyperthermal–anoxia hypothesis for this series of spatial differentiation phenomena (e.g., low-latitude organisms have higher diversity and therefore stronger resistance; equatorial overheating forces organisms to migrate poleward) are all post-hoc attributions rather than a priori predictions of the theory itself. Frameworks that can always find an adaptive explanation essentially lose falsifiability. The cooling-driven hypothesis, by contrast, provides explicit, independently testable a priori predictions.
The Cooling-Driven Mass Extinction hypothesis does not, however, depend solely on the coal-equals-cold interpretive chain. The hypothesis simultaneously makes two predictions independent of the carbon burial mechanism: (1) the spatial distribution of mass extinctions should show a latitudinal progression — high latitudes going extinct before low latitudes, mid-latitude extinction rates higher than low-latitude; and (2) in low-latitude strata contemporaneous with mass extinctions, tropical lithological indicators (red beds, bauxites, evaporites) should be systematically absent while cold-climate indicators (coal, carbonaceous shale) should be widespread. Prediction 1 can be verified through biostratigraphic correlation and extinction rate statistics; prediction 2 through systematic surveys of lithological absence (Table 3 and Table 5) — both are independent of the Cold Rule’s climate attribution of coal and carbonaceous shale. When both independent predictions are supported by available data, concerns about circular reasoning are resolved by the convergence of multiple lines of evidence.
6.5. Recommendations for Future Research
The results and hypothesis presented in this study generate several specific and testable research priorities for future work.
The most direct test of the cooling-driven model is systematic documentation of the red-to-white-to-black-to-blue climate countercycle on key sections of all five mass extinction events, verifying whether this sequence exists at each boundary and whether it is globally synchronous within the resolution of available biostratigraphic and geochronological constraints. Closely related is precise determination of the temporal relationship between coal measures and the main extinction pulse at each event, testing whether the stratigraphic pattern of coal measures preceding the extinction horizon and coal measures or red beds succeeding it holds across all five events.
A third priority is re-evaluation of the climatic effects of Large Igneous Provinces, integrating the short-term cooling effect of volcanic aerosols with the long-term cooling feedback of enhanced carbon burial, to develop a more complete volcano–climate coupling model that reconciles these two effects and accounts for the duration and magnitude of cooling observed at each extinction boundary. Fourth, the semi-quantitative paleotemperature estimation approach demonstrated in §6.1 — using the equatorward shift of the coal-forming belt as a proxy for the magnitude of climate zone compression — should be applied systematically to all five events and to intermediate geological intervals, providing a lithology-based temperature signal that is independent of geochemical proxies. Fifth, high-resolution lithological and organic-carbon surveys near the K-Pg boundary, especially at stratigraphic levels corresponding to the main Deccan eruption phases, would test whether thin organic-matter-rich beds corresponding to short-term cooling events are present, and would allow the cooling duration–carbon burial thickness response relationship to be calibrated against independent geochronological constraints from the Deccan eruption record — providing cross-scale validation of the Cold Rule that is independent of the long-cycle mass extinction events.
Together these research directions would transform the cooling-driven hypothesis from a qualitative framework supported by convergent lithological evidence into a quantitatively testable model with explicit predictions at multiple spatial and temporal scales.
6.6. Scope and Limitations
The Cooling-Driven Mass Extinction hypothesis and the Cold Rule application presented in this study are primarily grounded in Mesozoic–Cenozoic evidence. For the three Paleozoic extinctions (LOME, F-F, PTB), coal development may have been influenced by plant evolutionary stage (vascular plant radiation, appearance of woody plants, evolution of white-rot fungi), making the temperature–carbon burial relationship more complex than in the Mesozoic. Cold Rule application in the Early Paleozoic requires higher-resolution stratigraphic work and multi-proxy cross-validation. For Cambrian and older strata — where black shales formed in the absence of land plants and under fundamentally different marine chemistry — no extrapolation is made.
For the K-Pg event, the extremely short cooling duration (years to decades for aerosol effects) is insufficient to generate geologically recognizable coal-forming intervals. This is not an exception to the Cold Rule but reflects its time-scale requirement: the Cold Rule applies to cooling events of sufficient duration to leave identifiable climate-sensitive lithological records. Just as geochemical indicators cannot provide reliable conclusions in the absence of representative samples, the Cold Rule cannot provide lithological constraints when the cooling duration falls below the minimum time threshold for generating a recognizable coal-bearing succession.
A potential apparent contradiction deserves explicit discussion: some coal measures contain in-situ tropical plant fossils (e.g., the Wuda Pompeii Flora, ~298 Ma), which might seem to conflict with the Cold Rule’s cool-temperate climate attribution for coal. This apparent contradiction resolves when the distinction between ecological climate and preservation climate is recognized. The Wuda Pompeii Flora owes its exceptional preservation to instantaneous burial by volcanic ash — this special taphonomic window bypassed the critical early diagenetic microbial decomposition stage and does not represent normal carbon burial efficiency. More fundamentally, the climate recorded by plant fossils (growing-season temperature and moisture conditions) and the climate required for net organic carbon burial (average temperature over thousands to millions of years of post-burial history) are two distinct variables. Coal measures therefore demonstrate a growth–preservation separation: plants can grow and flourish during interglacial or warm episodes, and their remains are preserved at high efficiency during subsequent cold episodes when low temperatures sharply reduce decomposition rates. This separation is a necessary consequence of the Cold Rule and provides a unified explanation for the coexistence of warm ecological signals (plant macrofossils) and cold preservation signals (high TOC, high carbon burial efficiency) within the same coal seam. The Cold Rule makes a testable prediction in this regard: within a coal measure, plant macrofossils (reflecting the ecological community) and dispersed organic matter indicators (TOC, carbon burial efficiency, biomarkers) should show systematic temperature signal separation in the same section — macrofossils pointing to warmer ecological conditions, same-horizon carbon burial indicators pointing to lower-temperature preservation conditions.
Modern process observations provide independent support for this growth–preservation separation. Yu et al. (2010), in a global study of 116 tropical peat cases, found that the vast majority formed before 1,000 yr BP, with at least 10 Holocene cold events (Hou and Fang, 2011) providing intermittent low-temperature conditions for peat accumulation at low latitudes. Hodgkins et al. (2018) showed that Indonesian tropical peat has already shifted from a net carbon sink to a carbon source, with organic matter mineralization continuing even at 5 m depth under completely anoxic burial conditions. These observations confirm that low-latitude organic matter enrichment is not an ongoing geological process but a relic from past cold-period climate zone compression toward the equator — consistent with the Cold Rule prediction that sustained carbon burial requires low-temperature conditions.
The Cooling-Driven Mass Extinction hypothesis presented in this paper should be regarded as an open scientific proposition rather than a definitive conclusion. Its core claim is that the lithological records of the five mass extinction events display a highly consistent reverse climate cycle, strongly suggesting that cooling may be a common key driving factor. This does not exclude the possibility that other factors — paleogeographic configuration, plant evolutionary stage, marine chemistry — exert additional influences in specific events. The Cold Rule’s applicability is constrained by plant evolutionary stage in the early Paleozoic and by time-scale requirements in the case of K-Pg. These are not exceptions to the Cold Rule but reflections of the boundary conditions that any sedimentological method must respect. We invite future researchers to independently test, modify, and if warranted falsify the hypothesis through high-resolution stratigraphic correlation, quantitative latitudinal extinction intensity analysis, and coupled carbon cycle–climate modelling, thereby advancing the field toward a more complete understanding of the causes and consequences of Earth’s greatest biological crises.
7. Conclusions
This study, through systematic integration of global sedimentary records and spatiotemporal data from the five mass extinction events, proposes and preliminarily validates a unified “Cooling-Driven Mass Extinction” hypothesis, constituting a fundamental challenge and alternative to the mainstream hyperthermal–anoxia paradigm across the following key points.
First, in terms of climate attribution, we demonstrate that mass extinctions are caused by sustained cooling culminating in cold-zone conditions, not by hyperthermia and anoxia. With the possible exception of the end-Cretaceous — which may represent a case of short-term abrupt cooling rather than a long-term gradual trend — the other four extinctions were each driven by a gradual cooling process lasting millions to tens of millions of years. This process is spatially non-uniform, following a systematic high-latitude → mid-latitude → low-latitude progression that has received preliminary support from multiple independent empirical studies.
Second, methodologically, the “Cold Rule” is established as an a priori lithological benchmark independent of geochemical proxies. Each mass extinction systematically corresponds to a red-to-white-to-black-to-blue climate countercycle: red beds (warm stage) → evaporites (arid-hot stage) → coal and carbonaceous shale (cool-temperate stage) → cold-zone marker (mass extinction). This cycle constitutes a globally correlatable, repeatedly testable physical evidence chain whose interpretation requires no assumptions from geochemical proxies.
Third, regarding the relationship between coal and extinction, we distinguish two temporally adjacent but fundamentally different climate stages: coal and carbonaceous shale are the prelude and proximal marker of mass extinction, recording the cool-temperate environment that precedes the lethal cold-zone arrival; the extinction itself is the consequence of further cooling into the cold zone. This distinction resolves a long-standing conflation of the climatic prelude with the climatic climax.
Fourth, the role of volcanic activity is reconstructed from “hyperthermal driver” to “cooling trigger and amplifier.” The short-term volcanic winter effect triggers abrupt cooling; the long-term effect initiates a positive feedback of cooling → enhanced carbon burial → atmospheric CO₂ decline → further cooling, which locks in and sustains cold climate conditions.
Fifth, the fundamental asymmetry of the carbon cycle — accumulation requires tens of millions of years, release takes only tens of thousands, recovery requires millions — is the deep cause of prolonged post-extinction greenhouse warming and severely lagged ecological recovery. Two additional quantitative relationships follow from this framework: the proximity of the coal-forming belt to the equator before an extinction is positively correlated with extinction severity, and the degree of structural damage to the biological carbon-fixing pump after an extinction is negatively correlated with recovery speed. Together these relationships provide a unified dynamic explanation for the differences in post-extinction recovery pathways across the Phanerozoic, and offer a geological historical mirror for understanding the timescale mismatch between contemporary carbon emissions and carbon-sink recovery.
Beyond these five conclusions, this study’s interpretation of the spatial differentiation of mass extinctions advances beyond simple latitudinal comparisons. Mid-latitudes represent the leading edge of equatorward climate zone migration and the principal extinction zone; low-latitude equatorial regions serve as relative biological refugia; high-latitude regions, though the first to enter the cold zone, commonly have their extinction signals masked by incomplete stratigraphic records. When conducting global extinction horizon correlations, the information-preservation biases caused by the Signor–Lipps effect and the geological survivorship effect must be systematically evaluated and corrected before reliable conclusions about extinction timing and spatial progression can be drawn.
This study calls for a fundamental shift in mass extinction research: from seeking hyperthermal evidence to seeking cooling sequences. In this new framework, climate-sensitive lithological assemblages should be established as primary evidence; geochemical proxy interpretations must undergo mandatory cross-validation against the lithological benchmark, not the reverse. More broadly, we advocate a “triple-constraint” research paradigm in which lithological assemblages provide the a priori constraint benchmark, and geochemical indicators and paleontological data serve as cross-calibration tools — an integration that moves paleoclimatology and paleontology beyond dependence on any single line of evidence toward a more robust, multi-proxy convergence. This is not only a key to explaining biological crises in deep time, but may also provide a geological historical mirror for understanding biodiversity responses under future climate cooling scenarios.
References
- Alvarez, L. W.; Alvarez, W.; Asaro, F.; Michel, H. V. Extraterrestrial cause for the Cretaceous-Tertiary extinction. Science 1980, 208(4448), 1095–1108. [Google Scholar] [CrossRef] [PubMed]
- Arthur, M. A.; Dean, W. E.; Pratt, L. M. Geochemical and climatic effects of increased marine organic carbon burial at the Cenomanian/Turonian boundary. Nature 1988, 335(6192), 714–717. [Google Scholar] [CrossRef]
- Bao, X. J.; Hu, Y. Y.; Li, X.; et al. Quantifying climate conditions for the formation of bauxites and kaolinites. Glob. Planet. Change 2026, 257, 105258. [Google Scholar] [CrossRef]
- Blackburn, T. J.; Olsen, P. E.; Bowring, S. A.; et al. Zircon U-Pb geochronology links the end-Triassic extinction with the Central Atlantic Magmatic Province. Science 2013, 340, 941–945. [Google Scholar] [CrossRef] [PubMed]
- Boscolo-Galazzo, F.; Crichton, K. A.; Ridgwell, A.; et al. Temperature controls carbon cycling and biological evolution in the ocean twilight zone. Science 2021, 371, 1148–1152. [Google Scholar] [CrossRef] [PubMed]
- Burgess, S. D.; Bowring, S. A. High-precision geochronology confirms voluminous magmatism before, during, and after Earth’s most severe extinction. Sci. Adv. 2015, 1(7), e1500470. [Google Scholar] [CrossRef] [PubMed]
- Chen, J.; Shen, S. Z.; Li, X. H.; et al. High-resolution SIMS oxygen isotope analysis on conodont apatite from South China and implications for the end-Permian mass extinction. Palaeogeogr. Palaeoclimatol. Palaeoecol. 2016, 448, 26–38. [Google Scholar] [CrossRef]
- Chen, M.; Zhang, Y. Q.; Li, J. X.; et al. The effects of temperature differences on anaerobic degradation of submerged macrophytes litter in lake sediments. Acta Sci. Circumstantiae 2020, 40(8), 3013–3019. [Google Scholar]
- Chen, X.; Rong, J. Y.; Li, Y.; Boucot, A. J. Facies patterns and geography of the Yangtze region, South China, through the Ordovician and Silurian transition. Palaeogeogr. Palaeoclimatol. Palaeoecol. 2004, 204(3/4), 353–372. [Google Scholar] [CrossRef]
- Chen, Z. Q.; Benton, M. J. The timing and pattern of biotic recovery following the end-Permian mass extinction. Nat. Geosci. 2012, 5(6), 375–383. [Google Scholar] [CrossRef]
- Courtillot, V. E.; Renne, P. R. On the ages of flood basalt events. Comptes Rendus Geosci. 2003, 335(1), 113–140. [Google Scholar] [CrossRef]
- Dal Corso, J.; Mietto, P.; Newton, R. J.; et al. Discovery of a major negative δ¹³C spike in the Carnian (Late Triassic) linked to the eruption of Wrangellia flood basalts. Geology 2012, 40(1), 79–82. [Google Scholar]
- Du, X. B.; Jia, J. X.; Zhao, K.; et al. Development characteristics of deep-time volcanic ash layers and its influence on deposition of organic-rich shale across Ordovician–Silurian transition in Yangtze area, South China. J. Cent. South Univ. (Science and Technology) 2022, 53(9), 3509–3521. [Google Scholar]
- Eldrett, J. S.; Ma, C.; Bergman, S. C.; et al. Origin of limestone–marlstone cycles: Astronomic forcing of organic-rich sedimentary rocks from the Cenomanian to early Coniacian of the Cretaceous Western Interior Seaway, USA. Earth Planet. Sci. Lett. 2015, 423, 98–113. [Google Scholar] [CrossRef]
- Epstein, S.; Buchsbaum, R.; Lowenstam, H. A.; Urey, H. C. Revised carbonate-water isotopic temperature scale. Geol. Soc. Am. Bull. 1953, 64(11), 1315–1326. [Google Scholar] [CrossRef]
- Glaser, P. H.; Hansen, B. C. S.; Siegel, D. I.; et al. Rates, pathways and drivers of peatland development in the Hudson Bay Lowlands, northern Ontario, Canada. J. Ecol. 2004, 92(6), 1036–1053. [Google Scholar] [CrossRef]
- Gorham, E.; Lehman, C.; Dyke, A.; et al. Temporal and spatial aspects of peatland initiation following deglaciation in North America. Quat. Sci. Rev. 2007, 26(3–4), 300–311. [Google Scholar] [CrossRef]
- Gudasz, C.; Bastviken, D.; Steger, K.; et al. Temperature-controlled organic carbon mineralization in lake sediments. Nature 2010, 466, 478–481. [Google Scholar] [CrossRef] [PubMed]
- Hallam, A. Phanerozoic Sea-Level Changes; Columbia University Press: New York, 1992; pp. 1–266. [Google Scholar]
- Haq, B. U.; Hardenbol, J.; Vail, P. R. Chronology of fluctuating sea levels since the Triassic. Science 1987, 235(4793), 1156–1167. [Google Scholar] [CrossRef] [PubMed]
- Hodgkins, S. B.; Richardson, C. J.; Dommain, R.; et al. Tropical peatland carbon storage linked to global latitudinal trends in peat recalcitrance. Nat. Commun. 2018, 9, 3640. [Google Scholar] [CrossRef] [PubMed]
- Hou, G. L.; Fang, X. Q. Characteristics of Holocene Temperature Change in China. Prog. Geogr. 2011, 30(9), 1075–1080. [Google Scholar]
- Hu, X. M.; Li, J.; Han, Z.; et al. Two types of hyperthermal events in the Mesozoic-Cenozoic: Environmental impacts, biotic effects, and driving mechanisms. Sci. China Earth Sci. 2020, 63, 1041–1058. [Google Scholar] [CrossRef]
- Hu, Y. H.; Liu, J.; Zhou, M. Z.; et al. An overview of Ordovician and Silurian K-bentonites. Geochimica 2009, 38(4), 393–404. [Google Scholar]
- Hugelius, G.; Strauss, J.; Zubrzycki, S.; et al. Estimated stocks of circumpolar permafrost carbon with quantified uncertainty ranges and identified data gaps. Biogeosciences 2014, 11(23), 6573–6593. [Google Scholar] [CrossRef]
- Isbell, J. L.; Miller, M. F.; Wolfe, K. L.; et al. Timing of late Paleozoic glaciation in Gondwana: Was glaciation responsible for the development of Northern Hemisphere cyclothems? In Extreme Depositional Environments: Mega End Members in Geologic Time. Geological Society of America Special Paper 370.; Chan, M. A., Archer, A. W., Eds.; Geological Society of America: Boulder, 2003; pp. 5–24. [Google Scholar]
- Joachimski, M. M.; Lai, X.; Shen, S.; et al. Climate warming in the latest Permian and the Permian–Triassic mass extinction. Geology 2012, 40(3), 195–198. [Google Scholar] [CrossRef]
- Judd, E. J.; Tierney, J. E.; Lunt, D. J.; et al. A 485-million-year history of Earth’s surface temperature. Science 2024, 385, eadk3705. [Google Scholar] [CrossRef] [PubMed]
- Kaiser, S. I.; Steuber, T.; Becker, R. T.; Joachimski, M. M. Geochemical evidence for major environmental change across the Frasnian-Famennian boundary in the Moroccan Meseta. Palaeogeogr. Palaeoclimatol. Palaeoecol. 2006, 240(1-2), 362–387. [Google Scholar] [CrossRef]
- LeGrande, A. N.; Schmidt, G. A. Global gridded data set of the oxygen isotopic composition in seawater. Geophys. Res. Lett. 2006, 33, L12604. [Google Scholar] [CrossRef]
- Li, S. Z.; Yang, X. G.; Xu, Q. C.; et al. Permian Dalong Formation—a new formation for shale gas exploration and development. Geol. Rev. 2024, 70(1), 253–254. [Google Scholar]
- Li, X.; Hu, Y.; Guo, J.; et al. A high-resolution climate simulation dataset for the past 540 million years. Sci. Data 2022, 9, 371. [Google Scholar] [CrossRef] [PubMed]
- Li, X. S.; Zhang, T.; Ma, C. Astronomical chronology of the Cretaceous Oceanic Anoxic Event 2 (OAE 2). Quat. Sci. 2023, 43(6), 1597–1613. [Google Scholar]
- Li, Z. Y.; Zhang, Y. G.; Torres, M.; Mills, B. J. W. Neogene burial of organic carbon in the global ocean. Nature 2023, 613, 90–95. [Google Scholar] [CrossRef] [PubMed]
- Lin, J. L. Paleogeographic map of the end-Carboniferous. Seismol. Geol. 1987, 9(2), 91–94. [Google Scholar]
- Liu, M.; Fang, C. G.; Chen, D. Z. Syndepositional and diagenetic processes in the pigmentation of Middle Ordovician carbonate red beds in South China. Sediment. Geol. 2024a, 470, 106722. [Google Scholar] [CrossRef]
- Liu, M.; Chen, D. Z.; Ma, H. R.; Ding, Y. Do red marine carbonates represent oxic environments? New understanding from the Upper Ordovician marine limestone in Tarim Basin, China. Mar. Pet. Geol. 2024b, 168, 107166. [Google Scholar]
- Lu, B.; Hou, D. J.; Zou, C. N.; et al. Depositional environment and organic matter enrichment mechanism of the lower Cambrian shale in the southern Sichuan Basin. Front. Earth Sci. 2025, 13, 1509332. [Google Scholar] [CrossRef]
- Lucht, W.; Prentice, I. C.; Myneni, R. B.; et al. Climatic control of the high latitude vegetation greening trend and Pinatubo effect. Science 2002, 296, 1687–1689. [Google Scholar] [CrossRef] [PubMed]
- Lundin, E. J.; Klaminder, J.; Bastviken, D.; et al. Large difference in carbon emission–burial balances between boreal and arctic lakes. Sci. Rep. 2015, 5, 14248. [Google Scholar] [CrossRef] [PubMed]
- Mao, X. P.; Chen, X. R.; Wang, Z. J.; et al. Constraints of weathering intensity in different climate zones on coal accumulation environment. Sci. Rep. 2025, 15, 8231. [Google Scholar] [CrossRef] [PubMed]
- Mao, X. P.; Yang, Y. W.; Chen, X. R.; et al. Paleoclimate reconstruction constrained by black-white-red climatic cycles and new insights into history of Earth’s surface temperature. Pet. Geol. Exp. 2026, 48(2), 296–309. [Google Scholar]
- Mei, X. M.; Cai, C. F. Climate of deglaciation controls the organic carbon enrichment of marine source rocks in China. Acta Sedimentol. Sin. 2024, 44(1), 1–21. [Google Scholar]
- Mou, C. L.; Wang, Q. Y.; Ge, X. Y.; et al. Lithofacies Paleogeography Atlas of China (Devonian–Triassic); Science Press: Beijing, 2024; pp. 1–180. [Google Scholar]
- Parrish, J. T.; Ziegler, A. M.; Scotese, C. R. Rainfall patterns and the distribution of coals and evaporites in the Mesozoic and Cenozoic. Palaeogeogr. Palaeoclimatol. Palaeoecol. 1982, 40, 67–101. [Google Scholar] [CrossRef]
- Retallack, G. J.; Veevers, J. J.; Morante, R. Global coal gap between Permian-Triassic extinction and Middle Triassic recovery of peat-forming plants. Geol. Soc. Am. Bull. 1996, 108(2), 195–207. [Google Scholar] [CrossRef]
- Rong, J. Y.; Wang, Y.; Zhang, X. L. Tracking shallow marine red beds through geological time as exemplified by the lower Telychian (Silurian) in the Upper Yangtze Region, South China. Sci. China Earth Sci. 2012, 55, 699–713. [Google Scholar] [CrossRef]
- Schlanger, S. O.; Jenkyns, H. C. Cretaceous oceanic anoxic sediments: Causes and consequences. Geol. En. Mijnb. 1976, 55(3), 179–184. [Google Scholar]
- Schmidt, G. A. Oxygen-18 variations in a global ocean model. Geophys. Res. Lett. 1998, 25(8), 1201–1204. [Google Scholar] [CrossRef]
- Schoene, B.; Samperton, K. M.; Eddy, M. P.; et al. U-Pb geochronology of the Deccan Traps and relation to the end-Cretaceous mass extinction. Science 2015, 347(6218), 182–184. [Google Scholar] [CrossRef] [PubMed]
- Schulte, P.; Alegret, L.; Arenillas, I.; et al. The Chicxulub asteroid impact and mass extinction at the Cretaceous-Paleogene boundary. Science 2010, 327(5970), 1214–1218. [Google Scholar] [CrossRef] [PubMed]
- Scotese, C. R.; Song, H. J.; Mills, B. J. W.; van der Meer, D. G. Phanerozoic paleotemperatures: The Earth’s changing climate during the last 540 million years. Earth-Sci. Rev. 2021, 215, 103503. [Google Scholar] [CrossRef]
- Shackleton, N. J. The depth of pelagic foraminifera in the late Quaternary. In The Late Cenozoic Era; Stothers, R. B., Ed.; Columbia University Press: New York, 1975; pp. 18–22. [Google Scholar]
- Shao, Y. W.; Zhao, F. H.; Spiro, B.; et al. Net primary productivity of paleo-peatlands linked to deep-time glacial periods in the late Carboniferous and early Permian icehouse interval. Int. J. Coal Geol. 2024, 296, 104644. [Google Scholar] [CrossRef]
- Shen, J. H.; Zhang, Y. G.; Yuan, D. X.; Xu, Y. G. Atmospheric CO₂ drawdown during the Emeishan flood basalt volcanism. Nat. Commun. 2026, 17, 1657. [Google Scholar] [CrossRef] [PubMed]
- Shen, J. J.; Wang, Y. M.; Li, H.; et al. Relationship between degree of water retention and enrichment of shale organic matter during the Ordovician-Silurian transition in western Hubei. Acta Pet. Sin. 2023, 44(10), 1599–1611. [Google Scholar]
- Shen, S. Z.; Crowley, J. L.; Wang, Y.; et al. Calibrating the end-Permian mass extinction. Science 2011, 334(6061), 1367–1372. [Google Scholar] [CrossRef] [PubMed]
- Sigman, D. M.; Boyle, E. A. Glacial/interglacial variations in atmospheric carbon dioxide. Nature 2000, 407(6806), 859–869. [Google Scholar] [CrossRef] [PubMed]
- Strain, P. M.; Tan, F. C. Seasonal evolution of oxygen isotope-salinity relationships in high-latitude surface waters. J. Geophys. Res. 1993, 98(C8), 14589–14598. [Google Scholar] [CrossRef]
- Strøm, K. M. Land-locked waters and the deposition of black muds. In Recent Marine Sediments; Trask, P. D., Ed.; American Association of Petroleum Geologists: Tulsa, 1939; pp. 356–372. [Google Scholar]
- Sun, W. D.; Liao, R. Q. The end Ordovician mass extinction induced by rapid glaciation. Chin. Sci. Bull. 2020, 65(6), 431–433. [Google Scholar] [CrossRef]
- Sun, Y.; Joachimski, M. M.; Wignall, P. B.; et al. Lethally hot temperatures during the Early Triassic greenhouse. Science 2012, 338(6105), 366–370. [Google Scholar] [CrossRef] [PubMed]
- Tang, W.; Liu, M.; Wei, H. Y.; et al. Organic carbon burial and ocean redox modulated biotic recovery after the latest Ordovician crisis. Earth Planet. Sci. Lett. 2025, 676, 119741. [Google Scholar] [CrossRef]
- Tissot, B. Effects on prolific petroleum source rocks and major coal deposits caused by sea-level changes. Nature 1979, 277, 463–465. [Google Scholar] [CrossRef]
- Wang, C. S.; Hu, X. M.; Sarti, M.; et al. Upper Cretaceous oceanic red beds in southern Tibet: a major change from anoxic to oxic, deep-sea environments. Cretac. Res. 2005, 26(1), 21–32. [Google Scholar] [CrossRef]
- Wang, Y. Y.; Liang, K.; Chen, B.; et al. Research progress in the Late Devonian F-F mass extinction. J. Stratigr. 2020, 44(3), 277–298. [Google Scholar]
- Wei, Q.; Song, P. P.; Shao, X. L.; et al. Influence of temperature, aeration and sediment on decomposition of Chaetomorpha sp. Acta Sci. Circumstantiae 2014, 34(9), 2329–2336. [Google Scholar]
- Wu, H. N.; Chang, C. F.; Liu, C.; Zhong, D. L. Inferences on the motion of the North China and South China blocks from paleomagnetic data and their implications for the tectonic evolution of the Qinling orogenic belt. Geol. Sci. 1990, 25(3), 201–214. [Google Scholar]
- Wu, Q.; Zhang, H.; Ramezani, J.; et al. The terrestrial end-Permian mass extinction in the paleotropics postdates the marine extinction. Sci. Adv. 2024, 10(5), 12. [Google Scholar] [CrossRef] [PubMed]
- Xu, J. L. Distribution and age of the Ordovician marine red beds in southern Anhui Province. Chin. J. Geol. 2024, 59(1), 210–223. [Google Scholar]
- Yu, Z. C.; Loisel, J.; Brosseau, D. P.; et al. Global peatland dynamics since the Last Glacial Maximum. Geophys. Res. Lett. 2010, 37, L13402. [Google Scholar] [CrossRef]
- Zhao, X.; Xue, N. H.; Yang, H.; et al. Climate-carbon cycle interactions and spatial heterogeneity of the late Triassic Carnian pluvial episode. Nat. Commun. 2025, 16, 5404. [Google Scholar] [CrossRef] [PubMed]
- Ziegler, A. M.; Eshel, G.; Rees, P. M.; et al. Tracing the tropics across land and sea: Permian to present. Lethaia 2003, 36(3), 227–254. [Google Scholar] [CrossRef]
Figure 1.
Research framework for mass extinctions constrained by the Cold Rule.
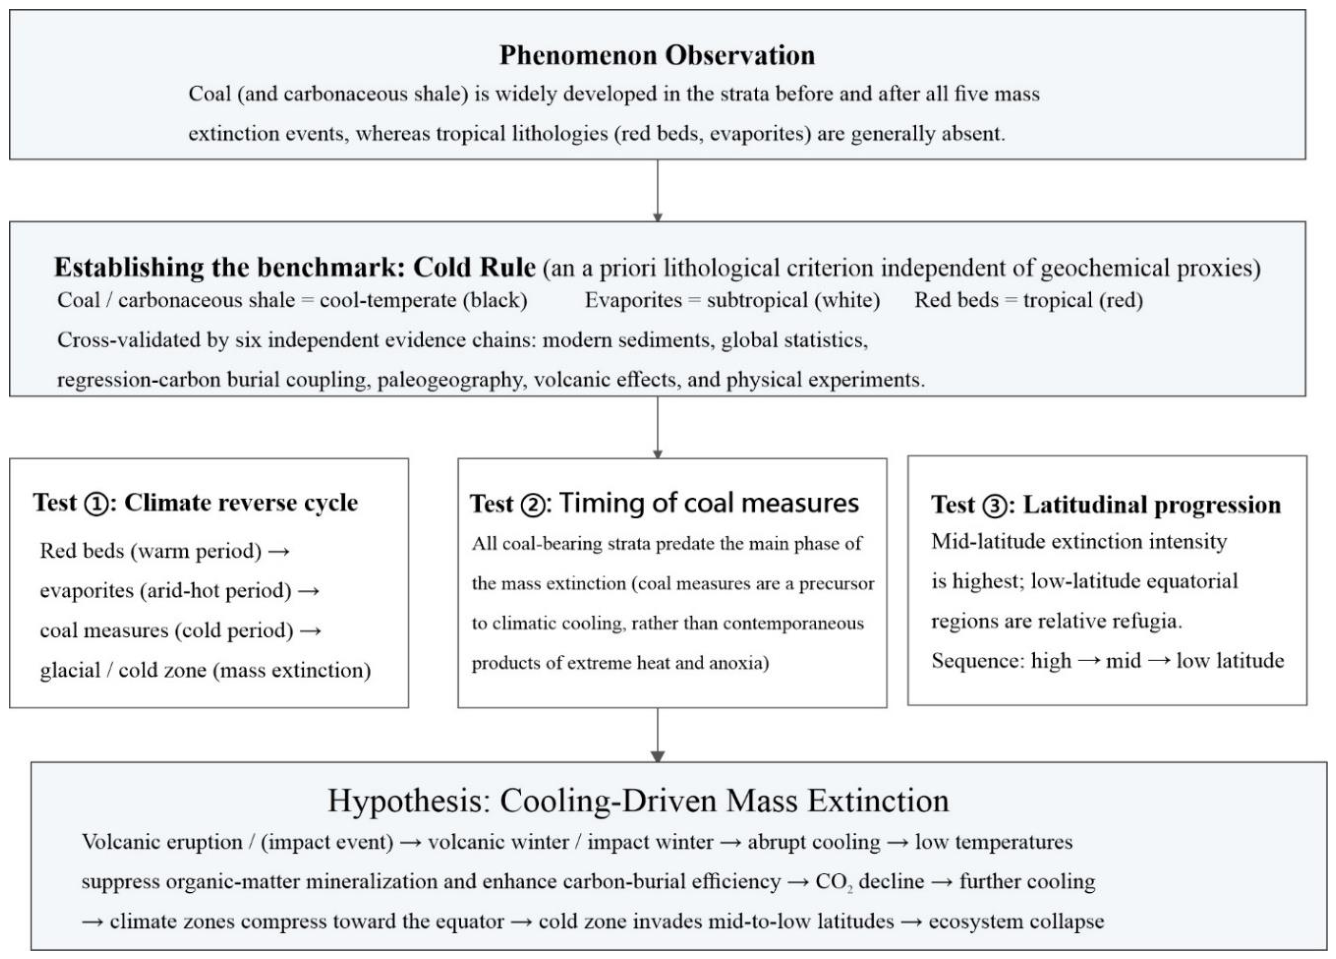
Figure 2.
Distribution of climate-sensitive lithologies at different latitudes for various periods from the Triassic to the present. Coal concentrates at high latitudes (>45°N/S), evaporites at mid-latitudes (~25–35°), and red beds/bauxites strictly at low-latitude tropics (<25°). Figure modified after Ziegler et al. (2003).
Figure 2.
Distribution of climate-sensitive lithologies at different latitudes for various periods from the Triassic to the present. Coal concentrates at high latitudes (>45°N/S), evaporites at mid-latitudes (~25–35°), and red beds/bauxites strictly at low-latitude tropics (<25°). Figure modified after Ziegler et al. (2003).
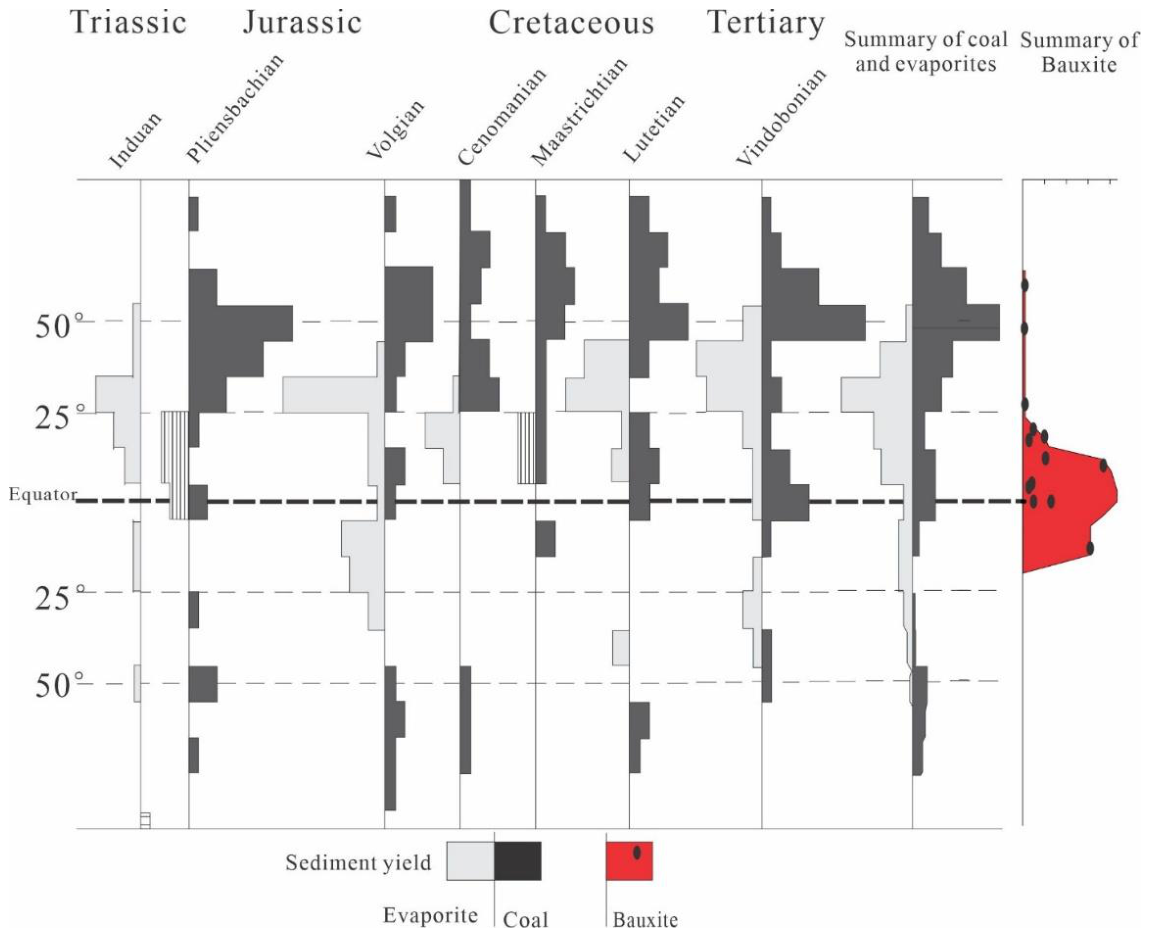
Figure 4.
Scatter plot of the relationship between δ¹⁸O and seawater temperature at 5 m depth below the sea surface (redrawn from data by LeGrande & Schmidt, 2006). Modern seawater δ¹⁸O is positively correlated with sea surface temperature—opposite to the assumption of paleothermometry applications.
Figure 4.
Scatter plot of the relationship between δ¹⁸O and seawater temperature at 5 m depth below the sea surface (redrawn from data by LeGrande & Schmidt, 2006). Modern seawater δ¹⁸O is positively correlated with sea surface temperature—opposite to the assumption of paleothermometry applications.
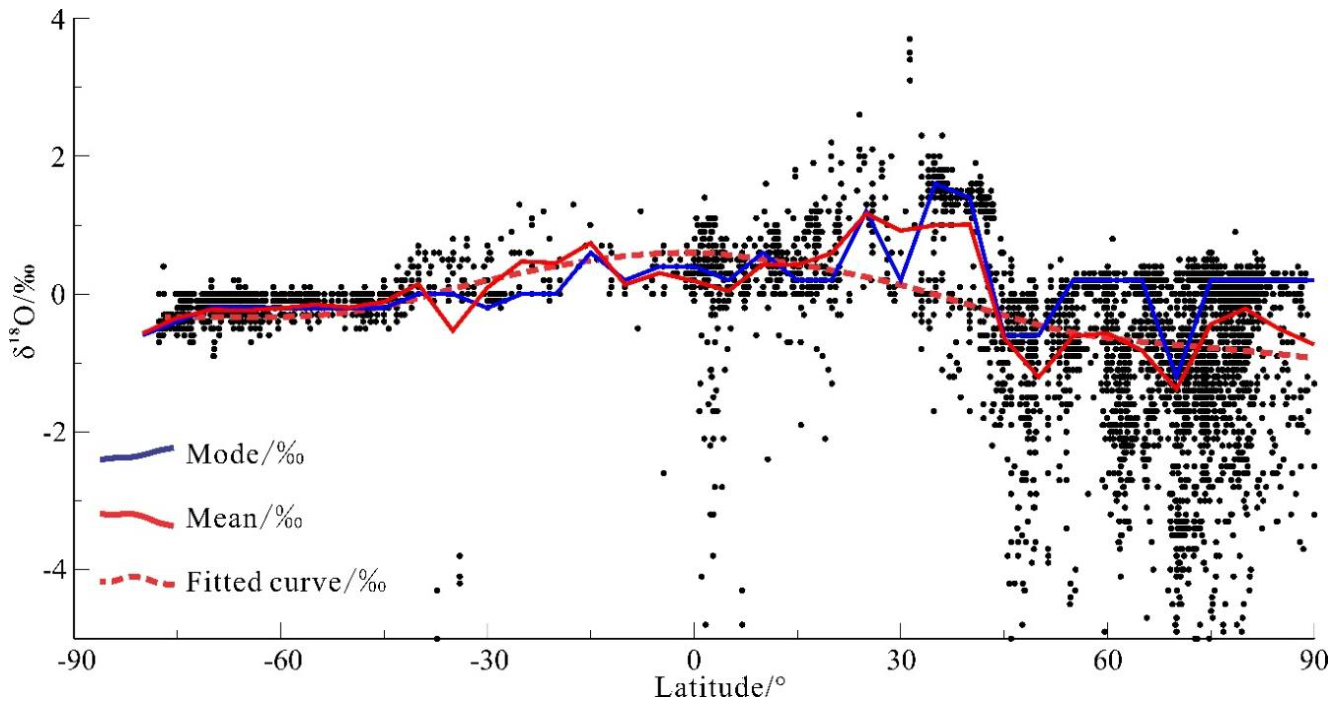

Table 1.
Six independent lines of evidence supporting the Cold Rule.
| Evidence | Core Content | Key Conclusion |
|---|---|---|
| 1. Modern sediment TOC latitudinal distribution (spatial) | Global lake and wetland databases (GLWD) and Chinese data show peak TOC at 46–70°N cool-temperate zones (MAT <5 °C); tropical TOC significantly lower. Northern European peat TOC commonly >90%; tropical peat in continuous decomposition (Hodgkins et al., 2018). | Low temperature suppresses microbial decomposition; primary control on carbon burial. Redox effects are limited. |
| 2. Global statistics of coal, evaporites, red beds since Permian (spatial) | Ziegler et al. (2003) show that on any given time slice: coal concentrates at high latitudes (>45°N/S); evaporites center in mid-latitude arid belt (~25–35°); red beds and bauxites strictly confined to low-latitude tropics (<25°) (Figure 2). Pattern stable from Permian to Neogene. | Spatial distribution matches climate zones with high fidelity; temporally stable. |
| 3. Spatiotemporal coupling of regression and carbon burial (sea-level–carbon-storage relationship) | Global regression events (e.g., Late Ordovician, Late Permian, Late Triassic) coincide closely in time with large-scale development of coal measures and black shales. Regression shortens the seaward transport distance of terrigenous material, so nearshore shelf areas receive large organic-matter inputs; regression also indicates global cooling, and low temperatures further suppress decomposition. The two act synergistically — the lower the sea level, the higher the carbon storage. | Regression (low sea level) enhances carbon burial through the dual effect of shortened source-to-sink transport and indication of global cooling. |
| 4. Red-to-white-to-black cooling reverse cycles in Chinese stratigraphic sequences (temporal) | Early Permian (glacial) → Shanxi/Liangshan Fm. coals; Mid-Permian early (warm) → Qixia Fm. limestone/red beds; Mid-Permian late (cooling) → Gufeng Fm. black shale; Late Permian (continued cooling) → Longtan/Dalong Fm. coal + carbonaceous shale. Triassic: Lower Triassic red beds → Middle Triassic evaporites → Upper Triassic coal measures. | In the time series, coal corresponds to cold periods; red beds/evaporites to warm periods. |
| 5. Coal/black shales following mid-to-low-latitude volcanic eruptions (temporal) | During ELIP eruption, atmospheric CO₂ decreased; thick Longtan/Changxing coal measures developed in South China. Wufeng–Longmaxi Fm. ash layers coincide with the Hirnantian glaciation (Shen J H et al., 2026). | Volcanic activity can trigger cooling and sustain it through enhanced carbon burial. |
| 6. Physical experiments on temperature control of organic-carbon mineralization and iron oxidation (black–red symmetry evidence) | (i) Organic-carbon mineralization: a 10 °C→30 °C rise raises decomposition rates ~3–4× (Figure 3); changing redox conditions affects rates by <10% (Wei et al., 2014; Chen et al., 2020). (ii) Iron oxidation: a 10 °C rise increases oxidation rates 2–4×, whereas doubling oxygen concentration only doubles the rate. | Temperature is the common first-order parameter governing both organic-carbon preservation and red-bed coloration; redox state and oxygen concentration are secondary. |
Table 2.
Falsification conditions and testing methods for the Cold Rule.
| Falsification condition | Testing method | Current status |
|---|---|---|
| Sustained net peat accumulation where MAT >15 °C | Global peatland monitoring data | Not observed |
| Coal measures of any extinction not predating the main pulse | High-resolution biostratigraphic correlation | All five predate |
| Mid-latitude extinction intensity not higher than low-latitude | Latitudinal extinction-rate statistics | Mid-latitude highest |
Table 3.
Stratigraphic sections and lithology–climate zone classification for the five mass extinction events (R = red/tropical; W = white/subtropical; B = black/cool-temperate; Blue = cold zone/glacial). All stratigraphic sequences are listed from younger (top) to older (base); climate zone sequences read in the same direction.
Table 3.
Stratigraphic sections and lithology–climate zone classification for the five mass extinction events (R = red/tropical; W = white/subtropical; B = black/cool-temperate; Blue = cold zone/glacial). All stratigraphic sequences are listed from younger (top) to older (base); climate zone sequences read in the same direction.
| Event | Location | Paleolatitude | Stratigraphic Sequence (younger → older) |
Main Lithologies (younger → older) |
Climate Zone (R/W/B/Blue) |
Sequence Order |
Sources |
|---|---|---|---|---|---|---|---|
| LOME | Upper Yangtze (central China) |
Low lat. (~10°S, Late Ordovician) |
Rongxi Fm. → Xiaoheba Fm. → Long-2 → Long-1 → Guanyinqiao Bed → Wufeng Fm. → Linxiang Fm. → Pagoda Fm. | Red beds → sandstone → lean shale → black shale → shelly limestone (extinction) → black shale → limestone (red beds) | R→W→W→B→Blue→B→W→R | Younger → older | Rong et al., 2012; Chen et al., 2004; Shen J J et al., 2023 |
| F-F | Rhenish Massif, Germany |
Mid-low lat. (~30°S) |
Famennian (top) → Upper Kellwasser → top Frasnian → Lower Kellwasser → lower Frasnian | Mudstone/limestone → black shale (upper) → carbonate → black shale (lower) → carbonate | W/R→B→W→B→W | Younger → older | Wang Y Y et al., 2020; Kaiser et al., 2006 |
| End-Permian | South China (Meishan, Sichuan) |
Low lat. (~10°N) |
Yinkeng Fm. (L. Triassic) → boundary clay → top Dalong → lower Dalong → Longtan Fm. → Maokou Fm. | Red beds/limestone → clay (extinction) → black shale → coal measures → carbonate + red beds | R→Blue→B→B→R | Younger → older | Shen et al., 2011; Li S Z et al., 2024; Mou et al., 2024 |
| End-Triassic | Sichuan & Ordos basins |
Mid lat. (~30°N) |
Jurassic base (red beds) → boundary → upper Xujiahe/Yanchang → lower Xujiahe/Yanchang → Leikoupo Fm. → Feixianguan/Liujiagou Fm. | Red beds → coal (near extinction) → coal measures → evaporites → red beds | R→Blue→B→W→R | Younger → older | Mao X P et al., 2026; Mou et al., 2024; Haq et al., 1987 |
| K-Pg | N. America, Deccan India |
Low–mid lat. (~25–45°N/S) |
Paleogene base → K-Pg boundary → Upper Cretaceous (Maastrichtian) | Shale/mudstone → Ir-rich clay/impact layer → Cretaceous limestone/sandstone | W→Blue*→W/R | Younger → older | Schulte et al., 2010; Scotese et al., 2021; Schoene et al., 2015 |
Notes: Paleolatitudes after Scotese et al. (2021). “Blue” in LOME is represented by the Guanyinqiao shelly limestone (Hirnantian glaciation, independently confirmed by glacial deposits and sharp sea-level fall). In the End-Permian, Blue is represented by the boundary clay and extremely fossil-poor beds. In the End-Triassic, Blue is inferred from the regional regression and biotic crisis horizon; direct cold-zone lithological markers are not preserved in the sections used. * For K-Pg, Blue is assigned on the basis of physical mechanism (impact/volcanic winter causing acute short-term cooling) rather than a preserved cold-zone lithological indicator and is therefore not directly comparable to the lithology-based Blue designations of the other four events.
Table 4.
Climate evolution in the Upper Yangtze region during the Late Ordovician–Early Silurian.
| System | Formation | Lithology | Inferred Climate Zone | Color / Temp. | Cycle |
|---|---|---|---|---|---|
| Silurian | Rongxi Fm. | Red beds | Tropical | Red / Hot | Positive cycle ↑ |
| Silurian | Xiaoheba Fm. | Sandstone | Subtropical | White / Warm | ↑ |
| Silurian | Long-2 | Shale (organic-poor) | Warm-temperate | White / Warm | ↑ |
| U. Ordovician | Long-1 | Black shale (organic-rich) | Cool-temperate | Black / Cold | ↑ |
| U. Ordovician | Guanyinqiao Bed | Shelly limestone (MASS EXTINCTION) |
Cold zone | Blue / Cold | Countercycle |
| U. Ordovician | Wufeng Fm. | Black shale | Cool-temperate | Black / Cold | ↓ |
| U. Ordovician | Linxiang Fm. | Limestone (minor red beds) | Subtropical | White / Warm | ↓ |
| U. Ordovician | Pagoda Fm. | Limestone (extensive red beds) | Tropical | Red / Hot | ↓ |
Table 5.
Lithological examination of Mesozoic–Cenozoic hyperthermal events and the Carnian.
| Event | Main Basis for Hyperthermal Interpretation |
Actual Mid-Low Latitude Lithologies |
Expected Tropical Lithologies |
Match? |
|---|---|---|---|---|
| End-Permian (252 Ma) | δ¹³C_org negative excursion; δ¹⁸O negative excursion |
Longtan/Dalong Fm. coal measures | Red beds, bauxites | No |
| TOAE (183 Ma) | δ¹³C_org negative excursion | North China coal seams, carbonaceous shale |
Red beds | No |
| OAE1a/OAE2 (94–120 Ma) | δ¹³C partly negative; δ¹³C positive; mainly TEX₈₆ |
High-lat. coal/black shale; low-lat. red beds coexist |
Low-lat. should be entirely red beds |
Partial (latitudinal response) |
| CPE (233 Ma) | δ¹³C_org negative excursion | Ordos/Sichuan basin coal measures |
Red beds, evaporites | No |
| PETM (56 Ma) | δ¹³C_org negative excursion | Arctic coal/carbonaceous shale; mid-lat. red beds |
Tropics expand to mid-latitudes |
Yes (only match) |
Note: During OAE1a/OAE2, high-latitude coal and black shale alongside low-latitude red beds reflects Cold Rule-predicted latitudinal differentiation under cold-zone expansion rather than globally uniform tropical conditions. TEX₈₆ data after Eldrett et al. (2015); other proxy interpretations after Hu X M et al. (2020).
Table 6.
Comparison of spatial differentiation predictions from the two competing hypotheses.
| Dimension | Hyperthermal–Anoxia Hypothesis | Cooling-Driven Hypothesis (This Paper) |
|---|---|---|
| Main extinction zone | Equatorial or globally uniform | Mid-latitudes (climate zone migration front) |
| Refugia location | High latitudes (organisms migrate poleward to escape heat) | Low latitudes near equator (organisms migrate equatorward to escape cold) |
| Extinction time sequence | No clear prediction, or equatorial-first | High lat. → mid lat. → low lat. (progressive) |
| Significance of mid-lat. coal measures | Product of oceanic anoxia | Indicator of cool-temperate climate |
| Relationship to marine regression | Requires separate tectonic explanation | Ice sheet growth causes regression; self-consistent with cooling |
Disclaimer/Publisher’s Note: The statements, opinions and data contained in all publications are solely those of the individual author(s) and contributor(s) and not of MDPI and/or the editor(s). MDPI and/or the editor(s) disclaim responsibility for any injury to people or property resulting from any ideas, methods, instructions or products referred to in the content. |
© 2026 by the authors. Licensee MDPI, Basel, Switzerland. This article is an open access article distributed under the terms and conditions of the Creative Commons Attribution (CC BY) license (http://creativecommons.org/licenses/by/4.0/).
Copyright: This open access article is published under a Creative Commons CC BY 4.0 license, which permit the free download, distribution, and reuse, provided that the author and preprint are cited in any reuse.