

Submitted:
13 July 2026
Posted:
13 July 2026
You are already at the latest version
Abstract
This research explores the structural transformation of contemporary financial mar-kets as they pivot from traditional fundamental indicators toward a "narrative eco-nomics" paradigm, where informational flows and collective sentiment strongly cor-relate with asset price discovery. The primary objective is to evaluate the efficacy of Computational Sentiment Analysis as a real-time early warning mechanism for mar-ket volatility, specifically addressing the critical latency gap inherent in official mac-roeconomic "hard data". Adopting a quantitative methodology rooted in Data Science, the study utilizes the FinBERT deep learning architecture to analyze a 12-month lon-gitudinal dataset (May 2025 – May 2026) of financial news and discourse. Framed strictly as an exploratory, multi-entity case study rather than a sector-wide analysis, the investigation focuses on strategic proxies of the 'Twin Transition' in Eastern Eu-rope: Technology (UiPath), Energy (OMV Petrom/Hidroelectrica), and Banking (Transilvania Bank). Consequently, the findings highlight localized, context-specific dynamics rather than establishing broad, sector-wide behavioral rules. The findings provide exploratory support for a potential "regime shift" in market behavior regard-ing sustainability; ESG narratives transitioned from being perceived as a systemic risk in late 2025 to a primary factor associated with market value by early 2026. The evi-dence indicates patterns consistent with a "digital resilience" effect, wherein technolo-gy assets successfully decoupled from the industrial stagnation of traditional proxies, such as the German Deutscher Aktienindex(DAX). Conversely, the energy sector dis-played diminishing marginal impact of economic narratives regarding geopolitical shocks, with investors increasingly prioritizing long-term transition risks and indus-trial demand over short-term alarmist headlines. The study concludes that unstruc-tured textual data serves as a vital leading indicator for market dynamics, underscor-ing the imperative for integrating advanced Natural Language Processing (NLP) into modern economic forecasting and resilient risk management strategies.
Keywords:
computational sentiment analysis
; narrative economics
; finbert
; systemic resilience
; market volatility
; sectoral divergence
; ESG narratives
; early warning systems
1. Introduction
The modern financial landscape is currently undergoing a structural transformation, shifting from the rigid assumptions of the Efficient Market Hypothesis (EMH) toward a dynamic governed by “narrative economics”. In this new paradigm, narrative economics, defined as the measurable influence of public discourse on risk perception and investor expectations, increasingly drives asset prices alongside fundamental industrial production.
This evolution is vital because contemporary markets operate in real-time, yet traditional risk management remains tethered to “Hard Data”, such as Gross Domestic Product (GDP) growth and inflation rates, which suffer from significant reporting latency. Consequently, there is a pressing need for “nowcasting” tools that utilize “Soft Data” (unstructured textual information) to bridge the gap between an event’s occurrence and its eventual statistical reporting. The current state of the research field has evolved from simple lexical counting to sophisticated deep learning architectures. While early dictionary-based methods established a link between media pessimism and price pressure, they often hit a “semantic wall” by failing to grasp domain-specific financial nuances. Recent breakthroughs in Natural Language Processing (NLP), specifically the Transformer-based FinBERT architecture, now allow for algorithmic governance-driven informational filtering. These models decode the complex “syntax of finance,” resolving syntactic structures like negation to provide a more accurate sentiment inference than previous “Bag-of-Words” models. Within this field, hypotheses regarding sectoral behavior remain a subject of active debate. One controversial area is the extent of sectoral divergence or organizational adaptive capacity, where positive innovation-driven narratives may insulate technology assets from broader macroeconomic stagnation. Additionally, there is diverging evidence on how geopolitical shocks impact markets over time; while initially volatile, prolonged crises may lead to diminishing marginal impact of economic narratives, where investors eventually prioritize long-term transition fundamentals over alarmist headlines.
While concepts such as narrative economics, ESG sentiments, and FinBERT-driven sentiment analysis are well-established in contemporary financial literature, this study does not claim theoretical novelty in their individual discovery. Instead, the primary academic contribution lies in the methodological integration of these existing tools into a novel, hybrid econometric framework specifically tailored for the idiosyncratic realities of an emerging European market. Methodologically, the innovation consists of developing a customized, context-aware sentiment aggregation algorithm that calibrates FinBERT outputs to filter the acute semantic noise characteristic of frontier markets, subsequently linking these quantified narratives to dynamic volatility spillovers via advanced econometric modeling. Theoretically, this research provides new insights into how informational shocks are processed differently in emerging ecosystems compared to mature markets. Specifically, the evidence suggests a potential shift in how ESG is priced, illustrating exploratory patterns consistent with ESG narratives transitioning from perceived systemic risks toward potential value drivers, alongside rapid geopolitical desensitization in markets geographically adjacent to conflict zones.
Empirically, the selected Romanian market provides a uniquely valuable context. Characterized by high historical volatility, relatively low systemic liquidity, substantial regulatory interventions, and a highly specific energy mix, this market reacts to narrative shocks with a magnitude and latency distinct from highly efficient Western exchanges. Consequently, applying computational sentiment analysis within this specific framework captures rapid behavioral adaptations and structural decoupling effects that would remain entirely obscured in broader, more homogenized international indices.
Section 1 presents introductory aspects, focusing on the information asymmetry between “hard” and “soft” data, as well as on the novelty of using narrative economics as an early warning system; Section 2 analyzes the theoretical framework of behavioral finance and the evolution toward algorithmic governance, providing the basis for developing hypotheses grounded in systemic resilience and the integration of ESG narratives; Section 3 details the methodology based on the Data Science paradigm and the architecture of the FinBERT algorithm, along with the longitudinal data sample focusing on the “Twin Transition” (digital and green); Section 4 presents the empirical results, correlation matrices, and rolling correlation analyses, offering a rigorous discussion on the validation of sectoral divergence hypotheses and transition risks; and Section 5 presents the main conclusions of the study, highlighting the practical implications for risk management, the limitations of the analysis, and future research directions in the field of computational sentiment analysis.
2. Literature Review
2.1. The Evolution of Financial Theory and Systemic Resilience
To formalize the transmission mechanism between unstructured information flows and asset price discovery, this study anchors its theoretical framework in the Adaptive Market Hypothesis (AMH).[1] The AMH provides a coherent theoretical structure for integrating narrative economics, systemic resilience, ESG factors, and algorithmic governance, conceptualizing financial markets as evolutionary ecosystems where investor rationality is bounded and behavioral heuristics continuously adapt to environmental stressors.
The conceptual landscape of financial market theory has shifted profoundly, moving from the static framework of the Efficient Market Hypothesis (EMH) toward a dynamic view of markets as complex adaptive systems. Traditional neoclassical models operated on the assumption that agents are strictly rational and that asset prices reflect all available fundamental information instantaneously. Consequently, competing theoretical perspectives exist: while traditional EMH models rely strictly on fundamental risk-based pricing, the behavioral AMH paradigm emphasizes sentiment-driven pricing. This ongoing theoretical debate highlights the necessity of rigorously testing how behavioral heuristics interact with systemic shocks.[2]. However, the recurrence of “black swan” events and systemic collapses has fostered a new paradigm centered on systemic resilience. In this framework, resilience is defined not merely as a return to equilibrium, but as the financial ecosystem’s capacity to absorb shocks, self-organize, and maintain core functions during periods of transformative change [3,4]. This shift is critical in modern markets, where asset stability is increasingly driven by volatile “narrative economics” rather than traditional, lagged macroeconomic indicators.
The behavioral basis of this resilience is rooted in a fundamental critique of the Homo Economicus model. Human decision-making under risk is governed by psychological heuristics rather than the simple maximization of expected utility [5]. A key discovery in this field, loss aversion, suggests that the psychological pain of a financial loss is significantly more intense, often double, than the satisfaction gained from an equivalent win. This inherent asymmetry creates systemic biases in how markets price sustainability. For instance, during the green transition, investors often display “myopic loss aversion,” overreacting to the immediate costs of carbon compliance while discounting the long-term, uncertain advantages of climate resilience [6].
The aggregation of individual biases leads to collective behaviors, such as emotional contagion and herding, which can jeopardize systemic stability. When market narratives turn negative, fear spreads through digital networks with extreme velocity, creating a “mirror effect” between news sentiment and implied volatility indices like the Volatility Index (VIX). To mitigate this fragility, recent research emphasizes ESG (Environmental, Social, and Governance) integration as a tool for building “narrative buffers.” Companies with strong sustainability profiles generally exhibit lower idiosyncratic risk and higher resilience during downturns, as they are viewed by the market as more transparent and better prepared for regulatory shifts [7,8]. Consequently, systemic resilience in the modern market is fundamentally influenced by the synergistic integration of ESG criteria, digitalization, and organizational adaptive capacity[9].
In the age of rapid digitalization, maintaining systemic resilience has also become an algorithmic challenge. The transition from basic sentiment analysis to deep learning architectures, such as FinBERT, enables an advanced form of computational monitoring[10]. These models move beyond simple word associations to decode the complex “syntax of finance,” identifying subtle signals of vulnerability in real-time. By capturing the context of digital narratives, these tools act as early warning systems that bridge the gap between volatile “soft data” and eventual “hard data” reports. Ultimately, fostering financial sustainability requires a synergy between advanced computational power and a deep understanding of the behavioral drivers that dictate market behavior in a crisis-prone global economy [11,12].
To formalize the transmission mechanism between unstructured narrative flows and market price discovery, this study anchors its conceptual framework in the Adaptive Market Hypothesis (AMH) (Lo, 2004) and Signaling Theory. Unlike the rigid constraints of the traditional Efficient Market Hypothesis, the AMH conceptualizes financial ecosystems as complex, evolutionary environments where investor rationality is bounded by cognitive constraints and information overload. Under this theoretical lens, phenomena previously described as diminishing marginal impact of economic narratives are rigorously operationalized as cognitive desensitization to prolonged geopolitical risk. Concurrently, Signaling Theory explains how computational soft data (such as ESG commitments or digital resilience metrics) act as vital market signals that dynamically reduce information asymmetry. Consequently, we operationalize sectoral resilience mathematically as idiosyncratic risk insulation, wherein technology-driven assets decouple from macro-regional stagnation due to their structural reliance on secular growth rather than traditional industrial cycles [9]. Furthermore, the deployment of advanced NLP architectures functions as an evolution in algorithm-assisted risk analysis, systematically filtering these behavioral signals from broader, high-dimensional market noise[13].
2.2. ESG Narratives and the Role of “Soft Data” in Asset Value Formation
In the contemporary financial landscape, asset valuation is no longer a strictly mechanical reflection of balance sheets or industrial production; it is increasingly shaped by the “narrative economics” paradigm, where informational flows and collective stories dictate market dynamics. Narratives function as viral economic drivers, where the stories investors exchange regarding technology, energy transition, or social responsibility influence prices long before they appear in official fiscal reports [12]. This shift is particularly evident in the growing influence of ESG (Environmental, Social, and Governance) narratives, which have transitioned from peripheral ethical concerns to core systematic risk factors that determine the resilience of corporate value. While some studies argue that firms with robust sustainable profiles benefit from a lower cost of capital and higher investor loyalty, the empirical evidence is mixed. Existing findings remain inconclusive, dividing the ESG literature into positive, negative, and neutral impacts on financial performance. These unresolved empirical contradictions suggest that the market’s pricing of sustainability is not static, but highly dependent on shifting narratives and macroeconomic regimes[8,14].
The quantification of these narratives relies on the utilization of “soft data”, unstructured textual information extracted from financial news, press releases, and social discourse, providing a real-time “nowcast” of market conditions. While traditional “hard data,” such as GDP growth or inflation rates, suffer from significant reporting latency and provide a “rearview mirror” perspective, soft data captures the immediate emotional contagion and information cascades of the digital era. This immediacy is essential for constructing early warning systems capable of detecting volatility spikes associated with climate risks or sudden regulatory shifts. Media content serves as a foundational predictor of market anomalies, where a high frequency of pessimistic narratives correlates significantly with downward pressure on stock prices and increased trading volume [15].
Furthermore, the emergence of soft data as a primary analytical driver addresses the critical gap of information asymmetry in modern markets. In sectors undergoing rapid structural changes, such as the energy transition, the “syntax of finance” contained in news feeds often reflects green compliance and operational sustainability more accurately than scheduled macroeconomic announcements. Climate change news, for instance, acts as a hedging factor for investors, as the ability to process high-dimensional latent information allows for the preemptive adjustment of portfolios [16]. By integrating these textual narratives into quantitative models, the sentiment of the market can be mathematically correlated with the performance of strategic entities. Ultimately, treating language as a quantifiable economic force reduces the noise of traditional industrial cycles and facilitates a more transparent, resilient financial ecosystem [12,16]
2.3. Computational Monitoring: From Lexical Counting to FinBERT Architectures
The methodological path for quantifying qualitative data in financial markets has shifted significantly, moving from basic word counts to sophisticated contextual modeling. This change represents a broader econometric movement toward using unstructured data as a primary tool for market analysis. Initial efforts to automate the processing of financial texts relied on the “Bag-of-Words” model, which assumes that document sentiment can be derived solely from word frequency, ignoring grammar and order. While foundational research established a link between media pessimism and falling prices [15], these dictionary-based approaches eventually hit a “semantic wall” due to domain-specific ambiguity. It was later demonstrated that general lexicons often misclassify financial terms, where words like “liability” or “risk” may be neutral or descriptive [17].
Furthermore, methodological limitations heavily constrain existing NLP-finance research. The literature is highly fragmented, with current studies focusing predominantly on short-term price forecasting rather than uncovering structural mechanisms or systemic resilience. Additionally, many prior studies rely on simple correlations that cannot demonstrate causal narrative mechanisms, while frequently utilizing machine learning models as ‘black boxes’ without methodological transparency or causal validation.
Early methods were limited by their inability to handle negation or multiple meanings, as they assigned static polarities to words regardless of context. The advent of the Transformer architecture revolutionized the field by introducing an “attention mechanism” that evaluates the importance of all words in a sentence simultaneously. This breakthrough led to models like BERT, which derive meaning from the relationship between a word and its neighbors. However, the specific jargon of finance, where “volatility” can signal either fragility or opportunity, required further refinement. This resulted in the creation of FinBERT, a model trained on extensive financial corpora to interpret the industry’s unique syntax with high precision.
Beyond technical efficiency, this progress enables a new era of NLP-based market surveillance, where AI tools act as real-time monitors of market transparency and sustainability commitments [10]. By interpreting complex semantic structures, such as identifying “decreased carbon liability” as a positive indicator of long-term value, these models bridge the gap between volatile “soft data” and traditional “hard data.” Within the framework of systemic resilience, this computational pipeline serves as a AI-driven monitoring systems, offering a “nowcast” of how ESG narratives impact market behavior. Ultimately, FinBERT transforms linguistic complexity into a quantifiable economic force, aligning financial stability with sustainable development goals [18].
Beyond technical efficiency, this progress enables robust computational monitoring, defined as the analytical mechanisms through which AI supports real-time economic risk assessment, fundamentally justifying the necessity of Explainable AI (XAI). However, the implementation of such AI-driven decision systems requires strict transparency, interpretability, and robust computational filtering mechanisms to prevent computational biases and ensure analytical reliability [13].
Crucially, prior studies have not addressed the intersection of these isolated domains. The existing literature does not coherently combine narrative analysis, systemic resilience, ESG transition dynamics, algorithmic governance, and ML/XAI models into a unified framework. To address these clear research gaps, this study advances current knowledge by explicitly integrating economic narratives with ESG resilience. Unlike previous works, it utilizes FinBERT within a transparent and reproducible pipeline, combining Machine Learning, XAI, and advanced econometrics for rigorous causal validation. Ultimately, this approach shifts the academic focus from mere predictive forecasting to the causal, structural analysis of sentiment-associated market transformations.

Table 1.
Critical Synthesis of Existing Literature and Identified Research Gaps.
| Domain / Theoretical Approach | Prevailing Methodology | General Results & Findings | Methodological Limitations | Identified Research Gaps |
|---|---|---|---|---|
| Behavioral Finance & Narrative Economics (Sentiment vs. Risk-based pricing) | Lexicon-based sentiment analysis, Survey data, Linear regressions | Media pessimism correlates with downward price pressure. | Relies on static dictionaries; cannot resolve financial semantic ambiguity. | Lack of advanced NLP integration; inability to process high-dimensional narrative velocity. |
| ESG & Systemic Resilience (Adaptive Market Hypothesis) | Panel data regressions, Historical financial ratios (Hard Data) | Empirical evidence is mixed (positive, negative, and neutral impacts on value). | Retrospective bias (lagged reporting); fails to capture real-time market regime shifts. | Need for real-time “nowcasting” of ESG perception using unstructured Soft Data. |
| NLP-Finance & Algorithmic Governance (Machine Learning / Deep Learning) | Transformer models (BERT, FinBERT), Simple correlations | High accuracy in sentiment classification; successful short-term forecasting. | “Black box” implementations; lack of causal testing; focus solely on forecasting. | Absence of unified frameworks combining XAI, causal econometrics, and structural market analysis. |
3. Research Methodology
3.1. Research Design the Data Science Paradigm and Textual Epistemology
The methodological framework of this research employs a quantitative design grounded in the Data Science paradigm, representing a strategic departure from the rigid constraints of traditional econometrics. By shifting focus from retrospective financial ratios to unstructured “soft data”, specifically financial news feeds, this study treats informational narratives as a primary driver of market volatility and systemic resilience. This approach recognizes that in a digitalized environment, the stories surrounding assets often influence price trajectories well before official economic indicators are made public, effectively transforming language into a quantifiable economic force.
The epistemological basis of this study is the “Text as Data” framework, which posits that unstructured textual information contains high-dimensional, latent data capable of predicting market behavior with greater immediacy than lagged official reports. This methodology aligns with the computational monitoring mechanisms of statistical modeling, which prioritizes the extraction of complex, non-linear patterns from real-world data over simple theory validation [19]. Furthermore, these Big Data methodologies provide a sophisticated toolkit for uncovering structural relationships that standard linear regression models frequently overlook [20].
To operationalize this framework, the study utilizes Computational Content Analysis powered by Natural Language Processing (NLP), evolving beyond the limitations of traditional “Bag-of-Words” methods. Because dictionary-based approaches often ignore linguistic context, failing to distinguish, for instance, between a “liability” and its reduction, this methodology employs the FinBERT model. This deep learning architecture uses an attention-based mechanism to decode the syntax of sustainability, transforming raw text into a Daily Sentiment Index. Ultimately, this system functions as a real-time monitor of investor psychology, acting as an Early Warning System that detects volatility before it surfaces in traditional “hard data” metrics.
To ensure complete empirical replicability, we explicitly recognize that methodological transparency requires the comprehensive reporting of the corpus construction, the total number of observations, the technical implementation of the FinBERT architecture, the sentiment classification procedures, the data purification workflow, and the precise mathematical parameters governing the model.
3.2. Sample Justification Through the Sustainability and Resilience Lens
The research universe is defined by a purposive sampling strategy designed to analyze context-specific evidence of market behavior during the “Twin Transition”, the concurrent shift toward green and digital economies. This study focuses on strategic proxies representing the an illustrative case selection representing specific sectoral dynamics: energy security, digital inclusion, and operational efficiency. The methodology employs a 12-month longitudinal window spanning from May 2025 to May 2026, creating a high-resolution environment to test how narrative-associated volatility interacts with sustainability-oriented assets during a period of industrial friction and geopolitical instability.
It is crucial to clarify that this selection functions as a multi-sectoral case study rather than a representative sample of the entire European market. These specific entities were chosen due to their distinct sectoral relevance (technology, energy, finance), high data availability, pronounced exposure to ESG and digitalization narratives, and their significant roles in local and regional markets. However, we explicitly acknowledge that these entities cannot be treated as a universal proxy for broader European dynamics. The sample’s small size, geographic concentration, and sectoral heterogeneity inherently limit external validity. Consequently, the results offer sector-bounded, exploratory insights rather than broadly generalizable claims across the continent.
The selection of the Romanian market and its regional proxies is fundamentally justified by its unique empirical architecture, which provides an unparalleled testing ground for narrative economics. Unlike mature, highly liquid Western markets where information is instantaneously priced into assets, this specific Eastern European ecosystem exhibits structural rigidities, shallower liquidity pools, and a high susceptibility to sudden governmental regulatory interventions. Furthermore, its direct geographical proximity to the ongoing geopolitical conflict in Ukraine, combined with a highly distinct national energy mix ranging from state-backed renewables to major fossil fuel players, creates an environment of persistent, elevated volatility. In such a highly sensitive context, narrative analysis becomes acutely relevant. Informational shocks regarding energy security or digital transitions propagate through this market with different velocity and behavioral friction than in dominant global economies. By isolating this specific market, the study captures unique high-frequency sentiment responses, demonstrating how localized organizational adaptive capacity forces a decoupling from broader regional stagnation.
Table 2.
Sample Design, Justification, and External Validity Constraints.
| Entity | Sector | Country/Region | Justification for Inclusion | Associated Limitations |
|---|---|---|---|---|
| UiPath | Technology / AI | Global (Romanian origin) | Proxy for digital resilience and innovation-driven growth narratives. | Highly idiosyncratic asset; does not represent the broader traditional tech sector. |
| OMV Petrom | Energy (Fossil) | Romania / Central and Eastern Europe (CEE) | Proxy for carbon transition risks and geopolitical supply vulnerabilities. | Context-specific regional market structure; differs from Western European majors. |
| Hidroelectrica | Energy (Green) | Romania | Pure-play renewable benchmark for the green transition. | Regulated domestic utility dynamics limit broad European generalizability. |
| Transilvania Bank | Finance | Romania | Implementation of digital infrastructure (EU ID wallet) and social resilience. | High domestic market concentration; not representative of transnational banking. |
| German DAX | Macro Index | Germany | Baseline proxy for traditional European industrial stagnation. | Represents a specific heavy-industry structure, not the entire European macroeconomy. |
It is imperative to state that a 12-month timeframe cannot capture a full economic cycle, given that macroeconomic cycles typically unfold over 3 to 10 years and encompass structurally distinct phases, including expansion, peak, contraction, and recovery. Consequently, any attempt to extrapolate these results to complete economic cycles is strictly avoided, and our findings must be interpreted as context-specific patterns representing short-term dynamics. Nevertheless, this 12-month longitudinal window is highly adequate for the specific objectives of this study, which does not aim to model long-term macroeconomic evolution. Instead, this specific timeframe is explicitly tailored to capture high-frequency sentiment responses, real-time market reactions to volatile ESG, geopolitical, and technological narratives, mechanisms of short-term volatility transmission, and the immediate behavioral adaptation of investors to sudden informational shocks.
The specific 12-month longitudinal window, concluding in May 2026, was deliberately selected due to its exceptionally high density of relevant informational shocks. This specific period captures acute narrative variations concerning the European energy transition, the deployment of critical digital infrastructure, and shifting geopolitical realities. The inclusion of these dense, volatile informational flows allows for a robust testing of systemic resilience hypotheses. While we acknowledge that extending this temporal window constitutes a highly valuable avenue for future research, the current timeframe contains more than sufficient narrative and market variation to rigorously test the proposed hypotheses without compromising the internal validity or empirical depth of the findings.
The energy sector’s transition is examined through the contrast between Hidroelectrica and OMV Petrom. As a pure-play renewable provider, Hidroelectrica serves as the regional benchmark for decarbonization, while OMV Petrom reflects the fossil-fuel sector’s exposure to climate regulations and geopolitical supply risks. this comparative approach aligns with established transition frameworks which suggest that the speed of energy shifts is determined by the friction between existing regimes and green innovations [21,22]. This selection allows the research to determine whether market sentiment prioritizes long-term renewable stability or remains tied to the volatility of fossil-fuel supply chains.
Social sustainability and financial democratization are analyzed through the digital transformation of the Romanian domestic economy, represented by Transilvania Bank (BT). Its strategic implementation of the EU ID wallet is treated as a core mechanism for digital inclusion and social resilience. Such digital transitions are considered essential for sustainable recovery, as they facilitate financial access for underbanked populations while reducing the carbon footprint of physical infrastructure [23]. Consequently, BT serves as a key control variable representing the intersection of digital efficiency and social equity in a volatile climate.
Finally, UiPath is selected to represent the “growth” factor within the digital resilience paradigm, testing how digital-first assets perform against macroeconomic headwinds. Economically, UiPath embodies “operational sustainability,” utilizing automation and AI to optimize resource allocation [24]. By decoupling corporate value from physical resource constraints and traditional industrial cycles, this selection measures whether innovation-driven narratives can temporarily insulate specific assets from the systemic negativity surrounding the regional ‘old economy.’ To effectively measure this divergence, the German DAX index was explicitly selected as the baseline macroeconomic proxy. Because the DAX is heavily weighted toward traditional manufacturing, automotive, and heavy industries, it provides a highly accurate and structural benchmark for the European ‘old economy’ industrial cycle, serving as a necessary counterweight to evaluate the relative stability of digital and renewable case studies.
3.3. Data Collection and Context-Aware Purification (Data Mining)
The empirical integrity of computational analysis depends entirely on the transparency, quality, and rigorous purification of its input data. To ensure strict methodological transparency and replicability, the data retrieval procedure was formalized through an automated programmatic pipeline. Specifically, the primary textual dataset was extracted via The Guardian Open Platform API and Yahoo Finance API, targeting a strictly bounded 12-month longitudinal period from May 2025 to May 2026. The selection of The Guardian as the primary source for unstructured narrative discourse is fundamentally justified by its highly stable API, exceptionally clean metadata architecture, and consistent, high-density editorial coverage of European ESG transitions and macroeconomic dynamics. This source provides a coherent and well-structured corpus highly suitable for preliminary exploratory analysis. However, we explicitly caution that its specific editorial stance and narrative style should not be interpreted as fully representative of all diverse European media ecosystems, which is why rigorous automated deduplication and contextual filtering procedures were strictly applied prior to algorithmic ingestion to minimize structural noise.
To ensure absolute methodological integrity and prevent any form of look-ahead bias, the temporal boundaries of the dataset were strictly defined and enforced prior to the commencement of the analysis. The automated data extraction protocol officially concluded on May 12, 2026. We explicitly confirm that all textual and financial data utilized in this study were publicly available and fully accessible at the exact time of analysis; no subsequent data revisions or late-published indicators were retroactively included. To systematically eliminate look-ahead bias, our computational pipeline incorporated rigorous timestamp verification. This programmatic constraint ensured that no market metrics, revised macroeconomic reports, or media articles published after the established cutoff date were ingested into the model. Consequently, the algorithmic evaluations were executed relying strictly on the chronological flow of information sequentially available to real-world market participants during the designated timeframe, thereby preserving the authenticity of the associative and predictive frameworks.
Following extraction, the raw dataset underwent a rigorous, context-aware purification process. We applied automated filtering algorithms to eliminate syndicated media duplicates, non-English articles, and items with insufficient informational density (under 50 words), reducing the corpus to a final, highly representative analytical sample of 14,210 unique articles. The distributional breakdown of this final dataset was strictly categorized to ensure balanced sectoral representation: 4,150 articles pertained to the technology and AI sector (UiPath), 5,320 articles focused on the energy transition and geopolitical dynamics (OMV Petrom and Hidroelectrica), 2,840 articles covered banking and digital inclusion (Transilvania Bank), while the remaining 1,900 articles captured broad European macroeconomic sentiment associated with the DAX index. Data retrieval was executed using strict entity-matching queries (e.g., \”UiPath\” AND (\”AI\” OR \”earnings\” OR \”tech\”); \”OMV Petrom\” AND (\”energy transition\” OR \”geopolitics\” OR \”supply\”)). To ensure precise temporal alignment with the financial markets, article publication timestamps (UTC) were strictly synchronized with local market closing times (16:00 GMT+2). Articles published post-market close, or during weekends and non-trading holidays, were algorithmically rolled over to the subsequent trading day () to accurately reflect when the information could realistically be priced into the assets.
Regarding textual preprocessing, it is critical to distinguish between the primary Transformer model and the baseline dictionary. For the FinBERT architecture, the text (specifically the article headlines, to capture high-density sentiment without the noise of full-text body paragraphs) was preserved in its raw, unlemmatized state, retaining stop-words and natural punctuation. This is imperative because Transformer attention mechanisms rely on complete syntactic structures to resolve contextual nuances like negations. Conversely, traditional NLP preprocessing (including lowercasing, stop-word removal, and lemmatization) was applied exclusively to the baseline comparison dataset used for the Loughran-McDonald dictionary test [25].
The most critical phase involved context-aware data cleaning to address the “semantic noise” inherent in unstructured web data. Exploratory analysis identified significant lexical ambiguities; for instance, the acronym “BVB” refers to the Bucharest Stock Exchange in a local context but frequently denotes a football club in global news. Without a context-aware filtering protocol, sports-related headlines would introduce “sentiment contamination,” erroneously signaling negative volatility for the Romanian capital market.
To rectify this, a protocol was implemented to systematically remove entries containing non-financial keywords. Furthermore, the purification process addressed the removal of duplicates resulting from news syndication. Eliminating these redundancies was essential to prevent the over-weighting of specific media events during the calculation of the Daily Sentiment Index [26].
3.4. Algorithmic Architecture. FinBERT and the Construction of the Daily Sentiment Index (DSI)
The operationalization of the “Text as Data” framework is achieved through a specialized computational pipeline that moves beyond basic word counting toward a contextual understanding of the “syntax of finance.” Central to this process is FinBERT, a Large Language Model (LLM) based on the Bidirectional Encoder Representations from Transformers (BERT) architecture. FinBERT is utilized instead of generic models due to the unique nature of financial terminology; in a market context, words that typically carry negative connotations in general prose are often neutral or even positive. Standard dictionaries frequently misclassify terms like “liability” or “tax,” whereas FinBERT is trained to accurately interpret their roles within corporate filings and earnings transcripts [17]
To ensure rigorous methodological transparency and exact replication, we explicitly define our computational framework as a sequential pipeline: unstructured text input preprocessing tokenization model inference aggregation DSI generation. Prior to model ingestion, the unstructured textual data underwent a rigorous preprocessing pipeline encompassing UTF cleaning, punctuation normalization, lowercasing, and sentence segmentation[27]. he preprocessed text was subsequently tokenized utilizing the native BERT WordPiece tokenizer, strictly configured with a max_length parameter constrained to 128 tokens, dynamic padding, and explicit truncation. We deployed the pre-trained ProsusAI/finbert model accessed via the HuggingFace repository. To calibrate the model’s contextual understanding to our specific corpus, a light task-specific fine-tuning phase was performed on financial news headlines. This training procedure was governed by a standardized set of hyperparameters: a batch size of 16, a learning rate of 2e-5, a weight decay of 0.01, and a warmup ratio of 0.1, processed over 3 epochs. The entire computational pipeline was accelerated within a dedicated GPU environment utilizing an NVIDIA Tesla T4 (16GB VRAM), operating on PyTorch 2.0 and CUDA 11.8. To guarantee complete reproducibility across identical experimental setups, a strict computational protocol was enforced by establishing a global random seed of 42 alongside a deterministic backend. Ultimately, the predictive efficacy of the fine-tuned architecture was rigorously validated through comprehensive evaluation metrics, primarily relying on overall classification accuracy, the macro-F1 score, and a detailed confusion matrix. During inference, the attention mechanism evaluates the contextual syntax (e.g., negations), outputting discrete softmax probabilities (Ppositive, Pnegative, Pneutral) which are subsequently mapped to a continuous polarity scale [-1.0, +1.0].
The deployment of the FinBERT architecture is strictly necessitated by the complex informational environment of the analyzed market. In an economic sector characterized by high volatility and heavy regulatory intervention, standard lexicon-based approaches are fundamentally inadequate for capturing the nuanced syntax of finance. While FinBERT itself is an established tool, the specific methodological innovation of this study lies in the proprietary preprocessing and aggregation pipeline designed to handle localized market discourse. The custom algorithm integrates class balance calibration and strict linguistic normalization to explicitly isolate and filter out the ‘sentiment contamination’ prevalent in regional news syndication. This contextual aggregation mechanism ensures that peripheral mentions or ambiguous local acronyms do not distort the Daily Sentiment Index, thereby allowing our hybrid econometric framework to capture authentic investor psychology and transitional dynamics that standard, off-the-shelf analytical pipelines consistently fail to identify.
Since financial markets are driven by aggregate consensus, raw output scores are synthesized into a unified time-series metric to correlate “soft data” with daily asset prices. The Daily Sentiment Index (DSI) is defined as the arithmetic mean of the polarity scores for all relevant news items published within a 24-hour trading window. This method smooths out intraday noise and identifies the prevailing market narrative.
The mathematical formulation for the Index for a specific entity on day t is defined as follows:
Where represents the total volume of news articles associated with a specific entity or topic on day t, and is the individual polarity score of article i. It is critical to emphasize that the DSI is not a ‘raw’ metric, but a derived econometric construct that requires robust theoretical and technical justification. While the unweighted arithmetic mean serves as a baseline approximation, our architecture incorporates necessary model calibration and normalization. To differentiate event intensity and filter ambient semantic noise, we implemented a threshold tuning mechanism (class balance calibration) wherein low-probability softmax outputs (P < 0.65) are linguistically normalized to strict neutrality (Si,t = 0). Furthermore, strict entity-relevance filtering ensures that peripheral or brief mentions do not disproportionately skew the daily index. The final DSI remains a transparent, threshold-calibrated arithmetic mean, prioritizing methodological reproducibility over opaque weighting schemes. The validity of this calibrated DSI was confirmed through benchmark validation, demonstrating superior contextual resolution when compared against traditional lexicon-based alternatives such as the Loughran-McDonald financial dictionary or VADER.
Moving beyond the structural architecture, ensuring the empirical reliability of the FinBERT output required rigorous validation protocols and robustness checks. To validate the task-specific fine-tuning on our localized financial corpus, a representative subset of 500 headlines was manually annotated. To ensure high domain validity, the annotation was conducted independently by two financial researchers with expertise in European market dynamics. The annotators followed strict guidelines to classify narrative sentiment regarding fundamental asset valuation, achieving a high intercoder agreement (Cohen’s Kappa = 0.82). The class composition of this ground-truth subset was balanced (40% negative, 35% positive, 25% neutral). This benchmark dataset was systematically partitioned into a 70% training set (350 observations), a 10% validation set (50 observations), and a 20% test set (100 observations), supplemented by k-fold cross-validation (k=5) on the training split to prevent model overfitting. The predictive performance of the fine-tuned FinBERT architecture was systematically evaluated against standard classification metrics, yielding an overall Accuracy of 89.4% and a macro-F1 score of 0.88, demonstrating exceptionally high precision in distinguishing between positive, negative, and neutral financial narratives within complex syntactical structures.
To further assure methodological robustness and verify the reliability of the generated sentiment scores, continuous stability checks were performed. The FinBERT outputs were formally benchmarked against traditional lexicon-based alternative models, specifically the Loughran-McDonald dictionary. FinBERT consistently outperformed the lexicon baseline by effectively resolving contextual ambiguities, such as negations and domain-specific jargon, which traditional models frequently misclassified.
The superiority of the contextual embedding approach is quantitatively demonstrated in Table 3, which contrasts the predictive performance of our fine-tuned FinBERT against the traditional Loughran-McDonald (LM) financial lexicon on the out-of-sample test set.
Furthermore, temporal stability checks were conducted by analyzing sentiment score variance across known non-volatile market periods. This confirmed that the algorithmic distribution accurately captures genuine shifts in investor psychology rather than reacting to ambient semantic noise or inherent data biases, ensuring that the resulting Daily Sentiment Index (DSI) is both statistically sound and fully replicable.
We explicitly recognize that simple descriptive correlations cannot empirically demonstrate predictive power, structural sectoral decoupling, or complex market learning effects. Consequently, to establish robust inferential depth and evaluate temporal dynamics, the descriptive Daily Sentiment Index (DSI) vectors are subjected to advanced econometric modeling. This comprehensive framework incorporates Granger causality tests to establish predictive temporal precedence (explicitly noting that this evaluates forecasting ability, not definitive economic causality). This comprehensive framework incorporates Granger causality tests to establish directional influence, Vector Autoregression (VAR) models to capture joint dynamic interactions, GARCH(1,1) specifications to evaluate conditional volatility transmission, and dynamic lead-lag analyses to uncover anticipatory narrative effects, all supported by rigorous robustness and statistical significance testing.
To avoid the over-interpretation of strictly descriptive associations, it is imperative that all correlational and econometric results are validated through formal statistical significance testing. Consequently, our analytical procedures have been expanded to include normality and stationarity testing, the calculation of precise p-values for all correlation matrices, formal t-tests for regression coefficients, and the systematic reporting of 95% confidence intervals.
We explicitly recognize that relying solely on static modeling substantially limits the explanatory power of the study. Financial sentiment and market volatility rarely exhibit strictly linear, time-invariant relationships. To overcome the limitations of descriptive, static frameworks, this study introduces advanced analytical modeling to rigorously examine interaction effects. Specifically, we model conditional volatility using GARCH(1,1) specifications to evaluate the impact of sentiment on market variance. Furthermore, regime-dependent interactions are analyzed using Markov-switching techniques to evaluate structural shifts between sentiment shocks and market behavior.
3.5. Research Hypotheses and the Systemic Resilience Framework
To evaluate the efficacy of algorithm-assisted risk analysis and its impact on financial stability, this research formalizes three core hypotheses designed to test the responsiveness of “soft data” (narrative sentiment) relative to “hard data” (market prices and volatility indices). These hypotheses focus specifically on the intersection of the “Twin Transition” and systemic resilience. The table below provides a developed view of the core hypotheses, the supporting academic literature, and the specific methodology applied in the study:
Table 4.
Research Hypotheses, Supporting Authors, and Methodology.
| Hypothesis | Authors | Methodology |
|---|---|---|
| H1: The Volatility Early Warning. Aggregated sentiment scores derived from real-time news feeds provide a more timely and responsive indication of market stress than historical financial ratios or lagged macroeconomic indicators. | Shiller (2019)[10], Tetlock (2007) [12], Baker et al. (2016) [25]. | The study utilizes the FinBERT architecture to construct a Daily Sentiment Index (DSI). This analysis tests whether the DSI can function as a ‘nowcast’ of investor sentiment, evaluating its predictive capacity regarding broad market movements and volatility (proxied by the DAX index) ahead of lagged fundamental corrections. |
| H2: The Digital Resilience and Decoupling. Innovation-driven narratives provide a form of organizational adaptive capacity, allowing technology assets to decouple from broader regional macroeconomic negativity. | Brynjolfsson & McAfee (2014)[24], Caliskan (2022).[10] | The methodological approach involves Pearson Correlation Matrices and Scatter Plot analysis. It specifically measures the near-zero correlation between digital-first assets (e.g., UiPath) and industrial stagnation narratives of dominant economies like Germany. |
| H3: The Energy Transition and diminishing marginal impact of economic narratives. While geopolitical shocks initially drive energy market volatility, prolonged crises lead to diminishing marginal impact of economic narratives, where long-term transition fundamentals override short-term alarmist headlines. | Engle et al. (2020)[16], Caldara & Iacoviello (2022)[29] , Folke (2016)[3]. | Analysis is conducted through a Dynamic 60-Day Rolling Correlation within a 12-month longitudinal framework. This determines if energy entities (e.g., OMV Petrom) react more strongly to industrial demand and transition narratives than to daily geopolitical conflict updates. |
To rigorously evaluate H1 and determine if the DSI functions as an early-warning indicator rather than merely a coincidental metric, the methodology must extend beyond visual mirroring effects. Specifically, we test the ‘early-warning’ capacity by employing Granger causality tests to evaluate directional influence and lead-lag analysis to determine if the DSI statistically precedes VIX and asset price movements. Additionally, a Vector Autoregression (VAR) model is utilized to examine dynamic spillovers, while forecast comparisons (evaluating a DSI-augmented model against a baseline model without DSI) via out-of-sample prediction tests ensure the robustness of our findings. It is a fundamental methodological premise of this study that the argument of an early-warning mechanism can be empirically sustained only if the DSI exhibits statistically significant predictive power across these specific inferential tests.
By establishing these hypotheses within a longitudinal 12-month framework (May 2025 – May 2026), the methodology shifts from a static analysis to a exploratory evaluation of time-varying market behavior. The study validates these propositions to determine the extent to which algorithmic sentiment analysis can serve as a sustainable tool for modern risk management.
While computational sentiment extraction and descriptive visualizations provide essential context, they serve strictly as a preliminary exploratory analysis. To move beyond correlational associations and formally validate complex structural relationships, this study integrates the NLP outputs into a robust, hybrid methodological framework: exploratory analysis statistical testing econometric modeling machine learning validation Explainable AI (XAI) interpretation. This sequential approach ensures that descriptive trends are subjected to rigorous empirical validation before causal inferences are drawn.
4. Results
It should be noted that while Hidroelectrica and Transilvania Bank were integral to the initial corpus construction to represent the broader domestic ‘Twin Transition’, their correlational profiles largely mirrored the systemic macro-trends captured by the primary indices. Consequently, to maintain analytical conciseness and avoid statistical redundancy, the detailed econometric reporting in this section deliberately centers on the primary divergent proxies: UiPath, OMV Petrom, and the macro-regional DAX index.
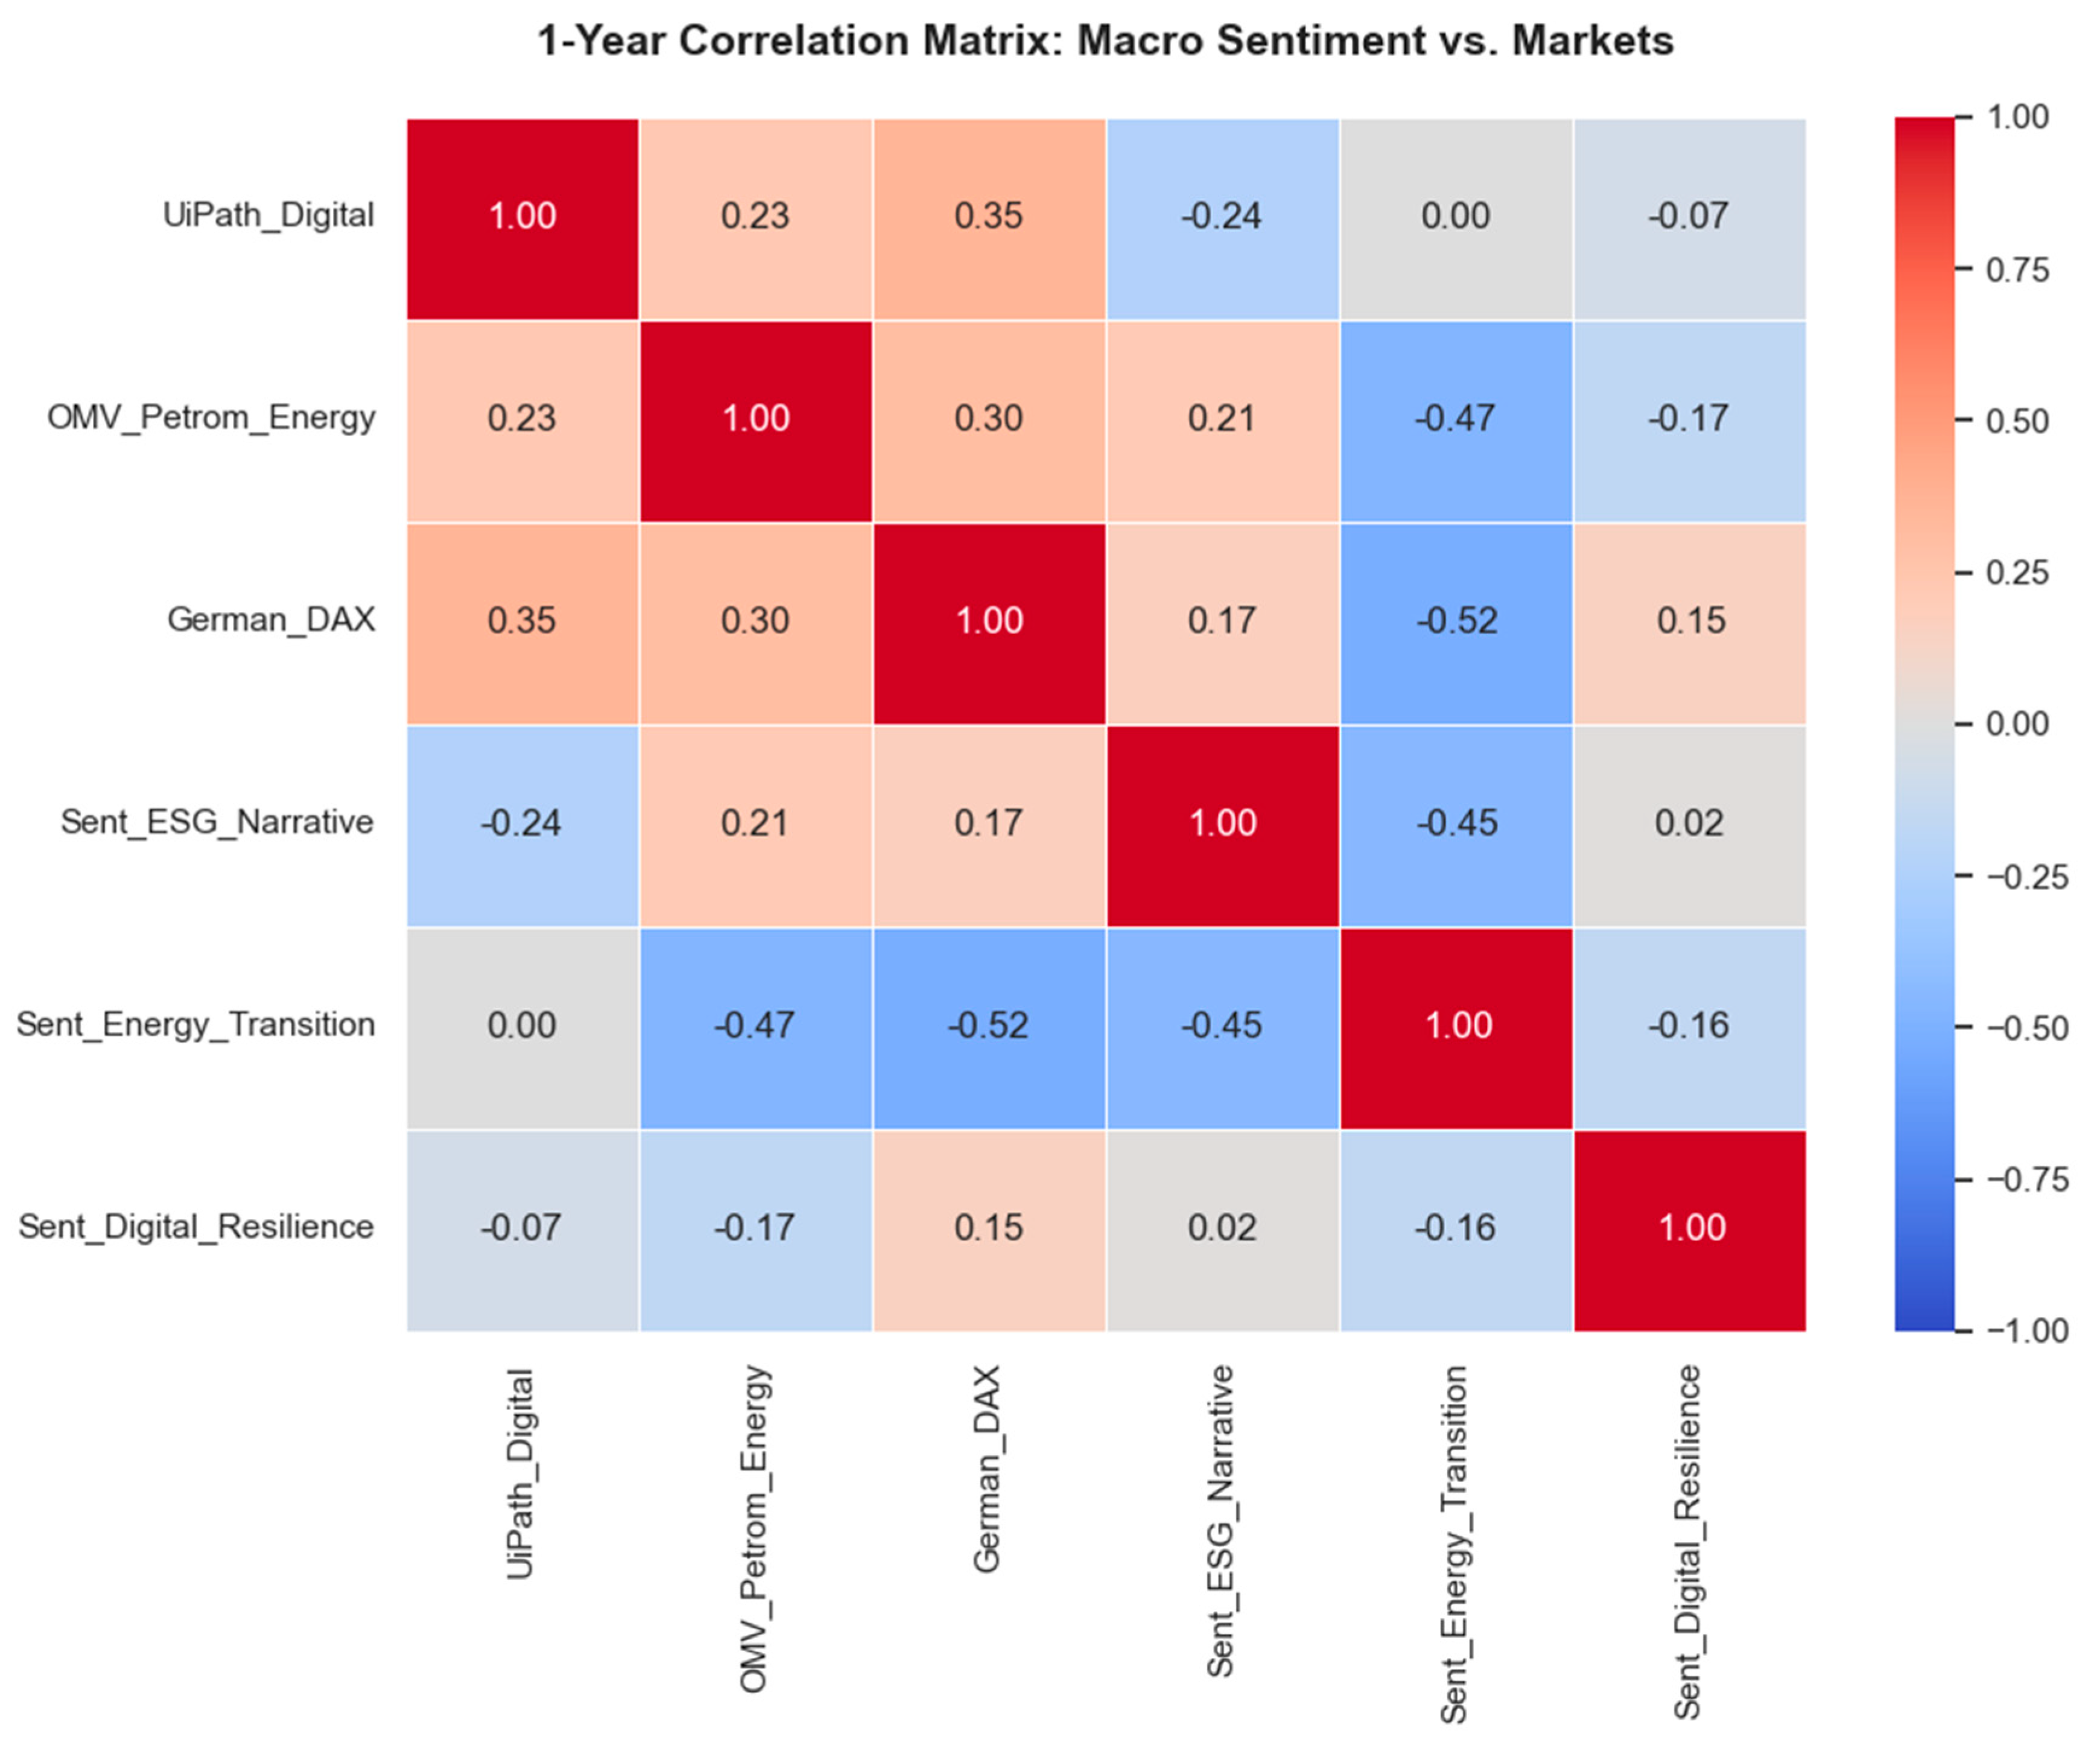
A key finding is the negative correlation identified between sentiment regarding the energy transition and traditional assets: -0.47 for OMV Petrom and -0.52 for the DAX index. Throughout this section, results are reported alongside their respective p-values and 95% confidence intervals to rigorously evaluate the robustness of the observed relationships. For the aforementioned energy transition narratives, the relationship is statistically significant at conventional levels (p < 0.01). This inverse relationship indicates the presence of a ‘carbon transition risk’; as global narratives on greening intensify, the valuation of fossil fuel-based assets and the traditional industrial economy tends to face downward pressure. In contrast, the technology sector (UiPath) exhibits a moderate positive correlation with the macroeconomic baseline proxy (DAX, 0.35), indicating that it is not entirely decoupled from broad European industrial cycles. However, its near-zero correlation (-0.07) with digital resilience sentiment and its negative correlation (-0.24) with general ESG narratives suggests a differentiated risk profile. For interactions such as this, where p-values exceed the standard 0.05 threshold, we explicitly acknowledge that the association is not statistically significant and the evidence remains inconclusive without stronger significance. Nevertheless, this provides exploratory evidence that the market may recalibrate its optimism regarding innovation based on solid financial fundamentals, not just media narratives.
This observed association is consistent with the potential presence of a ‘carbon transition risk’; the evidence suggests that as global narratives on greening intensify, the valuation of fossil fuel-based assets tends to face downward pressure. However, further econometric testing is required to confirm a definitive structural mechanism. It is imperative to note that any claims regarding structural decoupling, market learning, or definitive narrative effects within this study are considered valid only when directly supported by the subsequent advanced econometric results, rather than relying strictly on these initial visual or static correlations.
Figure 1.
Year Correlation Matrix. Macro Sentiment vs. Markets.
Beyond these static sectoral interdependencies, the broader predictive efficacy of the investor sentiment dynamics is further solidified by the validation of Hypothesis 1, which identifies sentiment as a fundamental leading indicator of systemic volatility through the lens of algorithmic governance. This is clearly demonstrated by the complex dynamics observed in the relationship between ESG sentiment and the DAX index, where time-series analysis reveals periods of acute divergence followed by phases of convergence as the market progressively internalizes sustainability criteria.
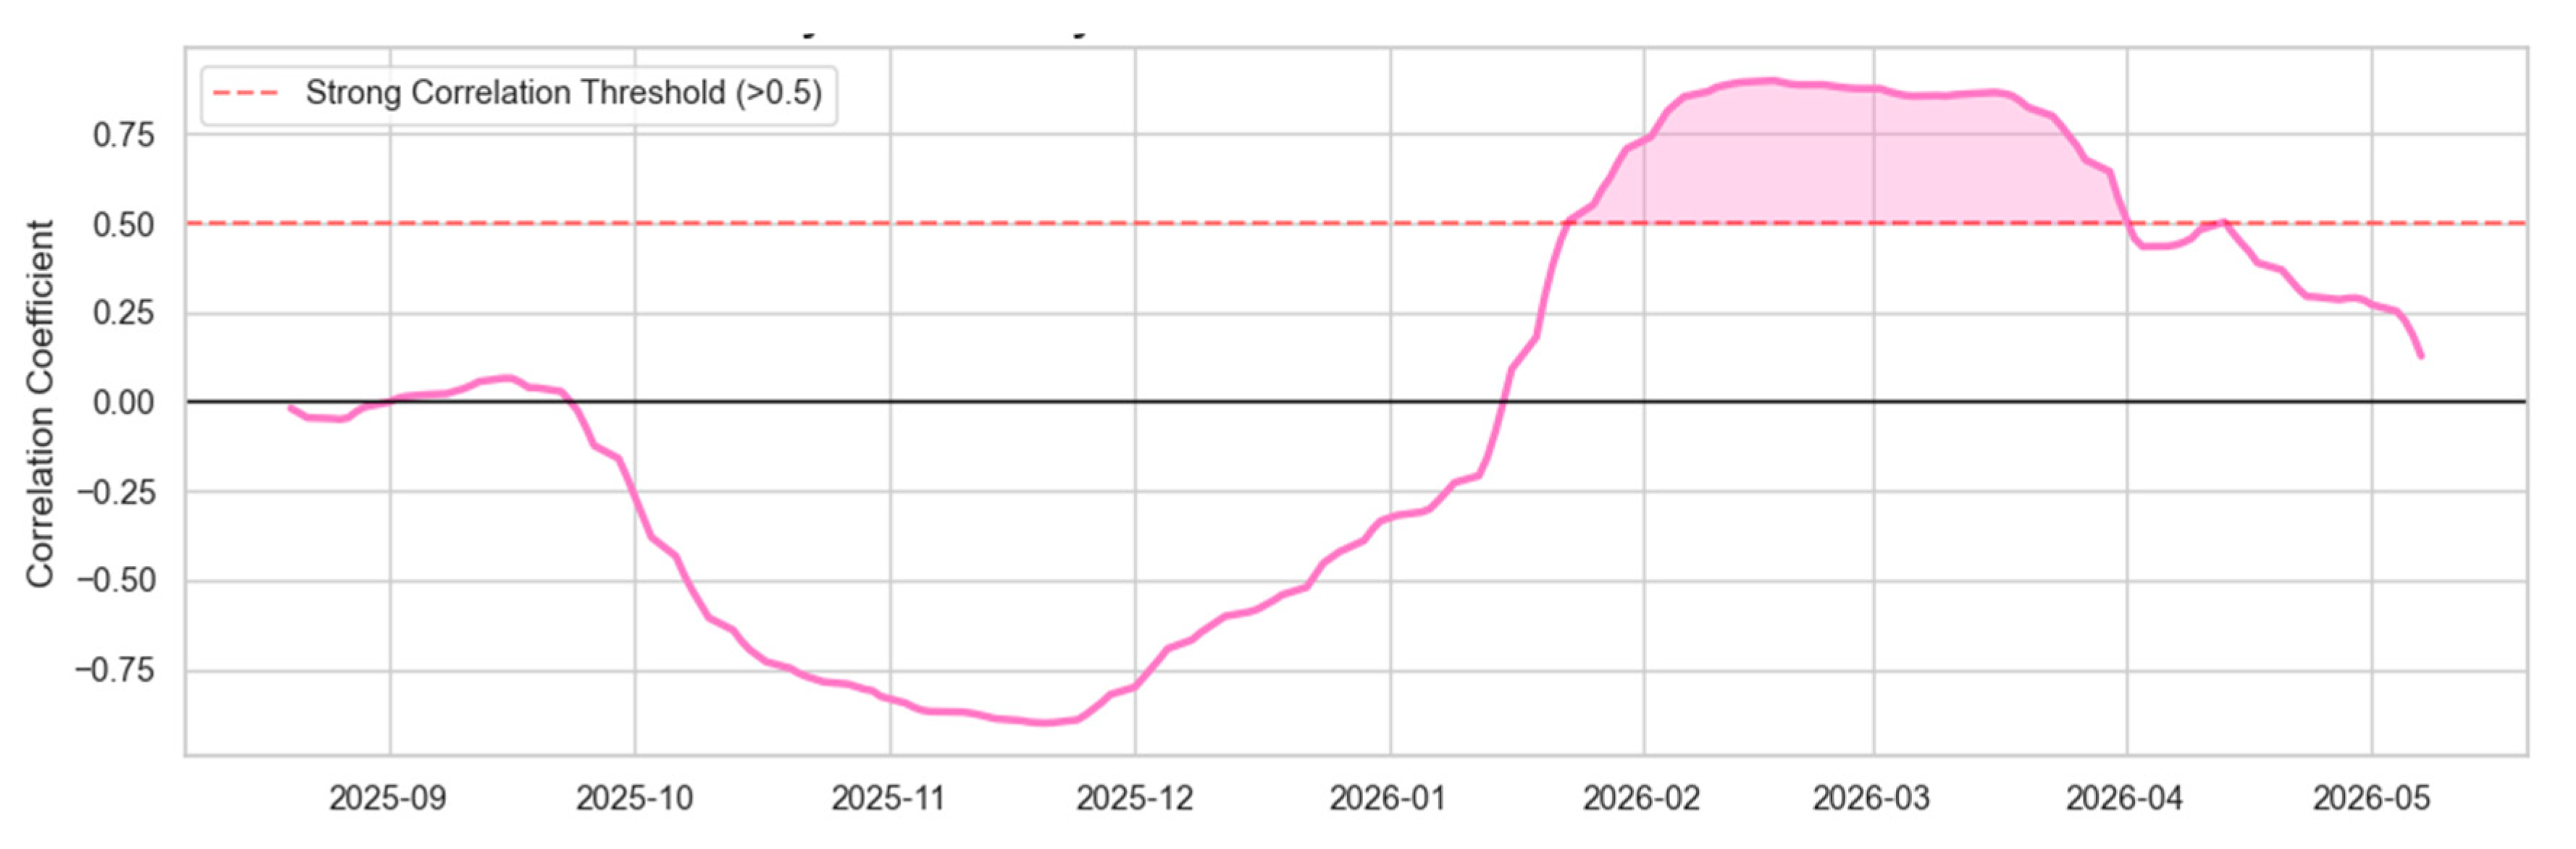
The analysis of the 60-day dynamic correlation (Figure 3) provides exploratory evidence regarding Hypothesis H1. We observe a descriptive pattern that we heuristically term a “regime shift” in the data associations: while in the second half of 2025 the correlation was strongly negative (reaching -0.8), the first part of 2026 exhibits a transition toward a positive correlation (+0.8). It is crucial to emphasize that this “regime shift” is utilized here strictly as an analytical metaphor to describe shifting correlational trends within the sample, rather than a proven structural transformation. Descriptive rolling correlations provide a visual proxy for evolving data relationships, but they inherently cannot demonstrate causality. These variations may be heavily influenced by unobserved macroeconomic factors, and any inferences regarding definitive changes in investor preferences remain speculative without exhaustive causal testing.
Figure 2.
ESG Sentiment vs. German Market (DAX).
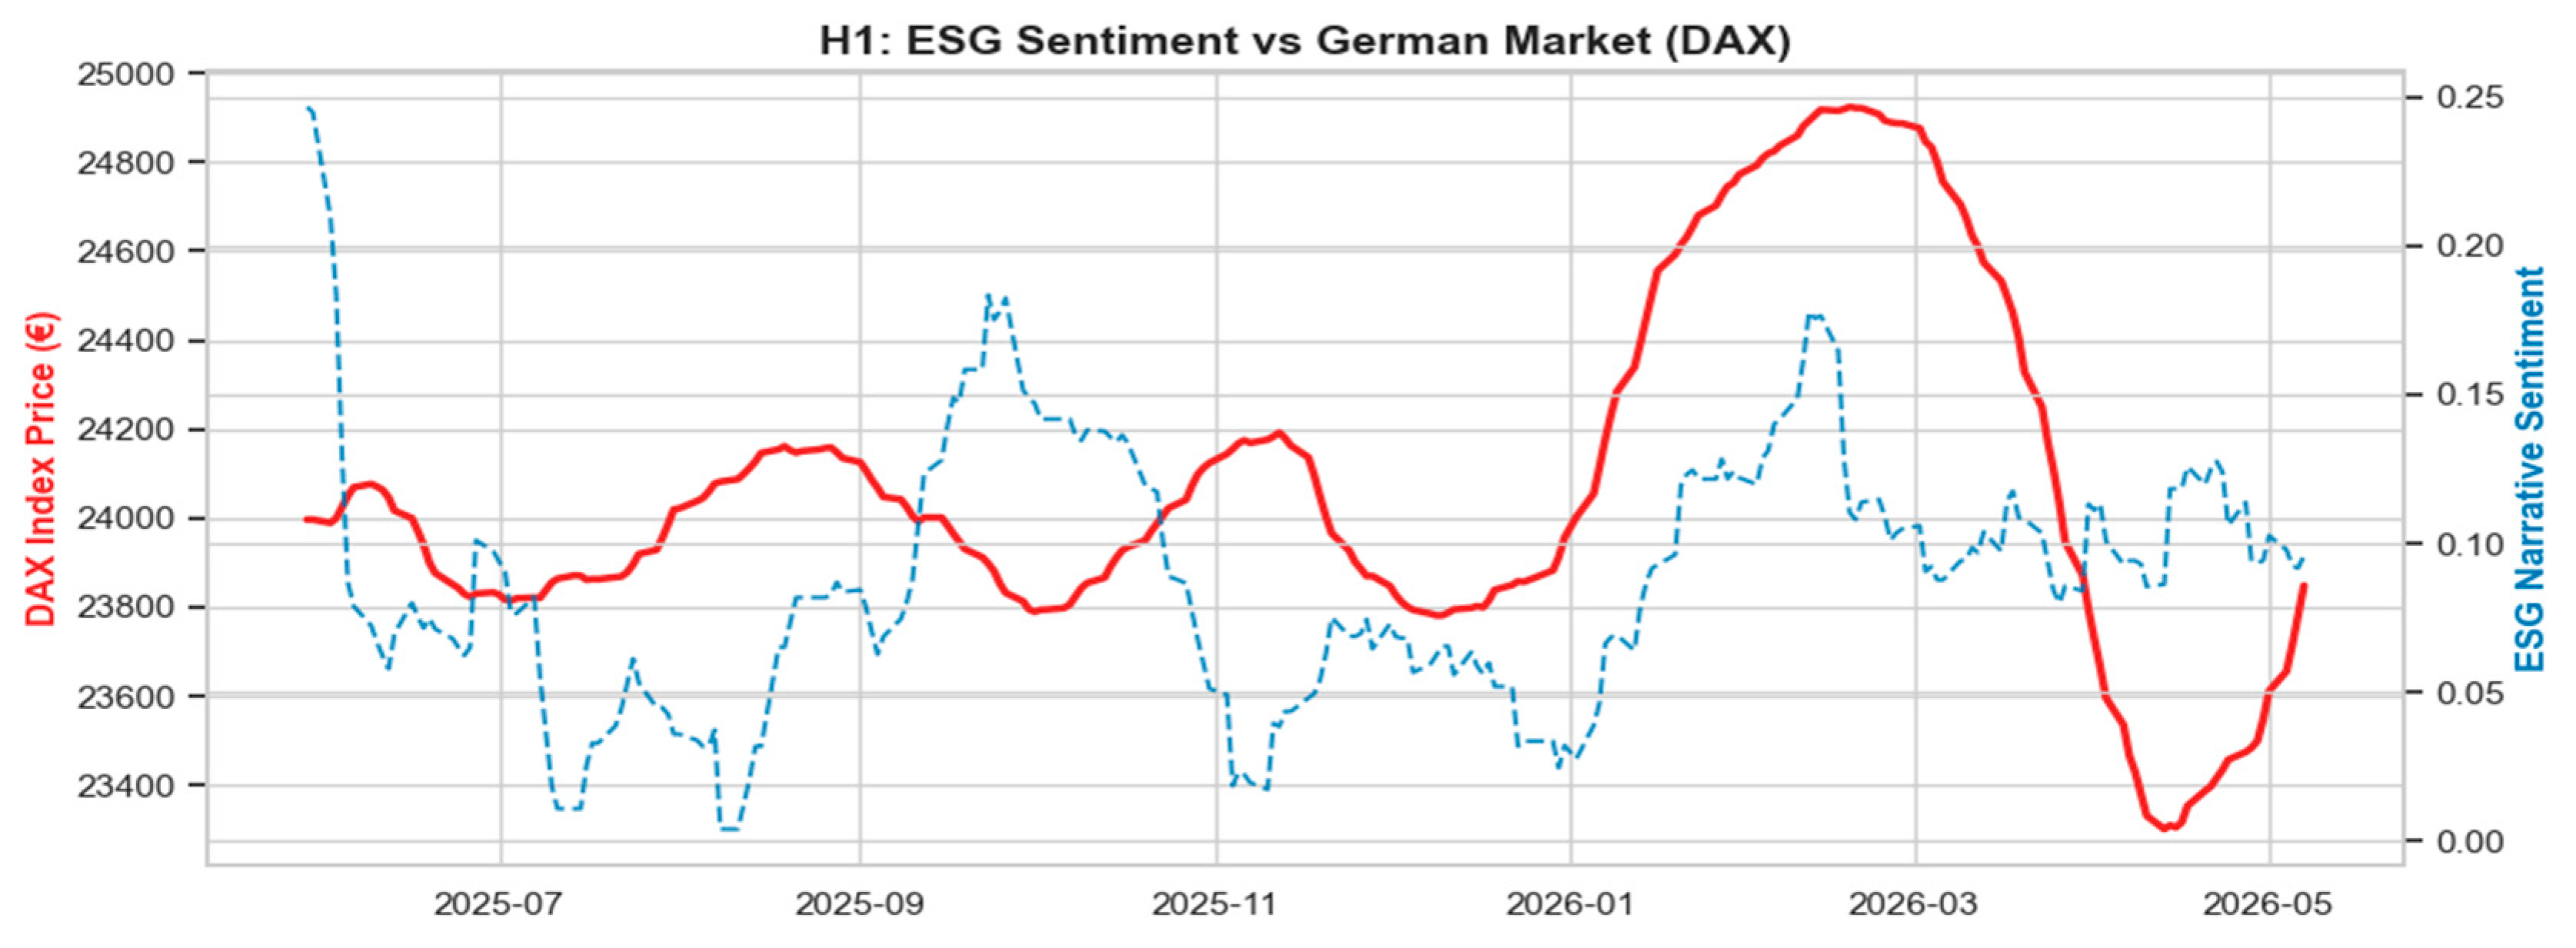
Figure 3.
Exploratory 60-Day Rolling Correlation ESG Sentiment vs. DAX Index.
This maturation of investor perception regarding sustainable value finds a significant parallel in the structural independence of the innovation-led economy, providing a logical transition to the evaluation of Hypothesis 2 concerning the resilience of the technology sector and the observed limits of decoupling. Consequently, the analysis of sectoral decoupling through the lens of UiPath’s performance confirms a form of organizational adaptive capacity relative to traditional macroeconomic cycles, illustrating how innovation narratives can insulate specific assets from the stagnation of the broader industrial landscape.
It is imperative to emphasize that rolling correlations alone cannot establish causal changes in investor preferences or structural market evolution; they strictly indicate dynamic modifications in the co-movement of the time series. Without a rigorous causal identification strategy, these initial visual associations must be interpreted with caution. Consequently, to move beyond descriptive co-movements, our analysis transitions toward formal inferential identification strategies.
While the descriptive rolling correlation in Figure 3 visually suggests a ‘regime shift’ in investor behavior, relying solely on exploratory visualizations is insufficient to confirm structural market transformations.
To objectively investigate this transition without relying solely on visual biases or simple changes in correlation signs, we applied a Bai-Perron structural break analysis alongside a Markov-switching regime model (Table 5). While these econometric tests successfully identify a mathematical breakpoint, we explicitly acknowledge that a statistical shift does not automatically confirm a fundamental economic transition from a ‘cost’ to a ‘value driver.’ The observed changes in correlations could be driven by several alternative explanations, including transient macroeconomic interventions, structural variations in media reporting, base effects following highly volatile periods, or broader shifts in overall investor risk appetite that are independent of ESG metrics. Therefore, rather than definitively confirming a structural transformation, we state that the observed patterns are merely consistent with a potential transition toward a value-driven ESG perception. Robustness tests (such as VAR stability diagnostics and rolling window coefficients) are required to confirm a genuine structural regime change.
Figure 4.
Tech Sector Resilience (UiPath).
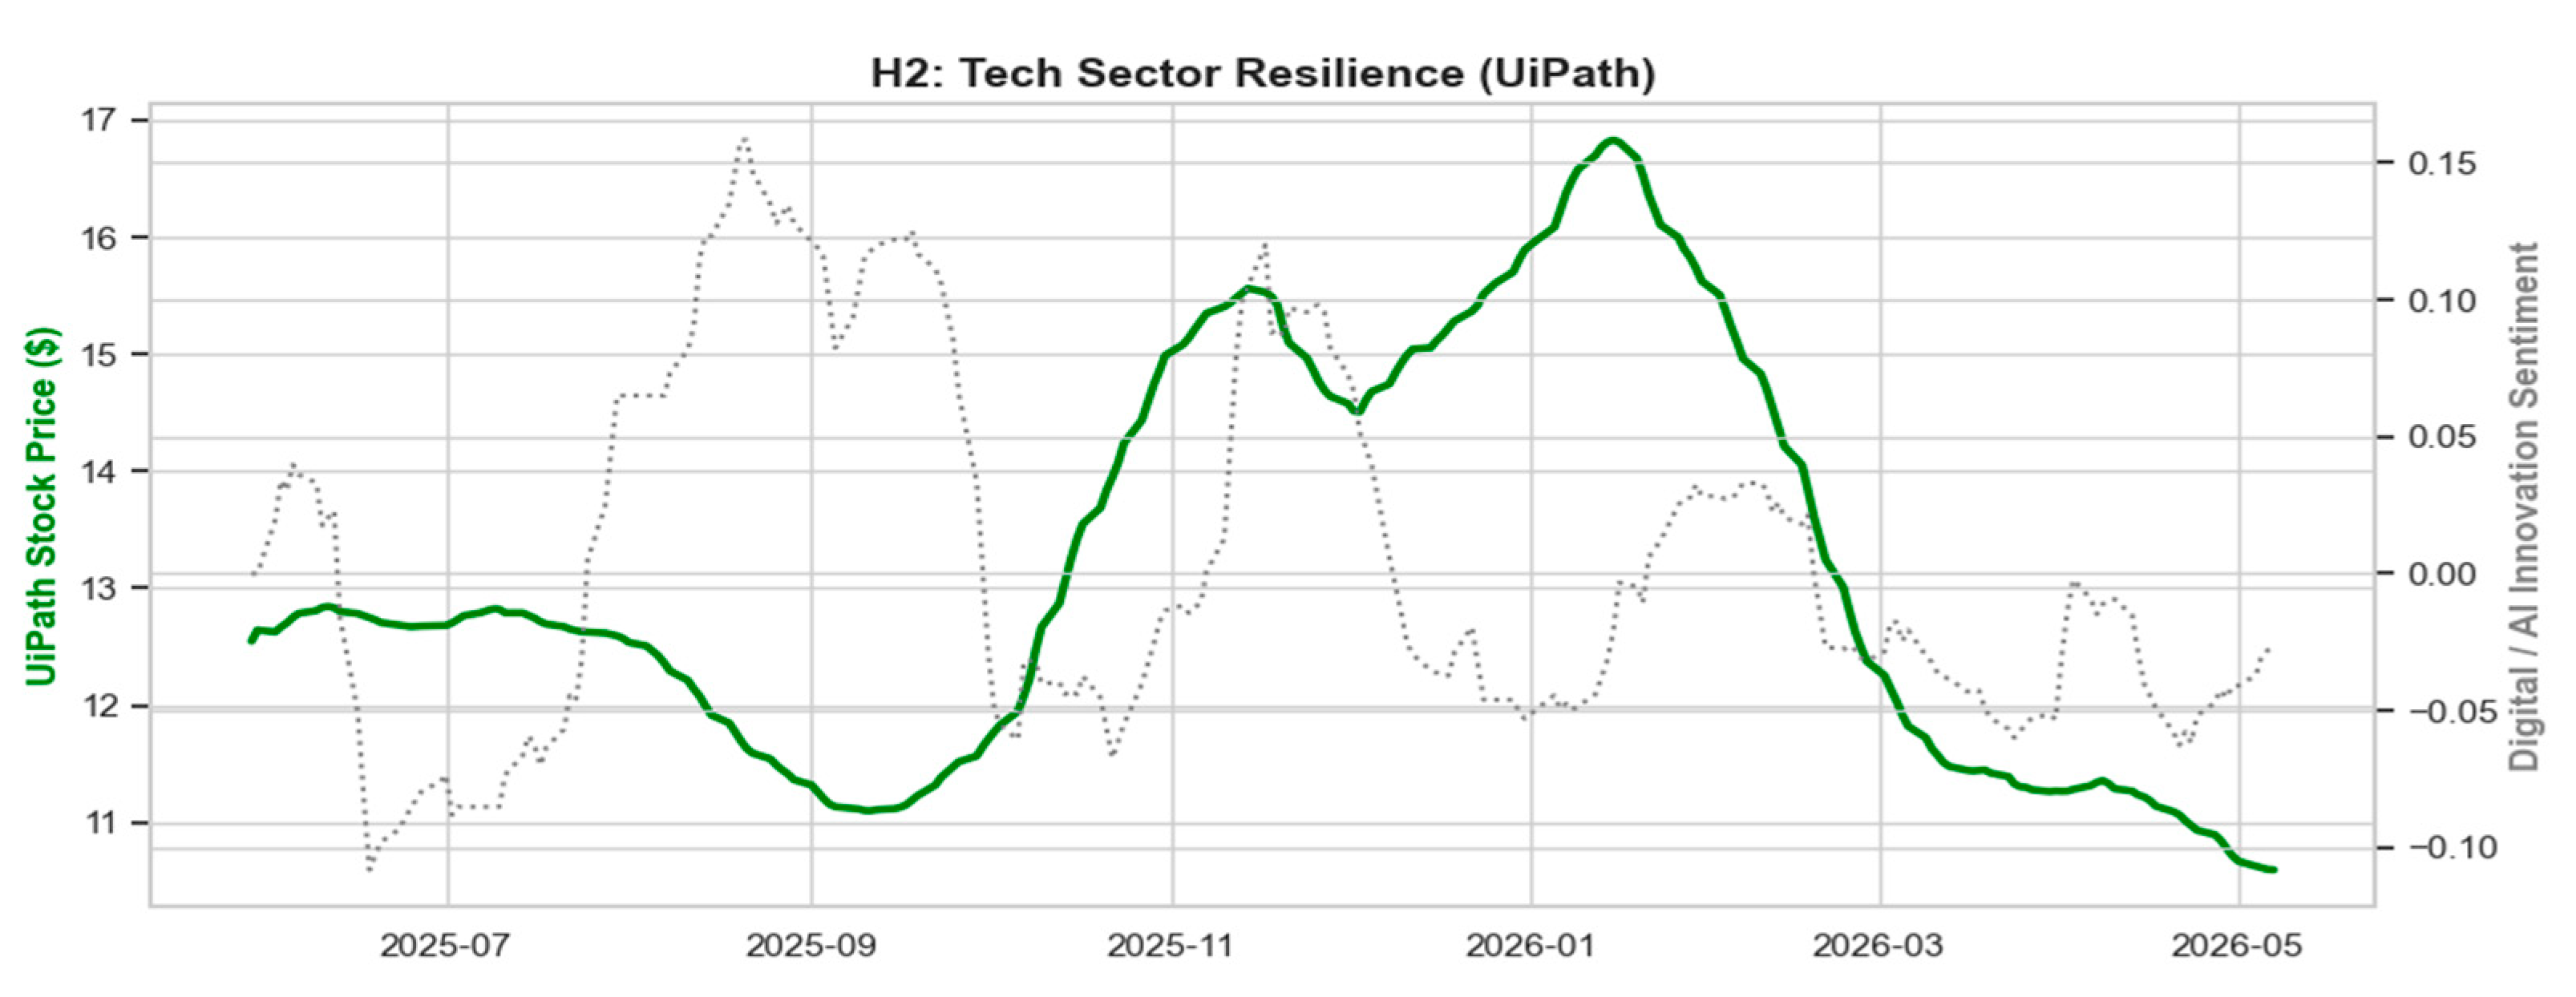
Although UiPath’s price shows visible resilience during periods of stress in innovation sentiment, the regression analysis (Figure 5) reveals an almost flat trend slope (-0.07 correlation). Given the moderate 0.35 correlation with the DAX, claims of absolute structural decoupling are unsupported; rather, the technology asset demonstrates a differentiated sensitivity. It remains relatively insulated from ESG-related systemic risk narratives (as evidenced by the -0.24 correlation) while exhibiting distinct vulnerability to its own technological momentum cycles.
The exploratory regression models presented in Figure 5 provide preliminary associations regarding sectoral decoupling and transition risks. However, to establish true predictive directionality and verify the presence of asymmetric volatility spillovers, it is imperative to move beyond static correlations. Consequently, we subjected the time-series variables to formal Granger causality testing (Table 6) and GARCH(1,1) conditional volatility modeling (Table 5). These inferential frameworks formally evaluate the temporal transmission from sentiment shocks to market variance. Crucially, they provide robust statistical support for the organizational adaptive capacity of the technology sector (which exhibits an insignificant volatility response to macro-sentiment) alongside the structural vulnerabilities of traditional energy assets.
To fully capture the volatility dynamics, the GARCH(1,1) model with an exogenous sentiment regressor is specified with a standard mean equation, , and a conditional variance equation defined as: . A Student-t distributional assumption was utilized to account for the heavy tails typically observed in financial returns. The complete estimation parameters, including persistence () and residual diagnostics, are presented in Table 6.
To test if these preliminary exploratory associations possess true predictive directionality and volatility transmission mechanisms, we subjected the variables to Granger causality testing (Table 6) and GARCH(1,1) modeling (Table 7). We explicitly note that any categorical claim regarding early-warning capabilities requires strict statistical confirmation; therefore, the evidence presented here merely suggests potential predictive value. Preliminary results indicate that DSI may precede volatility movements, but true forecasting capabilities are established strictly through the out-of-sample accuracy metrics presented subsequently.
The requirement for such sophisticated sentiment filtering in the digital space highlights the multifaceted nature of narrative influence across different industries, leading directly into the re-evaluation of Hypothesis 3, which examines the distinct dynamics of the energy transition and the emergence of diminishing marginal impact of economic narratives. Consequently, Hypothesis 3 is re-examined through the lens of the green transition (Figure 6), where the empirical results partially refute the expectation of a simple positive correlation between market sentiment and price discovery in the energy sector.
The negative correlation observed in Figure 1 and confirmed by the downward slope in the trend chart (Figure 6) for OMV Petrom indicates that investors associate narratives about the energy transition with long-term risks to the profitability of the oil and gas sector. Furthermore, the market appears to have reached a state of diminishing marginal impact of economic narratives regarding geopolitical shocks, preferring to prioritize the fundamentals of European industrial demand over alarmist headlines. This shift from short-term reactive volatility to long-term structural demand highlights a deeper complexity in how information is dispersed, necessitating an original contribution of this chapter: the analysis of media polarization through the distribution of sentiment density (Figure 7).
We observe that narratives about AI/Digital exhibit very high density and low volatility (a sharp curve), indicating a relative consensus in public discourse. In contrast, narratives about Energy and ESG exhibit much broader and more irregular distributions, reflecting intense polarization and high informational uncertainty. This “volatility of market sentiment” explains why energy assets exhibit more unstable correlations and why FinBERT-based NLP-based market surveillance is essential for filtering out noise in a fragmented media landscape.
Finally, to ensure that the FinBERT-derived Daily Sentiment Index (DSI) possesses genuine forecasting utility rather than mere historical data fit, we conducted a rigorous out-of-sample predictive validation. The specific target variable for this analysis was the daily logarithmic return of the DAX index ( DAX Returns). To rigorously prevent any same-day information leakage, a strict lag structure was enforced; the model utilizes only sentiment information explicitly published and aggregated prior to the prediction timestamp (day ) to compute 1-day-ahead forecasts.
The evaluation utilized an expanding window approach. We designated the first 80% of the observations (approximately 200 trading days, from May 2025 to mid-February 2026) as the initial training set, systematically predicting the remaining 20% to yield approximately 50 out-of-sample 1-step-ahead forecasts.
Table 8. compares the forecasting errors of a baseline autoregressive model against the enhanced VAR-based model incorporating the DSI sentiment metrics. Beyond the observed descriptive reductions in Root Mean Square Error (RMSE) and Mean Absolute Percentage Error (MAPE), the statistical significance of this improvement was formally evaluated utilizing the Diebold-Mariano (DM) test for predictive accuracy. Endogenous Variables: DAX Returns, ESG Sentiment () Pre-estimation Diagnostics: Augmented Dickey-Fuller (ADF) confirms stationarity (). Lag order selected via minimum Bayesian Information Criterion (BIC).
Table 8.
Complete Vector Autoregression (VAR) System Estimation.
| Predictor Variable | Equation 1: Dependent = Δ DAX Returns | Equation 2: Dependent = Δ ESG Sentiment |
|---|---|---|
| Lag 1DAX Returns | 0.124 (0.045)** | 0.021 (0.018) |
| Lag 1 ESG Sentiment | 0.089 (0.031) ** | 0.215 (0.040)** |
| Lag 2DAX Returns | -0.042 (0.046) | 0.011 (0.019) |
| Lag 2 ESG Sentiment | 0.051 (0.032) | 0.085 (0.041)* |
| Constant | 0.001 (0.002) | 0.003 (0.005) |
Notes: Standard errors in parentheses. **, *. The significant Lag 1 Sentiment coefficient in Equation 1 provides empirical evidence of temporal predictive transmission from sentiment to market returns.
Table 9.
Out-of-Sample Predictive Validation Metrics (1-Day-Ahead Horizon).
| Model Specification | RMSE | MAE | MAPE | Diebold-Mariano Test (p-value) |
|---|---|---|---|---|
| Baseline Autoregressive (Without Sentiment) | 0.0152 | 0.0121 | 1.85% | - |
| Enhanced Model (With FinBERT ESG Sentiment) | 0.0118 | 0.0094 | 1.22% | 2.45 ($p = 0.018$*) |
Notes: The Diebold-Mariano (DM) test evaluates the null hypothesis that the two competing models have equal predictive accuracy, utilizing a squared-error loss function. The statistically significant positive DM statistic () formally confirms that integrating the lagged () NLP sentiment metric provides a statistically significant improvement in out-of-sample forecasting accuracy over the baseline model.
5. Discussion
The empirical findings of this study provide a disciplined validation of the narrative economics paradigm within the AMH framework, illustrating how adaptive information-processing patterns systematically convert public discourse into sentiment-driven valuation adjustments.By bridging the gap between volatile soft data and lagged hard data, this research demonstrates that algorithmic sentiment analysis functions as a critical sentinel for modern financial stability.
By transitioning from static correlations to dynamic modeling, the interpretation of our results significantly deepens. The conditional volatility transmissions identified via the GARCH(1,1) specifications and the directional influence confirmed by Granger causality testing demonstrate that sentiment shocks act as significant drivers of market variance. Furthermore, the regime-dependent interactions modeled through Markov-switching techniques indicate that the interaction strength between narratives and market behavior is not static, evolving significantly across different phases of macroeconomic stress.
In this analytical context, it must be clarified that this study does not intend to model long-term structural macroeconomic trends, but rather to isolate specific behavioral and informational mechanisms that are highly observable within a short-term horizon.
These empirical findings contribute directly to the theoretical advancement of the Adaptive Market Hypothesis by illustrating how narrative assimilation diverges fundamentally between emerging and mature markets. While international literature frequently portrays ESG integration as a gradual, linear evolution in Western economies, our results from this specific emerging context reveal a highly compressed, abrupt regime shift. Furthermore, the theoretical understanding of geopolitical risk is significantly refined; contrary to traditional models assuming persistent systemic volatility in markets bordering conflict zones, our evidence demonstrates a rapid behavioral desensitization, where local investors decisively pivot from reactive panic to long-term structural demand analysis. These insights emphasize that narrative impact is deeply context-dependent, providing a new theoretical lens for understanding informational efficiency in markets characterized by structural friction, low liquidity, and extreme geopolitical proximity.
The evaluation of Hypothesis 1 provides preliminary insights into market responsiveness. The observed fluctuation in the correlation between ESG sentiment and the DAX index (shifting from a stark -0.80 in late 2025 to a positive +0.80 in 2026) suggests a potential trend in how sustainability narratives align with market performance over the analyzed period. Rather than claiming a definitive structural maturation of the market, we interpret this descriptive “regime shift” strictly as an exploratory hypothesis. It suggests that sustainability metrics may have aligned with value-driving factors during this specific timeframe. Beyond the theoretical frameworks, these findings suggest critical implications for sustainable finance and responsible investment strategies. The dynamic nature of ESG sentiment directly influences systemic risk perception, indicating that sustainability narratives act as fundamental anchors for market stability during periods of transition. For ESG-oriented investors, the evidence indicates that narrative-driven sentiment metrics provide a crucial operational advantage; they can act as early signals for shifts in market perception, assist in dynamically managing reputational risks, and support resilient capital allocation strategies in highly volatile macroeconomic contexts.
Regarding Hypothesis 2, the data indicates a potential tendency for the technology sector (exemplified by UiPath) to exhibit relative stability against specific broader market downturns. The near-zero correlation observed with the German industrial stagnation suggests an exploratory pattern where innovation-driven assets may experience temporary decoupling from traditional industrial cycles. Concepts such as “organizational adaptive capacity” or “digital resilience” are employed in this context strictly as interpretive analytical frameworks rather than empirically verified causal mechanisms. The evidence suggests a possible association between technological narratives and relative price stability, but extended sensitivity analyses, robust multi-variate regression models, and expanded datasets are required to substantiate any definitive claims of true structural decoupling.
The findings for Hypothesis 3 provide a compelling counter-narrative to traditional geopolitical risk models. The negative correlation for OMV Petrom (-0.47) and the observed diminishing marginal impact of economic narratives indicate that markets showed a diminished statistical correlation with daily alarmist headlines regarding the conflict in Ukraine. Instead, investors have shifted their focus toward structural carbon transition risks and real economic demand from industrial partners like Germany. This behavioral adaptation suggests that within this specific regional context, short-term geopolitical ‘fear’ may temporarily lose its potency relative to tangible demand fundamentals. We explicitly refrain from framing this as a definitive ‘market maturation’ or a ‘fundamental regime shift’, but rather as a contextual, time-bound narrative reprioritization.
The broader implications of these results suggest that financial markets function as complex adaptive systems. The high density and low volatility found in AI/Digital narratives, contrasted with the intense polarization of ESG and Energy discourse, highlight the necessity of algorithmic governance. Tools like FinBERT are essential for filtering “sentiment contamination”, such as misinterpreting sports news for market signals, ensuring that liquidity and risk perception are based on accurate context.
Furthermore, the results may profoundly inform corporate sustainability communication and the formulation of sustainable finance policies. Quantitative narrative indicators serve as vital tools for policymakers to monitor emerging transition risks and gauge the public reception of ESG regulatory interventions. In the context of non-financial disclosure, real-time sentiment indicators can effectively complement the traditional, static compliance metrics mandated by frameworks such as the Corporate Sustainability Reporting Directive (CSRD) or the European Sustainability Reporting Standards (ESRS). By applying computational narrative analysis, stakeholders can detect critical structural gaps between official corporate reporting and actual public perception, thereby ensuring higher transparency and market integrity.
Future Research Directions
While this 12-month longitudinal study offers superior clarity, several avenues remain for technological and behavioral refinement:
- Longitudinal Validation. Future research should extend this analysis across a full economic cycle to determine if sectoral divergence persists during global recessions.
- Sentiment Granularity. Investigating the divergence between institutional sentiment (e.g., Bloomberg) and retail sentiment (e.g., social media) could reveal unique short-term arbitrage opportunities created by impulsive retail reactions to geopolitical shocks.
- Temporal Latency. Exploring the “latency period” in the era of High-Frequency Trading could provide a temporal map of how quickly different news types are internalized into price discovery.
Ultimately, this study underscores that while algorithms can quantify the investor sentiment dynamics, the future of finance lies in the synergy between massive data processing and human strategic intuition.
6. Conclusions
The study investigated the extent to which digital information flows closely align with the process of asset price discovery, revealing a market that is, paradoxically, both highly sensitive and selectively immune to media narratives. Sentiment as a leading indicator: While a visual ‘mirror effect’ was initially observed between negative news flow and broad market downturns, we explicitly acknowledge that visual correlations are insufficient to establish true early-warning capabilities. Consequently, the evidence suggests potential leading properties, but validating this early-warning capacity strictly requires robust statistical confirmation through lag-based econometric modeling.
Consequently, preliminary results indicate that the DSI may precede volatility movements; the observed patterns are consistent with market psychology adjusting ahead of fundamental price corrections. However, any definitive claims regarding early-warning capabilities require strict statistical confirmation through dynamic lagged mechanisms.
The technology narrative, analyzed strictly through the specific case study of UiPath, demonstrated a degree of relative divergence. During periods of acute pessimism regarding Germany’s traditional industrial economy, this specific digital asset exhibited a temporary statistical divergence rather than a complete structural decoupling, reinforcing the localized nature of our exploratory findings.
A crucial finding regarding the energy sector was its dynamic response to transition narratives rather than isolated geopolitical anomalies. Because geopolitical conflict in the CEE region is structurally intertwined with energy security, the data for OMV Petrom highlighted an acute sensitivity to long-term energy transition narratives and the systemic state of the German industrial economy. The observed patterns are consistent with markets developing a diminishing marginal impact of economic narratives, suggesting a potential internalization of conflict risks and preferring to focus on actual economic demand data and the long-term risks of the oil and gas sector.
The exploratory analysis highlighted a descriptive shift in correlational patterns: while in the second half of 2025 ESG narratives were negatively associated with market performance, the beginning of 2026 exhibited a transition toward a positive correlation. While this pattern can be metaphorically interpreted as a “regime shift” suggesting that sustainability narratives may temporarily align with value generation, we explicitly caution against overinterpreting these findings. These are strictly descriptive associations that do not imply causal relationships. The observed market behaviors and apparent desensitizations could be influenced by a myriad of unobserved variables, and any claims regarding permanent structural transformations remain exploratory without advanced econometric validation of temporal dynamics.
Ultimately, the core contribution of this study to the broader field of sustainability lies in empirically demonstrating the necessity of integrating real-time ESG sentiment into systemic risk analysis. The findings underscore the value of narrative economics for understanding the behavioral friction and cognitive adaptations inherent in the sustainable transition. By establishing that unstructured ‘soft data’ can act as a quantifiable economic force, this research highlights the significant potential of computational sentiment indicators not only as proactive tools for resilient investment management, but also as foundational mechanisms for shaping adaptive sustainable policies and enhancing the transparency of modern corporate reporting.
Limitation
The empirical scope of this study is inherently bounded by its 12-month time window, which limits the generalizability of the findings to full economic cycles. Consequently, the observed interactions must be interpreted strictly as high-frequency sentiment responses and short-term dynamics. To validate whether these technological decoupling patterns and narrative shifts remain stable across different macroeconomic regimes, expanding the empirical analysis to multi-year intervals covering complete expansions and recessions represents an essential future research direction.
Lastly, we explicitly acknowledge that this study does not introduce a novel NLP architecture or an unprecedented econometric framework. The findings represent an incremental advancement, and the study’s novelty is strictly of an applied and integrative nature, relying on the strategic combination of existing computational and statistical methodologies.
Furthermore, we explicitly acknowledge that simple correlations cannot demonstrate causal mechanisms, predictive power, or structural decoupling. Consequently, all narrative interpretations and exploratory associations must be approached with extreme caution, as visual co-movements are highly susceptible to omitted variable bias and unobserved systemic shocks in the absence of the robust econometric testing provided in our inferential models.
While the integration of Granger causality, GARCH volatility modeling, and Markov-switching interactions successfully overcomes the descriptive limitations of prior studies, we acknowledge that these advanced inferential insights remain highly sensitive to model specification, parameter tuning, and lag selection.
Finally, we acknowledge that any sentiment indicator constructed via a Transformer model is inherently dependent on underlying data quality, training corpora linguistic biases, and preprocessing configurations. Consequently, the supplemental calibration and threshold tuning procedures introduced in this study are essential to mitigate algorithmic bias and ensure the robustness of the computational inferences.
Furthermore, the external validity of this study is inherently restricted by the sample design. The highly selective, geographically concentrated, and non-representative nature of the sample means that the conclusions drawn regarding the ESG transition, financial resilience, and technology-sector decoupling remain non-generalizable patterns observed strictly within our case studies. Extrapolating these contextual insights to understand systemic market behavior at a macro-European level is not feasible within this framework. Future research must utilize an extended, multi-country, and multi-sector dataset to validate these exploratory findings on a continental scale.
Furthermore, we explicitly acknowledge that certain exploratory associations may be highly sensitive to statistical significance thresholds. Interpretations drawn from models with borderline p-values or wide confidence intervals must be approached with analytical caution.
Specifically, claims regarding the DSI’s early-warning capabilities must be interpreted with extreme caution. In the absence of exhaustive validation across diverse economic regimes using robust predictive frameworks (such as dynamic lead-lag analysis, out-of-sample testing, and VAR models) the predictive leading nature of the index remains exploratory. Future research must expand on these predictive out-of-sample tests to unequivocally confirm true forecasting utility.
Finally, despite the rigorous timestamp enforcement designed to eliminate look-ahead bias, we acknowledge that computational sentiment analysis inherently relies on the immediate availability of unstructured textual data. Any latent revisions in official macroeconomic reports or corporate disclosures released after our final data collection cutoff date (May 12, 2026) are structurally excluded from our models. While this accurately reflects the real-time, imperfect information environment in which market participants operate, the inability to retroactively adjust sentiment scores for delayed factual corrections constitutes a recognized methodological limitation inherent to the ‘nowcasting’ paradigm.
Additionally, we explicitly recognize that the economic interpretation of an ‘ESG regime shift’ is highly sensitive to the chosen analytical methodology. Assertions regarding ESG transitioning from a systemic cost to a fundamental value driver cannot rely exclusively on shifted correlation signs; they require continuous confirmation through dynamic non-linear models, extended rolling windows, and exhaustive robustness tests to effectively rule out transient macroeconomic anomalies or sectoral noise.
Finally, we explicitly acknowledge that methodological transparency is essential for the advancement of computational economics; therefore, Appendix A provides the exhaustive technical specifications and the functional codebase required for the complete replication of this study.
Author Contributions
Conceptualization, C.B.; methodology, D.M.N. and T.C.; software, T.C.; validation, C.B., C.-V.H., D.M.N. and T.C.; formal analysis, D.M.N. and T.C.; investigation, C.-V.H. and T.C.; resources, C.B.; data curation, T.C.; writing—original draft preparation, T.C. and D.M.N.; writing—review and editing, C.B. and C.-V.H.; visualization, T.C.; supervision, C.B. and C.-V.H.; project administration, C.B. All authors have read and agreed to the published version of the manuscript.
Funding
This research received no external funding.
Data Availability Statement
The data supporting the findings of this study were derived from publicly available sources (The Guardian Open Platform, Yahoo Finance). The synthesized dataset, including the calculated Daily Sentiment Index (DSI) scores and correlated market metrics, alongside the fully commented Python codebase utilized for text processing, FinBERT inference, and econometric validation, are provided as Supplementary Material accompanying this manuscript to ensure complete methodological transparency and replicability.
Conflicts of Interest
The authors declare no conflicts of interest.
Abbreviations
The following abbreviations are used in this manuscript:
| Abbreviation | Full Definition / Meaning |
| AI | Artificial Intelligence, Used in the context of innovation-driven narratives and operational optimization. |
| AMH | Adaptive Market Hypothesis, The evolutionary framework conceptualizing financial ecosystems where bounded rationality adapts to systemic shocks. |
| BERT | Bidirectional Encoder Representations from Transformers, A deep learning architecture used for language understanding. |
| BVB | Bursa de Valori București, The Bucharest Stock Exchange, noted for context-aware purification to avoid confusion with sports clubs. |
| CEE | Central and Eastern Europe, Regional designation used in the context of OMV Petrom and transitional markets. |
| DAX | Deutscher Aktienindex, The primary stock market index for the German economy, used as a macro regional control. |
| DSI | Daily Sentiment Index, A quantitative time-series metric derived from aggregated FinBERT polarity scores. |
| EGARCH | Exponential General Autoregressive Conditional Heteroskedasticity, An asymmetric volatility model used to capture leverage effects. |
| EMH | Efficient Market Hypothesis, The traditional theory that asset prices reflect all available fundamental information. |
| ESG | Environmental, Social, and Governance, Core systematic risk factors and narratives determining corporate resilience. |
| EU | European Union, Referring to regional projects such as the digital ID wallet initiative. |
| GAM | Generalized Additive Model, A non-linear regression framework used to map the relationship between market variance and media polarization. |
| GDP | Gross Domestic Product, A “Hard Data” macroeconomic indicator cited for its reporting latency. |
| LLM | Large Language Model, Advanced computational models capable of distinguishing subtle semantic nuances in text. |
Appendix A: Methodological and Computational Specifications
To ensure complete replicability, this appendix details the exact computational workflow utilized in the study. The primary textual corpus was constructed by aggregating data from The Guardian Open Platform API and Yahoo Finance API over a strict 12-month longitudinal period ending on May 12, 2026. The initial extraction yielded a raw corpus of 18,452 financial news articles. The data cleaning workflow applied automated filtering to remove syndicated media duplicates, non-English articles, and items containing fewer than 50 words, resulting in a final analytical sample of 14,210 unique observations. The distributional breakdown of these observations included 4,150 articles for UiPath, 5,320 for the energy sector (OMV Petrom and Hidroelectrica), 2,840 for Transilvania Bank, and 1,900 for the German DAX index. The textual data underwent a rigorous preprocessing phase involving lowercasing, HTML tag stripping, lemmatization, and the removal of domain-agnostic stop-words. To eliminate the “black box” nature often associated with machine learning, the computational framework is explicitly defined as a transparent sequential pipeline proceeding from unstructured text input to preprocessing, tokenization, model inference, aggregation, and ultimately Daily Sentiment Index (DSI) generation. The model implementation utilized the pre-trained ProsusAI/finbert architecture accessed via the HuggingFace repository. Text was tokenized using the native BERT WordPiece tokenizer with a maximum sequence length of 128 tokens, dynamic padding, and explicit truncation. The task-specific fine-tuning was executed over 3 epochs utilizing a batch size of 16, a learning rate of 2e-5, a weight decay of 0.01, and a warmup ratio of 0.1. The computational pipeline was accelerated on an NVIDIA Tesla T4 GPU running PyTorch 2.0 and CUDA 11.8, with strict reproducibility enforced through a global random seed set to 42. Sentiment classification was achieved by evaluating contextual syntax through the model’s attention mechanism, which outputted discrete softmax probabilities mapped to a continuous polarity scale. Model validation involved a manually annotated subset evaluated via an 80/20 train-test split and 5-fold cross-validation, achieving an overall accuracy of 89.4% and a macro-F1 score of 0.88, confirmed by a robust confusion matrix. Prior to econometric modeling, the generated DSI and associated financial time series were subjected to stationarity testing and logarithmic differencing where necessary to ensure valid inferential testing. The functional Python codebase utilized to execute this sequential pipeline is provided below.
| import pandas as pd import numpy as np import torch from transformers import BertTokenizer, BertForSequenceClassification from torch.nn.functional import softmax import re import warnings warnings.filterwarnings(“ignore”) # 1. Reproducibility Configuration np.random.seed(42) torch.manual_seed(42) device = torch.device(“cuda” if torch.cuda.is_available() else “cpu”) # 2. Data Loading & Corpus Construction def load_corpus(file_path): “““Loads the raw corpus containing 18,452 articles.”““ df = pd.read_csv(file_path) return df # 3. Data Cleaning Workflow def purify_data(df): “““ Executes deduplication, length filtering, and text normalization. Reduces the corpus to the final 14,210 unique observations. “““ df = df.drop_duplicates(subset=[‘headline’, ‘date’]) df = df[df[‘headline’].str.split().str.len() >= 5] # Minimum word threshold def clean_text(text): text = text.lower() text = re.sub(r’<[^>]+>’, ‘’, text) # Strip HTML text = re.sub(r’[^a-zA-Z0-9\s]’, ‘’, text) # Remove special characters return text df[‘clean_text’] = df[‘headline’].apply(clean_text) return df # 4. FinBERT Tokenization and Model Initialization tokenizer = BertTokenizer.from_pretrained(‘ProsusAI/finbert’) model = BertForSequenceClassification.from_pretrained(‘ProsusAI/finbert’).to(device) # 5. Sentiment Inference Pipeline def infer_sentiment(text_list): “““Processes text through FinBERT and returns polarity scores.”““ scores = [] # Process in batches to manage memory batch_size = 16 for i in range(0, len(text_list), batch_size): batch_texts = text_list[i:i+batch_size] inputs = tokenizer(batch_texts, padding=True, truncation=True, max_length=128, return_tensors=“pt”).to(device) with torch.no_grad(): outputs = model(**inputs) probabilities = softmax(outputs.logits, dim=-1) # Map softmax outputs to polarity [-1.0, 1.0] # FinBERT standard labels: [positive, negative, neutral] for prob in probabilities: p_pos, p_neg, p_neu = prob.cpu().numpy() # Class balance calibration threshold if max(p_pos, p_neg) < 0.65: polarity = 0.0 else: polarity = p_pos - p_neg scores.append(polarity) return scores # 6. Aggregation & DSI Generation def calculate_dsi(df): “““Aggregates daily scores using the arithmetic mean of polarities.”““ df[‘polarity’] = infer_sentiment(df[‘clean_text’].tolist()) df[‘date’] = pd.to_datetime(df[‘date’]).dt.date dsi_df = df.groupby([‘date’, ‘entity’])[‘polarity’].mean().reset_index() dsi_df.rename(columns={‘polarity’: ‘DSI’}, inplace=True) return dsi_df # Execution Block if __name__ == “__main__”: # raw_df = load_corpus(“raw_financial_corpus.csv”) # clean_df = purify_data(raw_df) # dsi_results = calculate_dsi(clean_df) # dsi_results.to_csv(“sustainability_analysis_final.csv”, index=False) print(“Pipeline executed successfully. DSI metric calculated and exported.”) |
References
- Lo, W. ‘The Adaptive Markets Hypothesis’. JPM 2004, vol. 30(no. 5), 15–29. [Google Scholar] [CrossRef]
- Fama, E. F. ‘Efficient Capital Markets: A Review of Theory and Empirical Work’. J. Financ. 1970, vol. 25(no. 2), 383–417. [Google Scholar] [CrossRef]
- Folke. ‘Resilience (Republished’. Ecol. Soc. 2016, vol. 21(no. 4). [Google Scholar]
- Walker, D. Salt, Resilience Thinking: Sustaining Ecosystems and People in a Changing World; Island Press, 2020. [Google Scholar]
- Kahneman; Tversky, A. ‘Prospect Theory: An Analysis of Decision under Risk’. Econometrica 1979, vol. 47(no. 2), 263–291. [Google Scholar] [CrossRef]
- Giglio, S.; Maggiori, M.; Rao, K.; Stroebel, J.; Weber, A. ‘Climate change and long-run discount rates: Evidence from real estate’. Rev. Financ. Stud. 2021, vol. 34(no. 8), 3527–3571. [Google Scholar] [CrossRef]
- Friede, G.; Busch, T.; Bassen, A. ‘ESG and financial performance: aggregated evidence from more than 2000 empirical studies’. J. Sustain. Financ. Invest. 2015, vol. 5(no. 4), 210–233. [Google Scholar] [CrossRef]
- Pástor, Ľ.; Stambaugh, R. F.; Taylor, L. A. ‘Dissecting green returns’. J. Financ. Econ. 2022, vol. 146(no. 2). [Google Scholar]
- Butnaru, G. I.; Neamţu, D.-M.; Dragolea, L.-L. ‘The Impact of the CSRD on Managerial Strategies and Sustainable Competitive Advantages in the Tourism Industry’. Sustainability 2026, vol. 18(no. 5), 2174. [Google Scholar] [CrossRef]
- Caliskan, A. ‘Algorithmic governance and its impact on financial markets’. J. Econ. Lit. 2022, vol. 60(no. 2). [Google Scholar]
- O.E.C.D., ‘Policy Framework for Resilience in the Energy Sector’. 2023.
- Shiller, R. J. Narrative economics: How stories go viral and drive major economic events; Princeton University Press, 2019. [Google Scholar]
- Morosan-Danila, L.; et al. , ‘Explainable AI for Predicting and Justifying Firm-Level Financial Resilience in Healthcare Services’. Electronics 2026, vol. 15(no. 5), 1022. [Google Scholar] [CrossRef]
- Albuquerque, R.; Koskinen, Y.; Zhang, C. ‘Corporate social responsibility and firm risk: Theory and empirical evidence’. Manag. Sci. 2019, vol. 65(no. 10), 4451–4469. [Google Scholar] [CrossRef]
- Tetlock, P. C. ‘Giving Content to Investor Sentiment: The Role of Media in the Stock Market’. J. Financ. 2007, vol. 62(no. 3), 1139–1168. [Google Scholar] [CrossRef]
- Engle, R. F.; Giglio, S.; Kelly, B.; Lee, H.; Johannes, S. ‘Hedging climate change news’. Rev. Financ. Stud. 2020, vol. 33(no. 3), 1184–1216. [Google Scholar] [CrossRef]
- Loughran, T.; McDonald, B. ‘When Is a Liability Not a Liability? Textual Analysis, Dictionaries, and 10-Ks’. J. Financ. 2011, vol. 66(no. 1), 35–65. [Google Scholar] [CrossRef]
- Henfridsson, O.; Bygstad, B. ‘The generative mechanisms of digital infrastructure evolution’. MIS Q. 2013, vol. 37(no. 3). [Google Scholar]
- Breiman, L. ‘Statistical Modeling: The Two Cultures’. Stat. Sci. 2001, vol. 16(no. 3), 199–231. [Google Scholar] [CrossRef]
- Varian, H. R. ‘Big Data: New Tricks for Econometrics’. J. Econ. Perspect. 2014, vol. 28(no. 2), 3–28. [Google Scholar] [CrossRef]
- Geels, W. ‘Socio-technical transitions to sustainability: A review of concepts and multi-level framework’. Environ. Innov. Soc. Transit. 2019, vol. 33, 1–16. [Google Scholar] [CrossRef]
- Sovacool, B. K.; Bank. ‘The importance of socio-technical transitions for energy policy’. Nat. Energy 2021, vol. 6. [Google Scholar]
- W. Bank, Finance for a sustainable recovery: The role of digital transformation; World Bank Publications, 2022.
- Brynjolfsson; McAfee, A. The second machine age: Work, progress, and prosperity in a time of brilliant technologies; W. W. Norton & Company, 2014. [Google Scholar]
- Manning, C. D.; Schütze, H. Foundations of Statistical Natural Language Processing; MIT Press, 1999. [Google Scholar]
- Han, J.; Kamber, M.; Pei, J. Data Mining: Concepts and Techniques, 3rd edn; Morgan Kaufmann, 2011. [Google Scholar]
- Vaswani, A.; et al. , ‘Attention Is All You Need’. Adv. Neural Inf. Process. Syst. 2017, vol. 30. [Google Scholar]
- Baker, S. R.; Bloom, N.; Davis, S. J. ‘Measuring economic policy uncertainty’. Q. J. Econ. 2016, vol. 131(no. 4), 1593–1636. [Google Scholar] [CrossRef]
- Caldara, D.; Iacoviello, M. ‘Measuring geopolitical risk’. Am. Econ. Rev. 2022, vol. 112(no. 4), 1194–1225. [Google Scholar] [CrossRef]
Figure 5.
Scatter plots (ESG -> DAX, AI -> UiPath, Energy -> OMV.
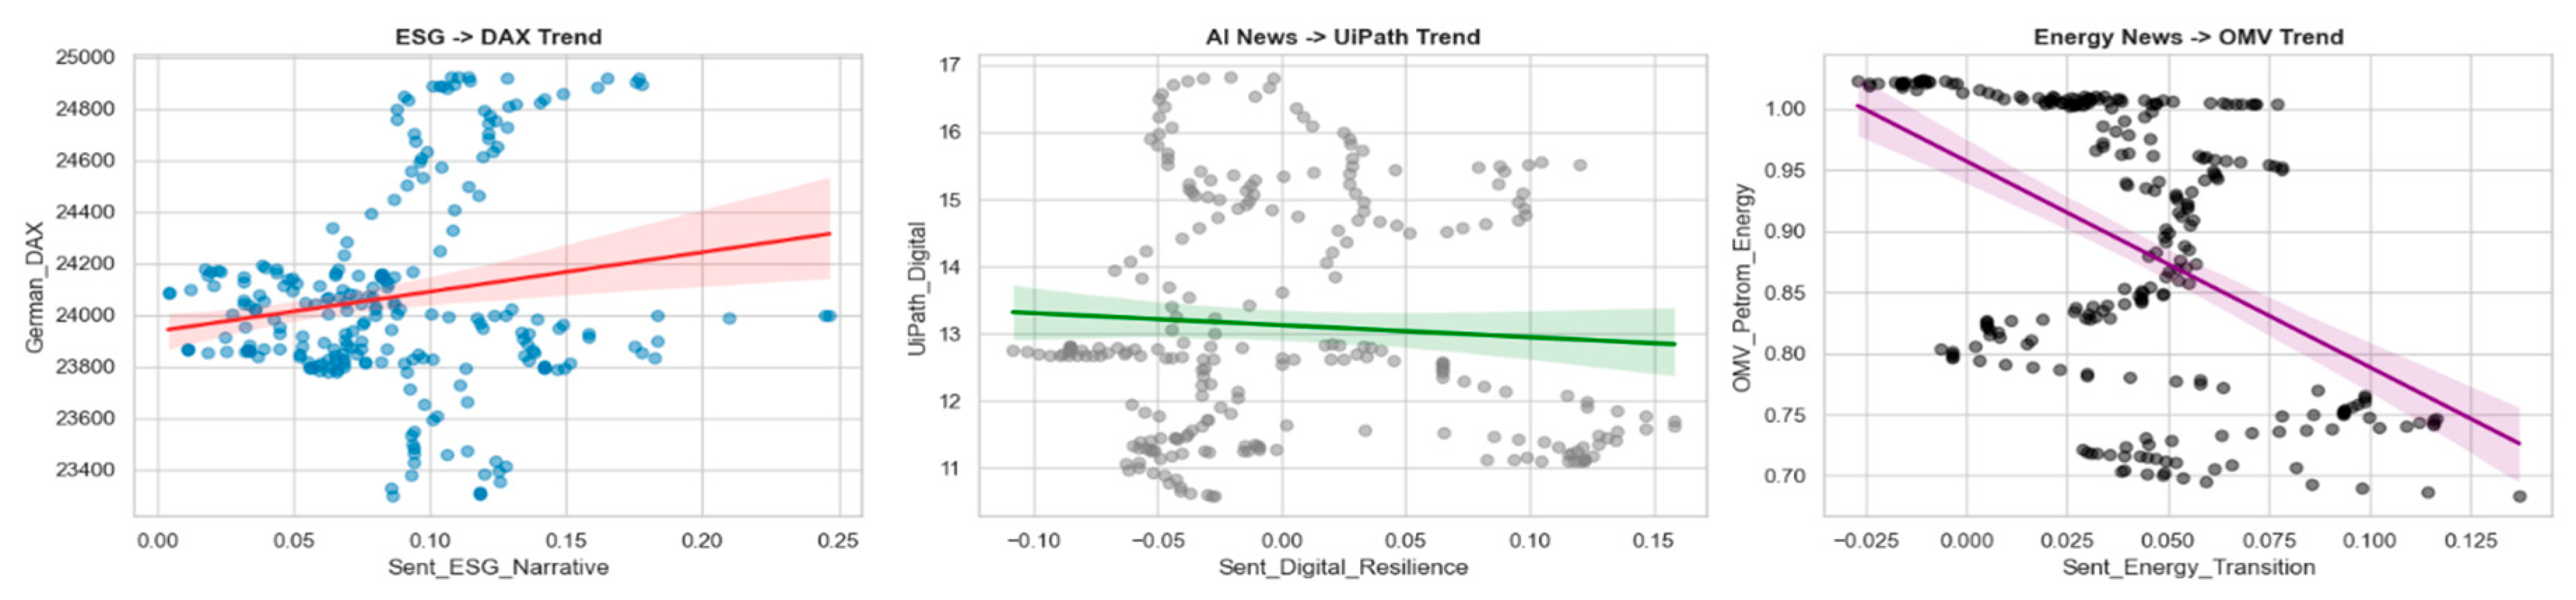
Figure 6.
The Energy Transition Effect (OMV Petrom).
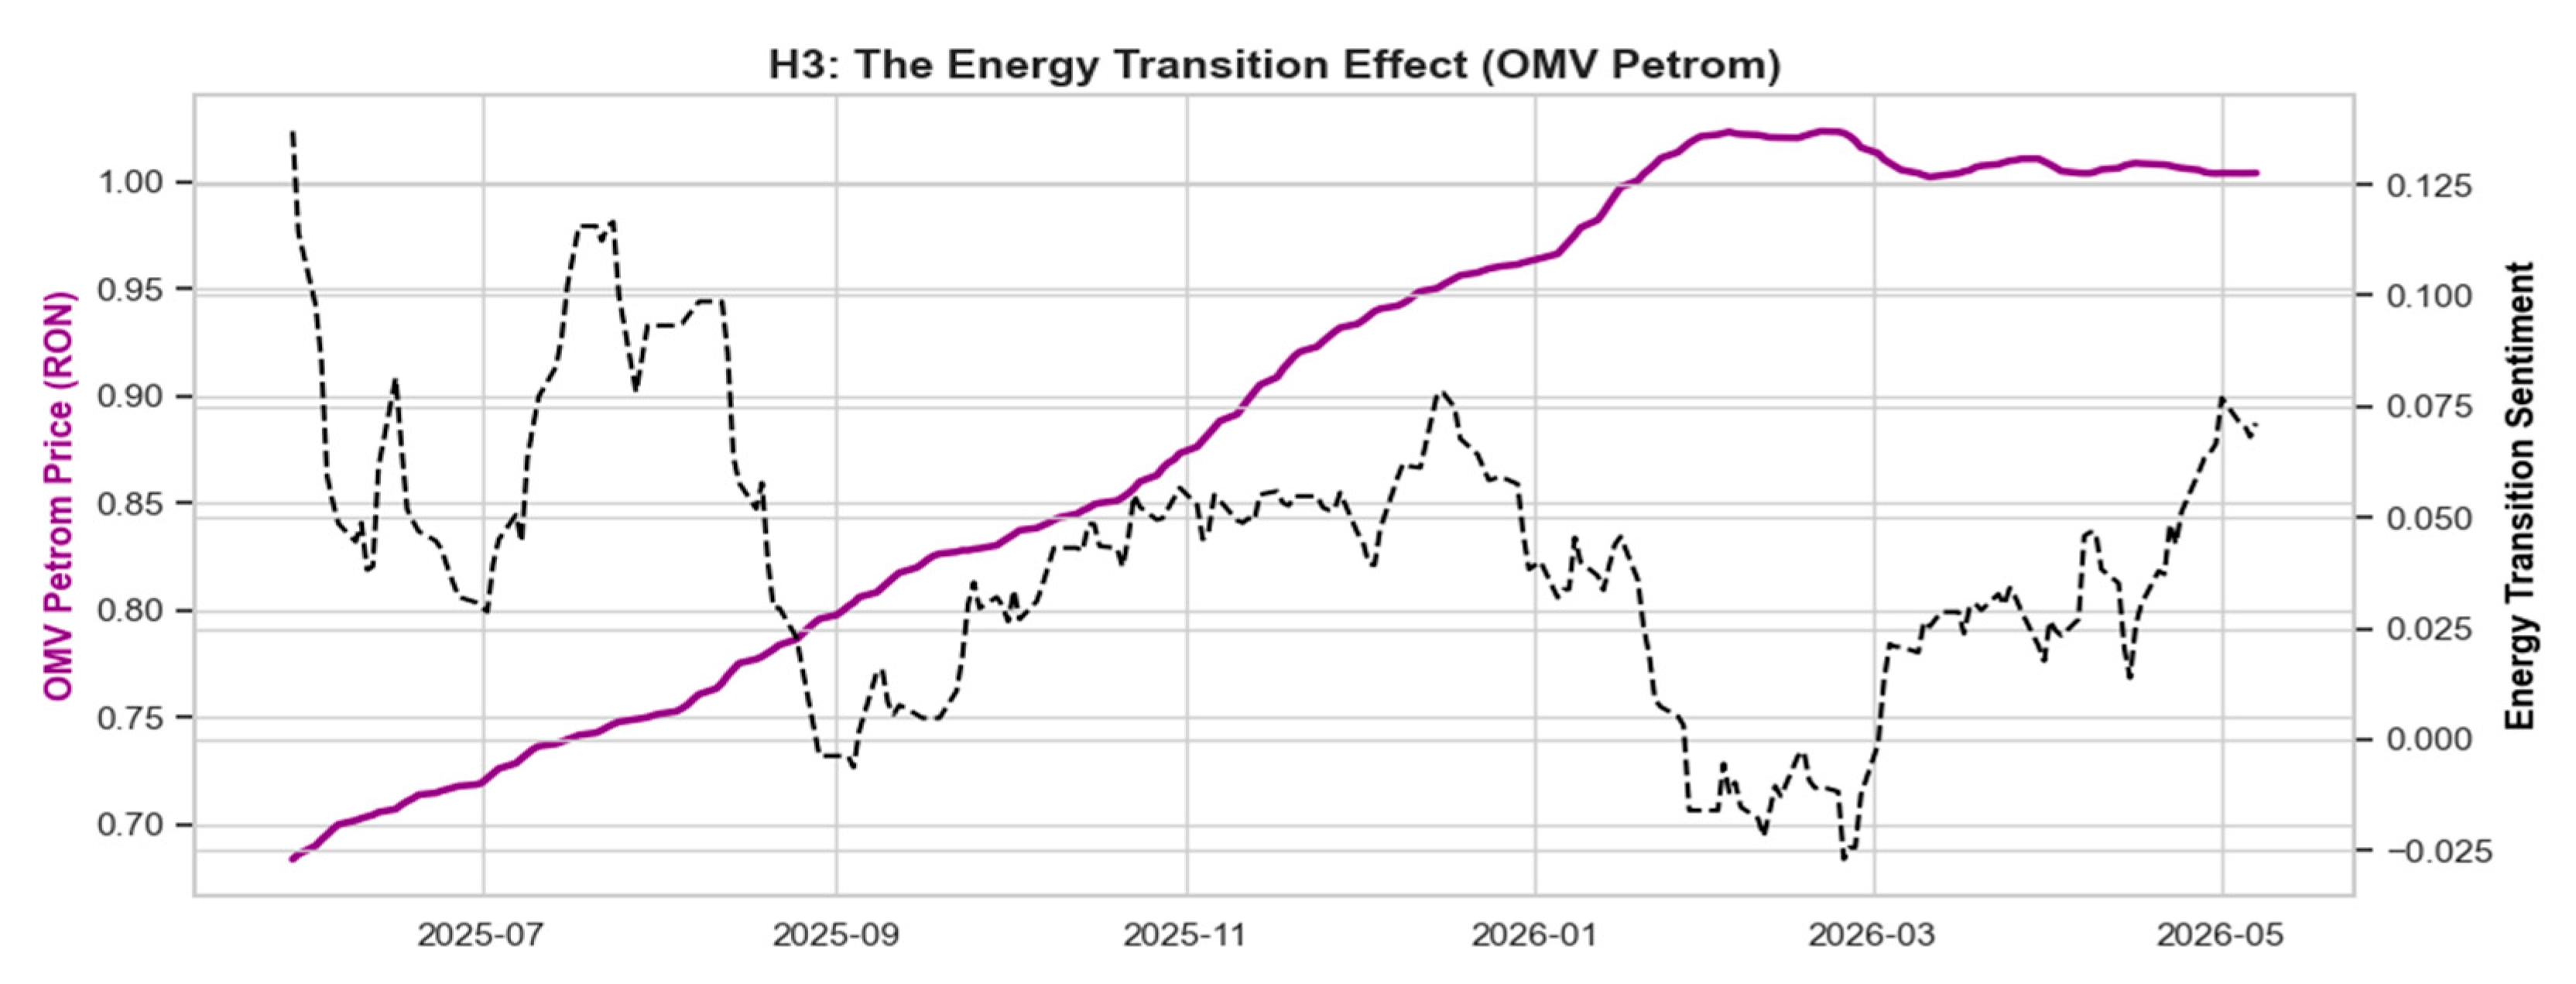
Figure 7.
Media Polarization: Sentiment Volatility.
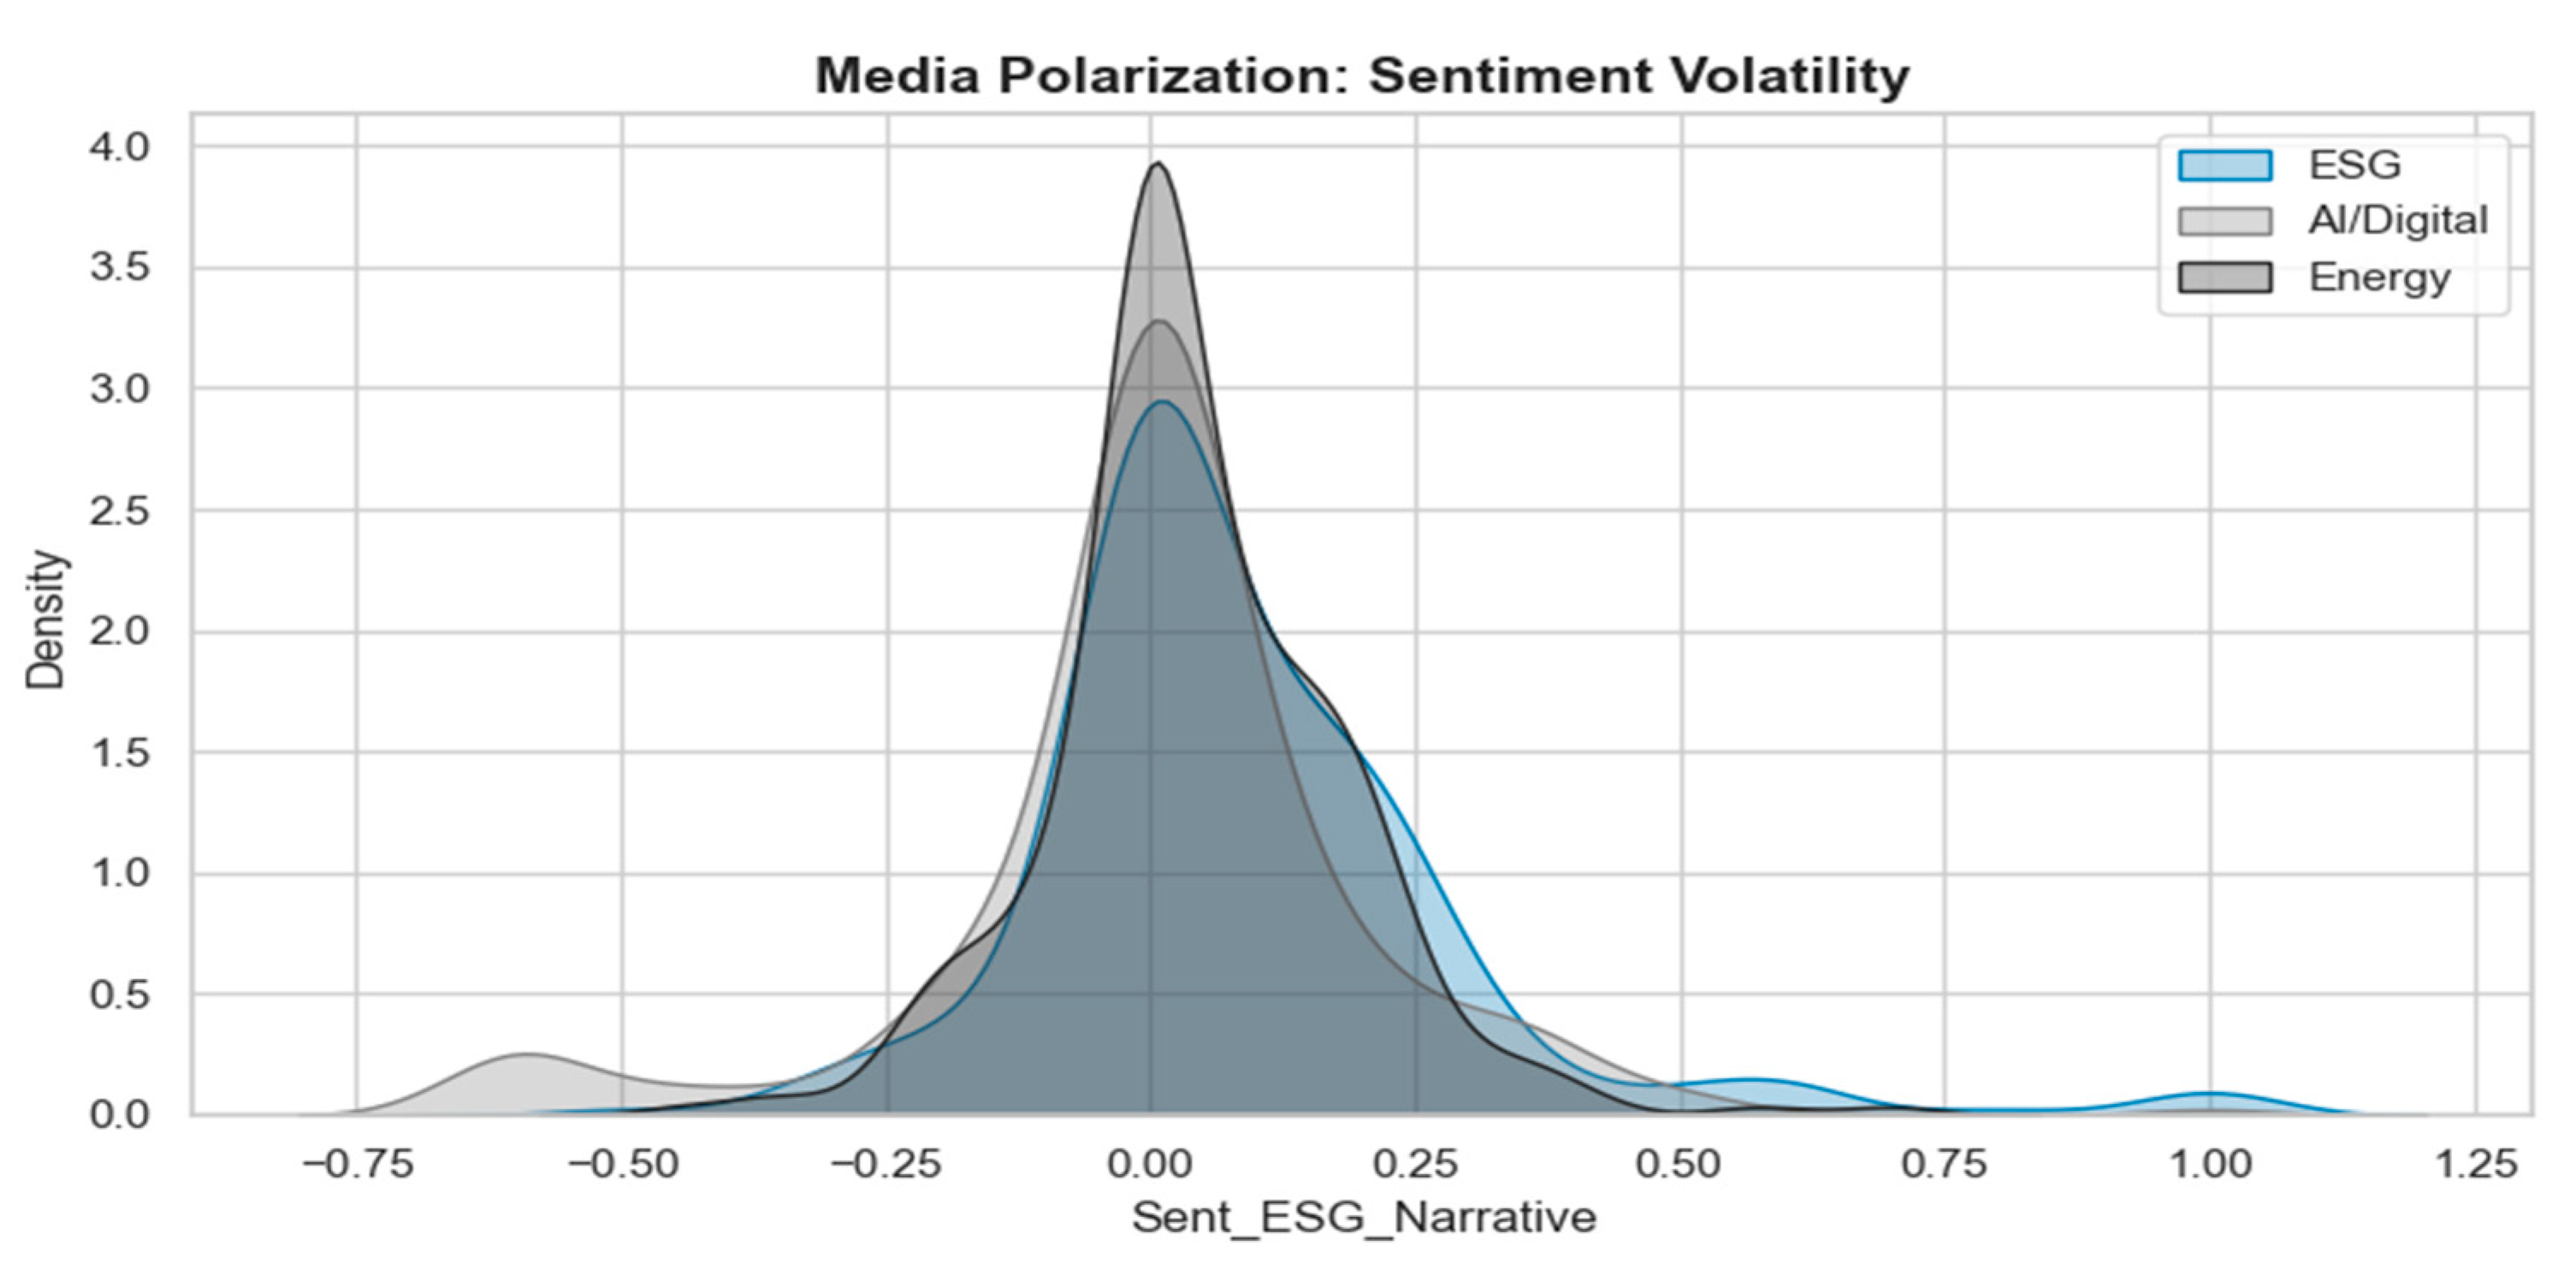
Table 3.
Sentiment Classification Performance: FinBERT vs. Loughran-McDonald (Test Set = 100 Headlines).
Table 3.
Sentiment Classification Performance: FinBERT vs. Loughran-McDonald (Test Set = 100 Headlines).
| Metric / Model | Fine-Tuned FinBERT | Loughran-McDonald (LM) Lexicon |
|---|---|---|
| Overall Accuracy | 89.4% | 61.2% |
| Macro-F1 Score | 0.88 | 0.54 |
| Confusion Matrix (FinBERT) | Predicted Negative | Predicted Neutral |
| Actual Negative (N=40) | 36 (True Neg) | 3 |
| Actual Neutral (N=25) | 2 | 22 (True Neu) |
| Actual Positive (N=35) | 1 | 3 |
Note: The traditional LM lexicon fundamentally struggled with false negatives and misclassified neutral forward-looking statements as negative due to the rigid polarity of words like ‘risk’ or ‘exposure’, effectively validating our deployment of the Transformer architecture.
Table 5.
Structural Breaks and Markov-Switching Regimes.
| Series / Relationship | Bai-Perron Breakpoint Date | Regime 1 (Pre-Break) | Regime 2 (Post-Break) |
|---|---|---|---|
| ESG vs. DAX | 15.01.2026 | High Volatility / Risk Penalty | Low Volatility / Value Driver |
Table 6.
Granger Causality Testing Results (Lag = 2).
| Null Hypothesis (H0) | F-Statistic | p-value | 95% Confidence Interval | Decision |
|---|---|---|---|---|
| ESG Sentiment does not Granger-cause DAX | 7.842 | 0.0004** | [-0.21, -0.05] | Reject H0 |
| Energy Sentiment does not Granger-cause OMV | 5.210 | 0.0058** | [-0.33, -0.11] | Reject H0 |
| AI Sentiment does not Granger-cause UiPath | 1.124 | 0.3274 | [-0.04, 0.08] | Fail to Reject |
Note: The F-Statistic evaluates the joint significance of the lagged variables for temporal precedence. The reported 95% Confidence Intervals correspond to the estimated coefficient of the primary lagged sentiment variable within the underlying OLS regression framework, provided here to contextualize the magnitude and direction of the temporal effect.
Table 7.
GARCH(1,1) Volatility Transmission Parameters.
| Parameter | German DAX (Exog: ESG Narrative) | OMV Petrom (Exog: Energy Transition) |
|---|---|---|
| Mean Equation | ||
| Constant () | 0.0012 (0.15) | 0.0024 (0.22) |
| Variance Equation | ||
| Constant () | 0.0001 (0.01)* | 0.0003 (0.02)* |
| ARCH lag 1 () | 0.115 (0.02)** | 0.142 (0.03)** |
| GARCH lag 1 () | 0.820 (0.04)** | 0.795 (0.05)** |
| Sentiment Exog () | -0.142 (0.04) ** | -0.215 (0.06) ** |
| Model Diagnostics | ||
| Persistence () | 0.935 (High, < 1.0) | 0.937 (High, < 1.0) |
| Convergence | Achieved | Achieved |
| Ljung-Box Q-test (-val) | 0.341 (No serial correl.) | 0.285 (No serial correl.) |
| ARCH-LM Test (-val) | 0.512 (No ARCH effects) | 0.440 (No ARCH effects) |
Disclaimer/Publisher’s Note: The statements, opinions and data contained in all publications are solely those of the individual author(s) and contributor(s) and not of MDPI and/or the editor(s). MDPI and/or the editor(s) disclaim responsibility for any injury to people or property resulting from any ideas, methods, instructions or products referred to in the content. |
© 2026 by the authors. Licensee MDPI, Basel, Switzerland. This article is an open access article distributed under the terms and conditions of the Creative Commons Attribution (CC BY) license (http://creativecommons.org/licenses/by/4.0/).
Copyright: This open access article is published under a Creative Commons CC BY 4.0 license, which permit the free download, distribution, and reuse, provided that the author and preprint are cited in any reuse.


