

Submitted:
11 July 2026
Posted:
13 July 2026
You are already at the latest version
Abstract
Introduction. Forest fires are complex phenomena causing considerable damage to the environment, habitat destruction, soil erosion, greenhouse gas emissions, and biodiversity loss. They are increasing globally, with extreme events becoming more frequent and destructive. Understanding their root causes and influencing factors is crucial. Methods. This work focuses on analyzing data of forest fires that occurred in the period 2010-2023 in Sicily, an Italian region and big island with special orographic characteristics and substantial agricultural and forestry-pastoral activities. The methods concern a careful extraction of data by using QGIS software and official databases and their appropriate statistical analysis. Results. A definition of forest fire risk, coherent with the literature, is here formulated, and a risk ranking and classification of the Sicilian municipalities is so obtained. Risk factors are elicited by expert advice, and their significance is determined via multiple regression analysis with a transformed dependent variable. Conclusions. The work shows an optimal balancing between ecological perspective and operational risk management. Forest fire data collection empowerment is highlighted, such as fire-starting location and total damage caused by each fire event. The study allows optimally distributing the regional budget for forest fire prevention among the municipalities.
Keywords:
statistical risk analysis
; risk management
; forest fires risk
; forest fires prevention
1. Introduction
Forest fires cause considerable damage to the environment and human health, causing habitat destruction, soil erosion, greenhouse gas emissions, and biodiversity loss. Forest fires are increasing globally, with extreme events more frequent and destructive. Climate projections indicate worsening conditions for tropical and boreal regions in the coming decades (Ager et al. 2014).
Forest fire is complex from many perspectives, even basically as a thermo-fluid-dynamic phenomenon. The triggering mechanisms are partially unknown; the implications are intricate from an ecological, environmental, social, and economic point of view. The logistics and management of extinguishing interventions can be extremely difficult, as well as prevention activities (Salis et al. 2021).
Forest fires are favored by climatic, orographic, or contextual factors (culpable phenomena due to carelessness, or even malicious, when caused by voluntary human action). The effect of rural practices can be twofold: from one side, the abandonment of traditional rural practices leads to an accumulation of fuel, increasing potential destructive capacity; from the other side are the same rural practices that could determine the triggering of forest fires (Del Hoyo et al. 2011).
Modeling of the phenomenon (with support of basic science, e.g. mathematics, physics, chemistry) is complex, only thinking that the fire is a stochastic process on spatial and temporal dimensions, whose ignition can simultaneously occur on several location points, and its development can be conditioned by many random factors, whose interaction can be significant, such as, for example, wind, temperature, and humidity (Dìaz-Avalos and Juan, 2022).
The resulting damage from a fire can be very severe, even leading to loss of human life and, in any case, huge economic losses for the entire community.
In recent years, large-scale forest fires have afflicted many countries on all continents. For this reason, scientific research has focused on increasingly in-depth analyses, aimed at better understanding the phenomenon, its causes, and anticipating and mitigating the associated risks (Oom et al. 2022).
The methodology for assessing forest fire risk should be general, but the control on the ground should prioritize the level of municipalities, avoiding the need of coordination at national and international levels.
It is also clear that efforts and economic resources to fight the phenomenon should not be distributed indiscriminately, but in an optimal and careful manner, to maximize their effectiveness and efficiency.
While initially data on forest fires were collected on paper forms and with approximate geographical measurements, starting from the 2000s and with the advent of increasingly accurate proximal and remote mapping tools, very detailed data can be available, which, appropriately processed, can provide valuable assessments (Chuvieco et al. 2009; Militino et al. 2024).
Borisova et al. (2024) report that forest areas are currently experiencing fires almost every year, also affecting protected sites. They propose a flexible and scalable approach for spatial assessment and fire risk mapping for natural resource management. A register of potential fire risk factors is also proposed.
Del Hoyo et al. (2011) report that around 90% of forest fires in southern Europe are caused by human activity. They propose spatial models to predict the probability of forest fires caused by humans in the region of Madrid, incorporating socio-economic factors.
Chuvieco et al. (2009) present the development of a framework for assessing forest fire risk using telemetry and geographic information systems.
Ager et al. (2014) analyze the occurrence and size of forest fires in Sardinia and Corsica, focusing on spatial and temporal models related to soil use and weather factors. The study found that fires are primarily caused by humans, agricultural use, and desert conditions. The maps derived from their statistical models can be used to prioritize intervention areas and identify areas for fuel reduction and prevention efforts.
Finney (2005) discusses the quantitative analysis of fire risk, highlighting the importance of characterizing fire behavior and its effects. The study revealed that most fires in the USA were suppressed when controlled by initial attack forces. Land management policies that allow free fires can increase the risk of relevant fires.
Thompson et al. (2011) present a tool for assessing the forest fires risk, developed to support strategic planning and management of ecological and social resources. The tool aims to monitor fire risks and provide useful information for treatment and mitigation decisions.
Xi et al. (2020) explore the modeling of the duration and size of forest fires as dependent variables using advanced statistical techniques to improve prediction and management in a changing climate.
Xi et al. (2018) discuss the evolution of fire risk management systems and the importance of data-based tools for managing fire hazards. The systems of fire risk management have evolved from qualitative to deterministic/stochastic models, highlighting the need for data-based tools for fire management.
Oliveira et al. (2021) examine the risk models and their applications for forest fire management. Factors such as climate change, soil use, and sociodemographic conditions influence risk.
Elhami-Khorasani et al. (2022) present a conceptual framework for probabilistic risk assessment and consequences of fires in wildland-urbane interface communities. A proactive response is needed to manage this risk. The management of forest fires requires an engineering approach, focus on stakeholder collaboration, and overcoming knowledge gaps through coordinated research efforts.
Xu et al. (2024) provide a comprehensive revision of prediction methods for forest fire risk, particularly focusing on deep learning techniques. Their paper analyzes the geographical distribution of studies and their predictive capabilities. The forest fire risk is often thought as made of three components: probability, intensity, and effects. The specific definition of risk can vary based on research objectives, methods, and algorithms used. Historical data of forest fires are essential for prediction models. Data records vary in source and scale, with governmental agencies and satellite data being the most used.
Toledo-Jaime et al. (2024) propose a spatio-temporal model of the occurrence and size of forest fires in Jalisco, Mexico, from 2001 to 2020, focusing on environmental and anthropogenic factors that influence their behavior. The study found that the frequency and intensity of forest fires have increased globally. Climate conditions, such as temperature and precipitation, influence the content of the fuel's moisture. The distance between roads and agricultural land was used as an indicator of human activity.
Descriptive analyses of forest fires data in southern Italy are not new (see, e.g. Leone, 1983), but the phenomenon of forest fires in Sicily needs more attention. In fact, Sicily represents a model case for its characteristic of being an island, for its geographical location in the center of the Mediterranean area, for its orographic characteristics, and for the number of people involved in agriculture and forestry-pastoral activities—factors that may influence forest fire risk, as will be demonstrated in this work.
In 1967, Mr. Mario Fasino, then Councilor for Agriculture and Forestry of the Sicilian Region, planned three hundred thousand hectares of reforestation on mountain territory (Fasino, 1967). The aim was to defend the territory and the infrastructures from hydrogeological instability and from the abandonment of the mountains. The objective, in terms of surface, was never fully achieved. A partial artificial forest was created, which stimulated a healthy economy for the families of mountain municipalities. Sicily then became rich in forest nurseries, wisely spread throughout the territory, and capable of producing millions of seedlings suitable for the purpose.
The temporary reforestation was meant to stabilize the soil, counteract the fury of rainwater, and prepare the territory for the expansion of typical plants that directed the forests towards a more stable natural phytocenosis. However, this last objective was minimally pursued, leading today to an aged forest cover, often overripe, demonstrating many aspects of inadequacy. For instance, persistent artificial stands limit the natural evolution of the forest—as happens, for example, in the Aidone woods in the province of Enna—where eucalyptus trees inhibit the underlying oak stand and remain highly vulnerable to fires.
Sicily region is affected by severe weather conditions in the summer, exposing it, more than other regions of Italy, to the plague of forest fires. The complex network of Sicilian region municipalities (390 in total) is increasingly responsible for processes that should be at least of regional interest, since such serious problems have roots well beyond the local level.
In Sicily, the evolution of the forest fire phenomenon and the ways to deal with it drastically increased in the late 1970s and continued into the 1980s, with the first aerial interventions with helicopters. Many landscapes, thanks to economic development, began to change with the ever-increasing spread of second homes, new urbanized areas, and new infrastructures. In the 1990s, with a changing economy and increasing land abandonment, the danger to buildings and infrastructure increased, requiring greater coordination between ground forces responsible for extinguishing fires, an increasing use of aerial firefighting, and new technologies to support such operations (Garofalo and Paladino, 1998). In the 2000s, the pressure of fires continued to increase, moving towards urbanized areas and increasingly characterized by the use of aircrafts.
2. Methods
2.1. Data Sources and Data Pre-Processing
The dataset of burned areas for the years 2010-2023 was made available by the Forestry Corps of the Sicilian Region. The dataset referred to the records of the surfaces affected by fire, carried out by the detachments of the Forestry Corps, by their respective competence.
The extraction of data useful for carrying out the work on a municipal basis was carried out using the QGIS software (v.3.16). To this end, the intersection of the layer of municipal territories (ISTAT, 2011a) of the 390 municipalities of the region was made with the layers of the surfaces annually affected by fires, obtaining the net burned surface that affected each municipality in each year.
Please note that the data relating to areas affected by fires, made available by the Forestry Corps, do not represent the total burned area. This is because the Forestry Corps only records burned areas classified as "forest" under current legislation, and therefore its surveys are only an aid to the complete identification of the areas affected by fires for the application of protection measures (SIF 2025).
The data related to the number of residents, the land area, and the altitude of each municipality were extracted from the data warehouse of the population and housing census (ISTAT 2011.b), while the data relating to artificial areas, urban green areas, agricultural areas, wooded territories and semi-natural habitats, wetlands, and water bodies (see Section 3.4) were obtained through the use of the QGIS with the intersection of the municipal territories layer of the former 390 municipalities (currently they are 391) of the region with the layer of the Corine Land Cover Map of the Italian Institute for Environmental Protection and Research, (ISPRA, 2018).
Finally, the compactness and fragmentation indexes were derived from the ISPRA studies (Assennato, 2016; Giunta et al., 2023). The compactness of urban areas is an index indicating the density and development of an urban area compared to sparse and rural areas (Munafò et al. 2015). It measures the relative proportion of built and unbuilt areas within an urban area, and it is used to evaluate urban efficiency, sustainability, and environmental impact. The index is calculated considering the area occupied by buildings and infrastructures and the total surface of an urban area.
The fragmentation of territory is the reduction of ecosystems, habitats, and units of the landscape due to urban expansion and the development of an infrastructural network, leading to the transformation of large-scale areas into smaller, more isolated parts. This process disrupts the continuity of ecosystems and habitats.
2.2. Time Trends Analysis
The data analysis firstly looks at the time trends of forest fire events to get an overview of what has happened year by year, how the phenomenon is distributed monthly, and weekly throughout a year and, how it is distributed between the days of a week.
2.3. Risk Assessment at Municipality Level
Generally speaking, the definition of risk is not unique. It is based on assumptions, constructs, and formulations that depend on the specific context in which they are generated (Aven, 2009).
In this case, based on the specific literature on forest fires, risk is conceived by considering three fundamental elements, each one acquiring numerical consistency for each municipality of the region:
- the number of fire events (hereinafter NF) which affected the municipality;
- the total burned forest areas (hereinafter BA) in the time period considered;
- the forested areas (hereinafter FA) currently present in that municipality. Here we intend territories covered by forest species, regardless of the regulatory definition of "forest".
Once the elements constituting the risk have been established, they must be combined in the most appropriate manner. It is here assumed that if just one of the three elements is zero, the risk is zero; therefore, an intuitive and appropriate definition of risk is given by the following algebraic formula:
This formula is consistent with the most adopted definition of risk as the product of the probability of an adverse event, the damage caused, and the potential consequences.
In this case, a forest fire is an adverse event, the probability determined from a frequentist perspective through the number of fires (which, normalized with respect to the total number, represents a relative frequency of fires for each municipality).
From the initial dataset, the cumulative values (over the entire investigated time frame 2010-2023) of NF and BA, for each of the 390 municipalities of the Sicilian Region, were calculated, while the FA present in the municipalities were obtained as explained in Section 2.1.
Using the (1), it is therefore possible to attribute a risk value to each municipality in the Sicilian region and therefore also a ranking among them. It is also possible to group the risk values into a limited number of contiguous classes (three to five classes are generally adopted). Such grouping depends upon the specific risk values distribution, and may require non naive classification techniques, as will be shown in Section 3.2. below.
2.4. Geographical, Economic, and Social Factors
Following the descriptive analysis of forest fire data, it is necessary to move on to an investigation of correlated factors. After deep brainstorming, geographical, economic, and social factors (Section 2.1) were elicited to investigate their influence on the forest fire phenomenon.
In addition to the forested areas (involved in the risk definition), ten factors were initially considered and quantified for each municipality, as follows (in square brackets are their respective measurement units, where applicable):
- ▪ Agricultural areas [hectares]
- ▪ Altitude [meters above sea level]
- ▪ Artificial areas [hectares]
- ▪ Compactness index
- ▪ Fragmentation index
- ▪ Land area [km²]
- ▪ Number of residents
- ▪ Urban green areas [hectares]
- ▪ Water bodies [hectares]
- ▪ Wetlands [hectares]
The ratio between the number of residents and land area provides the population density (expressed as usual in residents/km²), which has been considered as a single meaningful factor for the analysis. Hence, nine factors were finally considered to be related to the forest fire risk.
2.5. Risk Analysis
The regression analysis of the risk, considered as a dependent variable, vs. the nine considered factors elected as independent variables, can be conducted relying on Box-Cox data transformation (Draper and Smith 1998). However, since the transformation requires values higher than zero, the zero-risk municipalities need to be eliminated from the dataset for such analysis.
3. Results
3.1. Time Trends
The trend over the years of the impact of forest fires in the whole Sicilian region is shown in Figure 1.a, where the vertical coordinate of the bubble center corresponds to NF, and the area of the bubble is proportional to BA. Only two attenuations of the forest fire phenomenon can be seen from the graph, in 2013 and 2018, contrasting with tremendous increases in 2017 and 2018.
Figure 1.b shows the distribution of fires by month of year. The most critical months are undoubtedly July and August. June and September are also critical; June for the large amount of easily flammable biomass widely present and September for the prolonged water deficit of soil and vegetation.
Figure 1.c shows the distribution of forest fires by the week of the year (ISO standard 8601 used to define the week number from the fire date): 50% of fires occur between week 27 (end of June, first quartile) and week 35 (end of August, third quartile) with a modal peak in week 31 (end of July).
The bar chart in Figure 1.d shows the distribution of the number of fires by the days of the week. Forest fires appear almost equally distributed over the week. However, the large amount of data suggests adopting a non-parametric Chi-square test with the null hypothesis of even distribution (Table 1). The assumption of even distribution can be rejected (p-value = 0.026), highlighting the criticality of Sunday, in which the number of forest fires is generally very high.
3.2. Risk Analysis
The empirical distribution of the discrete variable NF (the total number of fires for each municipality over the period 2010-2023, see Section 2.3), considering the entire dataset of the 390 municipalities of the Sicilian Region, is very dispersed, counting thirty-two zeros and many small values (see Figure 2.a).
The distribution of BA (see Section 2.3) can be seen in the histogram of Figure 2.b. It is asymmetrical and very far from a Gaussian model. The distribution of the Forested Areas has similar characteristics, as shown in the histogram of Figure 2.c. The distribution of Risk values calculated according to (1) of Section 2.3 has an extremely asymmetrical shape and many outliers (box-whiskers plot in Figure 2.d).
The Appendix provides the list of the 390 Sicilian municipalities ranked according to descending fire Risk.
Due to the extreme skewness of risk values, a division into risk classes based on the general percentile rule (e.g. four classes delimited by the quartiles of the distribution) is not a good solution. Therefore, it was decided to adopt risk values data clustering based on the K-means criterion.
The dataset was then split into five contiguous classes, from very high to very low risk, with an intermediate level, thus arriving at the risk map of the 390 Sicilian municipalities shown in Figure 3. The level, or risk class, for each municipality, is fully reported in the last column of the Table in Appendix.
3.3. Multiple Regression Analysis of the Forest Fire Risk
Once the risk values were calculated for each municipality, a statistical estimation of the factors’ relative importance could be made. By looking at the empirical distribution of the Risk index (Figure 2.d), it is evident that to analyze the variable by parametric methodologies of inferential analysis (based on the Gaussian model) it is necessary an analytical transformation. The Box-Cox transformation (Draper & Smith 1998) requires that all zero-risk values shall be excluded from the analysis. Once the zero-risk data (forty-two cases) were excluded, the parametric analysis of regression with the nine regressors defined in Section 2.4, can proceed.
The nine factors used as regressors are:
- Factor A: Agricultural areas
- Factor B: Altitude
- Factor C: Artificial areas
- Factor D: Compactness index
- Factor E: Fragmentation index
- Factor F: Population density
- Factor G: Urban green areas
- Factor H: Water bodies
- Factor J: Wetlands
Applying the regression analysis to the risk dataset, summary results are reported in Table 2. The estimated parameter of the Box-Cox transformation is
The estimated regression equation can be written as:
Figure 4.
Linear regression summary output for the forest fire Risk variable: a. Pareto chart of the standardized effects; b. residuals vs. fitted values; c. histogram of residuals; d. Normal probability plot of residuals.
Figure 4.
Linear regression summary output for the forest fire Risk variable: a. Pareto chart of the standardized effects; b. residuals vs. fitted values; c. histogram of residuals; d. Normal probability plot of residuals.
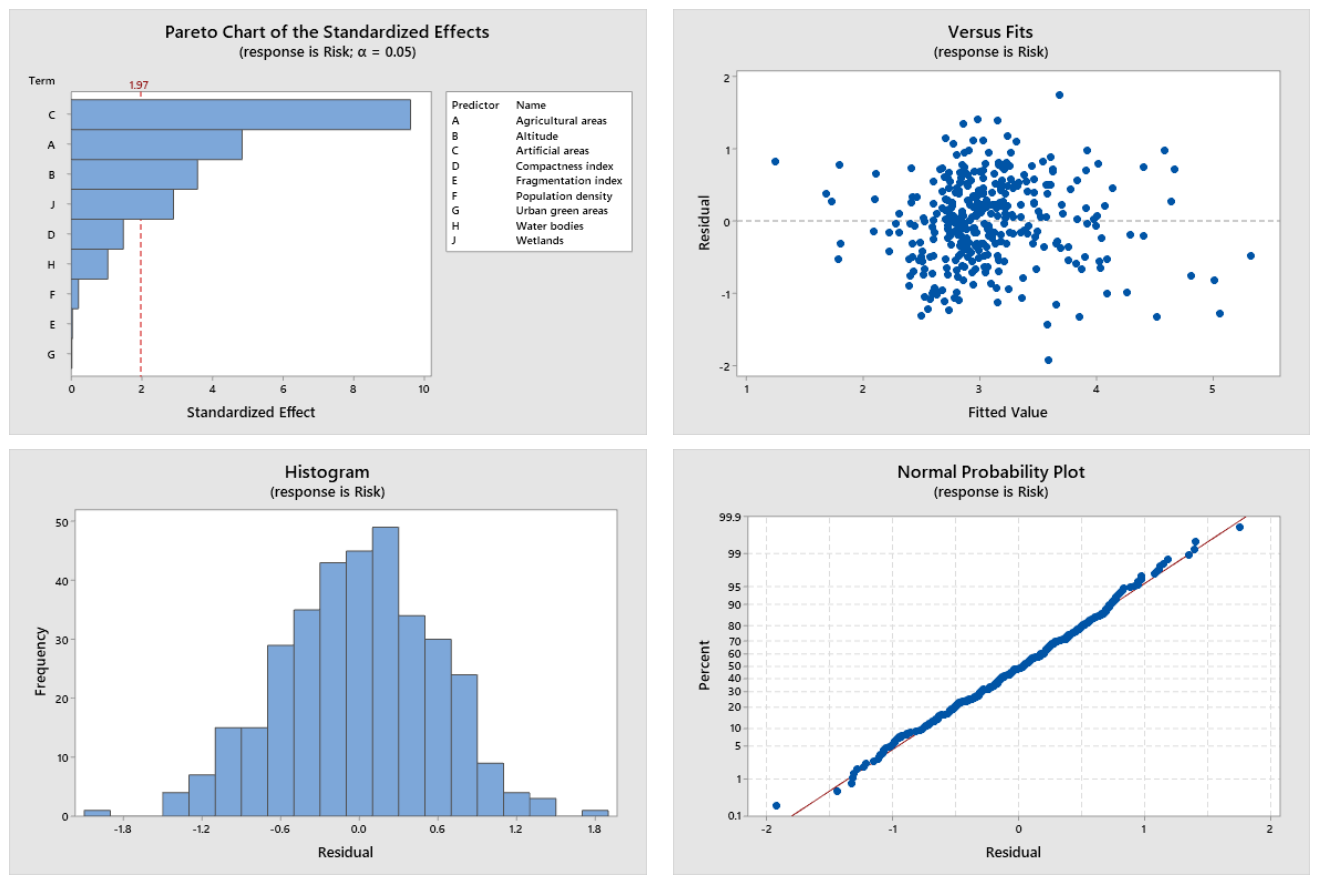
Figure 3.a shows the factors with a significant impact, which are in decreasing order of importance:
- ▪ Artificial surfaces, with a "+" effect (the more artificial surfaces, the greater the risk)
- ▪ Agricultural areas, with a "+" effect (the more agricultural areas, the greater the risk)
- ▪ Altitude, with a "+" effect (the higher the altitude, the greater the risk)
- ▪ Wetlands, with a "-" effect (the more wetlands, the lower the risk)
The other five factors do not have a significant effect on risk. The analysis of residuals is also satisfactory (Figure 3.b--d).
All information gained by data analysis is vital for organizing an effective and efficient firefighting system that the regional government, in collaboration with the municipalities, can implement to mitigate the overall risk and the highly negative economic and environmental impact of forest fires in the region.
4. Discussion
From the analysis of the time series of fire data at the regional level, the level of novelty is limited, but the information is scientifically validated. Over the examined thirteen years, the trend has been fluctuating. The fire phenomenon affected almost all months of the year, with a significant impact in the period June-September; the peak week is the last of July. In terms of weekly distribution, there is a strong negative impact on Sundays, most likely due to the frequentation of the woods and countryside by people paying little attention to practices that can lead to the ignition of fires.
In this work, based on a large dataset of forest fires, it was possible to use a frequentist approach for the assessment of the probability of occurrence and an approach for the assessment of damage considering the burned areas, an objective element of damage that can have declinations and implications in multiple aspects: ecological, socio-economic, etc.
The adopted definition of "risk," involving the probability of fire occurrence (NF), already occurred damage (BA), and potential loss of the forested areas (FA), is a conservative definition, coherent with most of the scientific literature on fire risk, and which, if adequately argued and supported by the peculiar metric of the distribution of the fire events among the regional municipalities, constitutes one of the major results of this work.
A regression method has been developed for the analysis of the risk dataset, leading to the estimation of the relationships between risk and potentially influential factors selected by expert reasoning.
Based on the regression analysis, it can be established that artificial surfaces, agricultural areas, and altitude significantly increase the forest fire risk (the higher these factors, the higher the risk), while wetlands significantly mitigate the risk. Zero-risk subsets contain forty-two municipalities characterized by either the absence of fires over the analyzed time period or the absence of forested areas, or the concomitance of the two cases. The ranking of risk among the municipalities and the risk classification may allow a proportional allocation of the regional budget, while the significant factors may suggest a coordinated, efficient, and effective implementation of firefighting systems.
Conclusions
Research on forest fires has made great progress in the last thirty years, but still much remains to be done. There is still a lot to do in terms of management, and basically it is necessary to focus on risk to encourage prevention policies as much as possible.
Sicily represents a case to be accurately studied, being a large island and due to its geographical location, its orographic characteristics, and economic and social aspects.
In Sicily it is necessary to promptly review the policies of the territory, with substantial investments for the recovery of the best possible agriculture and better management of the landscape with an appropriate control of the land and continuity of the vegetation, especially when this becomes intimately interconnected with anthropogenic structures and infrastructures.
Determining the burned areas at the level of single municipalities was aimed at distributing both responsibility and suffered damage as accurately as possible.
It should be noted that the administrative procedure that determines a more complete extent of the damage due to a fire can take several years and would not comprehensively address additional consequences, such as environmental ones, which are complex to assess.
This work considers an evaluation of the “damage” (BA) made available by the regional Forestry Corps. A more detailed estimation of the damage is beyond the limitations of this work and can be a matter for further research.
Acknowledgments
Authors’ contributions: Stefano Barone was responsible for statistical modeling and data analysis. Santo Orlando was responsible for the GIS data extraction and manipulation. Antonino Paladino provided expertise in forest fires and their territorial management, based on his experience within the Sicilian Forestry Corps, which provided the raw data for this study.
Appendix A
The 390 Sicilian municipalities ranked by descending Forest Fire Risk and its three determinants, Forested Areas (FA), Number of Fires (NF), and Burned Areas (BA). The last column of the table shows the risk level determined via cluster analysis. Note: the last 42 cases (zero risk) are listed in alphabetical order of municipality name.
| Municipality | FA | NF | BA | Forest Fire Risk | Risk level |
| Monreale | 8720 | 475 | 14560 | 6.03E+10 | very high |
| Mazzarino | 8455 | 374 | 13767 | 4.35E+10 | very high |
| Messina | 7488 | 492 | 10460 | 3.85E+10 | very high |
| Randazzo | 9801 | 308 | 6449 | 1.95E+10 | very high |
| Enna | 7856 | 144 | 9008 | 1.02E+10 | very high |
| Noto | 9364 | 250 | 3961 | 9.27E+09 | very high |
| Bronte | 9614 | 158 | 5289 | 8.03E+09 | very high |
| Palermo | 4274 | 212 | 7997 | 7.25E+09 | very high |
| Piazza Armerina | 4974 | 188 | 4235 | 3.96E+09 | very high |
| Castiglione di Sicilia | 4570 | 207 | 4036 | 3.82E+09 | very high |
| Castellammare del Golfo | 3604 | 156 | 5777 | 3.25E+09 | very high |
| San Mauro Castelverde | 7276 | 55 | 6777 | 2.71E+09 | very high |
| Caccamo | 4595 | 147 | 3166 | 2.14E+09 | very high |
| Aidone | 4797 | 108 | 3957 | 2.05E+09 | very high |
| Nicosia | 5458 | 76 | 4782 | 1.98E+09 | very high |
| Siculiana | 745 | 427 | 6105 | 1.94E+09 | very high |
| Casteltermini | 2582 | 120 | 5741 | 1.78E+09 | very high |
| Melilli | 4851 | 69 | 4974 | 1.66E+09 | very high |
| Custonaci | 2707 | 68 | 8536 | 1.57E+09 | very high |
| Caltagirone | 7159 | 118 | 1564 | 1.32E+09 | high |
| Carini | 1948 | 143 | 3920 | 1.09E+09 | high |
| Geraci Siculo | 5869 | 40 | 4648 | 1.09E+09 | high |
| Collesano | 4086 | 86 | 3042 | 1.07E+09 | high |
| Cefalù | 3328 | 81 | 3956 | 1.07E+09 | high |
| Caltanissetta | 3945 | 131 | 2040 | 1.05E+09 | high |
| Ragusa | 3733 | 92 | 2969 | 1.02E+09 | high |
| Altofonte | 1500 | 143 | 3934 | 8.44E+08 | high |
| Palazzo Adriano | 3941 | 61 | 3178 | 7.64E+08 | high |
| Cesarò | 12429 | 63 | 937 | 7.33E+08 | high |
| San Vito Lo Capo | 1656 | 40 | 10532 | 6.98E+08 | high |
| Caltabellotta | 3210 | 104 | 2048 | 6.84E+08 | high |
| Butera | 3373 | 81 | 2498 | 6.82E+08 | high |
| Piana degli Albanesi | 1529 | 104 | 4083 | 6.49E+08 | high |
| Lipari | 4226 | 62 | 2438 | 6.39E+08 | high |
| Agrigento | 845 | 439 | 1677 | 6.22E+08 | high |
| Bivona | 1550 | 138 | 2785 | 5.96E+08 | high |
| Santo Stefano Quisquina | 2865 | 89 | 2276 | 5.80E+08 | high |
| Vizzini | 4478 | 75 | 1678 | 5.63E+08 | high |
| Monterosso Almo | 3098 | 104 | 1736 | 5.59E+08 | high |
| Chiaramonte Gulfi | 2049 | 135 | 1935 | 5.35E+08 | high |
| Mistretta | 7207 | 40 | 1807 | 5.21E+08 | high |
| Sambuca di Sicilia | 1643 | 113 | 2375 | 4.41E+08 | high |
| Sortino | 3663 | 56 | 2117 | 4.34E+08 | high |
| Salemi | 1027 | 98 | 4163 | 4.19E+08 | high |
| Misilmeri | 948 | 125 | 3494 | 4.14E+08 | high |
| Francavilla di Sicilia | 5815 | 62 | 1145 | 4.13E+08 | high |
| Avola | 1138 | 128 | 2809 | 4.09E+08 | high |
| Corleone | 3485 | 31 | 3687 | 3.98E+08 | high |
| Sclafani Bagni | 2300 | 42 | 3979 | 3.84E+08 | high |
| Contessa Entellina | 2191 | 51 | 3395 | 3.79E+08 | high |
| Niscemi | 1212 | 143 | 1877 | 3.25E+08 | high |
| Polizzi Generosa | 2418 | 73 | 1824 | 3.22E+08 | high |
| Castronovo di Sicilia | 3149 | 54 | 1816 | 3.09E+08 | high |
| Calatafimi-Segesta | 1037 | 112 | 2628 | 3.05E+08 | high |
| Borgetto | 1101 | 98 | 2797 | 3.02E+08 | high |
| Licodia Eubea | 2363 | 84 | 1491 | 2.96E+08 | high |
| Cattolica Eraclea | 1099 | 199 | 1346 | 2.94E+08 | high |
| Burgio | 1874 | 101 | 1551 | 2.94E+08 | high |
| Regalbuto | 3947 | 33 | 2183 | 2.84E+08 | high |
| Ragalna | 1807 | 136 | 1069 | 2.63E+08 | high |
| Troina | 2972 | 39 | 2254 | 2.61E+08 | high |
| Linguaglossa | 3103 | 83 | 995 | 2.56E+08 | high |
| Mongiuffi Melia | 1533 | 79 | 2102 | 2.55E+08 | high |
| Petralia Sottana | 5173 | 34 | 1379 | 2.43E+08 | high |
| Santa Cristina Gela | 400 | 135 | 4454 | 2.41E+08 | high |
| Sant'Angelo Muxaro | 1663 | 88 | 1543 | 2.26E+08 | high |
| Carlentini | 1717 | 59 | 2195 | 2.22E+08 | high |
| Menfi | 915 | 118 | 1899 | 2.05E+08 | high |
| Montalbano Elicona | 4198 | 39 | 1208 | 1.98E+08 | high |
| Chiusa Sclafani | 1707 | 75 | 1463 | 1.87E+08 | high |
| Barcellona Pozzo di Gotto | 1351 | 90 | 1465 | 1.78E+08 | high |
| Tortorici | 2741 | 120 | 532 | 1.75E+08 | high |
| Roccella Valdemone | 1350 | 58 | 2228 | 1.74E+08 | high |
| Gangi | 3403 | 21 | 2376 | 1.70E+08 | high |
| Termini Imerese | 848 | 123 | 1477 | 1.54E+08 | high |
| Caltavuturo | 1554 | 50 | 1905 | 1.48E+08 | high |
| Ribera | 1099 | 117 | 1147 | 1.48E+08 | high |
| Naso | 1039 | 69 | 1881 | 1.35E+08 | high |
| Alessandria della Rocca | 210 | 184 | 3354 | 1.30E+08 | high |
| Licata | 1038 | 82 | 1477 | 1.26E+08 | high |
| Cianciana | 1212 | 71 | 1438 | 1.24E+08 | high |
| Pantelleria | 2564 | 51 | 940 | 1.23E+08 | high |
| Cammarata | 2964 | 74 | 553 | 1.21E+08 | high |
| Adrano | 3101 | 79 | 494 | 1.21E+08 | high |
| Gratteri | 1410 | 23 | 3562 | 1.16E+08 | high |
| Torretta | 1758 | 63 | 1042 | 1.15E+08 | high |
| Pollina | 2343 | 76 | 623 | 1.11E+08 | high |
| Biancavilla | 1554 | 100 | 647 | 1.00E+08 | high |
| Buscemi | 1629 | 64 | 947 | 9.88E+07 | high |
| Catania | 259 | 106 | 3559 | 9.77E+07 | high |
| Casalvecchio Siculo | 2100 | 69 | 615 | 8.92E+07 | high |
| Patti | 604 | 39 | 3785 | 8.92E+07 | high |
| Montemaggiore Belsito | 1006 | 53 | 1579 | 8.42E+07 | high |
| Scillato | 1721 | 21 | 2095 | 7.57E+07 | high |
| Belmonte Mezzagno | 251 | 126 | 2344 | 7.41E+07 | high |
| San Marco d'Alunzio | 1320 | 63 | 824 | 6.85E+07 | high |
| Gagliano Castelferrato | 1653 | 47 | 881 | 6.84E+07 | high |
| Belpasso | 1321 | 108 | 460 | 6.56E+07 | high |
| Vicari | 727 | 32 | 2750 | 6.40E+07 | high |
| Sperlinga | 1919 | 19 | 1576 | 5.75E+07 | high |
| Montevago | 442 | 79 | 1624 | 5.67E+07 | high |
| Galati Mamertino | 2410 | 51 | 434 | 5.33E+07 | medium |
| Erice | 1010 | 28 | 1863 | 5.27E+07 | medium |
| Santa Ninfa | 490 | 85 | 1228 | 5.11E+07 | medium |
| Calascibetta | 1598 | 28 | 1120 | 5.01E+07 | medium |
| Motta Camastra | 1913 | 36 | 724 | 4.99E+07 | medium |
| Sommatino | 460 | 83 | 1295 | 4.94E+07 | medium |
| Buseto Palizzolo | 625 | 30 | 2636 | 4.94E+07 | medium |
| Gioiosa Marea | 717 | 59 | 1161 | 4.91E+07 | medium |
| Sciacca | 390 | 91 | 1370 | 4.86E+07 | medium |
| Siracusa | 634 | 85 | 880 | 4.74E+07 | medium |
| Capizzi | 3523 | 23 | 578 | 4.68E+07 | medium |
| Tusa | 1110 | 21 | 1998 | 4.66E+07 | medium |
| Antillo | 3186 | 36 | 405 | 4.64E+07 | medium |
| Sutera | 1429 | 34 | 937 | 4.55E+07 | medium |
| San Cataldo | 2483 | 47 | 390 | 4.55E+07 | medium |
| Nicolosi | 1313 | 54 | 626 | 4.44E+07 | medium |
| Giardinello | 947 | 52 | 864 | 4.26E+07 | medium |
| Poggioreale | 500 | 45 | 1880 | 4.23E+07 | medium |
| Isnello | 2841 | 29 | 513 | 4.23E+07 | medium |
| Caronia | 17346 | 16 | 145 | 4.01E+07 | medium |
| Bisacquino | 951 | 49 | 858 | 4.00E+07 | medium |
| Naro | 750 | 87 | 604 | 3.94E+07 | medium |
| Tripi | 3129 | 39 | 320 | 3.90E+07 | medium |
| Buccheri | 3035 | 34 | 371 | 3.83E+07 | medium |
| Campofranco | 621 | 55 | 1102 | 3.77E+07 | medium |
| Prizzi | 617 | 34 | 1740 | 3.65E+07 | medium |
| Racalmuto | 302 | 134 | 882 | 3.57E+07 | medium |
| Castelbuono | 1517 | 28 | 832 | 3.54E+07 | medium |
| Castelvetrano | 310 | 87 | 1303 | 3.51E+07 | medium |
| Altavilla Milicia | 651 | 29 | 1844 | 3.48E+07 | medium |
| Palazzolo Acreide | 1920 | 36 | 488 | 3.37E+07 | medium |
| Maletto | 2465 | 44 | 307 | 3.33E+07 | medium |
| Montallegro | 677 | 77 | 616 | 3.21E+07 | medium |
| Cerda | 757 | 16 | 2518 | 3.05E+07 | medium |
| San Piero Patti | 1692 | 30 | 596 | 3.02E+07 | medium |
| Zafferana Etnea | 2516 | 60 | 184 | 2.77E+07 | medium |
| Rodì Milici | 1892 | 44 | 332 | 2.76E+07 | medium |
| Gibellina | 383 | 77 | 901 | 2.66E+07 | medium |
| Petralia Soprana | 635 | 24 | 1729 | 2.64E+07 | medium |
| Pietraperzia | 1100 | 50 | 478 | 2.63E+07 | medium |
| Longi | 3220 | 15 | 538 | 2.60E+07 | medium |
| Mussomeli | 1593 | 22 | 738 | 2.59E+07 | medium |
| Godrano | 2529 | 22 | 441 | 2.45E+07 | medium |
| Castroreale | 3525 | 30 | 229 | 2.42E+07 | medium |
| San Biagio Platani | 501 | 61 | 791 | 2.42E+07 | medium |
| Vittoria | 750 | 74 | 428 | 2.37E+07 | medium |
| Acate | 894 | 46 | 572 | 2.35E+07 | medium |
| Cassaro | 597 | 36 | 1066 | 2.29E+07 | medium |
| Santa Lucia del Mela | 6012 | 21 | 181 | 2.29E+07 | medium |
| Assoro | 1054 | 39 | 554 | 2.28E+07 | medium |
| Giarratana | 899 | 47 | 511 | 2.16E+07 | medium |
| Castel di Lucio | 1387 | 9 | 1705 | 2.13E+07 | medium |
| Centuripe | 1816 | 16 | 732 | 2.13E+07 | medium |
| Mineo | 1967 | 23 | 447 | 2.02E+07 | medium |
| Casteldaccia | 500 | 26 | 1521 | 1.98E+07 | medium |
| Cerami | 2145 | 23 | 400 | 1.97E+07 | medium |
| Rometta | 1579 | 28 | 444 | 1.96E+07 | medium |
| Agira | 1188 | 31 | 525 | 1.93E+07 | medium |
| Sciara | 641 | 43 | 693 | 1.91E+07 | medium |
| Pettineo | 1258 | 14 | 1082 | 1.91E+07 | medium |
| Castellana Sicula | 762 | 25 | 976 | 1.86E+07 | medium |
| Trapani | 934 | 17 | 1170 | 1.86E+07 | medium |
| Militello Rosmarino | 1680 | 28 | 393 | 1.85E+07 | medium |
| Grotte | 300 | 103 | 592 | 1.83E+07 | medium |
| Augusta | 805 | 19 | 1172 | 1.79E+07 | medium |
| Alcara li Fusi | 4601 | 23 | 169 | 1.78E+07 | medium |
| Villafranca Tirrena | 687 | 36 | 660 | 1.63E+07 | medium |
| Francofonte | 1547 | 31 | 332 | 1.59E+07 | medium |
| Montelepre | 399 | 80 | 488 | 1.56E+07 | medium |
| Ventimiglia di Sicilia | 627 | 26 | 952 | 1.55E+07 | medium |
| Marineo | 353 | 63 | 695 | 1.55E+07 | medium |
| Alcamo | 615 | 25 | 995 | 1.53E+07 | medium |
| Ciminna | 385 | 62 | 614 | 1.47E+07 | medium |
| Santa Domenica Vittoria | 524 | 19 | 1402 | 1.40E+07 | medium |
| Fondachelli-Fantina | 2677 | 14 | 344 | 1.29E+07 | medium |
| Fiumedinisi | 2871 | 22 | 191 | 1.21E+07 | medium |
| Modica | 2533 | 19 | 242 | 1.16E+07 | medium |
| Mezzojuso | 786 | 27 | 539 | 1.14E+07 | medium |
| Priolo Gargallo | 1096 | 20 | 444 | 9.73E+06 | medium |
| Montagnareale | 795 | 24 | 455 | 8.68E+06 | medium |
| Santo Stefano di Camastra | 544 | 17 | 920 | 8.50E+06 | medium |
| Partinico | 619 | 38 | 358 | 8.41E+06 | medium |
| Comiso | 300 | 51 | 517 | 7.91E+06 | medium |
| Mascali | 494 | 56 | 285 | 7.88E+06 | medium |
| Cinisi | 661 | 28 | 418 | 7.74E+06 | medium |
| Sant'Angelo di Brolo | 601 | 39 | 309 | 7.24E+06 | medium |
| Piraino | 397 | 36 | 492 | 7.03E+06 | medium |
| Calatabiano | 289 | 57 | 423 | 6.97E+06 | medium |
| Novara di Sicilia | 3160 | 12 | 170 | 6.44E+06 | medium |
| Nissoria | 1318 | 15 | 324 | 6.41E+06 | medium |
| Castelmola | 122 | 73 | 715 | 6.37E+06 | medium |
| San Pier Niceto | 2667 | 9 | 263 | 6.30E+06 | medium |
| Aragona | 238 | 26 | 989 | 6.12E+06 | medium |
| San Michele di Ganzaria | 715 | 32 | 254 | 5.80E+06 | medium |
| Aliminusa | 381 | 16 | 898 | 5.47E+06 | medium |
| Alì | 879 | 34 | 177 | 5.29E+06 | medium |
| Bompietro | 462 | 16 | 694 | 5.13E+06 | medium |
| Saponara | 1980 | 19 | 134 | 5.03E+06 | medium |
| Maniace | 1129 | 29 | 141 | 4.63E+06 | medium |
| Bolognetta | 313 | 28 | 525 | 4.60E+06 | medium |
| Militello in Val di Catania | 1513 | 20 | 144 | 4.37E+06 | medium |
| San Giuseppe Jato | 341 | 29 | 434 | 4.29E+06 | medium |
| Resuttano | 761 | 14 | 392 | 4.17E+06 | medium |
| Alia | 91 | 42 | 1026 | 3.92E+06 | medium |
| Comitini | 196 | 55 | 362 | 3.90E+06 | medium |
| Palma di Montechiaro | 1215 | 20 | 157 | 3.81E+06 | medium |
| Piedimonte Etneo | 516 | 41 | 179 | 3.79E+06 | medium |
| Graniti | 403 | 26 | 359 | 3.76E+06 | medium |
| Lercara Friddi | 263 | 13 | 1099 | 3.76E+06 | medium |
| Mandanici | 421 | 20 | 440 | 3.71E+06 | medium |
| Gualtieri Sicaminò | 868 | 16 | 266 | 3.69E+06 | medium |
| Ravanusa | 151 | 47 | 477 | 3.38E+06 | medium |
| Roccapalumba | 133 | 27 | 935 | 3.36E+06 | medium |
| Alimena | 246 | 19 | 696 | 3.25E+06 | medium |
| Leonforte | 399 | 14 | 569 | 3.18E+06 | medium |
| Blufi | 394 | 15 | 534 | 3.15E+06 | medium |
| San Giovanni Gemini | 165 | 38 | 501 | 3.14E+06 | medium |
| Motta d'Affermo | 730 | 10 | 379 | 2.77E+06 | medium |
| Terrasini | 527 | 16 | 318 | 2.68E+06 | medium |
| Calamonaci | 33 | 78 | 1020 | 2.63E+06 | medium |
| Rosolini | 876 | 10 | 287 | 2.51E+06 | medium |
| Savoca | 219 | 30 | 383 | 2.51E+06 | medium |
| Frazzanò | 247 | 24 | 414 | 2.45E+06 | medium |
| Bagheria | 319 | 29 | 264 | 2.44E+06 | medium |
| Moio Alcantara | 285 | 15 | 565 | 2.42E+06 | medium |
| Gaggi | 235 | 20 | 484 | 2.28E+06 | medium |
| Salaparuta | 117 | 34 | 559 | 2.22E+06 | medium |
| Grammichele | 388 | 23 | 248 | 2.22E+06 | medium |
| Pagliara | 631 | 25 | 136 | 2.15E+06 | medium |
| Pedara | 705 | 17 | 166 | 1.99E+06 | medium |
| Librizzi | 629 | 25 | 125 | 1.96E+06 | medium |
| Furci Siculo | 751 | 15 | 174 | 1.96E+06 | medium |
| Villarosa | 1322 | 8 | 183 | 1.94E+06 | medium |
| Raccuja | 233 | 14 | 546 | 1.78E+06 | medium |
| Milo | 1059 | 16 | 96 | 1.62E+06 | medium |
| Scicli | 862 | 12 | 146 | 1.51E+06 | medium |
| Sant'Agata di Militello | 309 | 10 | 462 | 1.43E+06 | medium |
| Roccalumera | 321 | 30 | 146 | 1.41E+06 | medium |
| Campofiorito | 264 | 9 | 583 | 1.39E+06 | medium |
| Trabia | 388 | 19 | 178 | 1.31E+06 | medium |
| Forza d'Agrò | 353 | 25 | 147 | 1.30E+06 | medium |
| Marsala | 278 | 15 | 309 | 1.29E+06 | medium |
| Basicò | 459 | 13 | 206 | 1.23E+06 | medium |
| Baucina | 325 | 22 | 163 | 1.16E+06 | medium |
| Ispica | 793 | 9 | 157 | 1.12E+06 | medium |
| Santa Maria di Licodia | 147 | 59 | 126 | 1.10E+06 | medium |
| Trecastagni | 579 | 30 | 62 | 1.07E+06 | medium |
| Lascari | 124 | 16 | 532 | 1.06E+06 | medium |
| Monforte San Giorgio | 1361 | 9 | 86 | 1.05E+06 | medium |
| San Teodoro | 310 | 13 | 257 | 1.03E+06 | medium |
| San Salvatore di Fitalia | 385 | 16 | 168 | 1.03E+06 | medium |
| Campobello di Licata | 232 | 17 | 237 | 9.35E+05 | medium |
| Mazara del Vallo | 125 | 20 | 363 | 9.08E+05 | medium |
| Capaci | 129 | 32 | 214 | 8.82E+05 | medium |
| Reitano | 359 | 12 | 202 | 8.71E+05 | medium |
| Villafrati | 79 | 21 | 485 | 8.04E+05 | low |
| Sinagra | 97 | 22 | 372 | 7.94E+05 | low |
| Taormina | 57 | 31 | 437 | 7.72E+05 | low |
| Campofelice di Fitalia | 158 | 10 | 485 | 7.66E+05 | low |
| Gallodoro | 257 | 18 | 156 | 7.23E+05 | low |
| Lucca Sicula | 91 | 42 | 188 | 7.18E+05 | low |
| Gela | 1235 | 13 | 42 | 6.80E+05 | low |
| Condrò | 183 | 9 | 368 | 6.06E+05 | low |
| Spadafora | 154 | 14 | 281 | 6.06E+05 | low |
| Ficarra | 184 | 19 | 170 | 5.95E+05 | low |
| Lentini | 573 | 11 | 92 | 5.78E+05 | low |
| Roccavaldina | 463 | 5 | 236 | 5.46E+05 | low |
| Itala | 121 | 5 | 858 | 5.19E+05 | low |
| Riesi | 34 | 31 | 492 | 5.19E+05 | low |
| Valledolmo | 117 | 9 | 476 | 5.01E+05 | low |
| Giuliana | 204 | 16 | 152 | 4.97E+05 | low |
| Favara | 26 | 61 | 283 | 4.49E+05 | low |
| Oliveri | 242 | 4 | 445 | 4.31E+05 | low |
| Valderice | 165 | 14 | 160 | 3.69E+05 | low |
| San Cipirello | 132 | 9 | 288 | 3.42E+05 | low |
| Roccamena | 62 | 23 | 232 | 3.31E+05 | low |
| Ferla | 442 | 12 | 60 | 3.16E+05 | low |
| Santa Teresa di Riva | 151 | 23 | 91 | 3.15E+05 | low |
| Capo d'Orlando | 69 | 27 | 166 | 3.09E+05 | low |
| Partanna | 272 | 18 | 63 | 3.07E+05 | low |
| Nizza di Sicilia | 950 | 7 | 42 | 2.81E+05 | low |
| Malvagna | 476 | 7 | 84 | 2.80E+05 | low |
| Milena | 77 | 15 | 239 | 2.76E+05 | low |
| Floridia | 319 | 8 | 97 | 2.48E+05 | low |
| Canicattini Bagni | 235 | 11 | 94 | 2.42E+05 | low |
| Ucria | 199 | 14 | 78 | 2.16E+05 | low |
| Limina | 421 | 11 | 45 | 2.09E+05 | low |
| Castel di Iudica | 533 | 4 | 79 | 1.69E+05 | low |
| Camporeale | 34 | 15 | 322 | 1.64E+05 | low |
| San Fratello | 3348 | 2 | 23 | 1.57E+05 | low |
| Santa Elisabetta | 181 | 28 | 24 | 1.23E+05 | low |
| Acquaviva Platani | 442 | 6 | 43 | 1.13E+05 | low |
| Brolo | 301 | 10 | 37 | 1.12E+05 | low |
| Sant'Alfio | 1149 | 10 | 9 | 1.09E+05 | low |
| Vallelunga Pratameno | 49 | 5 | 439 | 1.08E+05 | low |
| Villalba | 305 | 5 | 69 | 1.05E+05 | low |
| Santa Caterina Villarmosa | 1066 | 6 | 15 | 9.50E+04 | low |
| Viagrande | 24 | 37 | 89 | 7.88E+04 | low |
| Porto Empedocle | 43 | 43 | 42 | 7.79E+04 | low |
| Floresta | 1693 | 4 | 9 | 5.95E+04 | low |
| Venetico | 139 | 6 | 71 | 5.91E+04 | low |
| Acireale | 149 | 6 | 60 | 5.32E+04 | low |
| Letojanni | 66 | 11 | 69 | 4.99E+04 | low |
| Mirto | 79 | 14 | 44 | 4.92E+04 | low |
| Solarino | 81 | 10 | 50 | 4.02E+04 | low |
| Aci Catena | 24 | 11 | 144 | 3.80E+04 | low |
| Vita | 97 | 7 | 54 | 3.66E+04 | low |
| Mazzarrà Sant'Andrea | 222 | 4 | 41 | 3.65E+04 | low |
| Isola delle Femmine | 60 | 6 | 92 | 3.31E+04 | low |
| Balestrate | 142 | 5 | 46 | 3.28E+04 | low |
| Serradifalco | 77 | 5 | 84 | 3.25E+04 | low |
| Roccafiorita | 51 | 9 | 65 | 2.97E+04 | low |
| Marianopoli | 156 | 6 | 30 | 2.81E+04 | low |
| Paternò | 85 | 10 | 32 | 2.74E+04 | low |
| Aci Castello | 37 | 11 | 52 | 2.13E+04 | low |
| Capri Leone | 128 | 6 | 28 | 2.11E+04 | low |
| Mirabella Imbaccari | 79 | 6 | 44 | 2.07E+04 | low |
| Sant'Alessio Siculo | 24 | 12 | 53 | 1.52E+04 | low |
| Pachino | 32 | 6 | 75 | 1.45E+04 | low |
| Falcone | 117 | 3 | 40 | 1.41E+04 | low |
| Santa Flavia | 47 | 8 | 34 | 1.26E+04 | low |
| Malfa | 576 | 3 | 5 | 7.98E+03 | low |
| Aci Sant'Antonio | 61 | 6 | 22 | 7.92E+03 | low |
| Torrenova | 10 | 13 | 60 | 7.86E+03 | low |
| Bompensiere | 23 | 4 | 57 | 5.23E+03 | low |
| Mascalucia | 45 | 9 | 12 | 4.99E+03 | low |
| Valdina | 37 | 3 | 35 | 3.89E+03 | low |
| Giarre | 2 | 15 | 94 | 2.81E+03 | low |
| Leni | 720 | 1 | 4 | 2.64E+03 | low |
| Palagonia | 185 | 3 | 4 | 2.46E+03 | low |
| Realmonte | 87 | 3 | 9 | 2.32E+03 | low |
| Santa Marina Salina | 758 | 1 | 2 | 1.77E+03 | low |
| Ramacca | 194 | 3 | 3 | 1.59E+03 | low |
| San Cono | 9 | 11 | 14 | 1.41E+03 | low |
| Alì Terme | 1 | 18 | 73 | 1.32E+03 | low |
| Favignana | 2101 | 1 | 1 | 1.24E+03 | low |
| Portopalo di Capo Passero | 38 | 1 | 25 | 9.41E+02 | low |
| Santa Croce Camerina | 63 | 1 | 13 | 8.17E+02 | low |
| Campofelice di Roccella | 2 | 6 | 66 | 7.97E+02 | low |
| Trappeto | 25 | 2 | 7 | 3.55E+02 | low |
| Raddusa | 68 | 1 | 5 | 3.37E+02 | low |
| Giardini-Naxos | 58 | 1 | 6 | 3.24E+02 | low |
| Pace del Mela | 30 | 2 | 5 | 3.13E+02 | low |
| Camporotondo Etneo | 182 | 1 | 1 | 2.66E+02 | low |
| Lampedusa e Linosa | 1056 | 1 | 0 | 6.34E+01 | low |
| Torregrotta | 1 | 4 | 7 | 2.82E+01 | low |
| Valguarnera Caropepe | 1 | 3 | 4 | 1.15E+01 | low |
| Aci Bonaccorsi | 0 | 0 | 0 | 0 | very low |
| Acquedolci | 0 | 1 | 64 | 0 | very low |
| Barrafranca | 0 | 10 | 151 | 0 | very low |
| Camastra | 49 | 0 | 0 | 0 | very low |
| Campobello di Mazara | 0 | 1 | 18 | 0 | very low |
| Canicattì | 60 | 0 | 0 | 0 | very low |
| Castell'Umberto | 0 | 40 | 213 | 0 | very low |
| Castrofilippo | 0 | 0 | 0 | 0 | very low |
| Catenanuova | 0 | 1 | 2 | 0 | very low |
| Cefalà Diana | 0 | 1 | 1 | 0 | very low |
| Delia | 0 | 1 | 3 | 0 | very low |
| Ficarazzi | 0 | 0 | 0 | 0 | very low |
| Fiumefreddo di Sicilia | 0 | 17 | 49 | 0 | very low |
| Furnari | 0 | 6 | 42 | 0 | very low |
| Gravina di Catania | 0 | 0 | 0 | 0 | very low |
| Joppolo Giancaxio | 0 | 1 | 32 | 0 | very low |
| Mazzarrone | 576 | 0 | 0 | 0 | very low |
| Merì | 0 | 3 | 4 | 0 | very low |
| Milazzo | 46 | 0 | 0 | 0 | very low |
| Misterbianco | 0 | 0 | 0 | 0 | very low |
| Montedoro | 0 | 0 | 0 | 0 | very low |
| Motta Sant'Anastasia | 0 | 2 | 73 | 0 | very low |
| Paceco | 0 | 1 | 0 | 0 | very low |
| Petrosino | 0 | 0 | 0 | 0 | very low |
| Pozzallo | 0 | 0 | 0 | 0 | very low |
| Raffadali | 0 | 5 | 9 | 0 | very low |
| Riposto | 0 | 3 | 45 | 0 | very low |
| San Filippo del Mela | 0 | 1 | 5 | 0 | very low |
| San Giovanni la Punta | 0 | 3 | 4 | 0 | very low |
| San Gregorio di Catania | 0 | 3 | 74 | 0 | very low |
| San Pietro Clarenza | 133 | 0 | 0 | 0 | very low |
| Sant'Agata li Battiati | 0 | 0 | 0 | 0 | very low |
| Santa Margherita di Belice | 0 | 58 | 262 | 0 | very low |
| Santa Venerina | 0 | 17 | 24 | 0 | very low |
| Scaletta Zanclea | 0 | 7 | 204 | 0 | very low |
| Scordia | 2 | 0 | 0 | 0 | very low |
| Terme Vigliatore | 0 | 11 | 35 | 0 | very low |
| Tremestieri Etneo | 0 | 7 | 28 | 0 | very low |
| Ustica | 295 | 0 | 0 | 0 | very low |
| Valverde | 0 | 1 | 51 | 0 | very low |
| Villabate | 0 | 4 | 121 | 0 | very low |
| Villafranca Sicula | 0 | 34 | 94 | 0 | very low |
References
- Ager, A. A.; Preisler, H. K.; Arca, B.; Spano, D.; Salis, M. Wildfire risk estimation in the Mediterranean area. Environmetrics 2014, 25(6), 384–396. [Google Scholar] [CrossRef]
- Assennato, F. “Le Forme Della Trasformazione Urbana”. In Proceedings of the conference Le Grandi Sfide Urbane: La Valutazione Ambientale Strategica Nella Pianificazione Urbanistica, Rome, 5 April 2016; 2016. [Google Scholar]
- Aven, T. Misconceptions of risk; Wiley, 2009. [Google Scholar] [CrossRef]
- Borisova, B.; Todorova, E.; Ihtimanski, I.; Glushkova, M.; Zhiyanski, M.; Georgieva, M.; Stoyanov, T.; Bozhilova, M.; Atanasova, M.; Dimitrov, S. Wildfire risk assessment and mapping – an approach for Natura 2000 forest sites. Trees For. People 2024, 16, 100532. [Google Scholar] [CrossRef]
- Chuvieco, E.; Aguado, I.; Yebra, M.; Nieto, H.; Salas, J.; Martín, M. P.; Vilar, L.; Martínez, J.; Martín, S.; Ibarra, P.; De La Riva, J.; Baeza, J.; Rodríguez, F.; Molina, J. R.; Herrera, M. A.; Zamora, R. Development of a framework for fire risk assessment using remote sensing and geographic information system technologies. Ecol. Model. 2009, 221(1), 46–58. [Google Scholar] [CrossRef]
- Del Hoyo, L. V.; Isabel, M. P. M.; Vega, F. J. M. Logistic regression models for human-caused wildfire risk estimation: analysing the effect of the spatial accuracy in fire occurrence data. Eur. J. For. Res. 2011, 130(6), 983–996. [Google Scholar] [CrossRef]
- Díaz-Avalos, C.; Juan, P. Modeling the spatial evolution wildfires using random spread process. Environmetrics 2022, 33(8). [Google Scholar] [CrossRef]
- Draper, N. R.; Smith, H. Applied Regression analysis, Third edition; John Wiley & Sons, 1998. [Google Scholar]
- Elhami-Khorasani, N.; Ebrahimian, H.; Buja, L.; Cutter, S. L.; Kosovic, B.; Lareau, N.; Meacham, B. J.; Rowell, E.; Taciroglu, E.; Thompson, M. P.; Watts, A. C. Conceptualizing a probabilistic risk and loss assessment framework for wildfires. Nat. Hazards 2022, 114(2), 1153–1169. [Google Scholar] [CrossRef]
- Fasino, M. “Boschi di Sicilia”. Regione Siciliana – Assessorato Agricoltura e Foreste; Ed. La cartografica: Palermo, Italy, 1967. [Google Scholar]
- Finney, M. A. The challenge of quantitative risk analysis for wildland fire. For. Ecol. Manag. 2005, 211(1–2), 97–108. [Google Scholar] [CrossRef]
- Garofalo, S.; Paladino, A. “Potenzialità selvicolturali delle aree agricole marginali in Sicilia. Parte I. Il Ruolo del patrimonio arboricolo attuale e vocazione delle aree marginali”. Atti del II Congresso Nazionale di selvicoltura, Giornata preparatoria, Palermo, 2 maggio 1998; 1998. [Google Scholar]
- Giunta, M.; Finocchiaro, G. Statistiche ambientali per le politiche di coesione 2014-2020. In Relazione tecnico-scientifica; Italian Institute for Environmental Protection and Research, 2023. [Google Scholar]
- Leone, V. “Dinamica del fenomeno e sua analisi statistica”. In Regione Puglia. Assessorato all’agricoltura, foreste e pesca nelle acque interne. Servizio Forestale. Rapporto conoscitivo sugli incendi boschivi in Puglia.; Edizioni Bastogi, 1983. [Google Scholar]
- Militino, A. F.; Goyena, H.; Pérez-Goya, U.; Ugarte, M. D. Logistic regression versus XGBoost for detecting burned areas using satellite images. Environ. Ecol. Stat. 2024, 31(1), 57–77. [Google Scholar] [CrossRef]
- Munafò, M.; Assennato, F.; Congedo, L.; Luti, T.; Marinosci, I.; Monti, G.; Riitano, N.; Sallustio, L.; Strollo, A.; Tombolini, I.; Marchetti, M. Il consumo di suolo in Italia - Edizione 2015. ISPRA, Rapporti 218/2015. 2015. Available online: https://www.isprambiente.gov.it/it/pubblicazioni/rapporti/il-consumo-di-suolo-in-italia-edizione-2015.
- Oliveira, S.; Rocha, J.; Sá, A. Wildfire risk modeling. Curr. Opin. Environ. Sci. Health 2021, 23, 100274. [Google Scholar] [CrossRef]
- Oom, D.; de Rigo, D.; Pfeiffer, H.; Branco, A.; Ferrari, D.; Grecchi, R.; Artés-Vivancos, T.; Houston Durrant, T.; Boca, R.; Maianti, P.; Libertá, G.; San-Miguel-Ayanz, J. Pan-European wildfire risk assessment. In EUR 31160 EN; Publications Office of the European Union: Luxembourg, 2022; ISBN 978-92-76-55137-9. [Google Scholar]
- Salis, M.; Arca, B.; Del Giudice, L.; Palaiologou, P. Application of simulation modeling for wildfire exposure and transmission assessment in Sardinia, Italy [Internet]. Int. J. Disaster Risk Reduct. Available from. Vol. 58, 102189. [CrossRef]
- Thompson, M. P.; Calkin, D. E.; Finney, M. A.; Ager, A. A.; Gilbertson-Day, J. W. Integrated national-scale assessment of wildfire risk to human and ecological values. Stoch. Environ. Res. Risk Assess. 2011, 25(6), 761–780. [Google Scholar] [CrossRef]
- Toledo-Jaime, C.; Díaz-Avalos, C.; Chaudhuri, S.; Serra, L.; Juan, P. Understanding wildfire occurrence and size in Jalisco, Mexico: A spatio-temporal analysis. For. Ecol. Manag. 2024, 573, 122349. [Google Scholar] [CrossRef]
- Xi, D. D.; Dean, C.; Taylor, S. W. Modeling the duration and size of extended attack wildfires as dependent outcomes. Environmetrics 2020, 31(5). [Google Scholar] [CrossRef]
- Xi, D. D.; Taylor, S. W.; Woolford, D. G.; Dean, C. Statistical models of key components of wildfire risk. Annu. Rev. Stat. Its Appl. 2018, 6(1), 197–222. [Google Scholar] [CrossRef]
- Xu, Z.; Li, J.; Cheng, S.; Rui, X.; Zhao, Y. Wildfire Risk Prediction: A survey of recent advances using deep learning techniques. arXiv 2024, arXiv:2405.01607. [Google Scholar]
- 25.Websites.
- ISPRA. CORINE project. 2018. Available online: https://groupware.sinanet.isprambiente.it/uso-copertura-e-consumo-di-suolo/library/copertura-del-suolo/corine-land-cover/clc2018_shapefile.
- ISTAT. Boundaries of administrative units for statistical purposes. 2011. Available online: https://www.istat.it/storage/cartografia/confini_amministrativi/generalizzati/Limiti01012020_g.zip.
- ISTAT. Population and Housing Census Data Warehouse. 2011. Available online: http://dati-censimentopopolazione.istat.it/Index.aspx.
- ISPRA. Scientific report “Statistiche ambientali per le politiche di coesione 2014-2020”. 2023. Available online: https://indicatoriambientali.isprambiente.it/it/pon/linea-2-linea-3/indice-di-frammentazione.
- QGIS software. Available online: www.qgis.org.
- SIF. Forest Information System of the Sicilian region. 2025. Available online: https://sif.regione.sicilia.it/ilportale/.
Figure 1.
Time series analyses of the 2010-2023 forest fires for the whole Sicilian region. (a) bubble plot of total number of fires and total burned area; (b) monthly distribution of fires; (c) weekly distribution of fires; (d) distribution of fires by day of the week.
Figure 1.
Time series analyses of the 2010-2023 forest fires for the whole Sicilian region. (a) bubble plot of total number of fires and total burned area; (b) monthly distribution of fires; (c) weekly distribution of fires; (d) distribution of fires by day of the week.
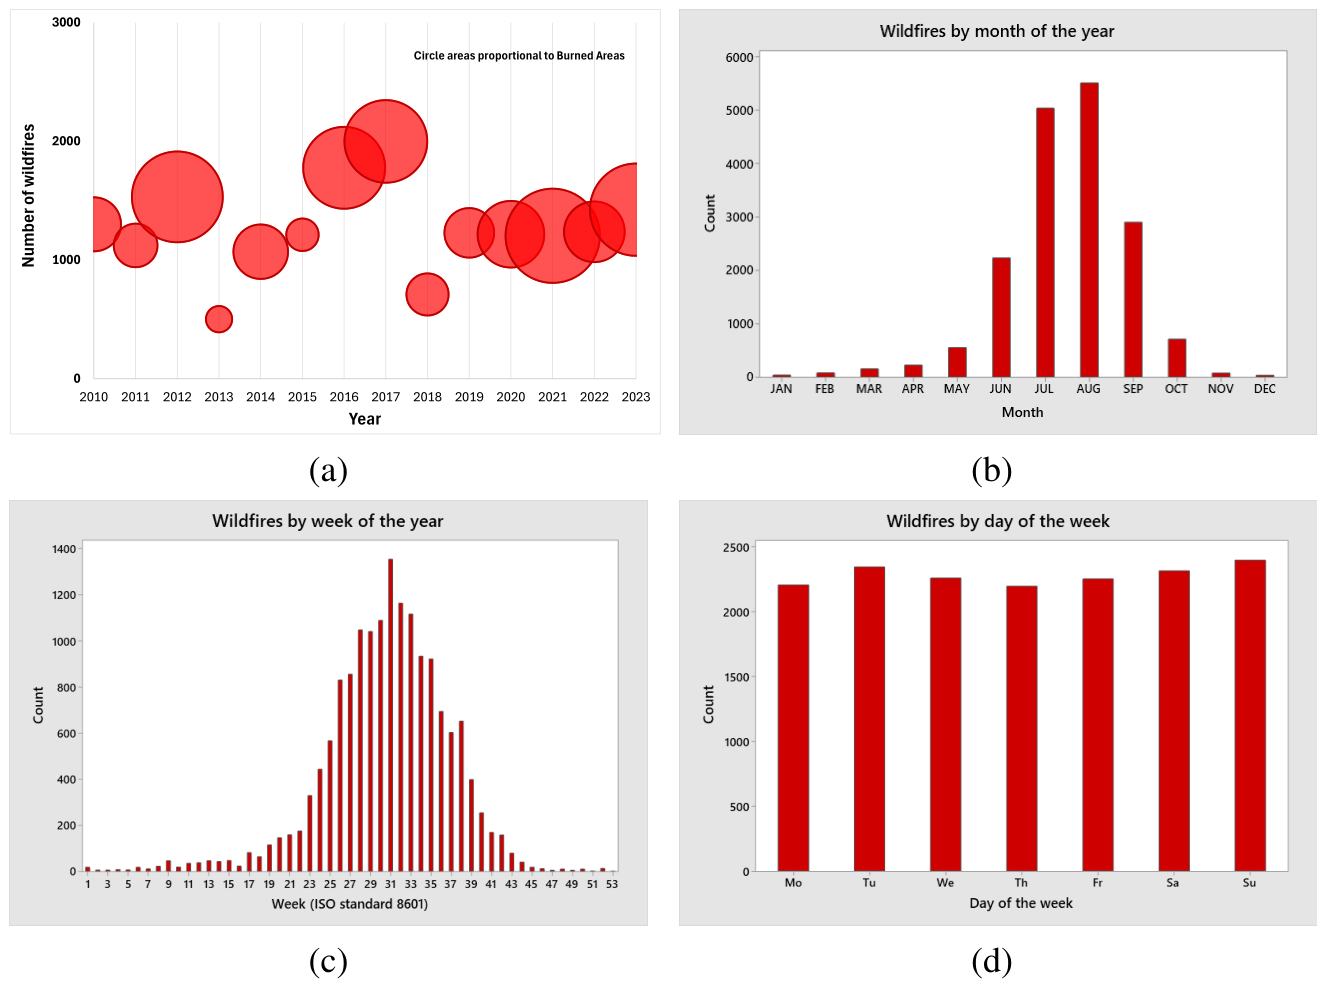
Figure 2.
For the 390 Sicilian municipalities over time period 2010-2023, empirical distributions of: (a) NF, (b) BA, (c) FA, (d) Risk (defined in Section 2.3).
Figure 2.
For the 390 Sicilian municipalities over time period 2010-2023, empirical distributions of: (a) NF, (b) BA, (c) FA, (d) Risk (defined in Section 2.3).
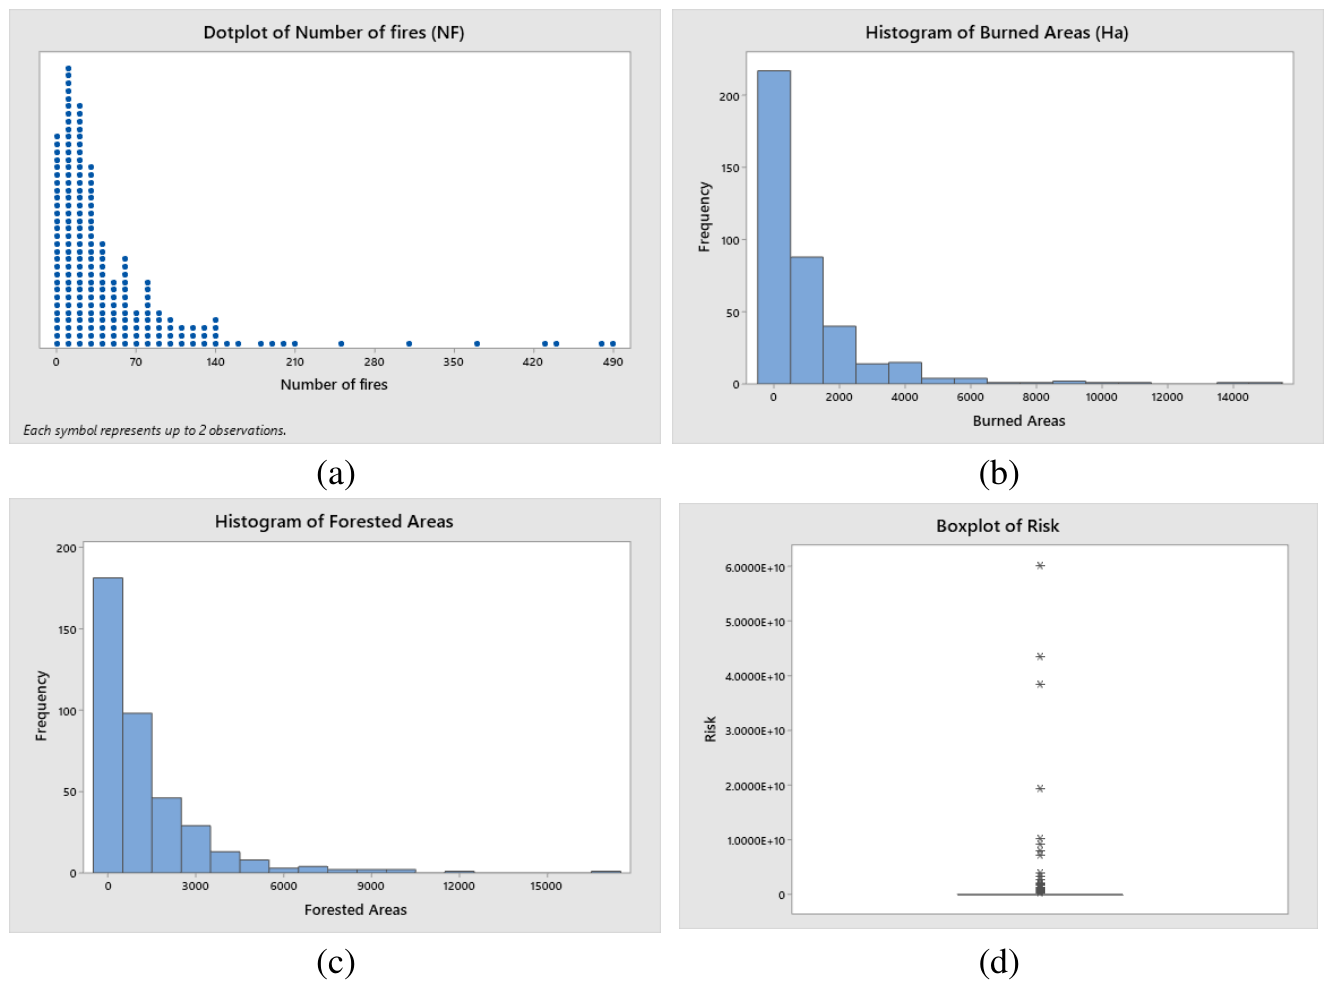
Figure 3.
Map of fire risk levels for the 390 municipalities of the Sicily region.
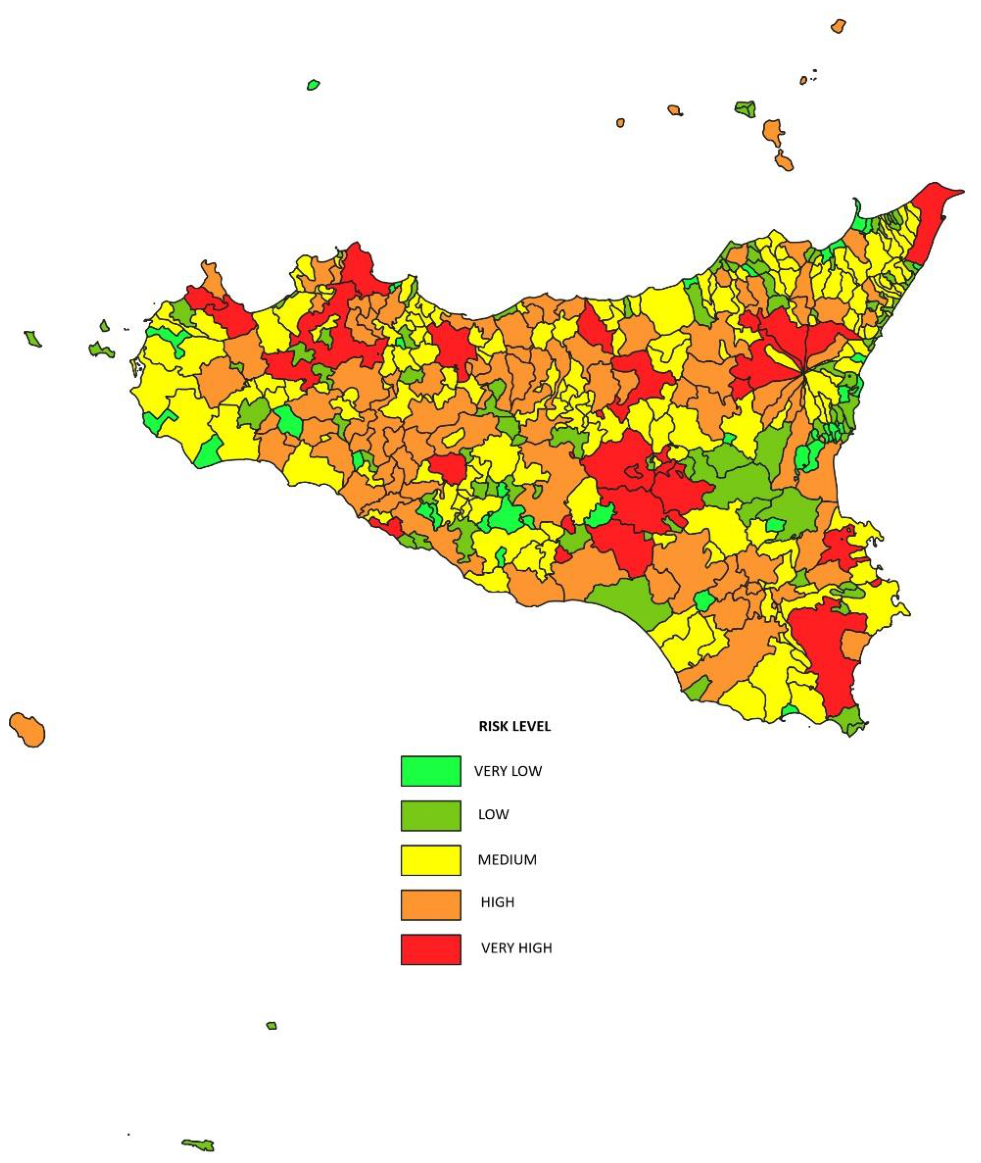

Table 1.
Observed and expected counts for non-parametric
(chi-square) test on forest fire frequencies by day of the week (null hypothesis H0 corresponding to even distribution).
Table 1.
Observed and expected counts for non-parametric
(chi-square) test on forest fire frequencies by day of the week (null hypothesis H0 corresponding to even distribution).
| Day | Observed frequencies | Expected frequencies |
Chi-Square contribution |
| Monday | 2204 | 2279.14 | 2.48 |
| Tuesday | 2342 | 2279.14 | 1.73 |
| Wednesday | 2257 | 2279.14 | 0.22 |
| Thursday | 2194 | 2279.14 | 3.18 |
| Friday | 2250 | 2279.14 | 0.37 |
| Saturday | 2312 | 2279.14 | 0.47 |
| Sunday | 2395 | 2279.14 | 5.89 |
Table 2.
Regression summary results.
| Term | Coefficient | p-value |
| Constant | 2.76E+00 | <0.001 |
| Factor A | 2.90E-05 | <0.001 |
| Factor B | 4.72E-04 | <0.001 |
| Factor C | 3.48E-04 | <0.001 |
| Factor D | -2.31E-03 | 0.139 |
| Factor E | 1.00E-02 | 0.971 |
| Factor F | -5.80E-04 | 0.833 |
| Factor G | 5.00E-05 | 0.984 |
| Factor H | -3.43E-04 | 0.298 |
| Factor J | -2.14E-03 | 0.004 |
Disclaimer/Publisher’s Note: The statements, opinions and data contained in all publications are solely those of the individual author(s) and contributor(s) and not of MDPI and/or the editor(s). MDPI and/or the editor(s) disclaim responsibility for any injury to people or property resulting from any ideas, methods, instructions or products referred to in the content. |
© 2026 by the authors. Licensee MDPI, Basel, Switzerland. This article is an open access article distributed under the terms and conditions of the Creative Commons Attribution (CC BY) license.
Copyright: This open access article is published under a Creative Commons CC BY 4.0 license, which permit the free download, distribution, and reuse, provided that the author and preprint are cited in any reuse.


