
Submitted:
09 July 2026
Posted:
13 July 2026
You are already at the latest version
Abstract
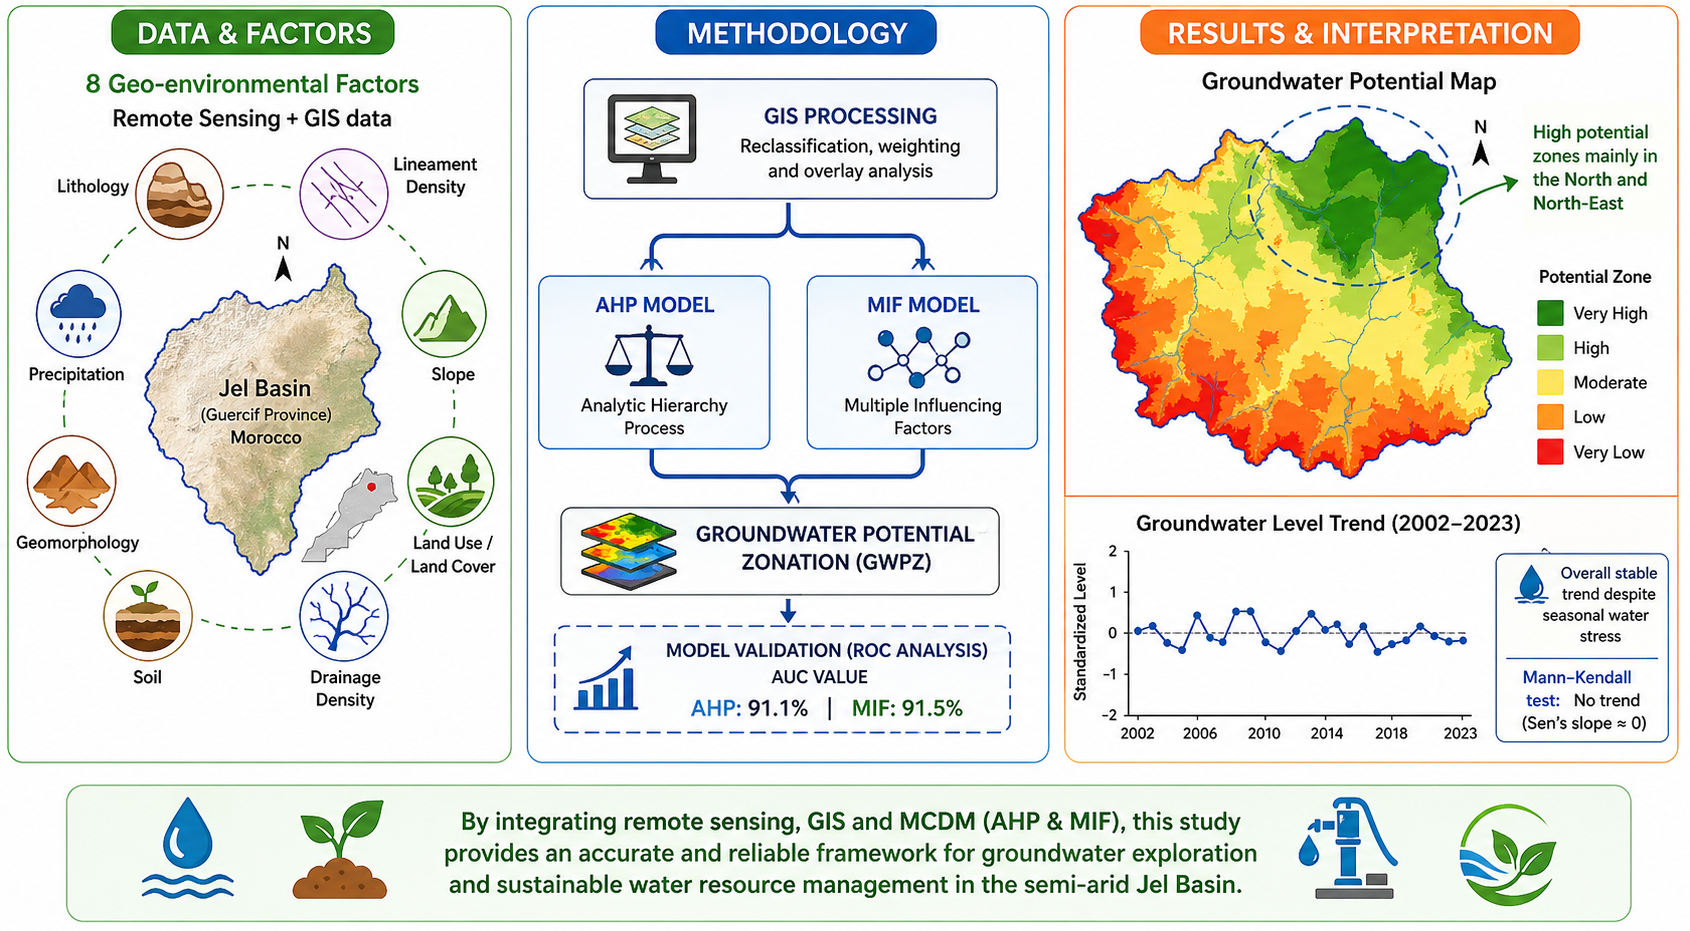
In the semi-arid Jel Basin (Guercif Province, Morocco), declining surface water resources highlight the need for effective groundwater assessment to sustain agricultural activities. This study applies an integrated approach combining remote sensing, Geographic Information Systems (GIS), and two multi-criteria decision-making methods Analytic Hierarchy Process (AHP) and Multiple Influencing Factors (MIF) to map groundwater potential zones (GWPZ) in the Plaine Jel aquifer. Eight geo-environmental factors were considered, including lithology, lineament density, slope, land use/land cover, drainage density, soil, geomorphology, and precipitation.
The results reveal a heterogeneous distribution of groundwater potential, with high-yield zones mainly located in the northern and northeastern areas, where favorable geological and structural conditions enhance infiltration. Model validation using ROC analysis demonstrated high accuracy, with AUC values of 91.1% (AHP) and 91.5% (MIF). Additionally, Mann-Kendall and Sen’s slope tests (2002–2023) indicate an overall stable trend in groundwater levels, despite seasonal water stress.
By integrating spatial mapping with temporal trend analysis, this study provides a reliable framework for groundwater exploration and sustainable water resource management in the Jel Basin.
Keywords:
Jel basin
; groundwater
; GIS
; analytic hierarchy process (AHP)
; multiple influence factor method (MIF)
; receiver operating characteristic (ROC) analysis
; Mann-Kendall
1. Introduction
The world’s oceans and seas serve as the primary reservoirs of water, a substance capable of transitioning between liquid, solid, and gaseous states [1]. Due to the high salinity of seawater, it remains unsuitable for direct consumption, which is why drinking water supplies depend heavily on surface and groundwater [2]. Aquifers provide nearly 26% of the planet’s total renewable freshwater resources [3]. This concentration in the oceans restricts the freshwater share to only 2.8% [4], Within this small fraction, surface water represents 2.2%, while groundwater accounts for the remaining 0.6% [5,6]. In the province of Jel, groundwater is the fundamental resource for human survival and economic activities, providing nearly 80% of the rural drinking water supply and meeting half of the urban demand. Furthermore, these resources satisfy over 50% of the national agricultural sector’s requirements [7].
The pressure on the Jel Basin’s aquifers is escalating due to the combined effects of population growth and economic development, even as available reserves decline [8].
The basin is critically dependent on its groundwater [9]. which 95% of domestic needs and 70% of agricultural demand [10]. In the northern part of the Jel basin, water scarcity has become a primary constraint on agricultural productivity and development [11]. In recent decades, extracting water via steep-sided ravines has been the preferred strategy for maintaining distribution in the Jel plain [12]. However, the region is currently experiencing acute water stress, primarily driven by intensified groundwater withdrawal [13].
In response to such challenges, scientific research on identifying and evaluating Groundwater Potential Zones (GWPZ) has seen significant progress [3]. Traditionally, groundwater exploration relied on localized and expensive geophysical methods [14]. However, recent advancements have shifted toward the integration of Remote Sensing (RS) and Geographic Information Systems (GIS) [15]. Modern methodologies now emphasize multi-criteria decision-making (MCDM) approaches, which allow for the simultaneous analysis of various thematic layers such as lithology, slope, land use, and drainage density [16]. This evolution in research enables a more accurate, cost-effective, and large-scale assessment of aquifer potential, providing essential data for sustainable water management [17].
This study aims to map aquifer potential areas within the Jel basin using this modern methodological approach, based on satellite imagery and the application of AHP (Analytic Hierarchy Process) and MIF (Multi-Influence Factor) models integrated into a GIS [18]. Despite the presence of surface water in the Jel plain district [19], the population remains heavily reliant on aquifers for daily household tasks and irrigation [20]. the Jel aquifer has been declining rapidly due to climate change, which disrupts the natural infiltration and renewal of groundwater [21]. Rainfall in the region is scarce and irregular, occurring only during a short season and leaving a water deficit for most of the year [22]. Consequently, farmers in this agricultural region prioritize pumping large quantities of groundwater for their crops over using surface water [23]. This excessive use, where withdrawals exceed natural replenishment, leads to a drop in the piezometric level and threatens the sustainability of the resource [24]. Unregulated management may result not only in the depletion of the aquifer but also in the degradation of its physical and chemical properties [25]. Therefore, rational governance is imperative to ensure the preservation and monitoring of this strategic resource [26] While many studies rely on single-model GIS assessments, this research introduces a more robust approach by cross-validating AHP and MIF models [15]. Furthermore, it integrates a long-term piezometric stability analysis, providing a dynamic perspective often missing in conventional groundwater potentiality studies [27]. Achieving this requires a rigorous quantification of stocks by delineating high-potential aquifer zones [28]. To date, research evaluating aquifer potential in this specific area remains limited [29].
2. Presentation of the Study Area
2.1. Geographical Location of the Study Area
The Jel basin is bounded by the Middle Atlas to the southwest (55000 km2 in area). The Debdou chain to the southeast, and the Beni-Bou-Yahi - Beni-Snassène chain to the north [30]. It is situated between the west-east corridors of Taza and Taourirt [20] and between the south-north corridors of Average and Basse-Moulouya [7]. This region constitutes, in many respects, a transition zone. It is cut in two by the Moulouya wadi, which receives water on the left bank. The wadis Melloulou and Msoun [31]. originating respectively from the Middle Atlas and the Rif. It can be divided into four plains: in the center and to the west. The plain of Jel, with an area of 650 km2 [32] and an average altitude of 350 m, lies to the east. The Tafrata plain (500 km2 in area and 500 m in average altitude) [16]; to the north, the Sangal plain (200 km2; 300 m); to the south. The plain of Mahrouf (150 km2; 700 m) [22]. The climate zone affects air conditioning and the Atlantic gateway (which modifies the flow and promotes a stable atmospheric environment) [11]. Geomorphologically. The Jel basin consists of a Pliocene-Villafranchian surface covered in the center by a more recent filling [33]. The study area is shown in Figure 1.
2.2. Geology
The Jel Basin, located at the crossroads of the Middle Atlas, the Rif, and the eastern Meseta, has a complex geological structure marked by faults inherited from the Variscan period (NE-SW, E-W, NW-SE) and reactivated by Atlas-Alpine tectonics [34]. Its evolution is characterized by a major Neogene subsidence phase linked to the establishment of the Rif nappes, followed by a Pliocene-Quaternary compressive regime that reactivated inversion structures and led to the formation of salt domes [35]. In paleogeographic terms, intense tectonic activity led to an early narrowing of the Rif marine corridor during the Messinian, triggering the Messinian salinity crisis before the transition to continental sedimentation [36]. This dynamic context also favored, in the north, the Saka volcanism in the Pliocene-Quaternary [37], which manifests itself in a magmatic sequence beginning with altered basalts, followed by orthoclase-rich trachytic flows, and ending with healthy basalts with columnar flow [38], the whole being closely structured by regional faults and thrust movements [39].
2.3. Hydrogeology
The unconfined aquifer consists of Quaternary alluvial deposits (silt, sand, conglomerates) [40], resting on impermeable Miocene marls. Its hydraulic conductivity ranges from 1×10⁻⁶ to 1×10⁻⁴ m/s [41]. The depth of the water table ranges from 40 to 60 meters [4]. This groundwater resource supports the irrigation of approximately 17,358 hectares [21]. Annual withdrawals are estimated at 52.3 million cubic meters for agriculture and 2.1 million cubic meters for drinking water supply [32].
3. Materials and Methods
3.1. Data Sets
In the Jel basin, underground flow vectors are driven by a synergy between structural discontinuities (lithology, fracturing, drainage) and morpho-pedological parameters, thereby defining the hydrogeological behavior of the environment [27]. The hydrodynamics of this area result from dual controls: structural and morpho-pedological for flow circulation, and climatic and anthropogenic (land-use) for recharge processes [42]. To identify areas of high aquifer productivity, the analysis must integrate structural discontinuities and pedological features, while weighing the effects of vegetation cover and rainfall on infiltration rates [17]. Nine geo-environmental criteria were used, including geology, geomorphology, slope, drainage and lineament densities, land use (LULC), precipitation, soil, and distance from rivers [43].
The weighting of these parameters is based on a hybrid decision-making approach, combining two multi-criteria decision-making (MCDM) models to ensure a more robust ranking and minimize uncertainties related to weight allocation [44]: The weighting coefficients were determined by combining two multi-criteria analysis protocols: the Analytic Hierarchy Process (AHP), based on pairwise comparison, and the Multiple Influence Factors (MIF) method. This methodological combination aims to minimize the subjectivity inherent in expert opinion and increase the stability of the weights assigned to each variable [40]. The thematic variables, compiled from multiple data sources (Table 1), were homogenized using a rasterization procedure [45]. A sampling step of 12.5 m was applied to the entire dataset to ensure the geometric consistency required for weighted overlay analysis [46].
At the same time, the interannual dynamics of groundwater levels over the period 2002-2020 were characterized through analysis of piezometric records provided by the Moulouya River Basin Agency (ABHM) [47]. To ensure the completeness of the piezometric records, gaps in the data were filled by integrating data from nearby stations [48]. This protocol enabled the consolidation of a network of 20 monitoring points, whose spatial distribution provides representative coverage of the entire Jel basin (Figure 14b).
3.2. Methodologies
The assessment of groundwater potential is based on a four-part methodological protocol, carried out in a GIS environment [17]. This approach enabled transforming heterogeneous variables into consistent spatial indicators through four successive processing steps [49].
The preliminary stage involved compiling and integrating a multi-source dataset in a GIS environment, which formed the analytical basis for the hydrogeological assessment [50].
The subsequent phase was dedicated to determining the weighting coefficients for each thematic layer [51]. To increase the robustness of the decision-making process, we opted for a hybrid approach combining the Analytic Hierarchy Process (AHP) and the Multiple Influencing Factors (MIF) method [52].
During the third phase, these weightings were aggregated using a weighted overlay protocol in a GIS environment, resulting in the final spatialization of the hydrogeological potential [53]. Finally, the model’s reliability and accuracy were rigorously tested by analyzing the ROC (Receiver Operating Characteristic) curve, as shown in Figure 2 [54].
Figure 1.
The methodological flowchart for this study.
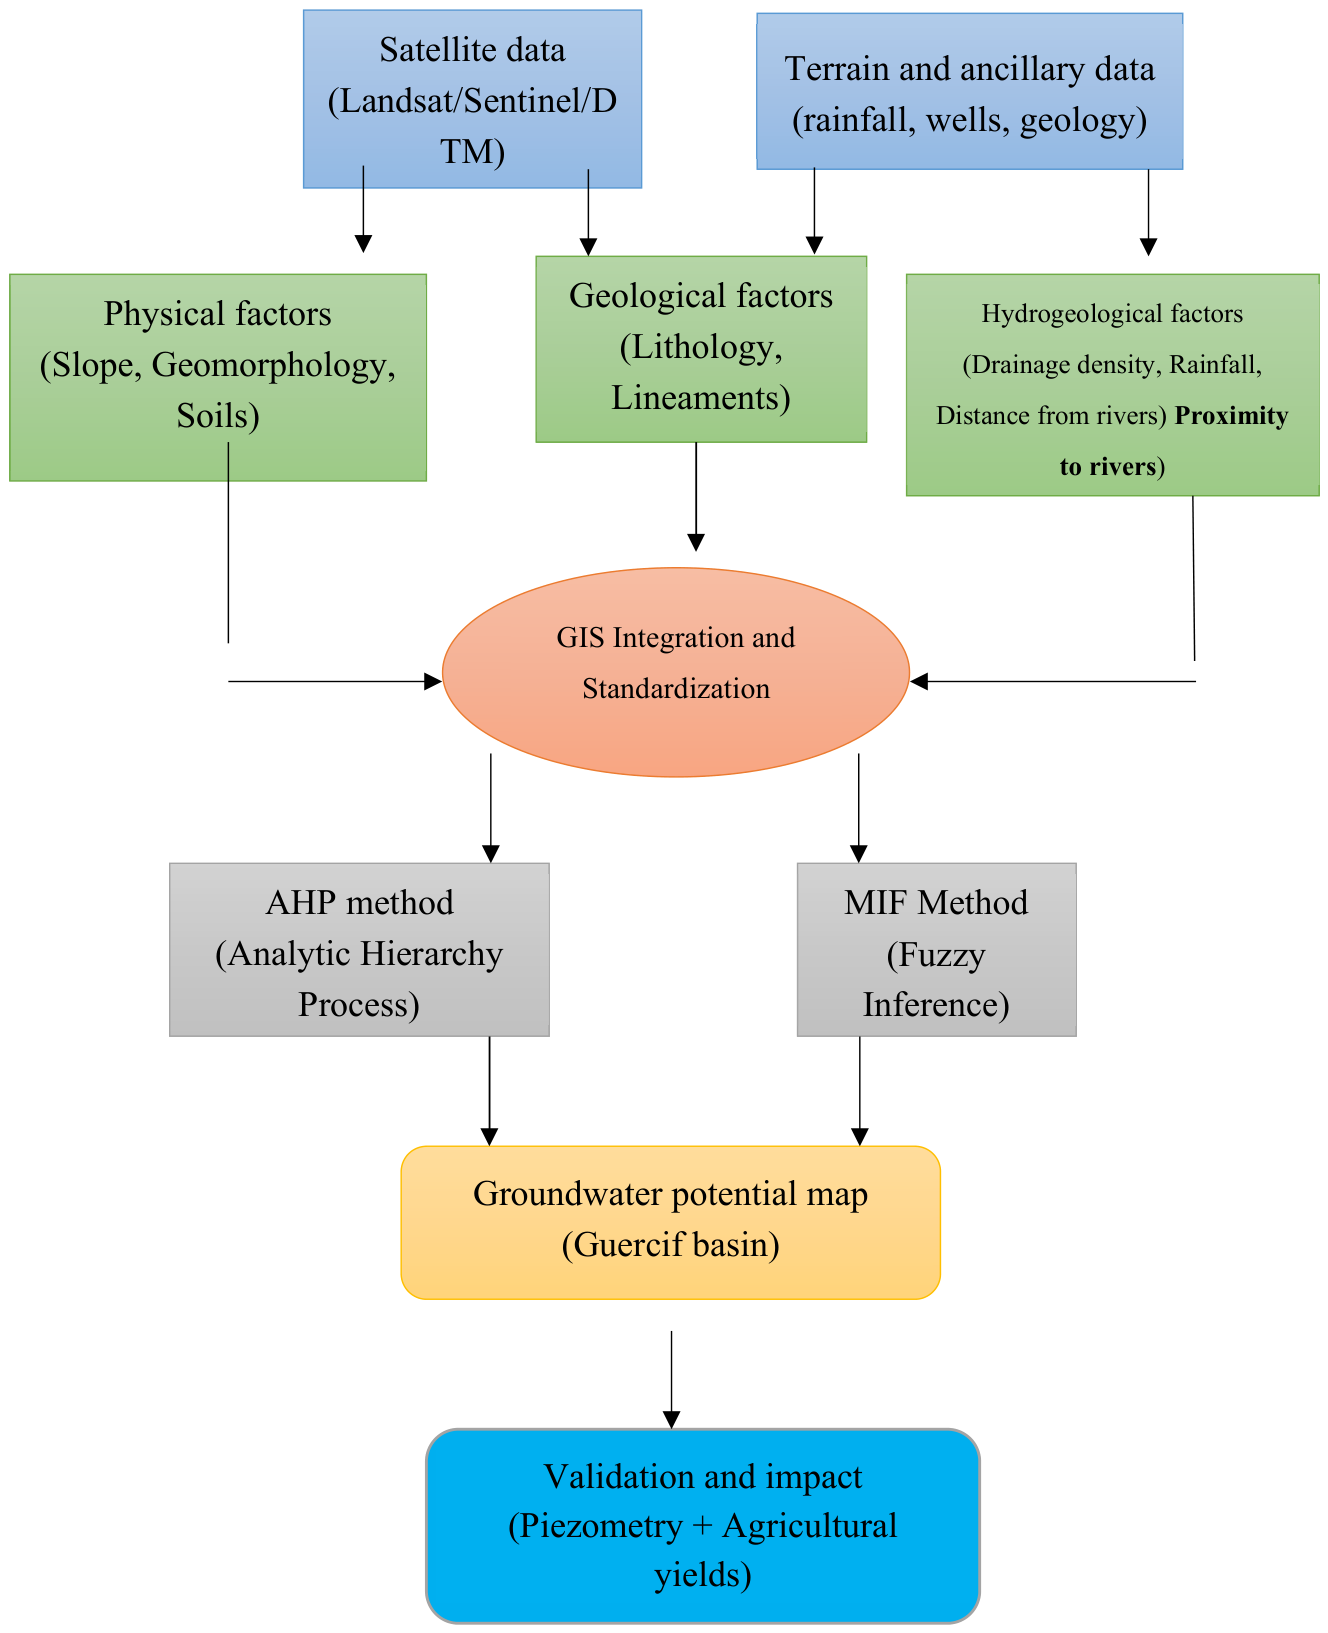
At the same time, the temporal dynamics of the aquifers were put into perspective by zoning potentiality to corroborate the consistency between the observed piezometric fluctuations and the modeled aquifer potential [21]. The piezometric behavior within the Jel plain sector was characterized by assessing the direction and magnitude of trends over the period 2002-2023 (West Guercif) [11]. The significance of the observed trends was tested using the non-parametric Mann-Kendall test [55]. This methodological choice guarantees robust detection of monotonic changes, freeing itself from constraints related to data distribution and sensitivity to extreme values [56], in conjunction with Sen’s slope estimator, a robust approach for defining the rate of change of the piezometric signal while overcoming the influence of extreme data [57], these protocols were implemented on annual records from a network of piezometric monitoring stations, ensuring a representative analysis of the reservoir’s dynamics at the local scale [58]. The Figure 2 shows the methodology used.
3.2.1. Analytic Hierarchy Process (AHP)
The Analytic Hierarchy Process (AHP) provides a rigorous formalization framework for solving multidimensional decision-making problems, allowing complex issues to be broken down into a coherent hierarchical structure [59]. In this investigation, this method was used to quantify the relative weights of each geo-environmental descriptor and rank their contributions to the occurrence of groundwater resources [50]. The operational application of the AHP was conducted using a four-part approach, ensuring a structured breakdown of the decision-making process (Table 2):
● Structuring the decision hierarchy: The model is organized according to a multi-level progression, placing the estimation of water potential as the highest point of convergence for all analysis variables [60]. Under the top-level objective, the lower-level groups group key geo-environmental descriptors (lithology, slope, fracturing, etc.), thereby forming the basis for the multi-criteria analysis [4].
● Construction of the pairwise comparison matrix: Interactions between criteria are formalized within a square matrix of dimension (n*n). Each parameter is systematically compared with the others according to Saaty’s fundamental scale, graded from 1 (equivalent influence) to 9 (absolute dominance) [25].
● Calculation of priority vectors: This phase is based on the standardization of the judgment matrix; each value is reported to the cumulative total of its respective column [27]. This process generates a normalized matrix from which the specific weight of each variable is extracted [41]. The principal eigenvector (W) is obtained by averaging the normalized matrix’s horizontal components, thereby determining the final weighting coefficients for each geo-environmental descriptor [24].
● Consistency check: To verify the rationality of pairwise comparisons and rule out any inconsistency bias in subjective judgments, the robustness of the matrix is checked by calculating the Consistency Ratio (CR) [55]. This quality control is based on the following mathematical formalism [2]:
CI = (λmax - n) / (n - 1) (1)
Where :
● CI : Consistency Index.
● λmax: The maximum eigenvalue of the matrix.
● n : The number of criteria (the size of the matrix).
3.2.2. Multi-Influential Factors Method (MIF)
Unlike the hierarchical approach of AHP, the Multiple Influencing Factors (MIF) technique is based on a systemic analysis of interactions and mutual feedback between geo-environmental descriptors [61]. This approach is based on the paradigm that no descriptor can be understood in isolation; each variable is part of a complex network of mutual feedback and influences that govern the overall balance of the hydro-system [27].
The operationalization of this methodological framework is structured around a three-part analytical process:
1. Characterization of interrelationships: This phase consists of comprehensively identifying causal links; for each descriptor, the nature and scope of the influences exerted on the other components of the system must be defined [62].
• The quantification of interactions is based on binary weighting: a unit score (1.0) is assigned to major influences [46].
• While a value of 0.5 is assigned to secondary or indirect interactions [60].
2. Determination of the total influence index: The weight of each parameter is derived from the sum of the coefficients of 1.0 and 0.5 associated with its respective interactions. This integration enables quantifying the total influence of a factor within the hydrogeological architecture [26].
3. Assignment of relative weights: Normalization and calculation of relative weights: The final step consists of deriving the specific weight of each variable by relating its cumulative score to the overall sum of the influence indices, according to the protocol established by [32]. This standardization process is governed by the following analytical expression:
Wi = (Si / ∑S) * 100 (2)
Where :
Wi : The weight of criterion i as a percentage.
Si : The score or value of criterion i
∑S : The score or value of criterion i
3.2.3. GIS Integration and Weighted Overlay Analysis
The final stage of modeling involves the cartographic synthesis of geo-environmental descriptors [63]. This integration is performed using a weighted overlay analysis protocol, in which each variable is modulated by importance coefficients previously calibrated using AHP and MIF (Weighted Overlay Analysis) in the ArcGIS environment [32].
This procedure consists of two main steps (Table 4):
Reclassification: Standardization and discretization of variables: Each geo-environmental descriptor (e.g., lithological setting or slope gradients) is segmented into discrete homogeneous classes [38]. The objective of this transformation is to establish commensurability between descriptors of different types. By translating continuous and qualitative data into a dimensionless scale of values, this process enables direct comparison and spatial aggregation [2]. A potentiality score (Ri) is assigned to each thematic class, reflecting its respective contribution to groundwater infiltration and recharge mechanisms [39]. For example, areas with low slopes are ranked highly because they promote slow infiltration, while steep topographic gradients, which are conducive to surface runoff, are assigned the lowest scores [52].
Weighted aggregation: Multi-criteria integration and derivation of the GWPI: The re-indexed descriptors are aggregated using a weighted overlay algorithm [40]. The operation consists of pixel-by-pixel integration, in which the importance of each factor is modulated by its normalized weight (Wi), thereby generating a continuous predictive model of hydrogeological potential (GWPI) at the basin scale [64]. The calculation is performed using the following formula:
GWPI = (W1 * R1) + (W2 * R2) + ... + (Wn * Rn) = ∑(Wi*Ri) (3)
Where :
GWPI : is the Groundwater Potential Index.
Wi : is the normalized weight of factor i (derived from AHP or MIF).
Ri : is the rank of the subclass of factor i.
3.2.4. Validation of This Study Using ROC Analysis
The accuracy of the zoning resulting from the AHP and MIF approaches was rigorously validated using ROC curve analysis [40]. The use of this indicator on a GIS platform ensures an objective assessment of the model’s reliability and consistency with on-the-ground realities [53]. The Area Under the Curve (AUC) was determined quantitatively using the mathematical formalism presented below [65]. As for the development of ROC curves [47], the validation space is defined by the cumulative spatial fraction on the x-axis and the cumulative proportion of catchment structures on the y-axis [66]. The predictive effectiveness of the model is represented by the success curve (shown in red on the graph), which illustrates the fit between the calculated probabilities and the actual occurrences [67].
AUC = Σ(TP + TN) / Σ(P + N) (4)
Where:
AUC: Area under the curve, quantifying the overall accuracy of the predictive signal;
TP (True Positives): Pixels or spatial units whose high potential is confirmed by the actual presence of a catchment structure;
TN (True Negatives): Areas of low potentiality whose barren nature corresponds to the absence of resources;
P et N: Respectively, the total number of positive (presence) and negative (absence) control samples.
3.2.5. Mann-Kendall Test and Sen Slope at the Jel Basin Level
Due to its robustness to non-normal distributions and low sensitivity to outliers, the non-parametric Mann-Kendall test has become a standard for identifying monotonic trends in hydro-climatic time series [57,58]. Numerous recent hydrogeological studies attest to the relevance of this approach for diagnosing temporal drifts in underground reservoirs. We used the nonparametric Mann-Kendall test to characterize the trajectories of hydraulic load at various monitoring points in the Jel plain on an annual basis [57,58]. Within the Jel basin, the amplitude of linear drifts over the period 2002-2020 was quantified using Sen’s slope estimator [62]. This approach enables an accurate definition of the annual rate of change (magnitude of change per unit of time) affecting the basin’s resources [68]. Sen’s slope estimator is preferred for its non-parametric nature and resistance to extreme values, characteristics that make it a benchmark tool for quantifying the magnitude of trends in hydrometeorological records [35].
4. Results and Discussions
4.1. Criteria Influencing Groundwater in the Jel Basin
4.1.1. Geomorphology
Figure 3 shows the geomorphology map of the Jel basin, which is a transition zone between mountainous terrain and plains [63]. This map is divided into four classes below [27]:
• Granitic massif: Granite is a hard, crystalline plutonic rock [69] which, from a geomorphological point of view, corresponds to high-altitude areas.
• Limestone outcrops: This is a permeable rock [32], which is absorbed by the soil. Geomorphologically, it corresponds to medium-altitude areas.
• Dissected clay slopes: This is an impermeable rock, which means that erosion is the dominant phenomenon [4]. From a geomorphological point of view, it corresponds to medium-altitude areas.
• Sandy plains: This is a class corresponding to high permeability, with a very high recharge rate [41]. From a geomorphological perspective, it is a low-altitude area.
From a hydrological point of view, the hydrographic network (blue line) is denser, indicating significant runoff, with a strong erosive response during precipitation [27]. The integration of the ‘Distance to surface water’ criterion significantly refined the model’s predictive accuracy [35]. In the Jel Basin, riparian zones often coincide with Quaternary alluvial deposits (sands and gravels) characterized by high hydraulic conductivity (10-4 m/s) [70], the strong spatial correlation between high-potential zones and the hydrographic network is attributed to the presence of an alluvial aquifer (bank storage) recharged through direct infiltration from the Moulouya and Melloulou wadis, particularly during seasonal flood events [69].
4.1.2. Geology
Figure 4 shows the geological (lithological) map of the Jel basin, which plays a key role in groundwater storage [23] and is composed of five main units:
• Granite: A crystalline and compact igneous rock that is impermeable from a hydrogeological point of view [71]. It delimits the extent of the Jel aquifer.
• Limestone: A permeable rock that contains a lot of water [6]. Its permeability is too high, and limestone plays a very important role in the transfer of surface water to deep aquifers. From a geological perspective, it is a carbonate sedimentary rock. Therefore, the Jel aquifer contains natural drains [72].
4.1.3. Soil
Figure 5 shows the soil map at ground level, which contains two main classes:
4.1.4. Slope
Figure 6 shows the slope map, which divides the area into three zones:
● Low slope area (0-5° and 5-15°)
From a hydrogeological perspective, this is an area with high recharge potential [50]. The low slope means that rainwater takes a long time to infiltrate into the groundwater, with an infiltration rate that is too low [73].
● Medium slope area (15-30° and 30-45°)
In the Jel basin, water flows rapidly downstream under gravity, with the average slope varying with runoff and erosion. The water then flows towards the plains [6]. Due to the flow rate, the aquifer does not allow for effective direct recharge [74].
● Steep slope area (>45°)
4.1.5. Rainfall
Figure 7 shows the precipitation map for the Jel basin. It shows rainfall variation from 100 to 200 mm/year. This map is divided into five classes, showing an upward gradient from south to north:
• Lower class of 100 to 120 mm: This class is located in the south-central part of the Jel basin, which means that this area is arid, where the recharge of the Jel aquifer is almost zero due to a water deficit [68].
• Middle class from 120 to 160 mm: Covers the central part of the Jel basin, showing that annual inflows are moderate and constant [70].
• Upper class of 160 to 200 mm: located on the northern and northwestern edges. From a hydrogeological point of view, recharge to the Jel aquifer is higher, indicating an increase in the piezometric level [9].
4.1.6. LULC
Figure 8 shows the LULC (Land Use Land Cover) map for the Jel aquifer, which directly affects water consumption and recharge quality. This map is divided into four classes:
• Crops: This is the most important class for the hydrogeological study of the Jel aquifer, with agricultural areas distributed along the central axis of the study area [1]. In a semi-arid context (100 to 200 mm of precipitation), irrigation of these crops becomes essential. This highlights the importance of pumping groundwater from the Jel aquifer [54].
• Built Area: Located in the urban center of the city of Guercif, this is an area that depends on an increase in human resources [76]. From a hydrogeological point of view, the recharge of this aquifer is limited. This is because there is a risk of pollution (vulnerability of the water table) [60].
• Rangeland/Bare Ground: These are the most important classes in terms of surface area, reflecting the semi-desert nature of our region (STEP, for example) [29]. From a hydrogeological point of view, these are natural recharge areas, which means there is no vegetation, allowing rainwater to reach the ground directly. On bare ground, the steep slope increases erosion [62].
• Trees/Water: These classes are located at the Moulouya and Melloulou wadis. From a biological perspective, vegetation dominates. Regarding the region’s hydrogeology, we observe an exchange between the water table and the river (Jel water table fed by rivers), indicating that the Jel aquifer supports the wadi’s flow during droughts [77].
4.1.7. Lineament Density
The lineament density map of the Jel basin (Figure 9) contributes to the recharge of the eastern aquifers. This map was created from band 5 of Landsat OLI 9 using ArcGIS 10.8. From this result, we observe that in the red zone (0.48-0.60 km/km²), there is a significant concentration of lineaments in the southeastern part of the Jel aquifer [36]. In the yellow zone (0.00-0.12 km/km2), the density is low in the northern part of the Jel aquifer. From a hydrogeological perspective, the increase in lineament density in the red color facilitates the infiltration of surface water into the deep groundwater table [32]. This area is favorable for drilling wells due to fractures in rocks such as limestone, which indicates that permeability is high in the region [2].
4.1.8. Drainage Density
Figure 10 shows the drainage density map for the Jel basin, which illustrates how rainwater flows and then infiltrates into the water table [43]. This map varies from 0.00 km/km² to over 2 km/km². In the red zone (>2 km/km²), we observe a high drainage density, indicating that water flows easily and infiltrates. However, in the yellow zone (0.00 km/km2), drainage density is low, contributing to infiltration into the eastern groundwater table [39].
From a hydrological perspective, the dense hydrographic network indicates excessive runoff during precipitation events in the Jel basin [19].
4.1.9. Evapotranspiration
In the semi-arid context of the Jel Basin, Potential Evapotranspiration (PET) plays a decisive role in the overall hydrological balance [27]. Although lithological variability is more pronounced across the study area, incorporating PET is vital for quantifying surface water losses prior to infiltration. This study explicitly includes PET data to improve the accuracy of the groundwater potential zones [40]. Moreover, the model acknowledges that parameters such as slope aspect and land cover act as indirect indicators of evaporation; specifically, vegetated areas and shady slopes minimize direct water loss, thereby promoting more efficient soil recharge [78].
4.2. Groundwater Potential Map for the Jel Basin
In this study, the groundwater potential of the Jel aquifer was identified using AHP (Figure 11a) and MIF (Figure 11b), the final groundwater potential map (GWPZ) was classified into three categories according to groundwater potential (AHP method) [18]:
• Good potential: This category is located in the northeastern part of the Jel basin, where we find that the lineament density is high, which favors groundwater infiltration [20].
• Average potential: This covers the central part of the Jel basin. It is the transition zone between the relief and this basin, and the geological conditions are moderately favorable [68].
• Low potential: Located in the southwestern part of the Jel basin, this area shows that fracturing is low and does not promote groundwater accumulation [49].
Regarding the MIF method, we observe that the groundwater potential distribution in the Jel basin is very similar to that obtained using the AHP method [79]. This method is divided into three classes [29]:
• Good potential: This category is located in the northern part of the Jel basin, where we find that the Jel aquifer recharge area will be significant [40].
• Average potential: This covers the southern part of the Jel basin, where we see that the groundwater in the Jel aquifer is more difficult to access [48].
• Low potential: Located in the north-central part of the Jel basin, this shows that the geological formations are characterized by impermeable rocks [74].
The significant alignment between the AHP and MIF outcomes, evidenced by their respective AUC values of 91.1% and 91.5%, underscores the reliability of the delineated groundwater potential zones [2]. This high level of agreement stems from the uniform quality of the input datasets and the consistent professional judgment applied during the weighting process [80]. Since these two independent decision-making frameworks produce nearly matching spatial patterns [4], it suggests that the selected geo-environmental indicators for the Jel Basin are highly representative and that the final output remains stable, regardless of the specific mathematical algorithm employed [42].
4.3. Validation of This Study Using the ROC Method
Figure 12 presents the two models, MIF and AHP, to validate our study. Below is the interpretation of these results:
Since the AUC values (90%, 91.5%) for the AHP (Figure 12a) and MIF (Figure 12b) models are over 50%, this result indicates that the models to be used will have an excellent capacity to identify groundwater storage potential [17] (Amaya et al. 2021a). Furthermore, these results show that the risk of failure in drilling is very low [38]. There is also good recharge between surface water and groundwater. Finally, we note that this is an area with high infiltration [27].
The remarkable consistency between the AHP (AUC = 91.4%) and MIF (AUC = 87.0%) models is primarily due to the dominant influence of identical environmental drivers, notably lithology and lineament density, across both frameworks [35]. Although these methods employ distinct computational logic, the resulting weight distribution remains fundamentally aligned with the hydrogeological realities of the Jel basin. Such convergence functions as a robust cross-validation, significantly enhancing the credibility of the final groundwater potential maps [9].
To supplement the statistical accuracy of the ROC analysis, the modeled potential zones were cross-referenced with a spatial distribution map of piezometric levels and aquifer depths (Figure 13) [32]. This empirical validation provides a practical ‘ground-truth’ by comparing theoretical GWPZ classes with the basin’s actual hydraulic performance [20]. The findings indicate that areas designated as high-potential sectors consistently overlap with regions where the water table is most accessible and extraction yields are highest [24]. This strong correlation between multicriteria decision-making (MCDM) outputs and field observations confirms that the AHP and MIF frameworks accurately reflect the physical hydrogeological dynamics of the Jel aquifer [21].
4.4. Mann-Kendall Tests and the Slope to Determine the Trend in Groundwater Levels
The Mann-Kendall tests (Figure 14a) and slope tests (Figure 14b) for the Jel basin focus on the monthly study of groundwater trends in this basin (Table 5) [3]. The results of the Mann-Kendall test show that there are no trends for the months of January, February, March, May, June, July, August, September, October, November, and December, as p<0.05 [56]. However, for April, there is no significant trend p>0.05; (This indicates that drought dominates during this period. Indeed, for the slope test, we observe a negative trend in May, October, and December [81]. This means that there is a period of drought at the boreholes located in this basin [82]. On the other hand, the other months (September, November, January, February, March, April, June, July, and August) are characterized by a period of humidity in this region [63].
Therefore, it is essential to differentiate between the basin’s natural hydrogeological favorability and the actual water volume currently available [62]. While this research identifies prospective zones based on environmental variables, anthropogenic pressures particularly agricultural withdrawal significantly alters these groundwater stores [50].
Intersection of spatial GWPZ mapping with temporal piezometric trends offers critical insights into the basin’s hydrological resilience [2]. The northern and northeastern areas, which exhibit the highest groundwater potential, coincide with the most consistent piezometric stability according to the Mann-Kendall test [38]. This suggests that the structural lineament networks and limestone lithology in these sectors act as natural buffers, maintaining water levels even through prolonged dry spells [70]. In contrast, the southern zones identified as low-potential areas frequently align with the downward trends detected in May and October [7]. This spatial-temporal disparity indicates that while northern aquifers are naturally replenished, the southern resource is increasingly sensitive to the dual pressure of limited recharge and intensified irrigation pumping Integrating spatial potentiality mapping with temporal piezometric analysis offers a deeper understanding of the Jel basin’s hydrodynamics [9]. The northern and northeastern sectors, characterized by high GWPZ, align with stable or positive Mann-Kendall trends (particularly in April) [16]. This synergy suggests that the high density of lineaments and permeable limestone formations ensure a resilient recharge mechanism [70]. In contrast, the southern basin, where potential is limited, shows localized downward trends during May, October, and December [23]. These results highlight a geographical disparity in climate resilience, where agricultural demand and seasonal droughts more easily disrupt the equilibrium of low-potential areas [13]. Consequently, water management strategies should focus on these high-potential stable zones to optimize future extraction sustainability. The piezometric fluctuations analyzed through Mann-Kendall and Sen’s slope methodologies provide a clear indication of the long-term impact of such abstractions [48]. In sectors where high natural potential overlaps with a documented decline in water levels, stringent regulation of borehole density and extraction volumes is vital to prevent aquifer exhaustion [45]. Future governance in the Jel Basin should integrate these predictive maps with empirical usage data to foster sustainable resource management [52].
In order to corroborate the statistical findings, the temporal evolution of groundwater levels is illustrated in Figure 15 [83]. These hydrographs reveal a clear contrast: northern high-productivity zones maintain remarkably stable piezometric levels, benefiting from efficient recharge through fractured limestone [70]. Conversely, monitoring points in the southern basin exhibit a distinct vulnerability to seasonal fluctuations and a gradual downward trajectory, primarily as a result of concentrated agricultural withdrawals [84].
5. Conclusion
By integrating Analytic Hierarchy Process (AHP) and Multi-Influence Factor (MIF) methods within a GIS environment, this study provides a rigorous characterization of groundwater potential in the Jel basin. The spatial distribution exhibits marked heterogeneity: high-potential zones facilitated by optimal fracturing and lithological permeability cover 117 km² (18% of the basin), primarily in the northern and northeastern sectors. The moderate-potential class predominates, encompassing 357 km² (55%), while low-potential areas account for 176 km² (27%). The robustness of these findings is validated by high Area Under the Curve (AUC) values of 91.1% (AHP) and 91.5% (MIF). Furthermore, hydro-climatic trend analysis (2002–2020) indicates overall piezometric stability (Sen’s slope of -0.044 m/year), despite persistent seasonal vulnerability. Collectively, these quantitative data offer a reliable decision-support framework for strategic borehole siting and sustainable water resource management. This research demonstrates that both methodologies are effectively equivalent for assessing groundwater potential within similar semi-arid environments. Nevertheless, the Analytic Hierarchy Process (AHP) is particularly advocated for studies requiring rigorous statistical verification of expert judgment through the Consistency Ratio (CR). Conversely, the more intuitive Multiple Influencing Factors (MIF) approach is better suited for rapid exploratory mapping. Ultimately, the selection of either protocol for future investigations should be guided by available computational resources and the specific requirements for decision-making precision, The novelty of this study resides in the high convergence between theoretical geospatial models and empirical field data. By linking spatial potentiality with temporal stability (2002–2020), this work provides a comprehensive decision-support system for high-precision borehole siting in semi-arid contexts.
Declaration of Generative AI and AI-assisted technologies in the writing process
During the preparation of this work. the authors used [Google AI Studio, Google Colab] to improve the readability and language of the manuscript. After using this tool. the authors reviewed and edited the content as needed and take full responsibility for the content of the publication.
Author Contributions
Conceptualization, A.A. and K.D.; methodology, A.A., K.D., and E.R.; software, A.A., H.E., and K.D.; validation, A.A., E.R., and N.N.; writing-original draft preparation, A.A.; writing-review and editing, A.A. and N.N.
Funding
This research received no external funding.
Data Availability Statement
The original contributions presented in this study are included in the article and its supplementary materials. For any questions, please contact the author or the corresponding authors.
Acknowledgments
The authors express their sincere gratitude to all those who contributed to the completion of this study.
Conflicts of Interest
The authors declare no conflict of interest.
References
- Rana, M.M.S.P.; Rahman, M.T.; Hassan, M.F. Mapping groundwater potential zone by robust machine learning algorithms & remote sensing techniques in agriculture dominated area, Bangladesh. Clean. Water 2025, 3, 100064. [Google Scholar] [CrossRef]
- Elbarghmi, R.; Ghalit, M.; Abourrich, M.; Elkhalki, S.; Jodeh, S.; Azzaoui, K.; Lamhamdi, A. Assessment of groundwater quality and health risks in Ketama region (Intrarif), Morocco. Environ. Syst. Res. 2024, 13, 30. [Google Scholar] [CrossRef]
- Pande, C.B.; Moharir, K.N.; Panneerselvam, B.; Singh, S.K.; Elbeltagi, A.; Pham, Q.B.; Varade, A.M.; Rajesh, J. Delineation of groundwater potential zones for sustainable development and planning using analytical hierarchy process (AHP) and MIF techniques. Appl. Water Sci. 2021, 11, 186. [Google Scholar] [CrossRef]
- Saadi, O.; Nouayti, N.; Nouayti, A.; Dimane, F.; Elhairechi, K. Application of remote sensing data and geographic information system for identifying potential areas of groundwater storage in Middle Moulouya Basin of Morocco. Groundw. Sustain. Dev. 2021, 14, 100639. [Google Scholar] [CrossRef]
- Xue, H.; Wang, H.; Dong, G.; Li, Z. Spatial downscaling of GRACE groundwater storage based on DTW distance clustering and analysis of its driving factors. Remote Sens. 2025, 17, 14. [Google Scholar] [CrossRef]
- Pascal, C. Multi-scale mapping of water resources in irrigated regions: a multi-sensor remote sensing approach. PhD Thesis, Paul Sabatier University – Toulouse III, Toulouse, France, 2022. Available online: https://theses.hal.science/tel-04139330.
- Jilali, A.; Chamrar, A.; El Haddar, A. Hydrochemistry and geothermometry of thermal water in northeastern Morocco. Geotherm. Energy 2018, 6, 9. [Google Scholar] [CrossRef]
- Cheng, M.; Ries, J.C.; Tapley, B.D. Variations of the Earth’s figure axis from satellite laser ranging and GRACE. J. Geophys. Res. 2011, 116, B01409. [Google Scholar] [CrossRef]
- Azzirgue, E.M.; Cherif, E.K.; El Azhari, H.; Dakak, H.; Yachou, H.; Ghanimi, A.; Nouayti, N.; Da silva, J.E.; Salmoun, F. Interaction evaluation between the Jouamaa Hakama groundwater and Ouljat Echatt River in northern Morocco using hydrochemical modeling, multivariate statistics and GIS. Water 2023, 15, 1752. [Google Scholar] [CrossRef]
- Frappart, F.; Ramillien, G. Monitoring groundwater storage changes using the GRACE satellite mission: A review. Remote Sens. 2018, 10, 829. [Google Scholar] [CrossRef]
- Salhi, A.; Martin-Vide, J.; Benhamrouche, A.; Benabdelouahab, S.; Himi, M.; Benabdelouahab, T.; Ponsati, C.P. Rainfall distribution and trends of the daily precipitation concentration index in northern Morocco: a need for an adaptive environmental policy. Appl. Sci. 2019, 1, 277. [Google Scholar] [CrossRef]
- Alifujiang, Y.; Abuduwaili, J.; Abliz, A. Precipitation trend identification with a modified innovative trend analysis technique over Lake Issyk-Kul, Kyrgyzstan. J. Water Clim. Change 2023, 14, 1798–1815. [Google Scholar] [CrossRef]
- Laghrib, F.; Bahaj, T.; El Kasmi, S.; Hilali, M.; Kacimi, I.; Nouayti, N.; Dakak, H.; Bouzekraoui, M.; El fatni, O.; Hammani, O. Hydrogeochemical study of groundwater in arid and semi-arid regions of the Infracenomanian aquifers (Cretaceous Errachidia basin, southeastern Morocco) using hydrochemical modeling and multivariate statistical analysis. J. Afr. Earth Sci. 2024, 209, 105132. [Google Scholar] [CrossRef]
- Reth, N.K.; Byamungu, P.A.; Bahavira, J.M.; Lukumbi, M.P.; Haliza, I.P.; Muley Nyande, A.A. Use of remote sensing and multi-criteria analysis for the preliminary identification of suitable sites for the implementation of drinking water boreholes in rural areas. Int. J. Prog. Sci. Technol. 2025, 49, 104. [Google Scholar]
- Taheri, K.; Missimer, T.M.; Taheri, M.; Moayedi, H.; Pour, F.M. Critical zone assessments of an alluvial aquifer system using the multi-influencing factor (MIF) and analytical hierarchy process (AHP) models in western Iran. Nat. Resour. Res. 2020, 29, 1163–1191. [Google Scholar] [CrossRef]
- Simanjuntak, N.S.; Wusqa, U.; Syahputra, R. Identification of groundwater potential zones using geographic information system (GIS) and analytical hierarchical process (AHP) methods in the Sumbawa Besar Groundwater Basin. J. Geosci. Terap. 2024, 7. [Google Scholar]
- Amaya, A.; Ntoumbé, M.; Diguim, A.K.; Kah, E. Mapping of flood susceptibility by the AHP method combined with GIS: case of the Diamaré department (Cameroon). Int. J. Innov. Appl. Stud. 2021, 33, 491–501. [Google Scholar] [CrossRef]
- Tebege, E.G.; Birara, Z.M.; Takele, S.G.; Jothimani, M. Geospatial mapping and multi-criteria analysis of groundwater potential in Libo Kemkem watershed, upper Blue Nile River basin, Ethiopia. Sci. Afr. 2025, 27, e02549. [Google Scholar] [CrossRef]
- Meng, C.; Tian, D.; Zeng, H.; Li, Z.; Yi, C.; Niu, S. Global soil acidification impacts on belowground processes. Environ. Res. Lett. 2019, 14, 07400. [Google Scholar] [CrossRef]
- Qarqori, K. Contribution to the study of the discontinuous and karstic reservoir of the Middle Atlas Causses and its junction with the Saïs basin by spatial remote sensing and geophysical imaging. PhD Thesis, Moulay Ismaïl University, Meknes, Morocco, 2015. [Google Scholar]
- Ziani, S.; Khattach, D.; Nouayti, N.; Abderbi, J. Mapping of areas with the potential to provide adequate groundwater supplies in arid regions: A case of the Isly Basin (Horst Belt, Northeastern Morocco). Environ. Earth Sci. 2021, 80, 318. [Google Scholar] [CrossRef]
- Taoufiq, L.; Kacimi, I.; Saadi, M.; Nouayti, N.; Kassou, N.; Bouramtane, T.; El-Mouhdi, K. Assessment of physicochemical and bacteriological parameters in the Angads aquifer (Northeast Morocco): Application of principal component analysis and Piper and Schoeller–Berkaloff diagrams. Appl. Environ. Soil Sci. 2023, 2023, 1–14. [Google Scholar] [CrossRef]
- Brahimi, A.; Chafi, A.; Nouayti, N.; Elmsellem, H.; Hammouti, B. Metal typology contamination of surface waters of Za River, lower Moulouya, eastern Morocco. Der Pharma Chem. 2015, 7, 346–353. [Google Scholar]
- Rhazi, A.; Essahlaoui, A.; Hmaidi, A.; Ouali, A. Study of vulnerability to flood risks in the city of Meknes: contribution of GIS, DEM and empirical models. Eur. Sci. J. 2017, 13, 102. [Google Scholar] [CrossRef]
- Hairchi, K. E.; Limame, A.; Benbrahim, Y.; Saadi, O.; Ouiaboub, L.; Nouayti, A.; Nouayti, N. Groundwater potential zones mapping using GIS, RS, and AHP method in the Guigou Basin, Middle Atlas, Morocco. Euro-Mediterr. J. Environ. Integr. 2024, 9, 101151. [Google Scholar] [CrossRef]
- Hafiane, F. Z.; Tahri, L.; Nouayti, N.; El jarmouni, M.; Arifi, K.; Idrissi, A.E.; Fekhaoui, M. Assessment of spatial and seasonal nitrate variation of groundwater in the irrigated perimeter (Tadla Plain, Morocco). Agric. For. 2020, 66, 1–14. [Google Scholar] [CrossRef]
- Baki, S.; Hilali, M.; Kacimi, I.; Kassou, N.; Nouiyti, N.; Bahassi, A. Assessment of groundwater intrinsic vulnerability to pollution in the Pre-Saharan areas: The case of the Tafilalet Plain (Southeast Morocco). Procedia Earth Planet. Sci. 2017, 17, 590–593. [Google Scholar] [CrossRef]
- Elaaraj, A.; Sedigh, M. E.; Lhachmi, A.; Tabyaoui, H.; Alitane, A.; Tiepolo, M.; Naouadir, M. Petrogenesis of lava from Saka (Guercif, Morocco): Source characterization and magma evolution. Proc. Geol. Assoc. 2025, 136, 101151. [Google Scholar] [CrossRef]
- Sadeq, S.; Al-Hashimi, S.; Cusack, C. M.; Werner, A. Endogenous double-stranded RNA. Non-Coding RNA 2021, 7, 15. [Google Scholar] [CrossRef] [PubMed]
- Atoui, M.; Agoubi, B. Vulnerability assessment in fractured aquifer using improved vulnerability index: Applied to Gabes aquifer, Southeastern Tunisia. J. Groundw. Sci. Eng. 2026, 14, 69–82. [Google Scholar] [CrossRef]
- Sun, Y.; Wang, C.; Chen, H. Y. H.; Ruan, H. Response of plants to water stress: A meta-analysis. Front. Plant Sci. 2020, 11, 978. [Google Scholar] [CrossRef] [PubMed]
- Nouayti, A.; Khattach, D.; Hilali, M.; Nouayti, N.; Arabi, M. Assessment of groundwater quality using statistical techniques in high Basin of Guir (Eastern High Atlas, Morocco). Mater. Today Proc. 2019, 13, 1084–1091. [Google Scholar] [CrossRef]
- Abou Zaki, N.; Torabi Haghighi, A.; Rossi, P. M.; Tourian, M. J.; Kløve, B. Monitoring groundwater storage depletion using GRACE data in Bakhtegan Catchment, Iran. Water 2019, 11, 1456. [Google Scholar] [CrossRef]
- Ehsan, M.; Shabbir, H.; Al-Quraishi, A. M. F.; Al-ansari, N.; Zulfiqar, A.; Abdelrahman, K.; Sohail, M.T.; Manzoor, Z.; Shafi, A.; Elbeltagi, A. Groundwater delineation for sustainable improvement and development aided by GIS, AHP, and MIF techniques. Appl. Water Sci. 2024, 14, 23. [Google Scholar] [CrossRef]
- Ouakhir, H.; Ennaji, N.; Spalevic, V.; Gomih, M.; Ghadbane, O.; Chakir, M.; El ghachi, M. Changes in river bank morphology in a small meander of El Abid River, Atlas Mountains, Morocco. Agric. For. 2023, 69, 3. [Google Scholar] [CrossRef]
- Najy, M.; Talbi, F. Z.; Ech-chafay, H.; Akkaoui, O.; Nouayti, N.; Belghyti, D. Characteristics and assessment of heavy metals in the water of Lake Sidi Boughaba (Kenitra, Morocco). In Innovations in Smart Cities Applications Volume 5. Lecture Notes in Networks and Systems; Ben Ahmed, M., Boudhir, A. A., Karaș, İ. R., Jain, V., Mellouli, S., Eds.; Springer: Cham, 2022; vol. 393. [Google Scholar] [CrossRef]
- Goel, V.; Buchel, C.; Frith, C.; Dolan, R. J. Dissociation of mechanisms underlying syllogistic reasoning. Neuroimage 2000, 12, 504–514. [Google Scholar] [CrossRef] [PubMed]
- Rane, N. L.; Choudhary, S. P.; Saha, A.; Srivastava, A.; Pande, C.B.; Aalshehri, F. Delineation of environmentally sustainable urban settlement using GIS-based MIF and AHP techniques. Geocarto Int. 2024, 39, 2335249. [Google Scholar] [CrossRef]
- El Hamdi, A.; Chauleau, J.-Y.; Boselli, M.; Thibault, C.; Gorini, C.; Smogunov, A.; Barreteau, C.; Gariglio, S.; Triscone, J.M.; Viret, M.; et al. Observation of the orbital inverse Rashba–Edelstein effect. Nat. Phys. 2023, 19, 1855–1860. [Google Scholar] [CrossRef]
- Andalu, A.; Naik, M. G.; Budde, S. AI and ML in groundwater exploration and water resources management: Concepts, methods, applications, and future directions. J. Groundw. Sci. Eng. 2026, 14, 100–122. [Google Scholar] [CrossRef]
- Ennaji, N.; Ouakhir, H.; Halouan, S.; Abahrour, M. Assessment of soil erosion rate using the EPM model: Case of Ouaoumana Basin, Middle Atlas, Morocco. IOP Conf. Ser. Earth Environ. Sci. 2022, 1090, 012004. [Google Scholar] [CrossRef]
- Khardouche, O. Mapping of potential groundwater zones using the AHP hierarchical analysis process, GIS and remote sensing in the Bouhamdane watershed (Northeastern Algeria); University Guelma, Algeria, 1945. [Google Scholar]
- Sinam, R. Rainfall trend of Imphal watershed using innovative trend analysis. Appl. Ecol. Environ. Sci. 2022, 10, 368–381. [Google Scholar] [CrossRef]
- Boutsougame, A.; El Youssfi, L.; Aassine, H.; Khuili, S.; Cherkaoui, S.I.; Ouazzani, H.; Alaoui, M. Impact of geology and climate change on wetlands: Case of Lake Aguelmam Azegza (Middle Atlas, Morocco). E3S Web Conf. 2022, 337, 01007. [Google Scholar] [CrossRef]
- Li, J.-F.; Zhang, Y.-J.; Liu, Y.-C.; Hao, Q.C.; Liu, C.L.; Cao, S.W.; Li, Z.H. Application of the DITAPH model coupling human activities and groundwater dynamics for nitrate vulnerability assessment: A case study in Quanzhou, China. J. Groundw. Sci. Eng. 2026, 14, 32–48. [Google Scholar] [CrossRef]
- Gupta, G.; Shailaja, G.; Tahama, K.; Karthikeyan, E. Integrating geospatial and geoelectric insights for groundwater potential mapping in Northern Maharashtra, India using a multi-criteria decision analysis approach. Discov. Water 2025, 5, 41. [Google Scholar] [CrossRef]
- Zhao, J.-W.; Huang, S.-B.; Su, Z.-X.; Huang, W.-C.; Qian, Y. Geographical differentiation of riverine DOM composition and source apportionment: A case study of a mountainous stream, a plain river, and an artificial canal. J. Groundw. Sci. Eng. 2026, 14, 59–68. [Google Scholar] [CrossRef]
- Ahmed, S. A.; Karkala, J.; Kumar, S. Assessing the potential of hard rock terrain to store groundwater using AHP techniques in the Vedavathi River Basin, India. Evol. Earth 2025, 3, 100057. [Google Scholar] [CrossRef]
- Damnati, B.; Etebaai, I.; Reddad, H.; Benhardouz, O.; Miche, H.; Taieb, M. Recent environmental changes and human impact since mid-20th century in Mediterranean lakes: Ifrah, Iffer and Afourgagh, Middle Atlas Morocco. Quat. Int. 2012, 262, 44–55. [Google Scholar] [CrossRef]
- Kabenla, R.; Ampofo, S.; Owusu, G.; Atulley, J. A.; Ampadu, B. Application of analytical hierarchy process (AHP) and multi-criteria evaluation (MCE) for a case study and scenario assessment of flood risk in the White Volta Basin, Ghana. Discov. Water 2024, 4, 90. [Google Scholar] [CrossRef]
- Wang, Y.; Sun, Y.; Cao, X.; Wang, Y.; Zhang, W.; Cheng, X. A review of regional and global scale land use/land cover (LULC) mapping products generated from satellite remote sensing. ISPRS J. Photogramm. Remote Sens. 2023, 206, 311–334. [Google Scholar] [CrossRef]
- Agyemang, V. O.; Appiah-Adjei, E. K.; Foli, G.; Asare, A. A review of groundwater resource development in lower White Volta River basin of Ghana. HydroResearch 2025, 8, 74–88. [Google Scholar] [CrossRef]
- Plomer, M. Á. Detection of problems in land use localization using GIS and AHP: the case of Riba-Roja de Túria (Valencia). Geofocus 2016, 18, 3. [Google Scholar]
- Darkaoui, N.; Idrissi, A. J.; Talbi, F. Z.; El fattouhi, Y.; Taam, A.; Nouayti, N.; Benboubker, M.; Lalami, A.E.O. Taxonomic and biodiversity study of sandfly species in the Fez region, central Morocco. Trop. J. Nat. Prod. Res. 2022, 6, 6. [Google Scholar]
- Nouayti, N.; Khattach, D.; Hilali, M. Mapping of potential zones for groundwater storage in the high Ziz basin (Morocco): contribution of remote sensing and geographic information system. Bull. Inst. Sci. Rabat Sect. Sci. Terre 2017, 39, 13–57. [Google Scholar]
- Kendall, K. Thin-film peeling—the elastic term. J. Phys. D. Appl. Phys. 1975, 8, 1449. [Google Scholar] [CrossRef]
- Güçlü, Y. S. Multiple Şen-innovative trend analyses and partial Mann-Kendall test. J. Hydrol. 2018, 566, 685–704. [Google Scholar] [CrossRef]
- Hasan, O.; El Ghachi, M. Temporal dynamic of soil erosion and rainfall erosivity within Srou River Basin (Middle Atlas, Morocco). Am. J. Mech. Appl. 2023, 11, 1. [Google Scholar] [CrossRef]
- Dey, R. K.; Halder, P.; Nandy, S.; Ansary, R. Identifying groundwater potential zones using multi-criteria approach in agriculture-dominated landscapes of Malda district, India. Groundw. Sustain. Dev. 2025, 101497. [Google Scholar] [CrossRef]
- Chen, J.; Cazenave, A.; Dahle, C.; Llovel, W.; Panet, I.; Pfeffer, J.; Moreira, L. Applications and challenges of GRACE and GRACE Follow-On satellite gravimetry. Surv. Geophys. 2022, 43, 305–345. [Google Scholar] [CrossRef] [PubMed]
- Ntarmouchant, A.; Jeddi, E. M.; Carvalho, M. R.; Santos, T.M.B.D.; Smaili, H.; Cotrim, B.; Cachapuz, P.; Driouch, Y.; Mali, B.; Ntarmouchant, N.; Elabouyi, M.; Silva, E.A.F.D. Thermal springs associated with the Melilla-Fès-Smaala-Oulmès fault (Morocco): The role of fluid geochemistry in identifying a major active geodynamic structure. Appl. Geochem. 2024, 170, 106085. [Google Scholar] [CrossRef]
- Sastanti, S. Y.; Fibriani, C. Analysis of slum settlement levels using GIS-based AHP method in Magelang City. J. Nas. Teknol. Sist. Inf. 2019, 5, 69–78. [Google Scholar] [CrossRef]
- Laghzal, A.; Nouayti, N. Contribution to the hydrochemical study of Jurassic springs of the Ziz high basin: Contribution of remote sensing. J. Mater. Environ. Sci. 2018, 9, 1889–1898. [Google Scholar]
- Taibou, A.; Jounaid, H.; Moustadraf, J.; Amraoui, F. Assessment of groundwater potential in the Khenifra–Azrou basin, Central Massif, Morocco using frequency ratio and Shannon’s entropy approaches. Sci. Afr. 2025, 27, e02616. [Google Scholar] [CrossRef]
- Tesfa, C.; Sewnet, D. Groundwater potential zonation mapping using GIS-based MCDM approach in East Gojjam Zone, Central Ethiopia. J. Hydrol. Reg. Stud. 2025, 60, 102494. [Google Scholar] [CrossRef]
- Nijesh, P.; Dixit, R.; Patel, A.; Singh, A.K.; Gautam, A.; Rai, R.; Singh, S.K.; Pant, N.; Soman, M.; Rai, S.P. Groundwater potential zone mapping to understand the sustainability of springs in a micro watershed of Kosi River, Kumaun Lesser Himalaya, Uttarakhand, India. Preprints, 2024. [Google Scholar]
- Pimenta, L. B.; Beltrão, N. E. S.; Gemaque, A. M. S.; Tavares, P. A. Analytical Hierarchy Process (AHP) in GIS environment: themes and applications focused on decision making using spatial criteria. Interações (Campo Grande) 2019, 20, 407–420. [Google Scholar] [CrossRef]
- Najy, M.; Talbi, F. Z.; Ech-Chafay, H.; Akkaoui, O.; Lachhab, M.; Achhar, A.; Nouayti, N.; Belghyti, D. Ecological risk assessment of heavy metals in the Sidi Boughaba Lake, Morocco. J. Water Land Dev. 2023. [Google Scholar] [CrossRef]
- Azdimousa, A.; Jabaloy, A.; Asebriy, L.; Booth-Rea, G.; González-Lodeiro, F.; Bourgois, J. Lithostratigraphy and structure of the Temsamane unit (eastern external Rif, Morocco). Rev. Soc. Geol. Esp. 2007, 20, 187–200. [Google Scholar]
- Nouayti, N.; Khattach, D.; Hilali, M. Evaluation of the physicochemical quality of groundwater in the Jurassic aquifers of the high Ziz basin (Central High Atlas, Morocco). J. Mater. Environ. Sci. 2015, 6, 1068–1081. [Google Scholar]
- Taoufiq, L.; Kacimi, I.; Saadi, M.; Chlouchi, A.; Harmouzi, A.; Ouarrak, K.; Lhilali, I.; El Omari, H.; El amrani, J.; Nouayti, N.; Kassou, N.; Amrani, I.; El-Mouhdi, K. Assessment of the piezometric and rainfall levels of the groundwater in the Angads Plain, Northern Morocco. Trop. J. Nat. Prod. Res. 2023, 7, 12. [Google Scholar] [CrossRef]
- Ahalli, T.; Ouakhir, H.; Nouyati, N.; Khattach, D.; Ennaji, N.; Goumih, M.; Maziane, A.; Aynaou, A.; Talbi, F.Z. Impact of precipitation intensity and drought patterns on groundwater storage fluctuations within the Ghis-Nekor aquifer (Morocco). Ecol. Eng. Environ. Technol. 2025, 26, 2. [Google Scholar] [CrossRef]
- Wang, F.; Shao, W.; Yu, H.; Kan, G.; He, X.; Zhang, D.; Ren, M.; Wang, G. Re-evaluation of the power of the Mann-Kendall test for detecting monotonic trends in hydrometeorological time series. Front. Earth Sci. 2020, 8. [Google Scholar] [CrossRef]
- Neyshabouri, S. Z.; Khashei-Siuki, A.; Akbari, M. G. A state-of-the-art fuzzy nonlinear additive regression (FNAR) model for groundwater level prediction. J. Groundw. Sci. Eng. 2026, 14, 83–99. [Google Scholar] [CrossRef]
- Ennaji, N.; Ouakhir, H.; Abahrour, M.; Spalevic, V.; Dudic, B. Impact of watershed management practices on vegetation, land use changes, and soil erosion in river basins of the Atlas, Morocco. Not. Bot. Horti Agrobot. Cluj.-Napoca 2024, 52, 13567. [Google Scholar] [CrossRef]
- Achalhi, M. Chronostratigraphy and sedimentology of the Neogene basins of Boudinar and Arbaa Taourirt (Eastern Rif, Morocco). PhD Thesis, Mohammed First University, Oujda, Morocco, 2016. Available online: https://theses.hal.science/tel-01473572/.
- Gherissi, R.; Baba-Hamed, K.; Bouanani, A. Highlighting drought in the Wadi Lakhdar watershed Tafna, northwestern Algeria. Arab. J. Geosci. 2021, 14, 984. [Google Scholar] [CrossRef]
- El Khattabi, K.; El Allaoui, H.; El Abdouni, A.; Bouhrim, M.; Eto, B.; Dira, I.; Shahat, A.A.; Herqash, R.N.; Haboubi, K.; El bastrioui, M.; El hammoudani, Y. A bibliometric analysis of the supercritical CO₂ extraction of essential oils from aromatic and medicinal plants: Trends and perspectives. Horticulturae 2024, 10, 1185. [Google Scholar] [CrossRef]
- Mostephaoui, T.; Merdas, S.; Sakaa, B.; Hanafi, M. T.; Benazzouz, M. T. Mapping of water erosion risks by applying the universal soil loss equation using a geographic information system in the El Hamel watershed (Boussaada, Algeria). J. Alger. Rég. Arid. 2013, 12, 131–147. [Google Scholar]
- Shankar, A.; Dhir, A.; Talwar, S.; Islam, N.; Sharma, P. Balancing food waste and sustainability goals in online food delivery: Towards a comprehensive conceptual framework. Technovation 2022, 117, 102606. [Google Scholar] [CrossRef]
- Santos, R. A. L.; Mota-Ferreira, M.; Aguiar, L. M. S.; Ascensão, F. Predicting wildlife road-crossing probability from roadkill data using occupancy-detection models. Sci. Total Environ. 2018, 642, 629–637. [Google Scholar] [CrossRef] [PubMed]
- Toulotte, J. M.; Pantazopoulou, C. K.; Sanclemente, M. A.; Voesenek, L. A. C. J.; Sasidharan, R. Water stress resilient cereal crops: Lessons from wild relatives. J. Integr. Plant Biol. 2022, 64, 412–430. [Google Scholar] [CrossRef] [PubMed]
- Al-Raggad, M.; Al-Harahsheh, S.; Ibrahim, M.; Al-Shdaifat, A.; Al-Wreikat, M. An integrated hydrogeological and remote sensing modeling approach to evaluate the climate change and over-irrigation impact on groundwater depletion in north Jordan. Iraqi Geol. J. 2021, 12–27. [Google Scholar] [CrossRef]
- Yu, Y.; Jia, T.; Chen, X. The “how” and “where” of plant microRNAs. New Phytol. 2017, 216, 1002–1017. [Google Scholar] [CrossRef] [PubMed]
Figure 1.
Geographical location of the study area.
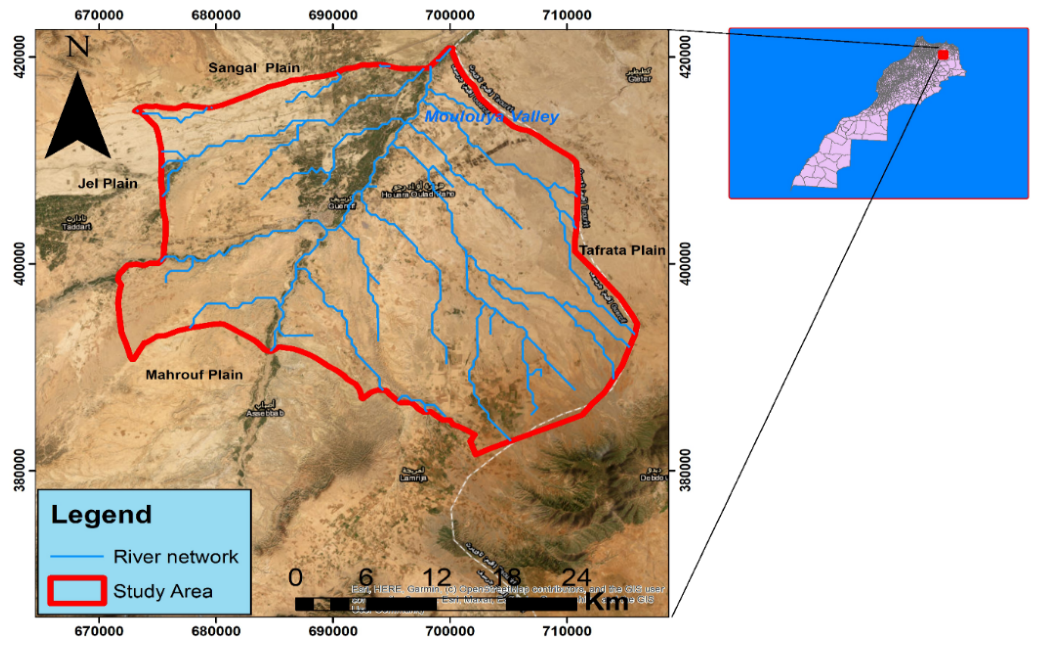
Figure 3.
The Geomorphology map of the Jel Basin.
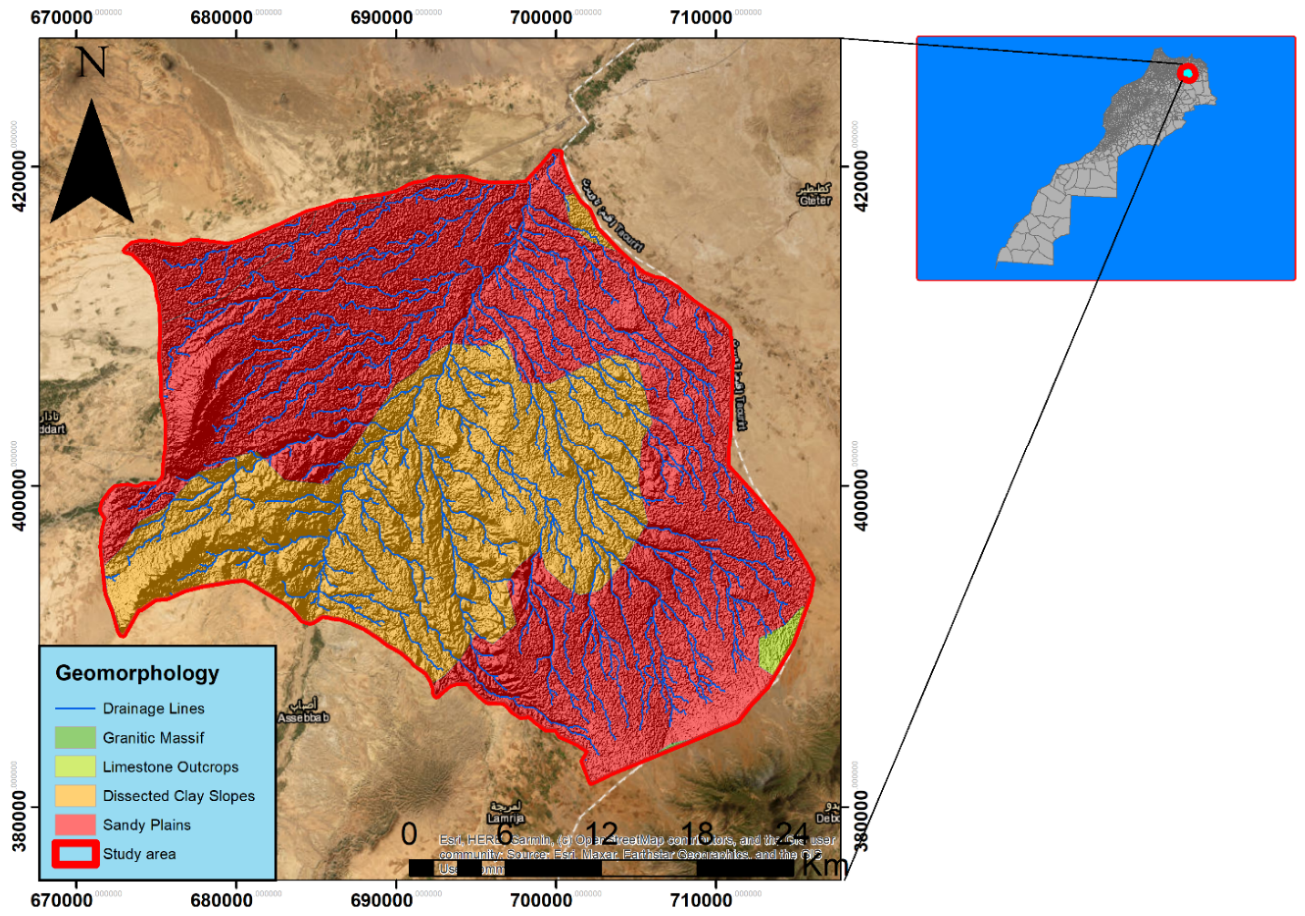
Figure 4.
Lithological map of the Jel Basin.
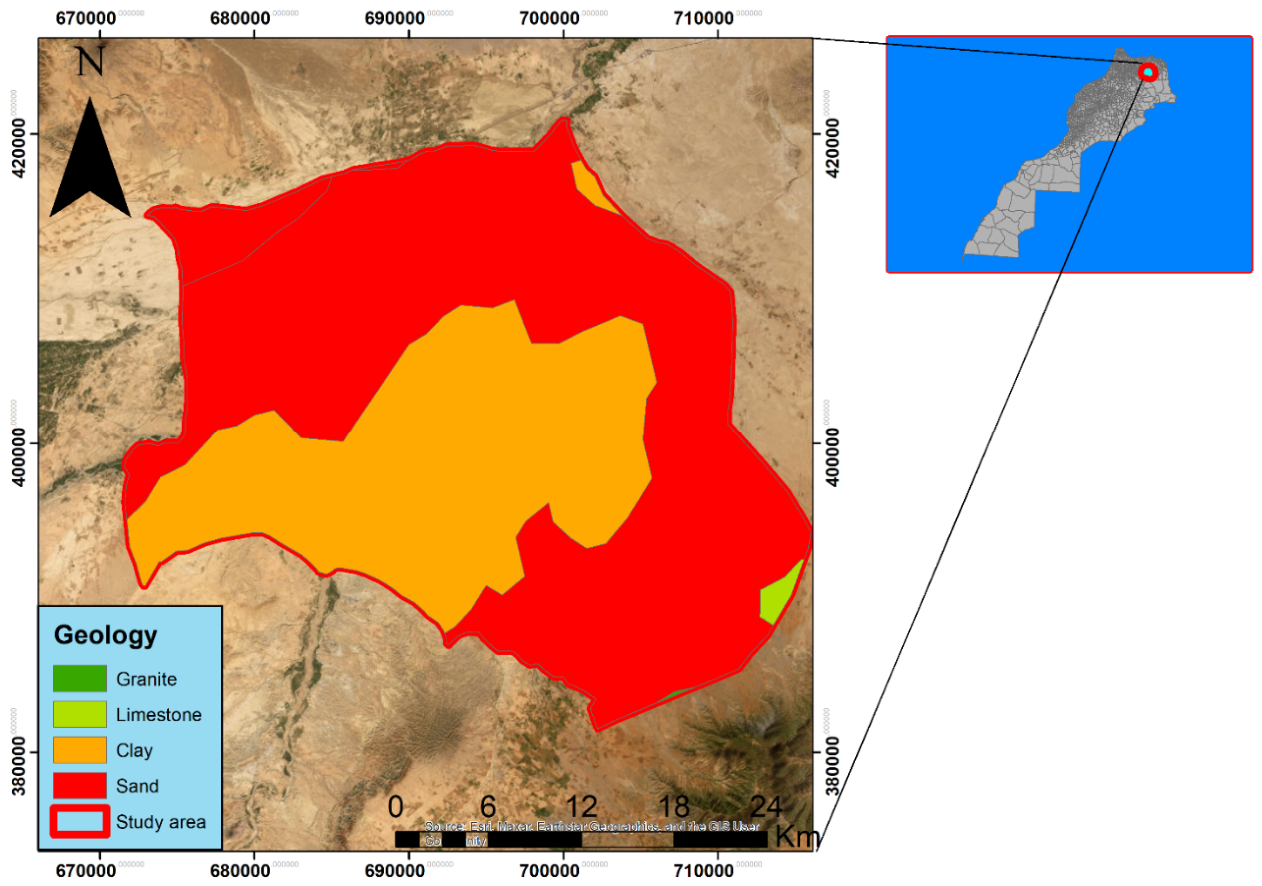
Figure 5.
The soil map at the Jel basin level.
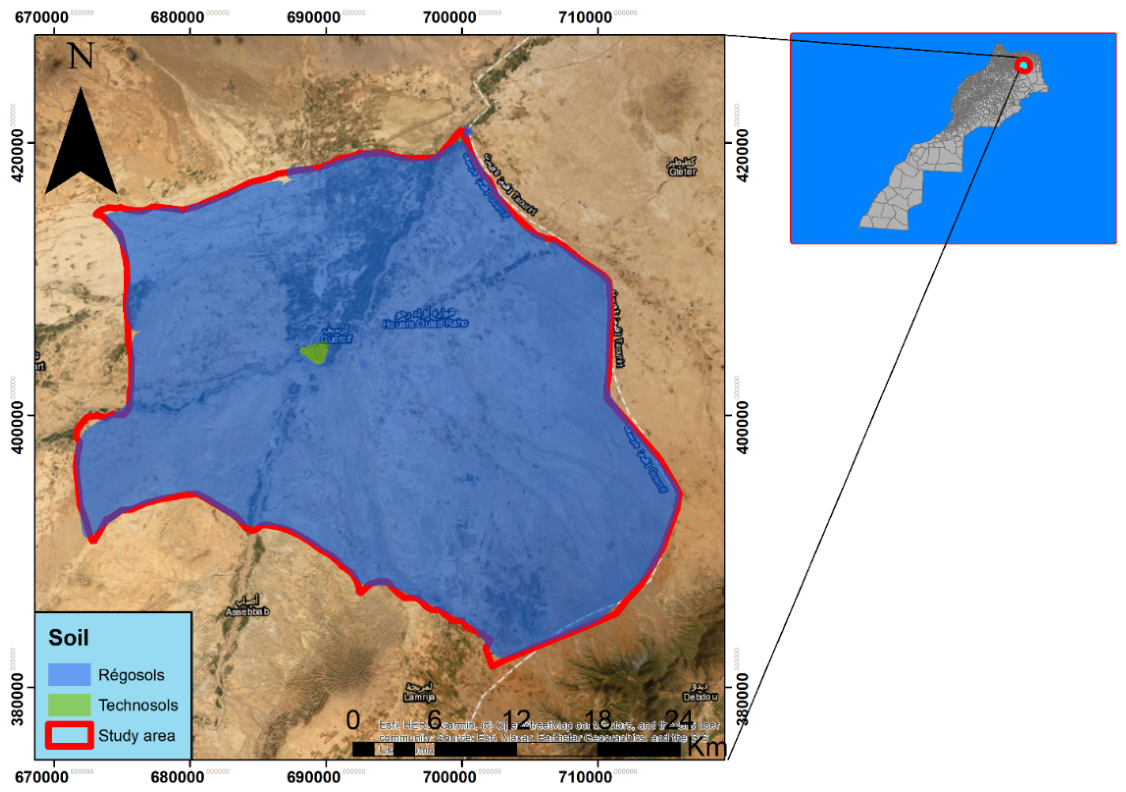
Figure 6.
The slope map at the Jel basin.
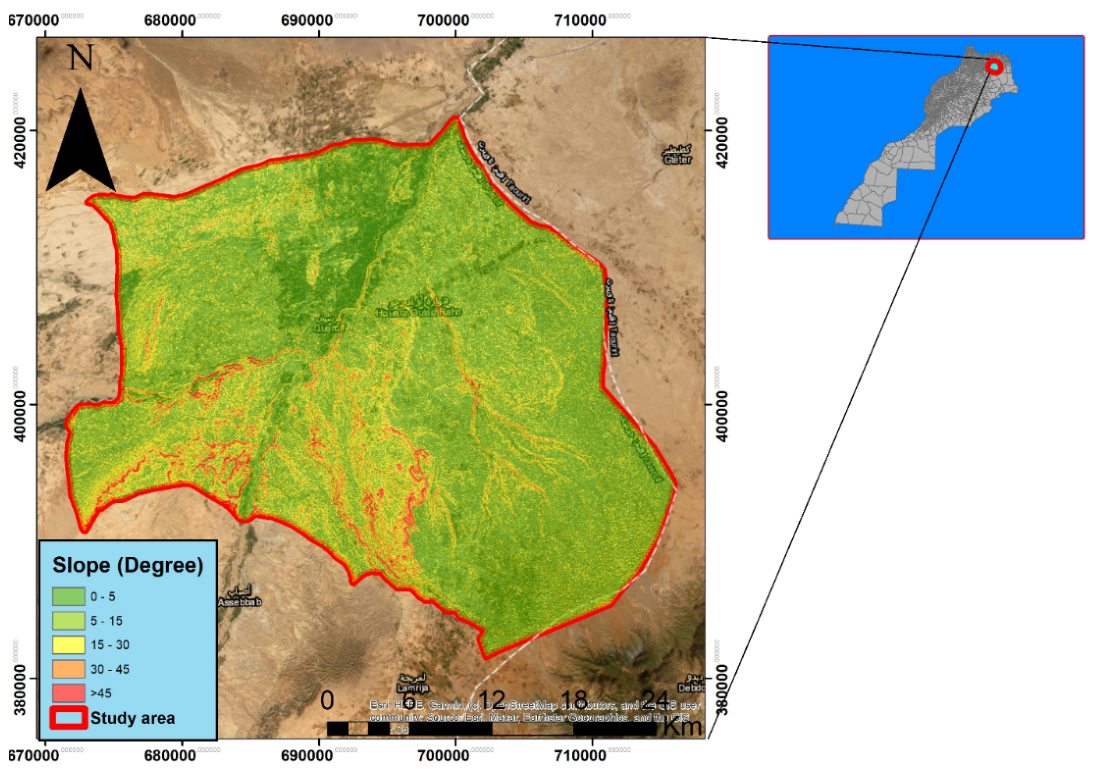
Figure 7.
The rainfall map of the Jel basin.
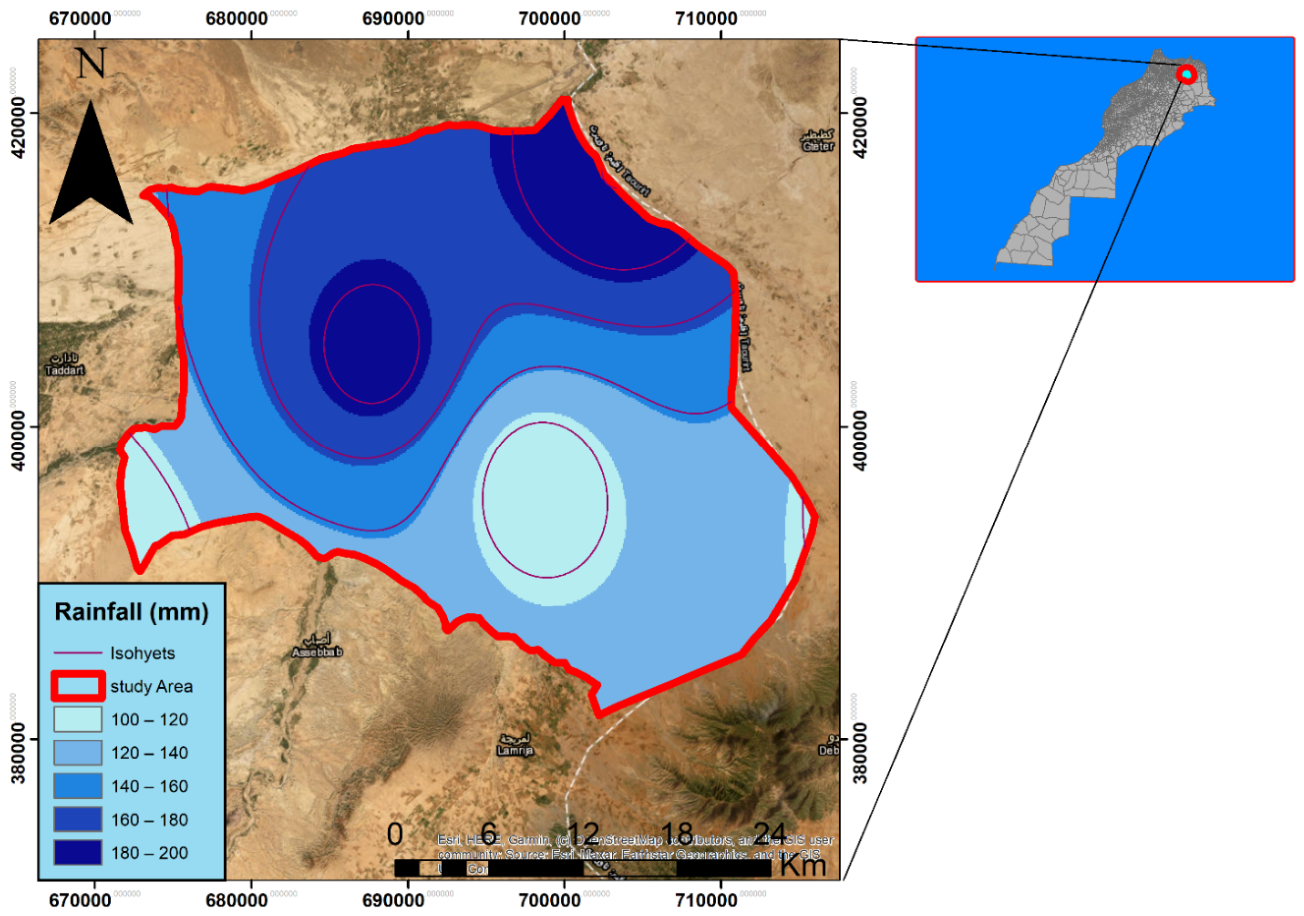
Figure 8.
LULC of the Jel aquifer.
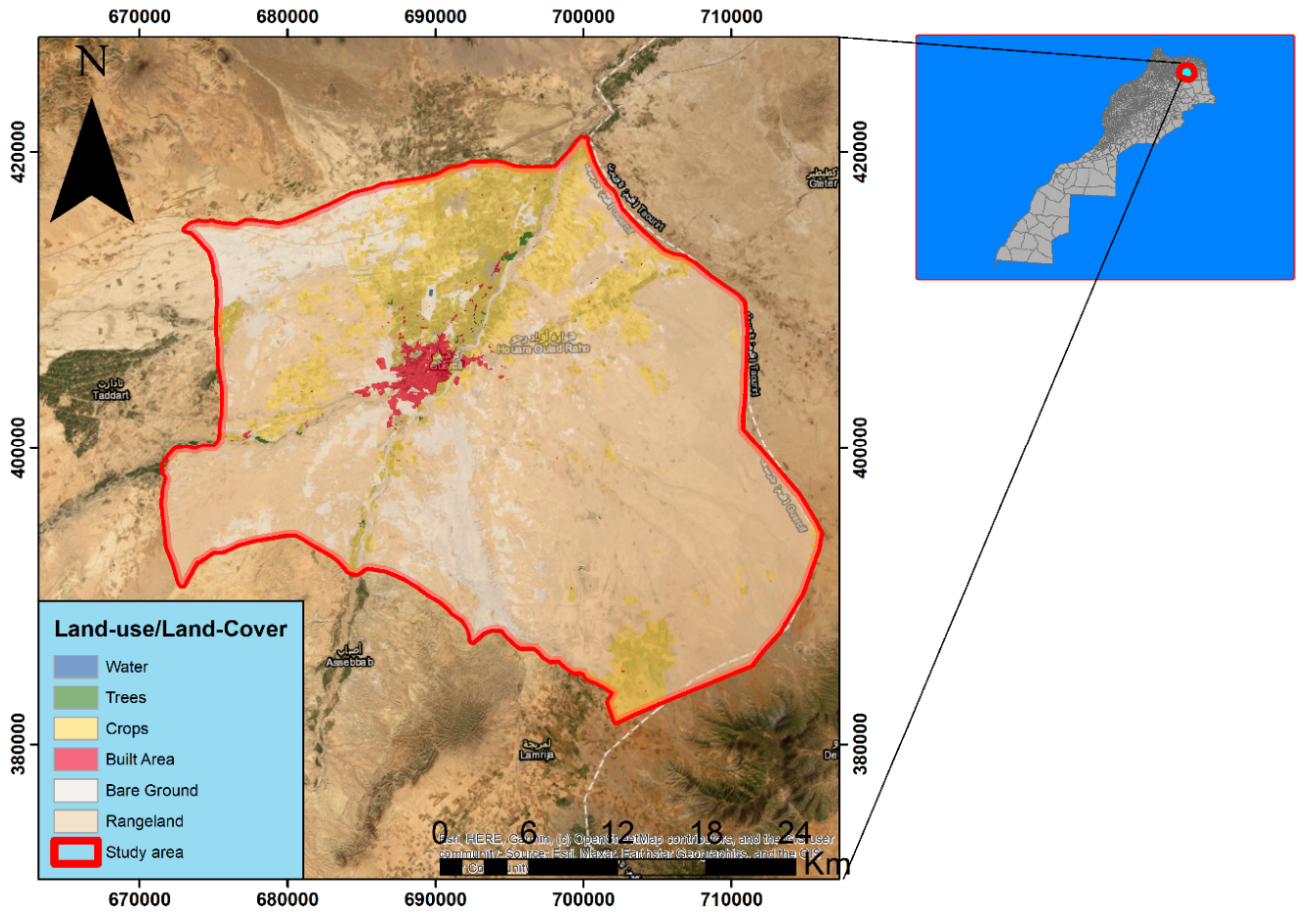
Figure 9.
The density map of lineaments at the Jel aquifer.
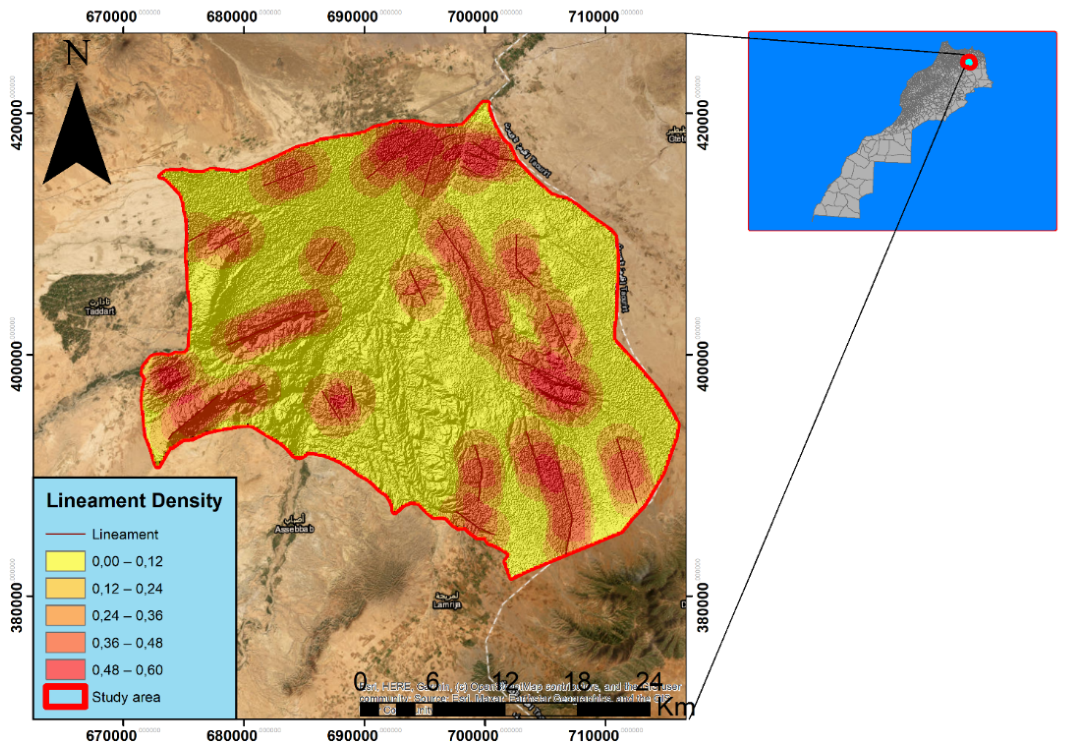
Figure 10.
The drainage density map at the Jel water table level.
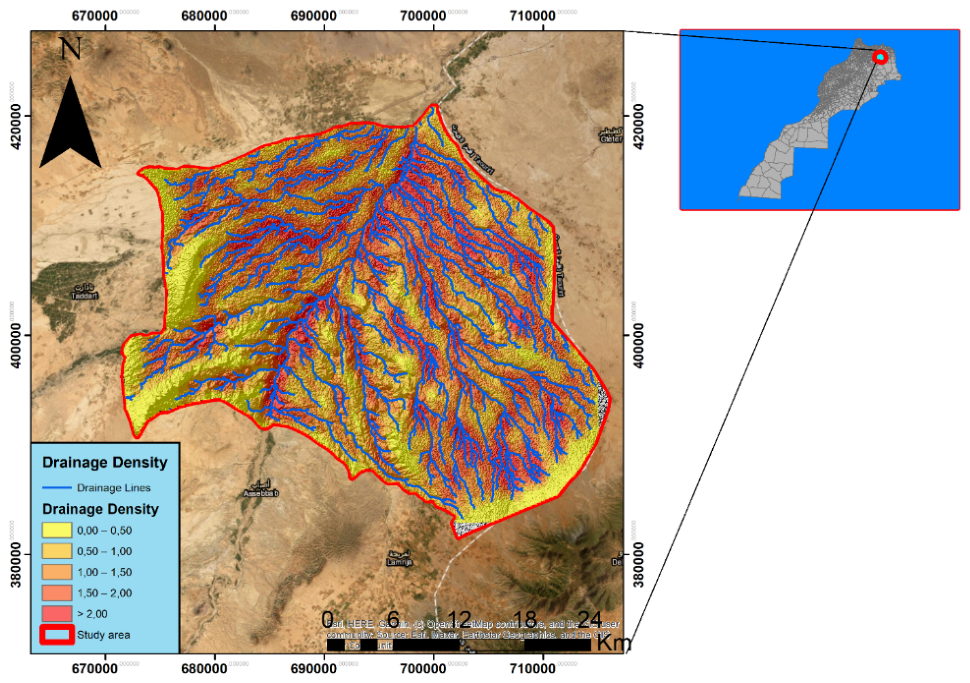
Figure 11.
Groundwater potential (GWPZ) in the Jel basin: (a) MIF model, (b) AHP model.
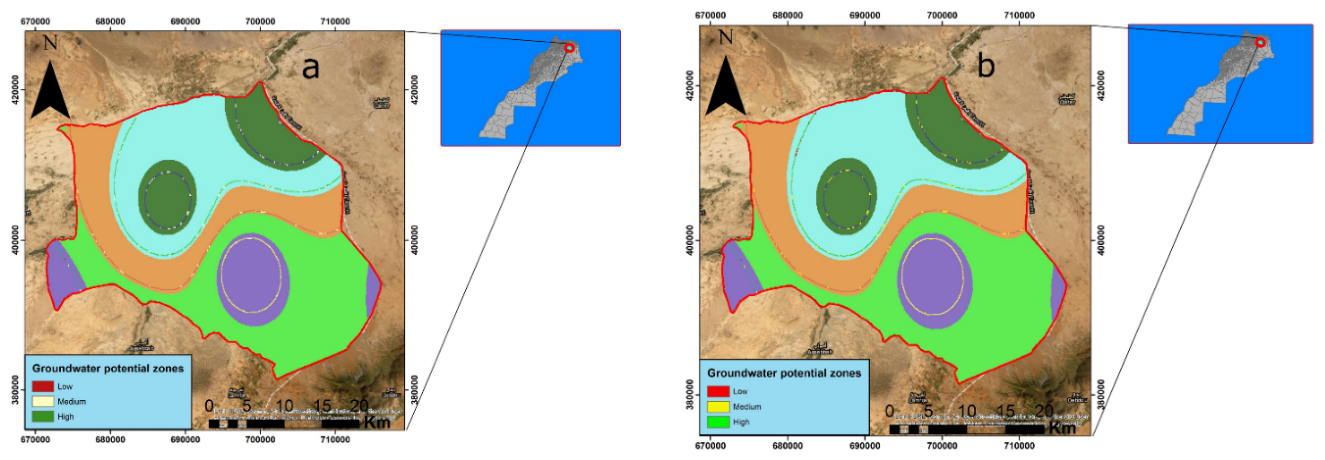
Figure 12.
ROC curve for the map of areas with groundwater potential at the Jel aquifer level: (a) AHP method, (b) MIF method.
Figure 12.
ROC curve for the map of areas with groundwater potential at the Jel aquifer level: (a) AHP method, (b) MIF method.
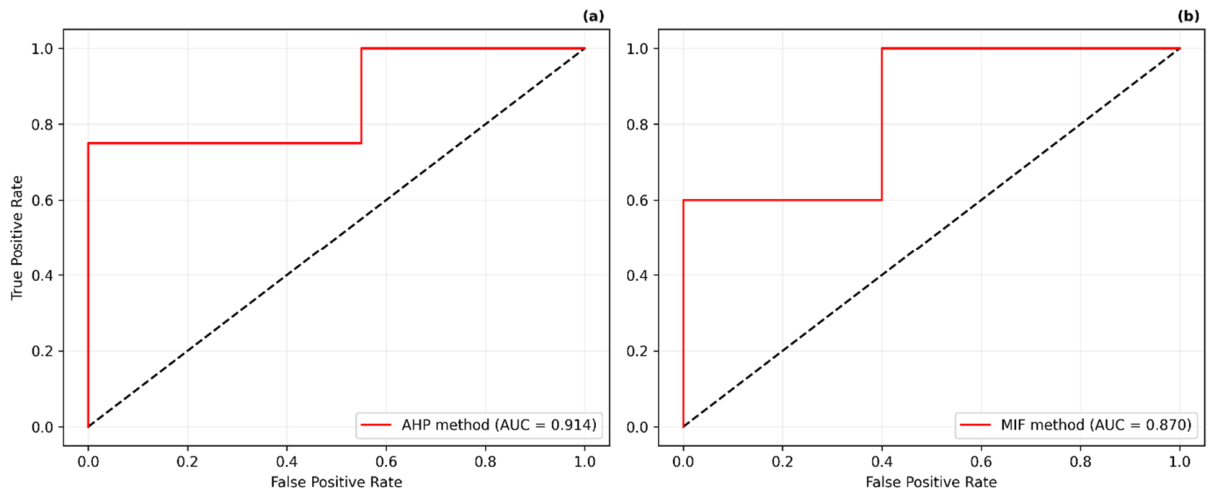
Figure 13.
Spatial distribution map of piezometric levels, groundwater depths, and borehole extraction points for field validation.
Figure 13.
Spatial distribution map of piezometric levels, groundwater depths, and borehole extraction points for field validation.
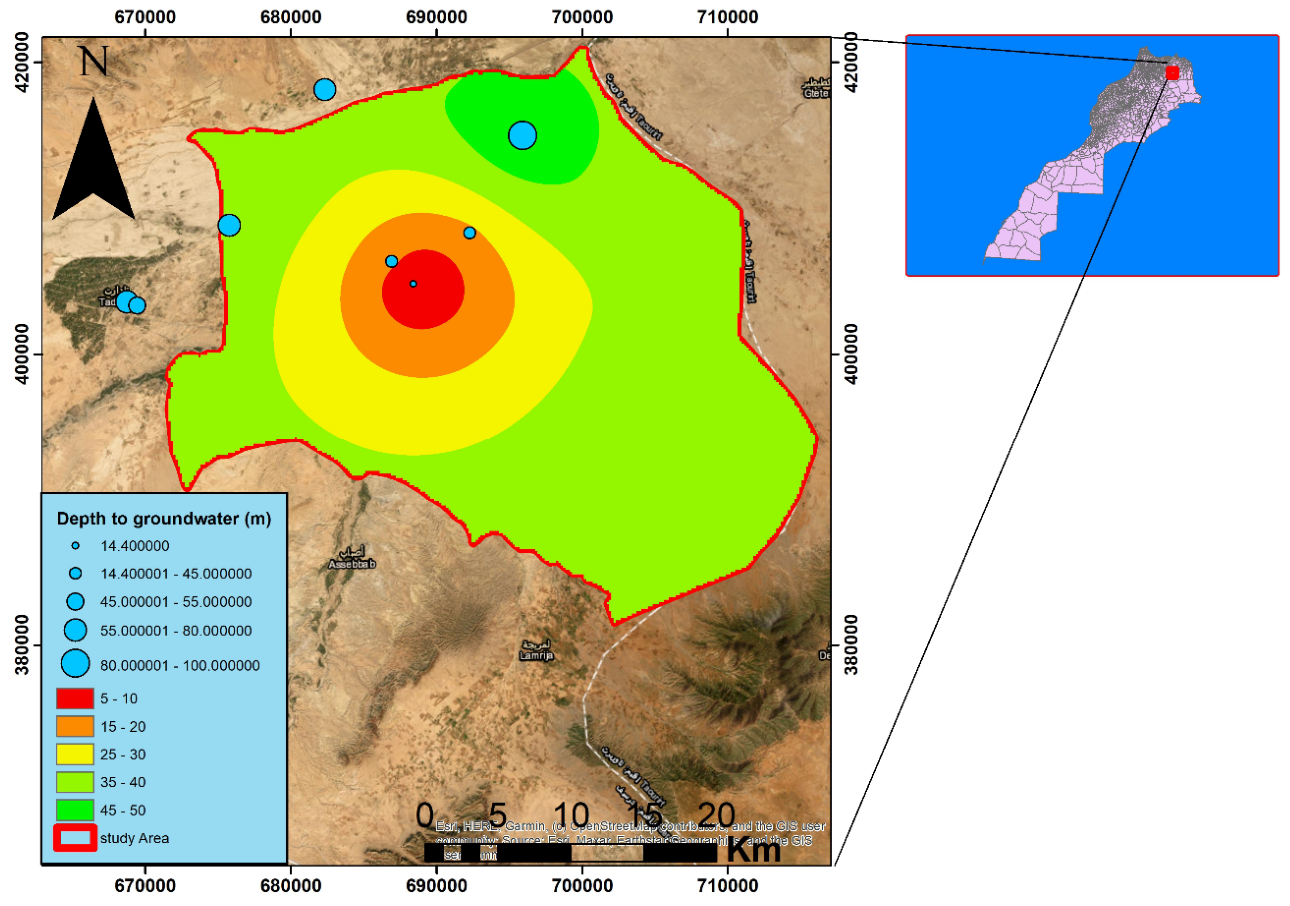
Figure 14.
(a) Mann-Kendall test and (b) slope of sen at the various groundwater monitoring stations in the Jel basin.
Figure 14.
(a) Mann-Kendall test and (b) slope of sen at the various groundwater monitoring stations in the Jel basin.
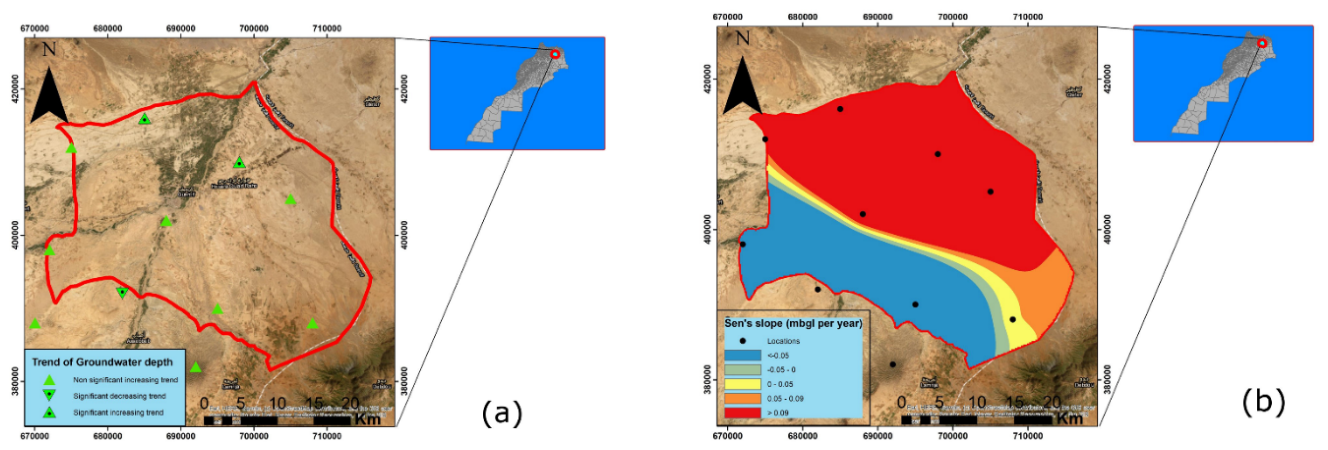
Figure 15.
Interannual trends of groundwater levels in representative piezometers of the Jel Basin (2002–2020), illustrating the relative stability in high-potential zones versus slight declines in low-potential areas.
Figure 15.
Interannual trends of groundwater levels in representative piezometers of the Jel Basin (2002–2020), illustrating the relative stability in high-potential zones versus slight declines in low-potential areas.
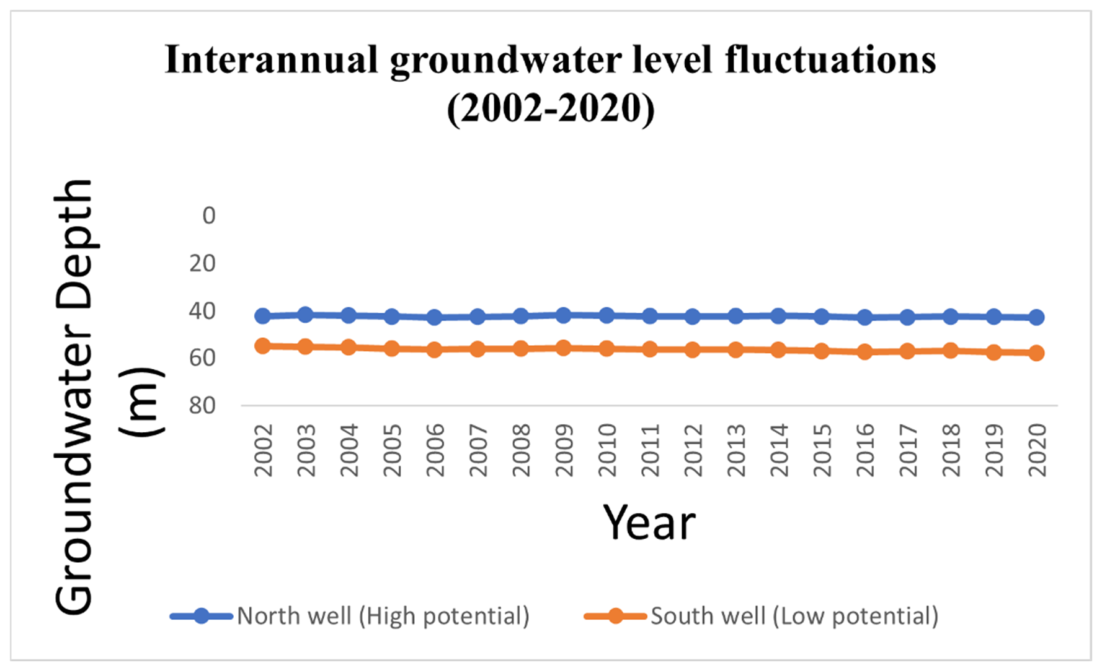

Table 1.
Data source.
| Series No. | Variable | Data type |
Data sources |
|---|---|---|---|
| 1 | Geomorphology |
Polygon | USGS via this link: www.sciencebase.gov |
| 2 | Geology | Polygon | https://www.brgm.fr/fr |
| 3 | Lineament density | Line | Landsat 8-9 OLI |
| 4 | Slope | Raster | DEM |
| 5 | LULC | Raster | Sentinel |
| 6 | Soil | Polygon | https://gaez.fao.org/pages/hwsd-v2 |
| 7 | Drainage density | Raster | USGS-Based on DEM |
| 8 | Precipitation |
Indicate |
Oujda Water Basin Agency (ABHM) |
| 9 | Depth to water level | Indicate |
Oujda Water Basin Agency (ABHM) |
| 10 | Distance from surface water | Raster | Derived from Figure 1 (River Network/ Hydrographic map) |
| 11 | Evapotranspiration | Raster | Oujda Water Basin Agency (ABHM) |
Table 2.
Pairwise comparison AHP matrix.
| Factors | Geo | Prec | Slope | Lin | Drai | LULC | Soil | Geom | Dis | Evap |
|---|---|---|---|---|---|---|---|---|---|---|
| Geology | 1 | 1 | 2 | 3 | 4 | 5 | 6 | 7 | 1 | 1 |
| Precipitation | 1 | 1 | 2 | 3 | 4 | 5 | 6 | 7 | 1 | 1 |
| Slope | 1/2 | 1/2 | 1 | 2 | 3 | 4 | 5 | 6 | 1/2 | 1/2 |
| Lineament | 1/3 | 1/3 | ½ | 1 | 2 | 3 | 4 | 5 | 1/3 | 1/3 |
| Drainage | 1/4 | 1/4 | 1/3 | 1/2 | 1 | 2 | 3 | 4 | 1/4 | 1/4 |
| LULC | 1/5 | 1/5 | ¼ | 1/3 | 1/2 | 1 | 2 | 3 | 1/5 | 1/5 |
| Soil | 1/6 | 1/6 | 1/5 | 1/4 | 1/3 | 1/2 | 1 | 2 | 1/6 | 1/6 |
| Geomorphology | 1/7 | 1/7 | 1/6 | 1/5 | 1/4 | 1/3 | 1/2 | 1 | 1/7 | 1/7 |
| Distance to surface water | 1 | 1 | 2 | 3 | 4 | 5 | 6 | 7 | 1 | 1 |
| Evapotranspiration | 1 | 1 | 2 | 3 | 4 | 5 | 6 | 7 | 1 | 1 |
Table 3.
Effect of influencing factor, relative rates, and score for each potential factor at the Jel Basin level.
Table 3.
Effect of influencing factor, relative rates, and score for each potential factor at the Jel Basin level.
| Factors |
Major Influences (A) |
Minor influences (B) |
Relative weight (A+B) | Net Weight (%) |
|---|---|---|---|---|
| Geomorphology | 1+1+1 | 0,5+0,5 | 4,0 | 16 |
| Geology | 1+1+1 | 0,5 | 3,5 | 14 |
| Slope | 1+1 | 0,5+0,5 | 3,0 | 12 |
| Precipitation | 1+1 | 0,5 | 2,5 | 10 |
| Lineament | 1+1 | 0,5 | 2,5 | 10 |
| Distance to surface water | 1+1 | 0,5 | 2,5 | 10 |
| Evapotranspiration | 1+1 | 0,5 | 2,5 | 10 |
| Soil | 1 | 0,5+0,5 | 2,0 | 8 |
| Drainage density | 1 | 0,5 | 1,5 | 6 |
| LULC | 0 | 0,5+0,5 | 1,0 | 4 |
| Total | 18 | 7 | 25 | 100 |
Table 4.
Thematic layers with subclasses, their ranks and weightage in the Jel basin.
| Criteria |
Classes | AHP Weight | AHP Rank | MIF Weight | MIF Rank |
|---|---|---|---|---|---|
| Geomorphology |
Granitic Massif Limestone outcrops Dissected Clay Slopes Sandy plains |
4 |
9 6 2 2 |
16 |
15 11 4 4 |
| Geology | Granite Limestone Clay Sand |
15 | 9 8 5 1 |
14 |
16 13 9 2 |
| Slope | 0° - 5° 5° - 15° 15° - 30° 30° - 45° >45° |
11 |
9 6 2 2 3 |
12 |
14 9 3 3 4 |
| Lineament density |
0° - 0,12° 0,12° - 0,24° 0,24° - 0,36° 0,36° - 0,48° 0,48° - 0,60° |
9 |
9 6 2 2 1 |
10 |
13 8 3 3 5 |
| Precipitation (mm) |
100 – 120 120 – 140 140 – 160 160 – 180 180 – 200 |
15 |
9 6 3 3 4 |
10 |
11 7 3 3 4 |
| Drainage density | 0° - 0,50° 0,50° - 1° 1° - 1,50° 1,5° - 2° >2,0° |
6 |
9 5 2 2 3 |
6 |
10 6 2 4 9 |
| Soil | Regosols Technosols |
5 | 8 5 |
8 |
9 6 |
| LULC | Water Trees Crops Built Area Bare Ground Rangeland |
5 | 9 4 1 1 2 3 |
4 | 8 5 1 1 2 4 |
| Distance to surface water | 0 – 250 m 250 – 500 m 500 – 1000 m > 1000 m |
15 | 8 7 5 2 |
10 | 15 10 6 2 |
| Evapotranspiration | Low (<1000mm/year) Moderate (1000-1400) High (>1400 mm/year) |
15 | 4 3 2 |
10 | |
| Total | 100 | 100 |
Table 5.
Mann-Kendall test, and slope of sen at the Jel water table.
| Value p |
Z |
H0 : No trend | Sen slope |
Trend Direction | |
|---|---|---|---|---|---|
| January | 0,7355 | 0,33782 | Yes | 0,1925926 | No trend |
| February | 0,7074 | 0,3754 | Yes | 0,1428571 | No trend |
| March | 0,0716 | 1.8011 | Yes | 0,9482143 | No trend |
| April | 0,0367 | 2.0883 | No | 0,8322917 | Increase |
| May | 0,6252 | -0,48854 | Yes | -0,0626087 | No trend |
| June | 0,1943 | -1.2981 | Yes | 0 | No trend |
| July | 0,9599 | -0,050247 | Yes | 0 | No trend |
| August | 0,1643 | -1,3909 | Yes | 0 | No trend |
| September | 0,7639 | 0,30032 | Yes | 0,06333333 | No trend |
| October | 0,5609 | -0,5815 | Yes | -0,3818783 | No trend |
| November | 0,7497 | 0,319 | Yes | 0,2002262 | No trend |
| December | 0,4305 | -0,78835 | Yes | -0,4833333 | No trend |
| Annual | 0,1108 |
-1,5944 | Yes | -2.163352 | No trend |
Disclaimer/Publisher’s Note: The statements, opinions and data contained in all publications are solely those of the individual author(s) and contributor(s) and not of MDPI and/or the editor(s). MDPI and/or the editor(s) disclaim responsibility for any injury to people or property resulting from any ideas, methods, instructions or products referred to in the content. |
© 2026 by the authors. Licensee MDPI, Basel, Switzerland. This article is an open access article distributed under the terms and conditions of the Creative Commons Attribution (CC BY) license (http://creativecommons.org/licenses/by/4.0/).
Copyright: This open access article is published under a Creative Commons CC BY 4.0 license, which permit the free download, distribution, and reuse, provided that the author and preprint are cited in any reuse.


