

Submitted:
10 July 2026
Posted:
10 July 2026
You are already at the latest version
Abstract
Whether economic growth decouples from municipal solid waste (MSW) generation in upper-middle-income economies remains contested. We test the Waste Kuznets Curve and a disposal-to-recovery substitution effect using a 13-year panel of 1,101 Colombian municipalities, combining step-wise fixed-effects models with a non-parametric generalised additive model (GAM), a spatial autoregressive (SAR) check, and a selection-aware recovery model. We find no evidence of income-driven decoupling in landfilling. Once urban density and demographic structure are controlled, the income terms lose significance, the non-parametric estimate is predominantly monotonic, and density emerges as the main structural driver. Material recovery grows faster than disposal with income (relative substitution), but this signal is concentrated where recovery is measured—only 27% of municipalities report it, and coverage falls from 86% in metropolitan tiers to 19% in the rural periphery—so that once selection is corrected the recovery elasticity falls from about 5.9 to a non-significant 1.3. Rather than spontaneous decoupling, Colombia exhibits persistent coupling alongside an institutionally engineered, spatially unequal recovery capacity. Achieving SDG 12 therefore requires stratified policies that mandate consumption reduction in mature urban economies while subsidising shared circular infrastructure for historically neglected rural jurisdictions.
Keywords:
Waste Kuznets Curve (WKC)
; economic decoupling
; substitution effect
; circular economy
; panel data
; municipal solid waste management
1. Introduction
The global pursuit of economic prosperity, enshrined in Sustainable Development Goal (SDG) 8, presents a universal paradox where GDP per capita growth tends to accelerate municipal solid waste (MSW) generation, threatening SDG 11 (Sustainable Cities) and SDG 12 (Responsible Consumption and Production) [1]. While this trade-off impacts all nations, its dynamics vary significantly depending on economic development stages. In developing economies, particularly those transitioning towards upper-middle-income status, the rate of material consumption frequently outpaces MSW management infrastructure deployment [2,3]. This creates a distinct challenge compared to high-income nations, where infrastructure is often established but generation rates remain high.
The World Bank projects that, driven by these economic transitions, MSW generation in low- and middle-income countries will rise significantly by 2050 [2]. This escalating trend is corroborated by recent global analyses, such as Zhang et al. [4], which demonstrated that absolute decoupling of aggregate MSW from economic growth remains exceptionally rare, particularly in developing regions where the scale effect heavily dominates. These studies identified distinct decoupling mechanisms and tipping points that trigger non-linear shifts in environmental impact, suggesting that without structural intervention, the environmental cost of growth remains unsustainable.
The theoretical framework most frequently employed to analyse this relationship is the Environmental Kuznets Curve (EKC). Originally proposed by Grossman et al. [5], the EKC hypothesises an inverted U-shaped relationship between economic development and environmental degradation. Applied to the MSW sector, the hypothesis suggests that MSW generation increases with income during early development stages due to higher consumption (scale effect). However, beyond the turning point, generation rates are expected to stabilise or decline as societies invest in cleaner technologies, shift towards service-based economies, and demand higher environmental quality. This transition is theoretically driven by the technique effect, arising from technological improvements that increase resource efficiency, and the composition effect, resulting from a structural economic shift towards less pollution-intensive sectors.
Recent empirical evidence supports this complex interaction; for instance, Magazzino et al. [6] found a bidirectional causality between waste generation and GDP in Switzerland, highlighting waste recovery systems as critical drivers in mitigating environmental impacts once thresholds are met. Similarly, Soukiazis et al. [7] validated the Waste Kuznets Curve (WKC) for Portuguese municipalities with a turning point at approximately EUR 30,000, while Ichinose et al. [8] observed a similar decoupling in Japan. In contrast, studies in emerging Asian economies reported lower or non-existent turning points [3,9], indicating that the path to decoupling is highly sensitive to local economic contexts.
Despite the popularity of the EKC hypothesis, WKC empirical evidence remains inconclusive and highly context dependent. While some high-income nations show relative decoupling, others argue that waste generation merely stabilises. A critical limitation in existing literature is the heavy reliance on cross-country analyses or short-term datasets which mask sub-national nuances. Recent research in large emerging economies has demonstrated that aggregated national data often obscures critical local variations. Wang et al. [10,11] revealed significant spatio-temporal heterogeneity in decoupling states across Chinese cities, proving that regional disparities drive divergent waste trajectories. Furthermore, Cheng et al. [12] emphasized that population agglomeration and technological factors function as distinct drivers that simple national models fail to capture. This reinforces the findings of Mazzarano et al. [13] regarding non-constant income elasticities in Italy, highlighting the necessity of granular, municipal-level analyses to avoid ecological fallacies.
Beyond sub-national granularity, the literature exhibits a pronounced geographic bias. While recent panel analyses of OECD countries frequently demonstrate complex decoupling dynamics—such as human capital-driven inverted N-shaped curves [14]—and broad panels of emerging economies suggest that specific waste streams like e-waste may exhibit theoretical inverted U-shaped trajectories [15], empirical evidence regarding aggregate MSW in the Latin American and Caribbean (LAC) region remains limited and structurally distinct. A recent global assessment by Cavalheiro et al. [16] highlights this regional divergence, demonstrating that while the LAC region achieves high waste collection coverage (94.5%), its recycling rate remains critically suppressed at merely 4.8%.
This structural bottleneck implies that in upper-middle-income LAC economies, economic growth translates predominantly into a persistent scale effect rather than technology-driven decoupling. Consequently, extrapolating Global North WKC thresholds to LAC is methodologically problematic, ignoring pervasive regional realities such as rapid urban agglomeration, profound inequality, and heavy reliance on informal recycling.
In the specific case of Colombia, the EKC hypothesis has been tested extensively for atmospheric pollutants and energy-related indicators [17,18,19,20,21]. While initial explorations of the environmental Kuznets framework for MSW by Trujillo Lora et al. [22] found preliminary evidence of an inverted U-shaped relationship for landfilled waste, their assessment was based on a restricted temporal window (2008–2011) and preceded the country’s modern circular economy framework. Crucially, this previous national literature focused exclusively on landfilled waste, entirely overlooking the substitution effect—the critical transition from landfilling to formal material recovery. Although recent research has evaluated the techno-economic feasibility of waste-to-energy technologies in specific Colombian regions [23,24], the broader econometric relationship between economic growth and aggregate waste generation remains unexamined at the national level using modern, high-granularity data. This absence of specific empirical evidence limits the ability of policymakers to design targeted circular economy strategies, as findings derived from greenhouse gas emissions cannot be directly extrapolated to waste management dynamics.
Colombia represents a compelling case study to address these gaps. As an upper-middle-income nation with significant internal economic diversity, it offers a unique setting to analyse the tension between ambitious environmental regulation and operational inertia. The country has established a robust legal architecture comprising the National Policy for Integral Solid Waste Management (CONPES 3874) [25], the National Circular Economy Strategy [26], and the recent Law 2294 of 2023, known as the National Development Plan 2022-2026 [27], which mandates a Zero Waste programme to transform landfills into technological parks.
However, a critical disjuncture exists between these normative aspirations and the material reality. Despite the legislative push towards valorisation, the country remains structurally locked-in to a linear disposal model, since recent sectorial reports indicate that 96.7% of disposed MSW is channelled to sanitary landfills—many facing critical lifespan shortages—while the remaining 3.3% persists in open dumps or transitional cells, primarily in rural jurisdictions. These shares refer to disposed rather than total MSW, with formal recovery measured separately and still marginal [28].This overwhelming dependency suggests that the low cost of landfilling has effectively neutralised instruments designed to promote recovery, creating a paradox where policy sophistication outpaces infrastructure transition.
Furthermore, the effectiveness of these policies displays a profound spatial bias that necessitates a heterogeneous analytical approach. Evidence from the Utilization Sectorial Report [29] reveals that while recycling schemes are maturing under progressive tariff frameworks in major metropolitan areas, they remain negligible in the periphery. An analysis of policy execution confirms this asymmetry; whereas actions supporting recycling in the 13 main cities achieved 100% completion (CONPES 3874), the mechanism for monitoring the investment of national transfers in MSW management plans recorded 0% progress [30]. This asymmetry motivates our hypothesis that recovery in wealthy municipalities is institutionally driven rather than a spontaneous market response, whereas smaller municipalities remain coupled to disposal under weaker fiscal oversight.
This study fills a gap in the literature by testing the validity of the WKC hypothesis for MSW in Colombia using a high-granularity dataset covering 1,101 municipalities from 2011 to 2023. Unlike previous research, we examine both waste generation decoupling and the substitution effect to determine if economic growth actively reallocates resources towards circular value chains. These dynamics bear directly on how circular-economy policy should be calibrated to sub-national realities.
We investigate three questions. First, whether rising municipal income is associated with a decline in per-capita landfilling, as the WKC predicts. Second, whether material recovery grows faster than disposal as income rises, consistent with a relative substitution towards circularity. Third, how these relationships vary across the municipal hierarchy. We deliberately study aggregate disposed and recovered mass rather than individual material streams, and we treat the estimated relationships as associational, given the observational design and the known limitations of GDP per capita as a proxy for household consumption. Establishing these patterns is essential to judge whether Colombia’s upper-middle-income status marks a genuine inflection point for environmental stewardship or merely reinforces a linear disposal model.
2. Materials and Methods
2.1. Study Area and Policy Framework
The Colombian regulatory framework, specifically the National Policy for the Integrated Management of Solid Waste (CONPES 3874/2016) [30], aims to migrate from a linear collection-and-disposal model to a circular system by 2030 through 41 specific tactical actions. Unlike other contexts where the technique effect is assumed to be market-driven, Colombia attempts to engineer this decoupling through state intervention.
This study aggregates the most critical tactical actions of the Colombian CONPES 3874 into six overarching conceptual categories to systematically evaluate this domestic framework: Economic Instruments & Price Signals—intended to align disposal tariffs with environmental externalities—(e.g., Actions 1.2, 1.20); Market Incentives & Extended Producer Responsibility (EPR) (e.g., Actions 1.3, 1.6, 1.7); Market Rules & Distortion Corrections aiming to create demand for by-products and correct monopolies (e.g., Actions 2.2, 3.5); Infrastructure, Technology & Sanitary Targets (e.g., Actions 1.8, 1.18, 1.19); Institutional Capacity, Fiscal Oversight & Formalisation (e.g., Actions 3.4, 3.7, 3.10); and Information & Monitoring Systems (e.g., Actions 4.4, 4.5).
These specific conceptual categories serve as the institutional baseline used to ground and contrast the econometric results against the actual progress of MSW management public policy implementation. A comprehensive audit detailing the execution progress of all 41 individual actions is provided in Annex A of the Supplementary Material.
2.2. Data Sources and Panel Construction
The empirical analysis relied on an unbalanced annual municipal panel constructed from five official Colombian government sources covering the period 2011 to 2023, retaining municipalities with at least eight years of records. The disposal panel comprises 14,067 municipality-year observations for up to 1,101 municipalities, of which 919 span the full 13 years, and missing disposal tonnage was completed by linear interpolation, affecting 1.4% of cells. Historical records of MSW disposal and recovery were obtained from the SSPD [31]. This dataset included the exact tonnage of MSW landfilled (2011–2023) and materials recovered through recycling (2016–2023).
Regarding economic and demographic data, municipal GDP and population projections were sourced from the National Administrative Department of Statistics [32,33]. To ensure comparability, nominal GDP values were deflated to constant 2015 prices using the Consumer Price Index (CPI) also provided by DANE [34]. Furthermore, concerning institutional controls, municipal categories were retrieved from the General Accounting Office of the Nation [35].
In Colombia, municipal categories are legally established in accordance with Law 136 of 1994, enacted by the Congress of the Republic of Colombia [36]. This regulatory framework classifies jurisdictions based on two specific criteria, namely demographic size (number of inhabitants) and fiscal capacity, measured by Unrestricted Current Revenues (UCR) expressed as multiples of National Minimum Wages (NMW), as outlined in Table 1.
Furthermore, in terms of geographic controls, the total surface area (km2) for each municipality was extracted from the official shapefiles provided by the Geographic Institute Agustín Codazzi [37]. Finally, the specific urban area polygons were obtained from the national geostatistical framework (NGF) managed by DANE [38], allowing for the precise calculation of urban and rural population densities.
2.3. Variable Construction
Ensuring the comparability of the econometric estimates required normalising and transforming the key variables prior to analysis. Throughout, per-capita disposal, per-capita recovery, real GDP per capita and urban density enter in natural logarithms, so that their coefficients are elasticities, whereas the urban-population share and the working-age and elderly population shares enter in levels expressed in percentage points, so that their coefficients are semi-elasticities. The dependent variable for disposal, per capita disposal (), was calculated from the total annual tonnage of waste landfilled () relative to the total population (), according to Equation (1):
Substitution effect was analysed by defining Per Capita Recovery () based on the total annual tonnage of recovered materials (), as expressed in Equation (2):
Both indicators are expressed in kilograms per capita per year, and the constant 103 in Equations (1) and (2) represents the tonnes to kilograms conversion factor . The primary independent variable, Real GDP per capita (), was deflated to constant 2015 prices using the national CPI () to control for inflation, as shown in Equation (3):
Furthermore, to capture the urbanization effect, the Urban Population Share () was defined as the proportion of the population living in the urban core () relative to the , according to Equation (4):
We explicitly accounted for population age structure, given that consumption habits vary across life stages. The model included the Working-Age Population () Share (15 years to 64 years) and the Elderly Population () Share (65 years and over). The share of young population () (<15 years) was used as the implicit baseline reference to avoid multicollinearity.
Additionally, Urban Density () served as a proxy for spatial concentration and was computed using the specific urban polygon area (), following Equation (5):
2.4. Econometric Strategy
WKC hypothesis was assessed via a step-wise estimation strategy comprising four distinct models. This approach facilitated the observation of income coefficient sensitivity to geographic and demographic controls while validating the functional form.
The general model specification was established according to Equation (6):
Where represents the degree of the income polynomial () and denotes the number of active control variables in the specification (). Furthermore, is the constant term (intercept), represents the coefficients for the polynomial terms of income, and corresponds to the coefficients for the vector of controls , Finally, captures the unobserved, time-invariant heterogeneity specific to each municipality, and constitutes the idiosyncratic error term.
We adopted a hierarchical modelling approach to systematically evaluate the stability of the income coefficients and control for potential omitted variable bias. This progressive specification strategy allowed us to disentangle the pure income effect from confounding structural factors such as spatial concentration and demographic transitions. Consequently, we estimated four specific models. First, Model 1 (M1), the Basic Specification, assessed the baseline relationship using only Income and Income squared (). This model established the raw correlation without controls; Second, Model 2 (M2) represented the geographic specification and incorporated geographic controls (Urban Density and Urbanization Rate) to account for spatial factors (); Third, Model 3 (M3) was the Demographic Specification and acted as the preferred full specification, adding demographic controls (Working-Age and Elderly population shares) to account for lifecycle consumption patterns (); Finally, Model 4 (M4), the Cubic Specification, extended the full specification by including the cubic income term to assess for an N-shaped trajectory ().
For each models, we estimated both Fixed Effects (FE) and Random Effects (RE) and performed the Hausman specification test to determine the optimal estimator. Specifically, if the p-value was below the 0.05 significance level, indicating a rejection of the null hypothesis, we reported the FE model since the RE estimator is inconsistent due to correlation between unobserved heterogeneity and regressors; conversely, if the p-value was equal to or above 0.05, failing to reject the null hypothesis, we reported the RE model as it yields more efficient estimates.
2.5. Hypothesis Testing and Turning Point Calculation
The validity of the WKC was determined not merely by the sign of the coefficients, but by their statistical significance. We classified the curve shape based on the robust significance of the quadratic () and cubic () terms at the 0.05 level. Specifically, an Inverted U-Shape was confirmed if was positive and was negative, and statistically significant, which allowed for the calculation of the turning point (), according to Equation (7):
A Monotonic Increasing relationship was identified if was positive while was not significant. Similarly, an N-Shaped trajectory was established if was positive, was negative, and the cubic term was positive and significant in M4.
2.6. Modelling the Substitution Effect
A secondary objective of this research was to evaluate whether economic growth drives a structural substitution from disposal to recovery. We modelled the recovery rate, defined as the ratio of recovered material to total waste generation, as a function of municipal income. This analysis assessed the hypothesis that circular economy practices behave as luxury goods that are only adopted once municipalities reach a certain level of fiscal capacity and institutional maturity. The specification adopted for the model is represented by Equation (8):
Where represents the constant term (intercept), whilst denotes the coefficients for the polynomial terms of income (), specifically evaluating the elasticity and curvature of the recovery curve. Furthermore, corresponds to the coefficients for the control variables ( for the full specification). Additionally, accounts for the municipality-specific heterogeneity in recycling infrastructure, and represents the idiosyncratic error term.
We applied the same data-driven selection protocol (Hausman test) to choose between FE and RE. The substitution hypothesis was assessed by comparing the income elasticity of recovery () against the disposal elasticity ( from M3). If exceeded , it indicated a relative substitution in which recovery expands more rapidly with income even as landfilling keeps rising. Because disposal itself does not fall, we read this as faster relative growth of recovery rather than displacement of landfilling. We tested it on the common 2016-2023 sample of municipalities reporting both streams, using a stacked specification whose cross-equation interaction formally compares the two income slopes, together with a Heckman model to correct for non-random recovery reporting.
As a robustness check against the many near-zero recovery values that inflate elasticities estimated in logarithms, we also re-estimated the full recovery specification with the dependent variable expressed as its inverse hyperbolic sine, asinh(V), which is defined at zero and approximates the natural logarithm for larger values, and we report this variant as M3-IHS.
2.7. Heterogeneity Analysis by Municipal Category
Given the administrative diversity of Colombia, national aggregates may mask local dynamics. We performed a disaggregated analysis estimating the WKC model independently for each municipal category (Special-tier, First-tier to Sixth-tier). To maximize the robustness of local findings, we implemented a hypothesis-driven model selection protocol for each category.
Instead of imposing a single functional form, we estimated the candidate specifications (M1 to M4) and selected the optimal model based on a hierarchical criterion. First, statistical significance was prioritized; we selected the specification where the income coefficients () evaluating the relevant hypothesis were statistically significant (p < 0.05). If multiple specifications satisfied this condition, or if none did, the Standard R-squared () was used as the deciding metric to maximize explanatory power. Finally, we applied the Hausman test to determine whether the FE or RE estimator was statistically more appropriate. This approach ensured that the reported elasticities and turning points were derived from the model that best captured the specific data-generating process of each municipal category.
2.8. Robustness Checks
2.8.1. Adjusting for Informal Recycling Censoring
Official recovery data systematically under-reports informal recycling activities, particularly in rural jurisdictions (Fourth-tier to Sixth-tier categories) where formal measurement frameworks are largely absent. To test whether the high-income elasticity of recovery (the substitution effect) was merely a statistical artefact of urban formalisation, we conducted a sensitivity analysis. We simulated an upper-bound scenario by artificially inflating the reported per capita recovery volumes in Fourth-tier to Sixth-tier category municipalities by a conservative margin of 20%, representing the estimated contribution of the informal sector. This adjusted recovery variable was defined in Equation (9):
Where represents the simulated per capita recovery volume adjusting for unrecorded informal activities, and denotes the originally reported formal per capita recovery. The full recovery specification presented in Equation (8) was then re-estimated using this simulated dependent variable to verify if the structural disparity in income elasticity between disposal and recovery held despite this adjustment.
2.8.2. Spatial Econometric Modelling
Waste disposal may exhibit spatial dependence owing to the regional nature of landfills and shared infrastructure. We built a row-standardised Queen-contiguity weight matrix from the official municipal polygons and applied panel-appropriate diagnostics, namely the Pesaran CD test for cross-sectional dependence and the spatial LM tests for lag and error, complementing a global Moran’s I on the temporally averaged residuals. We then estimated a Spatial Autoregressive (SAR) lag model on the connected balanced subset by both Generalized Method of Moments (GMM) and maximum likelihood (ML), and re-estimated the non-spatial preferred model on the identical subset to distinguish a genuine spatial signal from the change in sample. The SAR incorporated a spatially lagged dependent variable, as specified in Equation (10):
Where is the spatial autoregressive coefficient that captures the magnitude and direction of the spillover effect from neighbouring areas. The term represents the specific spatial weights within the row-standardised contiguity matrix, with being the total number of spatial units (municipalities). Consequently, constituted the spatially lagged dependent variable, effectively measuring the weighted average of waste disposal in adjacent jurisdictions.
2.8.3. Non-Parametric Estimation
Traditional WKC literature relies heavily on quadratic and cubic polynomials, which can artificially force the data into symmetric parabolic or N-shaped trajectories and are highly sensitive to outliers. To verify that our findings were not a consequence of parametric restrictions, we relaxed the functional form assumption by estimating a Generalised Additive Model (GAM). Instead of predefined polynomials, the GAM employed penalised smoothing splines for the income variable, allowing the data to empirically dictate the shape of the relationship between economic growth and waste generation, as expressed in Equation (11):
Where denotes the penalised smoothing spline function applied exclusively to the income variable, while the demographic and geographic controls remained strictly linear. We compared the shape of the resulting non-parametric curves against our parametric findings to confirm their robustness.
3. Results
3.1. Descriptive Statistics of Variables
The descriptive analysis depicted in Figure 1 reveals a clear structural gradient across the administrative categories. Landfilled waste (Figure 1a) and formal recycling (Figure 1b) exhibit a monotonic decrease from Special-tier to Sixth-tier municipalities. Notably, recovery activities display a pronounced right skew across all tiers, with the highest medians concentrated exclusively in the upper-tier categories.
Socioeconomic and demographic indicators follow a corresponding stratification. Urban population share (Figure 1c) and urban density (Figure 1h) consistently decline towards lower-tier municipalities. GDP per capita (Figure 1d) reflects a similar downward trend, albeit with an observable peak in Third-tier Category. Demographically, the young population share (Figure 1e) increases progressively towards rural jurisdictions (Category 6), whereas the working-age (Figure 1f) and elderly (Figure 1g) populations present higher median shares in metropolitan centres.
3.2. Step-Wise WKC Estimation Results
The step-wise estimation visualised in Figure 2 illustrates the WKC’s high sensitivity to model specification. Figure 2a displays a pronounced inverted U-shaped trajectory with a clearly defined turning point for M1. However, as geographic (Figure 2b, M2) and demographic (Figure 2c, M3) controls were sequentially introduced, the curve progressively flattened. In the preferred full specification (Figure 2c, M3) and its cubic extension (Figure 2d, M4), the visual turning point completely disappeared, neutralising the initial decoupling trend.
Complementing these visual trajectories, the embedded econometric parameters confirmed the statistical mechanics behind this flattening. While the baseline specification (M1) was driven by highly significant linear and quadratic income terms that mathematically define the inverted U-shape, this dynamic is structurally dependent. Introducing geographic controls (M2) reduced the significance of the quadratic term, shifting the curve to a monotonic increasing shape. Upon adding demographic controls in the full specification (M3), both income coefficients lost all statistical significance. Instead, urban density emerged as the dominant structural predictor with a significant positive elasticity (), alongside a significant positive coefficient on the elderly population share () (see Annex C in the Supplementary Material for further details). This confirms the absence of a direct polynomial relationship between economic growth and waste disposal, with the structural control variables driving the trajectory.
3.3. Step-Wise Substitution Effect Estimation Results
The step-wise estimation visualised in Figure 3 confirms a robust and distinct trajectory for waste recovery. Unlike the disposal models, the inverted U-shaped curve persisted across the first three specifications. From M1 to M3 (Figure 3a-Figure 3c), the visual turning point (red dashed line) remained clearly defined, although it progressively shifted leftwards as structural controls were added. The M4 (Figure 3d) failed to yield a coherent trajectory, exhibiting widened confidence intervals and a loss of the defined parabolic shape, resulting in a non-significant relationship.
Urban density exhibited a large positive elasticity (), complemented by a significant positive correlation with the elderly population share ().
3.4. Heterogeneity Analysis Results
The disaggregated analysis visualised in Figure 4 uncovered substantial heterogeneity in waste generation pathways across the administrative hierarchy. A pronounced inverted U-shaped trajectory with a clearly defined turning point appeared in three categories, namely the Special-tier (Figure 4a), the Third-tier (Figure 4d), and the Fifth-tier (Figure 4f). The remaining categories diverged from this pattern. The First-tier category (Figure 4b) showed no robust income relationship, the Second-tier category (Figure 4c) showed a convex U-shaped association, and the Fourth-tier (Figure 4e) and Sixth-tier (Figure 4g) categories showed flat, non-significant income relationships once controls were included.
Supporting these visual divergences, the estimated parameters confirm the statistical mechanics of each trajectory. A robust inverted U-shape, with significant positive linear and negative quadratic income terms, was confined to three categories, and their turning points rose from the Special-tier (24.7 million COP) through the Third-tier (29.4 million COP) to the Fifth-tier (50.5 million COP). This gradient therefore describes only the inverted-U subset rather than the administrative hierarchy as a whole. Among the remaining categories, the Second-tier displayed a convex (U-shaped) association, the Fourth- and Sixth-tier income terms were not significant once controls were included, and the First-tier showed no significant quadratic relationship, although an auxiliary cubic term was significant, indicating a volatile rather than a stable pattern. The previously reported rural turning point does not survive the preferred specification and is therefore not retained.
3.5. Robustness Checks Results
3.5.1. Recovery Robustness and Selection Correction
Table 2 reports the income elasticity of recovery across the robustness specifications. Inflating reported recovery in Fourth- to Sixth-tier municipalities by 20% left the elasticity essentially unchanged at 5.84 (p < 0.001). The inverse-hyperbolic-sine specification returned 2.77 (p < 0.001), the aligned 2016-2023 common sample returned 2.12 (p < 0.01), and the two-step Heckman model returned 1.27 (not significant) with an inverse Mills ratio of −0.87 (p < 0.001). In the stacked model on the aligned sample, the recovery income slope exceeded the disposal slope by 1.99 (p < 0.05).
3.5.2. Spatial Dependence Control
Panel-appropriate diagnostics indicated strong cross-sectional dependence (Pesaran CD = 204.6, p < 0.001) and significant spatial structure under both the lag (LM = 1566.7) and error (LM = 1737.4) tests (both p < 0.001), whereas a global Moran’s I on the temporally averaged residuals was inconclusive (Moran’s I = −0.0136, p = 0.7215). Estimated on the 916 connected municipalities of the balanced subset, the SAR panel model returned a stationary spatial autoregressive parameter (λ = 0.36 by maximum likelihood and 0.80 by GMM) and significant income terms defining an inverted U-shape (Figure 5). On the same subset, the non-spatial model also returned significant linear and quadratic income terms (0.426 and −0.065), reproducing the same curvature.
3.5.3. Non-Parametric Validation
The penalised smoothing spline for income was highly significant, with 4.5 effective degrees of freedom, and the model explained 60.4% of the deviance. As shown in Figure 6, the non-parametric relationship between income and waste disposal is predominantly monotonically increasing across the main data distribution, with a slight downturn at the extreme right tail where the confidence interval widens substantially.
4. Discussion
4.1. The Validity of the WKC in the Colombian Context
Evidence from this 13-year panel prompts a careful re-evaluation of the WKC hypothesis for an upper-middle-income LAC economy. While the basic specification (M1) was associated with an inelastic scale effect, where a 1% increase in per capita GDP corresponded to a 0.686% increase in landfilled waste, this apparent income-driven decoupling did not survive the addition of controls. In the preferred specification (M3), urban density was the dominant structural correlate, with an elasticity of 0.923. This suggests that the physical concentration of households and commercial activity, rather than purchasing power alone, is most strongly associated with mass landfilling. The positive association with the elderly population share may reflect settled consumption patterns or medicalised waste streams that resist source separation. Because the design relies on municipality fixed effects without an instrument, these relationships are associational rather than causal, and the income proxy is itself potentially endogenous to waste infrastructure.
This finding implies that Colombian economic growth will continue to drive monotonic increases in waste generation. Such persistence results from a historical success becoming a constraint. Regulations have effectively standardised landfilling as the sole viable option, creating a strong technological path dependence and solidifying a linear regime that the market struggles to exit.
This structural rigidity appears linked to weak price-signal mechanisms. Analysis of the national policy framework identifies critical stagnation regarding Economic Instruments & Price Signals (e.g., Action 1.2 on internalising environmental costs). With limited execution, tipping fees at sanitary landfills remain artificially suppressed, reflecting only operational costs. Delaying the incorporation of environmental externalities into tariffs (Action 1.20) sends misleading signals that render the transition to cleaner technologies economically irrational. Landfills remain dominant because the regulatory framework makes them the most cost-efficient option, not because they are socially optimal.
This distortion is compounded by a structural deficit on the demand side. Market Rules & Distortion Corrections (e.g., Action 2.2) show negligible progress. The state heavily regulates disposal supply, yet fails to cultivate markets for valorisation outputs. The technique effect predicted by WKC theory cannot materialise without demand-side incentives to counteract rising consumption. Consequently, high national dependency on landfills constitutes a dynamic equilibrium sustained by institutional failures. Unless correcting market distortions becomes a priority, Colombian growth will remain coupled to environmental degradation, making an income-driven inversion of the curve unlikely under the current framework.
4.2. The Substitution Effect: Is Recycling Decoupling Waste from Growth?
The analysis of the substitution effect provides compelling evidence of a structural transition towards a circular economy, heavily conditioned by state intervention. Unlike the inelastic response of landfilling, the baseline income elasticity for recycling (M1) was extraordinarily high (Figure 3a), an apparent income sensitivity that the robustness checks substantially qualify. Even after strictly controlling for geographic and demographic factors (Figure 3c, M3), the recovery income term remained significant, but its magnitude should not be read as a clean elasticity. Because recovery has many near-zero values in a small, selected sample, the log estimate is inflated, and it falls from about 5.9 under the naive model to 2.8 with an inverse-hyperbolic-sine transformation and to a non-significant 1.3 once selection into reporting is corrected. Recovery is therefore better understood as institutionally conditioned rather than as a spontaneous market preference, since transitioning to recovery becomes financially viable mainly in wealthy metropolitan agglomerations.
This geographic concentration correlated directly with national policy. Robust recovery rates in Special-tier municipalities aligned with the completion of Infrastructure & Technology Initiatives (e.g., Action 1.8), which prioritised recycling schemes in principal cities. Furthermore, Economic Instruments (e.g., Action 1.3) provided tariff subsidies to operationalise these schemes in high-density areas. By focusing support on urban centres, policy provided regulatory advantages to wealthier jurisdictions, inducing a correlation between income and recycling distinct from market-driven efficiencies.
A critical factor reinforcing this disparity is uneven labour force formalisation. While Institutional Capacity & Formalisation efforts (e.g., Action 3.4) reported national success, logistical capacity remained severely concentrated in capital cities. The substitution effect functionally depends on a state-recognised network of recyclers accessing tariff incentives. In rural territories where recycling remains informal due to gaps in Information & Monitoring Systems (e.g., Action 4.5), the mechanism for substituting disposal with recovery is institutionally absent.
Finally, persistent market failures threaten the sustainability of this substitution effect. Despite operational progress, initiatives targeting Market Rules & Distortion Corrections (e.g., Action 3.5) reported zero execution. The secondary material market remains volatile, relying heavily on cross-subsidies from sanitation tariffs rather than intrinsic economic value. Without correcting these distortions, recovery is likely to act as a subsidised public service rather than a self-sustaining activity, risking collapse if tariff frameworks alter.
4.3. Municipal Heterogeneity
The disaggregated analysis exposed a profound institutional schism. High-income metropolitan hubs (Special-tier category) showed incipient decoupling, with a boundary turning point near 24.7 million COP estimated on only a handful of municipalities (Figure 4a). However, this transition was volatile; the First-tier category exhibited an N-shaped rebound, signalling that without sustained price corrections, the income effect easily overpowers early technique effects. Intermediate tiers (Second-tier and Fourth-tier categories) displayed convex (U-shaped) or non-significant relationships, reflecting transitional friction where basic sanitation is achieved but circular infrastructure remains unviable. In stark contrast, the turning points for the Fifth- and Sixth-tier municipalities diverged, with the Fifth-tier threshold about twice that of the Special-tier and the Sixth-tier showing no significant income relationship once controls were included, so the rural majority has no identifiable turning point (Figure 4f and Figure 4g), structurally precluding them from the circular economy.
This econometric divergence suggests a direct manifestation of asymmetric policy implementation, which prioritised the operational efficiency of high-density areas over structural equity. While majority of open-air dumps were successfully closed nationally under Sanitary Infrastructure Targets (e.g., Actions 1.18, 1.19), the subsequent transition to valorisation bypassed low-income areas. The metropolitan core’s success aligned with the full execution of Infrastructure & Technology Initiatives (e.g., Action 1.8), providing targeted support that enabled urban decoupling. Conversely, intermediate and rural peripheries suffer from a fiscal oversight vacuum. Fiscal Oversight & Monitoring mechanisms (e.g., Action 3.7) reported zero progress, perpetuating inefficiencies in municipal sanitation investments.
Furthermore, the rural and intermediate crisis is exacerbated by the stagnation of Market Rules & Distortion Corrections (e.g., Action 3.5) and the slow advance of Institutional Capacity & Regionalisation schemes (e.g., Action 3.10). Without market corrections, dispersed markets cannot generate the volumes required to make recycling financially viable. The delay in regionalisation prevents the formation of inter-municipal clusters capable of overcoming the lack of scale observed in intermediate tiers. Consequently, the uniform regulatory framework has generated a dual regime comprised of a state-supported, functional market in metropolitan centres, and a fragmented, linear disposal system in the unmonitored periphery.
4.4. Robustness of the Econometric Estimates and Role of Control Variables
Before deriving broader policy implications, we assessed the integrity of the baseline estimates through several checks. Inflating rural recovery by 20% left the raw contrast between the disposal and recovery elasticities largely unchanged; however, because most rural municipalities report no recovery at all, this adjustment does not address the underlying selection, which a Heckman model shows to be substantial and which reduces the recovery elasticity to a non-significant level. Furthermore, the SAR model (Figure 5) indicated a stationary spatial parameter under both estimators (GMM 0.80, ML 0.36) and an inverted U-shaped income term with a turning point near 24.7 million COP. However, the same curvature also appeared when the non-spatial model was re-estimated on the identical connected subset, so it reflects the subsample composition as much as the spatial control. Because disposal tonnage is attributed to the municipality that generates the waste, this spatial correlation is consistent with regionalised landfilling but does not identify directional waste export, which we therefore treat as a hypothesis rather than a finding.
Finally, the non-parametric GAM (Figure 6) corroborated that the monotonic increase is an empirical reality across the main density of the data distribution, before flattening at the extreme right tail. Beyond the primary income-waste relationship, the control variables offer crucial insights. The substantial and positive elasticity of urban density for recovery reflects the logistical economies of scale required for viable recycling. Similarly, the positive correlation between the elderly population and recycling rates highlights the frugal, resource-conscious habits of older cohorts. Municipal strategies must leverage these realities by tailoring circular economy campaigns to established generational habits while heavily subsidising collection logistics in less dense, rural jurisdictions.
4.5. Policy Implications
This study highlights the urgent need to replace monolithic national policies with a stratified regulatory framework. While validating the National Development Plan 2022-2026 (Law 2294/2023), our analysis indicates that its implementation must explicitly target the specific econometric thresholds of each municipal category across the entire administrative spectrum.
Firstly, for the rural periphery (Fifth- and Sixth-tier categories), the distant Fifth-tier threshold and the absence of a significant income relationship in the Sixth tier mean that market mechanisms alone are insufficient. The priority must be sanitary stabilisation via differential schemes (Article 223, Law 2294/2023). However, this requires reactivating Fiscal Oversight mechanisms (e.g., Action 3.7) to ensure that new transfers do not repeat past inefficiencies.
Secondly, for intermediate municipalities (Second- to Fourth-tier categories), the policy approach must bridge the gap between basic disposal and advanced circularity. These jurisdictions lack metropolitan fiscal scale; therefore, their immediate priorities are sanitation stabilization and initial recycling system construction. Accelerating Institutional Capacity & Regionalisation schemes (e.g., Action 3.10) is essential to pool resources and jointly finance shared circular infrastructure.
Thirdly, regarding the Special-tier municipalities, these jurisdictions are the only ones approaching a decoupling threshold, albeit a boundary one estimated on a handful of municipalities (Figure 4a), shifting the policy priority to the Zero Waste programme and the transformation of landfills into Technology Parks. However, the First-tier category exhibits a more volatile trajectory without a stable decoupling point. For these high-income metropolitan areas, it is imperative to complete Economic Instruments & Price Signals policies (Actions 1.2, 1.20) to ensure the technique effect outpaces the income effect and prevents an N-shaped consumption rebound.
Finally, current regulatory uncertainty—evidenced by tariff freezes [39]—paralyses private investment in valorisation technologies. A clear transition roadmap must explicitly integrate informal recyclers through Formalisation Initiatives (Action 3.4). If Market Rules & Distortion Corrections (Action 3.5) remain unaddressed, Colombia risks a dual failure characterised by a sanitary crisis in the rural periphery and a financially stalled circular transition in metropolitan hubs.
4.6. Limitations and Future Research Directions
While leveraging a comprehensive dataset, results are conditioned by the official reporting system’s strict reliance on formal operators. Official audits [28,29,40] confirm severe institutional disparities. Only about 27% of municipalities report any formal recovery, with coverage falling from 86% in the Special-tier to 19% in the Sixth-tier, and 71% of national recovery is concentrated in the capital, while statistical imputation was required for a small share of rural disposal. Because recovery is measured almost exclusively where income and institutional capacity are highest, the naive income elasticity of recovery is upward biased, and our selection-corrected estimate indicates that much of the apparent effect reflects this coverage bias rather than a behavioural response.
Second, our analysis deliberately used aggregate disposed and recovered mass rather than the material-specific recovery streams that are in fact available, in order to keep the dependent variables comparable with the disposal series and aligned with the study’s research questions on aggregate decoupling and substitution. Aggregate mass is nonetheless affected by theoretical-actual generation discrepancies, construction-waste contamination, and unit-conversion errors, and future research should exploit the compositional streams to isolate stream-specific decoupling.
Third, several variables are potentially endogenous. Suppressed disposal tariffs act as implicit landfill subsidies that are omitted from the model, and GDP per capita is an imperfect proxy for household consumption, since municipalities with extractive activity post high sectoral output that is weakly related to the consumption that generates waste. Both features caution against a causal reading, and future studies should incorporate local tariffs and a consumption- or income-based proxy to separate price and income effects from sectoral distortion.
Finally, our spatial analysis detected strong cross-sectional dependence and a stationary spatial parameter, yet the inverted-U it produced was not robust to the connected subsample, so we report it as a qualified check rather than as evidence of cross-border export. Future research should pursue selection-aware re-estimation of recovery, validation of the income proxy against consumption measures, direct evidence on inter-municipal waste flows, and dynamic spatio-temporal models of how circular-economy and regionalisation schemes diffuse across jurisdictions over time.
5. Conclusions
This study shows that interpreting the WKC through aggregated national data obscures profound spatial inequalities in upper-middle-income economies. Rather than achieving genuine source reduction, landfilling remained coupled to income across the preferred and non-parametric estimators, and any apparent decoupling was confined to a few metropolitan municipalities at the boundary of the observed income range rather than reflecting a systemic transition.
Furthermore, our findings temper the assumption that circular economy transitions naturally accompany economic development. Material recovery grew faster than disposal with income, yet this relative substitution is concentrated in the minority of municipalities that report recovery and largely disappears once this selection is taken into account. The transition therefore remains heavily reliant on targeted state subsidies and formalisation networks currently concentrated in metropolitan centres, rather than emerging spontaneously from market forces.
Consequently, national regulatory frameworks suffer from a severe technological lock-in. Closing informal dumpsites historically established a systemic dependency on landfills, sustained by suppressed tariff structures that discourage private investment in valorisation. This inertia perpetuates a fragmented landscape where urban hubs begin decoupling while the rural majority remains structurally excluded from circularity.
Ultimately, achieving SDG 12 targets requires dismantling uniform regulatory approaches. Policymakers must deploy stratified instruments that enforce strict waste reduction mandates in mature urban economies while channelling substantial fiscal support to build shared regional infrastructure in historically neglected rural areas.
Supplementary Materials
The following supporting information can be downloaded at the website of this paper posted on Preprints.org. Annex A, audit of CONPES 3874 execution; Annex B, municipal solid waste panel 2011-2023; Annex C, detailed regression and diagnostic tables; Annex D, descriptive statistics by municipal category; Annex E, variable correlation matrix; Annex F, recovery robustness and selection-model outputs; Annex G, spatial analysis outputs; Annex H, non-parametric GAM output.
Author Contributions
Conceptualization, D.D.O.M., A.S.G. and J.J.C.E.; methodology, D.D.O.M. and J.J.C.E.; software, D.D.O.M.; validation, A.S.G.; formal analysis, D.D.O.M.; investigation, D.D.O.M.; resources, D.D.O.M.; data curation, D.D.O.M.; writing—original draft preparation, D.D.O.M.; writing—review and editing, A.S.G. and J.J.C.E.; visualization, D.D.O.M.; supervision, A.S.G.; project administration, J.J.C.E. All authors have read and agreed to the published version of the manuscript.
Funding
This research received no external funding.
Data Availability Statement
The original contributions presented in this study are included in the article/supplementary material. Further inquiries can be directed to the corresponding author(s).
Conflicts of Interest
The authors declare no conflicts of interest. The funders had no role in the design of the study; in the collection, analyses, or interpretation of data; in the writing of the manuscript; or in the decision to publish the results.
Abbreviations
The following abbreviations are used in this manuscript:
| CONPES | National Council for Economic and Social Policy (Colombia) |
| CPI | Consumer Price Index |
| DANE | National Administrative Department of Statistics |
| EKC | Environmental Kuznets Curve |
| FE | Fixed Effects |
| GAM | Generalised Additive Model |
| GMM | Generalized Method of Moments |
| HIS | Inverse Hyperbolic Sine |
| LAC | Latin America and the Caribbean |
| ML | Maximum Likelihood |
| MSW | Municipal Solid Waste |
| NMW | National Minimum Wage |
| RE | Random Effects |
| SAR | Spatial Autoregressive |
| SDG | Sustainable Development Goal |
| SSPD | Superintendency of Residential Public Utilities |
| UCR | Unrestricted Current Revenues |
| WKC | Waste Kuznets Curve |
References
- Chen, D.M.-C.; Bodirsky, B.L.; Krueger, T.; Mishra, A.; Popp, A. The World’s Growing Municipal Solid Waste: Trends and Impacts. Environmental Research Letters 2020, 15, 074021. [CrossRef]
- Kaza, S.; Yao, L.C.; Bhada-Tata, P.; Van Woerden, F. What a Waste 2.0: A Global Snapshot of Solid Waste Management to 2050; Washington, DC: World Bank, 2018; ISBN 978-1-4648-1329-0.
- Chen, C. Spatial Inequality in Municipal Solid Waste Disposal across Regions in Developing Countries. International Journal of Environmental Science and Technology 2010, 7, 447–456. [CrossRef]
- Zhang, C.; Dong, H.; Zeng, Y.; Geng, Y.; Liu, X.; Chen, W.; Fujii, M. Global Patterns and Mechanisms of Decoupling Municipal Solid Waste Generation from Economic Growth. Environ. Impact Assess. Rev. 2025, 115, 108041. [CrossRef]
- Grossman, G.; Krueger, A. Environmental Impacts of a North American Free Trade Agreement; Cambridge, MA, 1991;
- Magazzino, C.; Mele, M.; Schneider, N. The Relationship between Municipal Solid Waste and Greenhouse Gas Emissions: Evidence from Switzerland. Waste Management 2020, 113, 508–520. [CrossRef]
- Soukiazis, E.; Proença, S. The Determinants of Waste Generation and Recycling Performance across the Portuguese Municipalities – A Simultaneous Equation Approach. Waste Management 2020, 114, 321–330. [CrossRef]
- Ichinose, D.; Yamamoto, M.; Yoshida, Y. The Decoupling of Affluence and Waste Discharge under Spatial Correlation: Do Richer Communities Discharge More Waste? Environ. Dev. Econ. 2015, 20, 161–184. [CrossRef]
- Hoang, T.H.; Le, B.T.; Mai, T.T.X.; Pham, T.L. Green Governance and the EKC Hypothesis: Evidence from Vietnamese Provinces. Edelweiss Applied Science and Technology 2024, 8, 3218–3229. [CrossRef]
- Wang, K.; Zhao, X.; Peng, B.; Zeng, Y. Spatio-Temporal Pattern and Driving Factors of Municipal Solid Waste Generation in China: New Evidence from Exploratory Spatial Data Analysis and Dynamic Spatial Models. J. Clean. Prod. 2020, 270, 121794. [CrossRef]
- Wang, K.; Zhu, Y.; Zhang, J. Decoupling Economic Development from Municipal Solid Waste Generation in China’s Cities: Assessment and Prediction Based on Tapio Method and EKC Models. Waste Management 2021, 133, 37–48. [CrossRef]
- Cheng, J.; Shi, F.; Yi, J.; Fu, H. Analysis of the Factors That Affect the Production of Municipal Solid Waste in China. J. Clean. Prod. 2020, 259, 120808. [CrossRef]
- Mazzarano, M.; de Jaeger, S.; Rousseau, S. Non-Constant Income Elasticities of Waste Generation. J. Clean. Prod. 2021, 297. [CrossRef]
- İçen, H.; Çil, N. Investigating Municipal Waste Kuznets Curve for 22 OECD Countries. Environ. Monit. Assess. 2023, 195. [CrossRef]
- Xu, X.; Zhang, X.; Wu, Q. Testing the Existence of Waste Kuznets Curve Hypothesis in 45 Emerging Economies: Evidence from an e-Waste Panel Data Survey. J. Environ. Manage. 2025, 373. [CrossRef]
- Cavalheiro, E.A.; Machado, R.H.; Castro, A.S.; Falck, L.R. Urban Solid Waste Generation and GDP per Capita: A Global Analysis through the Lens of the Environmental Kuznets Curve. Contribuciones a las Ciencias Sociales 2024, 17, e5574. [CrossRef]
- Patiño, L.I.; Padilla Rosa, E.; Alcántara, V.; Raymond, J.L. The Relationship of Energy and CO2 Emissions with GDP per Capita in Colombia. Atmosphere (Basel). 2020, 11. [CrossRef]
- Laverde-Rojas, H.; Guevara-Fletcher, D.A.; Camacho-Murillo, A. Economic Growth, Economic Complexity, and Carbon Dioxide Emissions: The Case of Colombia. Heliyon 2021, 7. [CrossRef]
- Gómez Segura, C.F.; Cerquera Losada, Ó.H.; Acero Cebay, E.F. La Curva Medioambiental de Kuznets y El Crecimiento Económico Sostenible En Colombia. Apuntes del Cenes 2021, 40, 165–188. [CrossRef]
- Acevedo-Ramos, J.A.; Valencia, C.F.; Valencia, C.D. The Environmental Kuznets Curve Hypothesis for Colombia: Impact of Economic Development on Greenhouse Gas Emissions and Ecological Footprint. Sustainability (Switzerland) 2023, 15. [CrossRef]
- Ruiz-Agudelo, C.A.; Sánchez-Pérez, G.; Sáenz, J.E.; Higuera-Cárdenas, L.A. Biodiversity and Growth in Colombia, 1995–2015: An Approach from the Environmental Kuznets Hypothesis. Journal of Environmental Economics and Policy 2019, 8, 17–31. [CrossRef]
- Trujillo Lora, J.C.; Carrillo Bermúdez, B.; Charris Vizcaíno, C.A.; Iglesias Pinedo, W.J. The Environmental Kuzkets Curve (EKC): An Anlaysis Landfilled Solid Waste In Colombia. rev.fac.cienc.econ 2013, XXI, 7–16.
- Sagastume Gutiérrez, A.; Mendoza Fandiño, J.M.; Cabello Eras, J.J. Alternatives of Municipal Solid Wastes to Energy for Sustainable Development. The Case of Barranquilla (Colombia). International Journal of Sustainable Engineering 2021, 14, 1809–1825. [CrossRef]
- Otero Meza, D.D.; Sagastume Gutiérrez, A.; Cabello Eras, J.J.; Salcedo Mendoza, J.; Hernández Ruydíaz, J. Techno-Economic and Environmental Assessment of the Landfill Gas to Energy Potential of Major Colombian Cities. Energy Convers. Manag. 2023, 293, 117522. [CrossRef]
- DNP Política Nacional Para La Gestión Integral de Residuos Sólidos (CONPES 3874 de 2016) Available online: https://www.minambiente.gov.co/documento-normativa/conpes-3874-de-2016/ (accessed on 15 January 2026).
- GRC Estrategia Nacional de Economía Circular Available online: https://www.minambiente.gov.co/asuntos-ambientales-sectorial-y-urbana/estrategia-nacional-de-economia-circular/ (accessed on 15 January 2026).
- DNP Ley 2294 de 2023; Diario Oficial 52.400: Colombia, 2023;
- SSPD Informe Nacional de Disposición Final de Residuos Sólidos En Colombia En El Año 2024 Available online: https://www.superservicios.gov.co/publicaciones (accessed on 18 January 2026).
- SSPD Informe Sectorial de La Actividad de Aprovechamiento Vigencia 2024 Available online: https://www.superservicios.gov.co/publicaciones (accessed on 18 January 2026).
- DNP Documento CONPES - 3874 Available online: https://sisconpes.dnp.gov.co/SisCONPESWeb//AccesoPublico/Documento/ylYdq9XjHKA (accessed on 18 January 2026).
- SSPD Serie Histórica Informe Nacional de Disposición Final y Aprovechamiento Available online: https://www.superservicios.gov.co/publicaciones (accessed on 15 January 2026).
- DANE Valor Agregado Por Municipio: Serie 2011-2023 Provisional Available online: https://www.dane.gov.co/index.php/estadisticas-por-tema/cuentas-nacionales/cuentas-nacionales-departamentales (accessed on 15 January 2026).
- DANE Proyecciones y Retroproyecciones de Población Municipal Para El Periodo 1985-2017 y 2018-2042 Con Base En El CNPV 2018 Available online: https://www.dane.gov.co/index.php/estadisticas-por-tema/demografia-y-poblacion/proyecciones-de-poblacion (accessed on 15 January 2026).
- DANE Índice de Precios al Consumidor -IPC- Histórico Available online: https://www.dane.gov.co/index.php/estadisticas-por-tema/precios-y-costos/indice-de-precios-al-consumidor-ipc/ipc-historico#indice-de-precios-al-consumidor-ipc-2025 (accessed on 15 January 2026).
- CGN Históricos Hasta Vigencia 2025 Available online: https://www.contaduria.gov.co/categorizacion-de-departamentos-distritos-y-municipios (accessed on 15 January 2026).
- CRC Ley 136 de 1994: Por La Cual Se Dictan Normas Tendientes a Modernizar La Organización y El Funcionamiento de Los Municipios Available online: https://www.funcionpublica.gov.co/eva/gestornormativo/norma.php?i=329.
- IGAC Base de Datos Vectorial Básica. Colombia. Escala 1:500.000. Año 2014 Available online: https://www.colombiaenmapas.gov.co/ (accessed on 15 January 2026).
- DANE Centros Poblados y Cabeceras Municipales de Colombia Available online: https://www.colombiaenmapas.gov.co/ (accessed on 15 January 2026).
- Leguizamón Viasus, K. Al Borde de Una Crisis Sanitaria Quedó Bogotá Por La Ratificación Del Rechazo al Nuevo Modelo de Aseo. Infobae 2025.
- SSPD Informe Nacional de Coberturas de Los Servicios Públicos de Acueducto, Alcantarillado y Aseo: Vigencia 2024 Available online: [https://www.superservicios.gov.co/publicaciones](https://www.superservicios.gov.co/publicaciones) (accessed on 6 April 2026).
Figure 1.
Distribution plots of the variables by category.
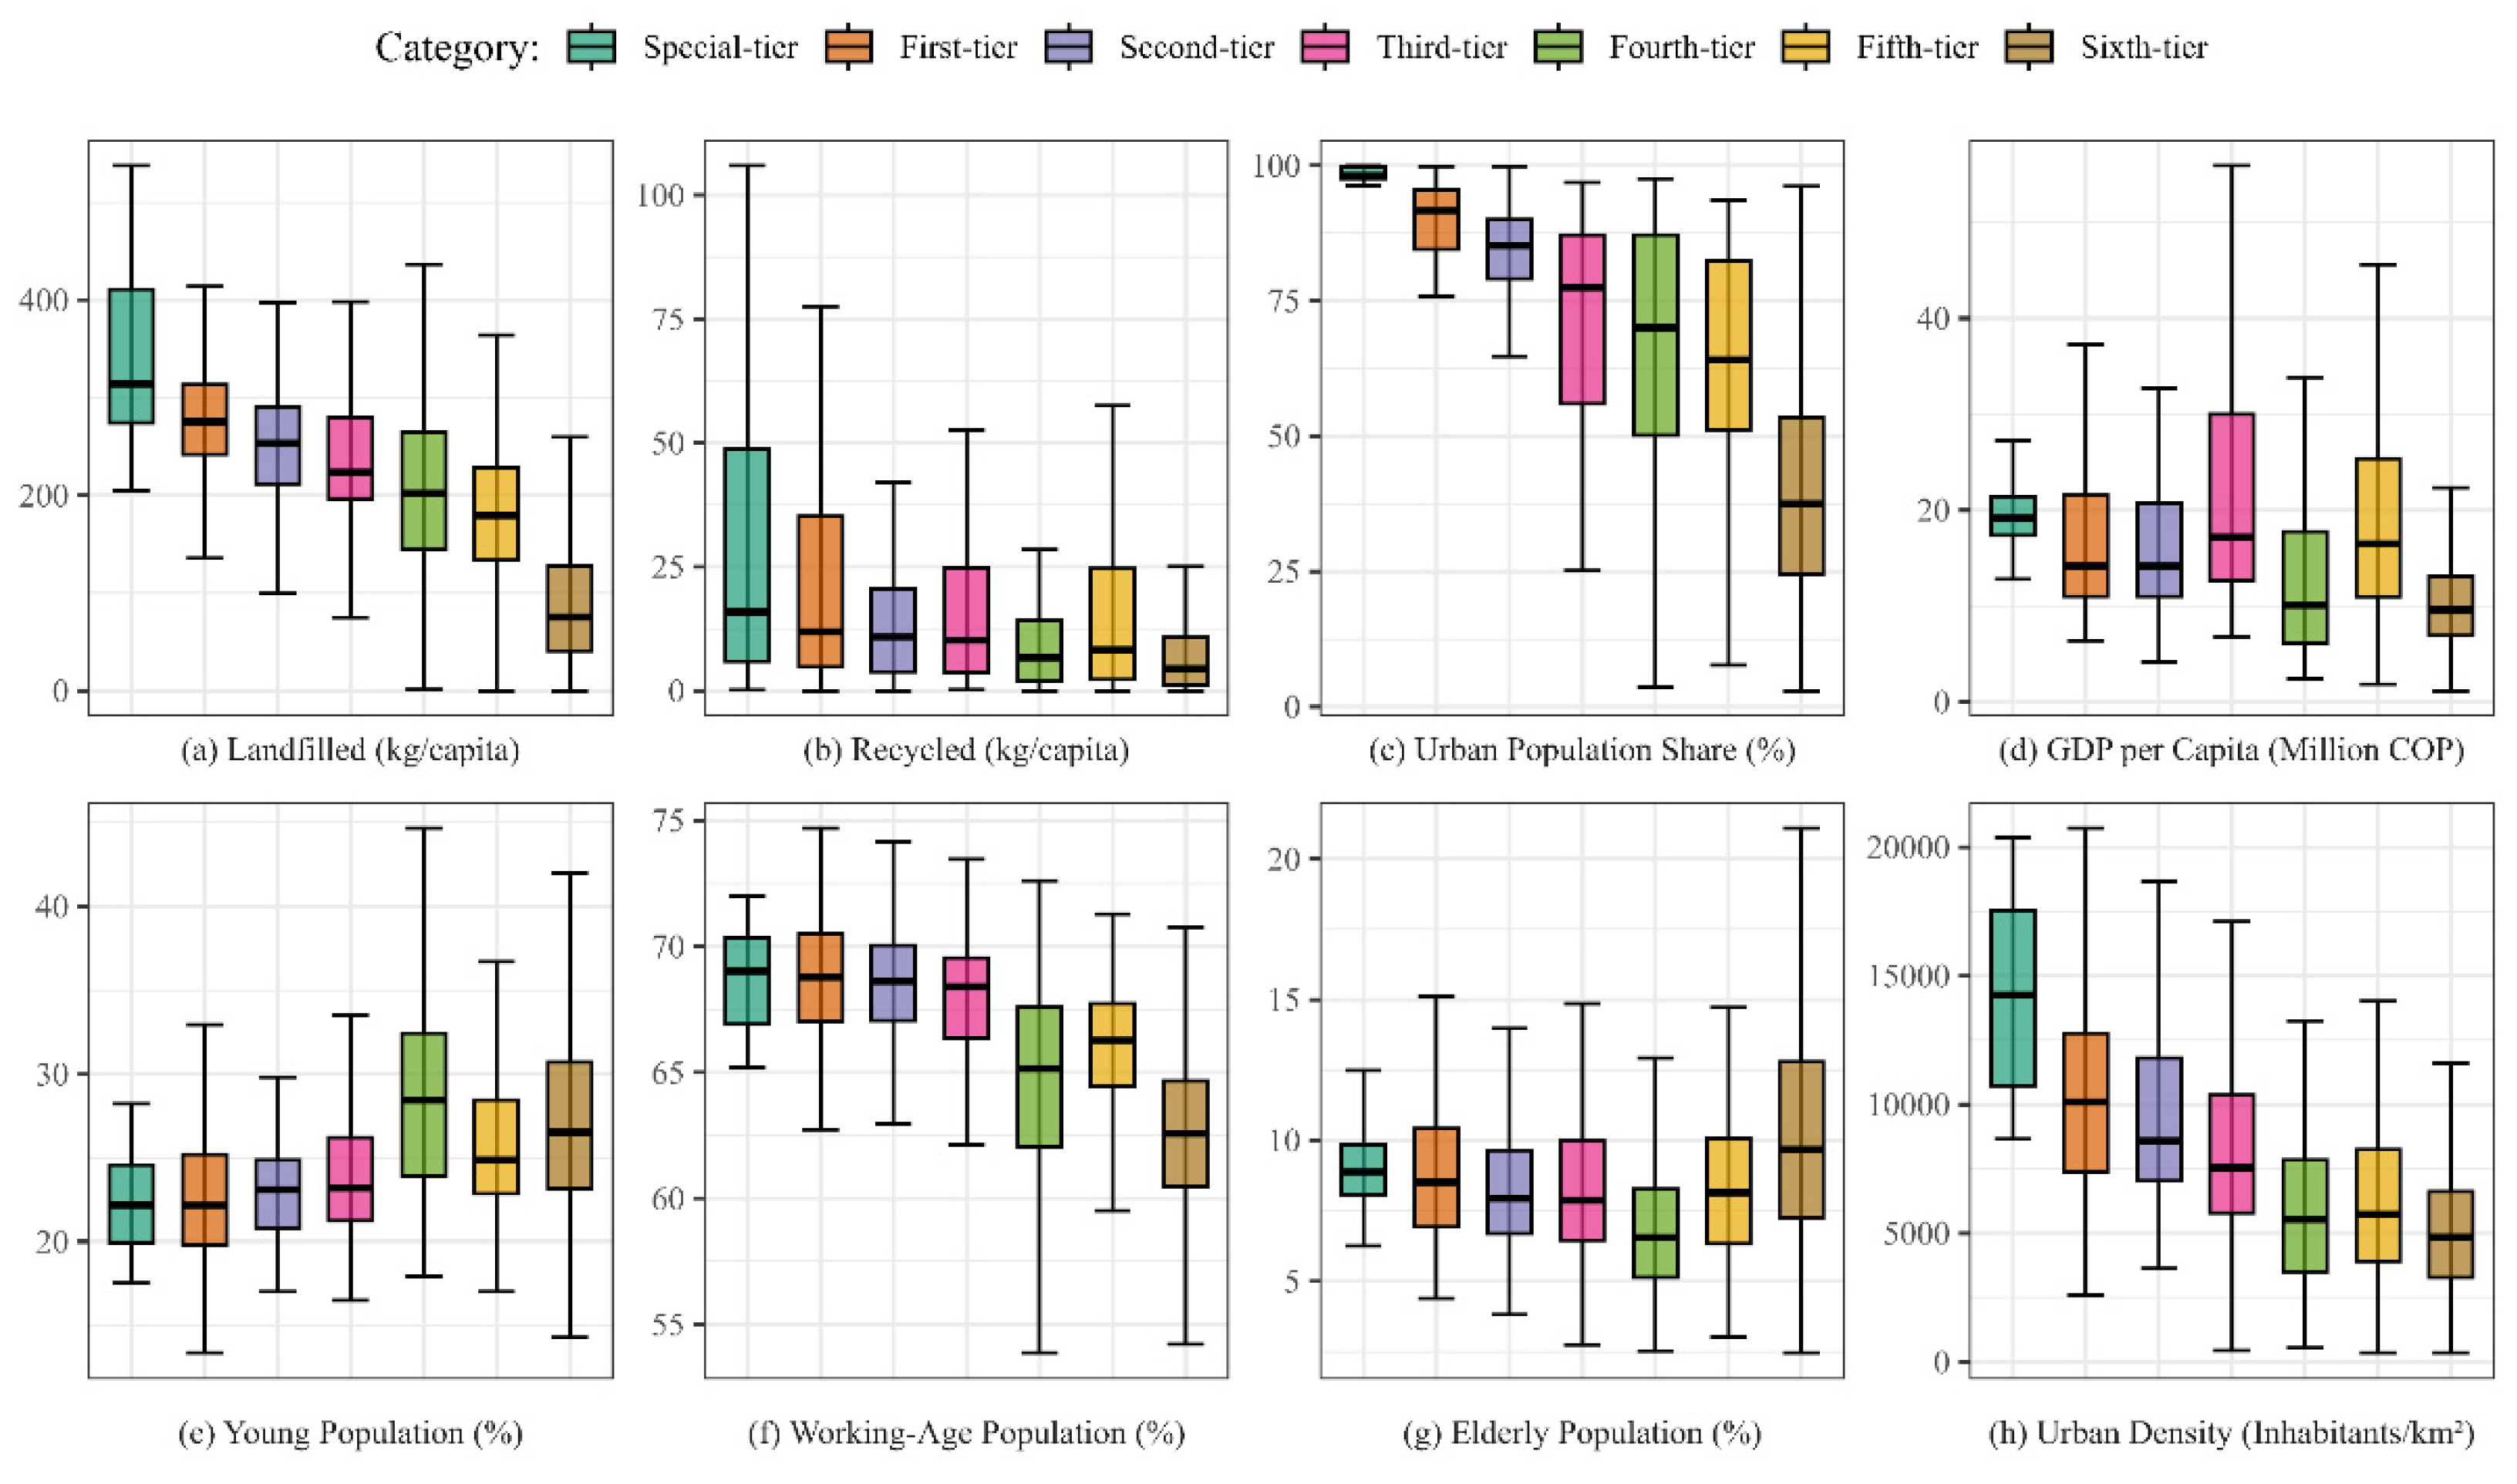
Figure 2.
Step-wise WKC Estimation Results for Landfilling.
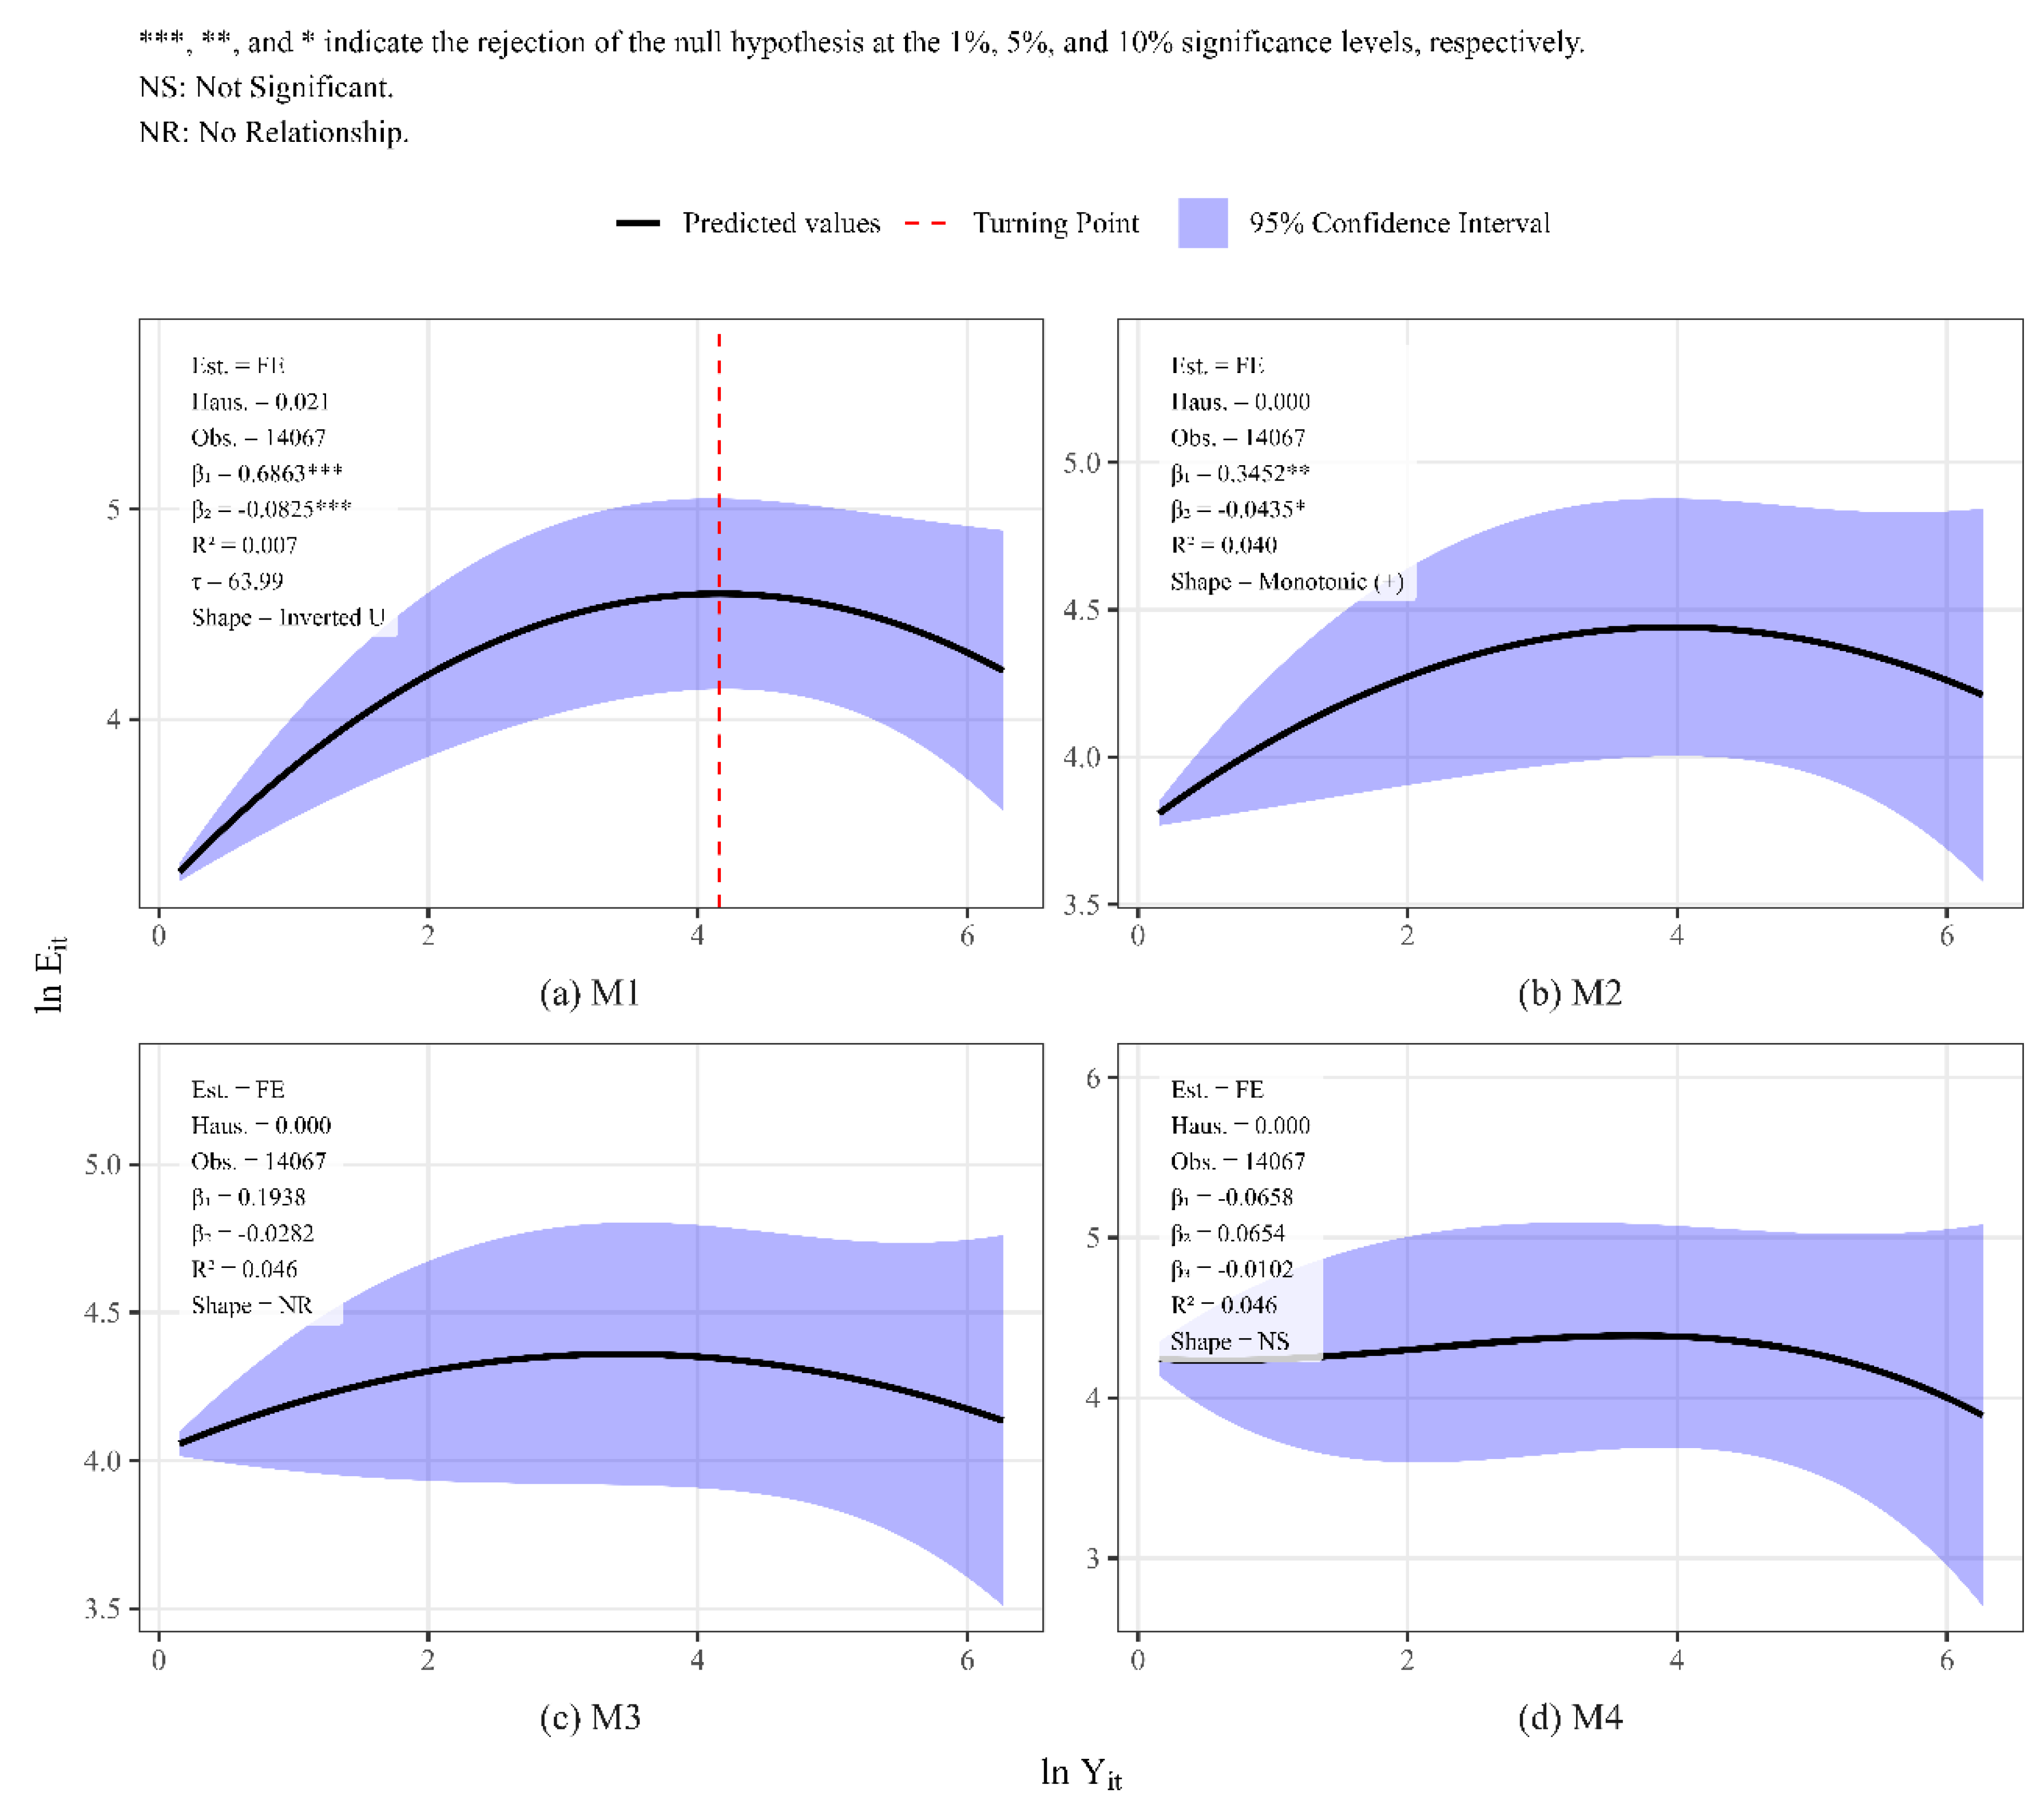
Figure 3.
Step-wise Substitution Effect Estimation Results for Recycling.
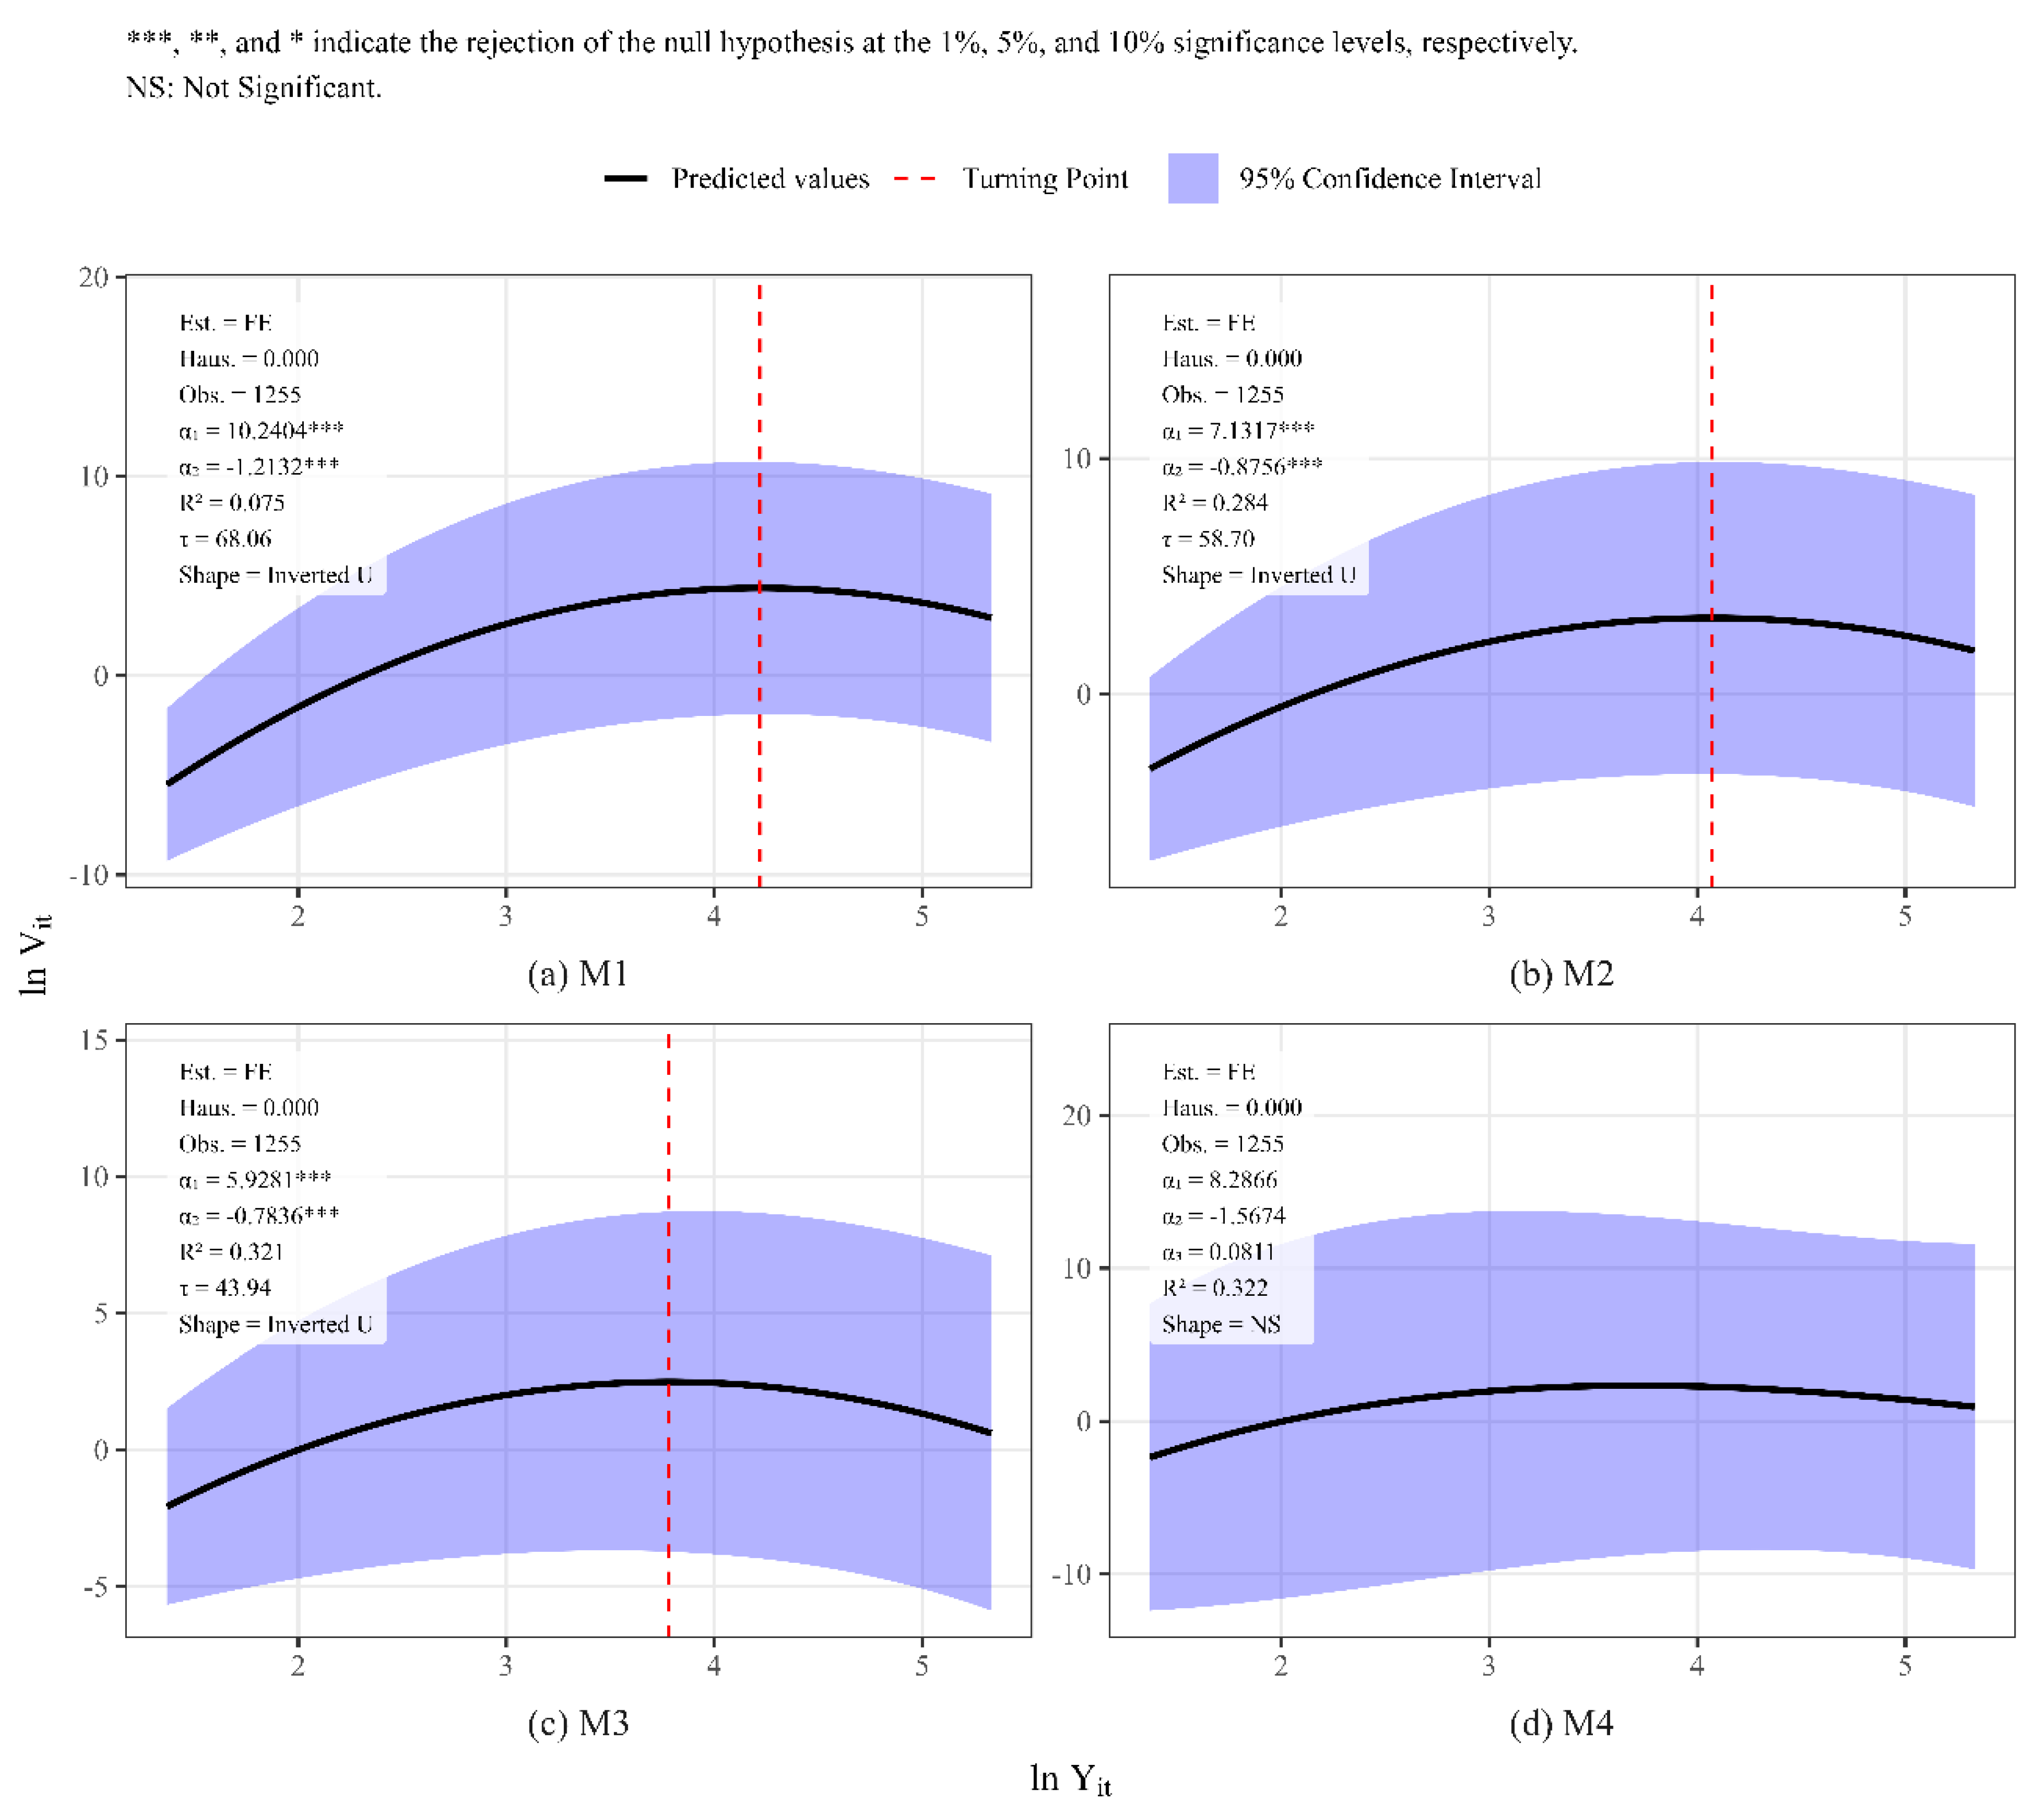
Figure 4.
Predicted WKC and Data Distribution by Category.
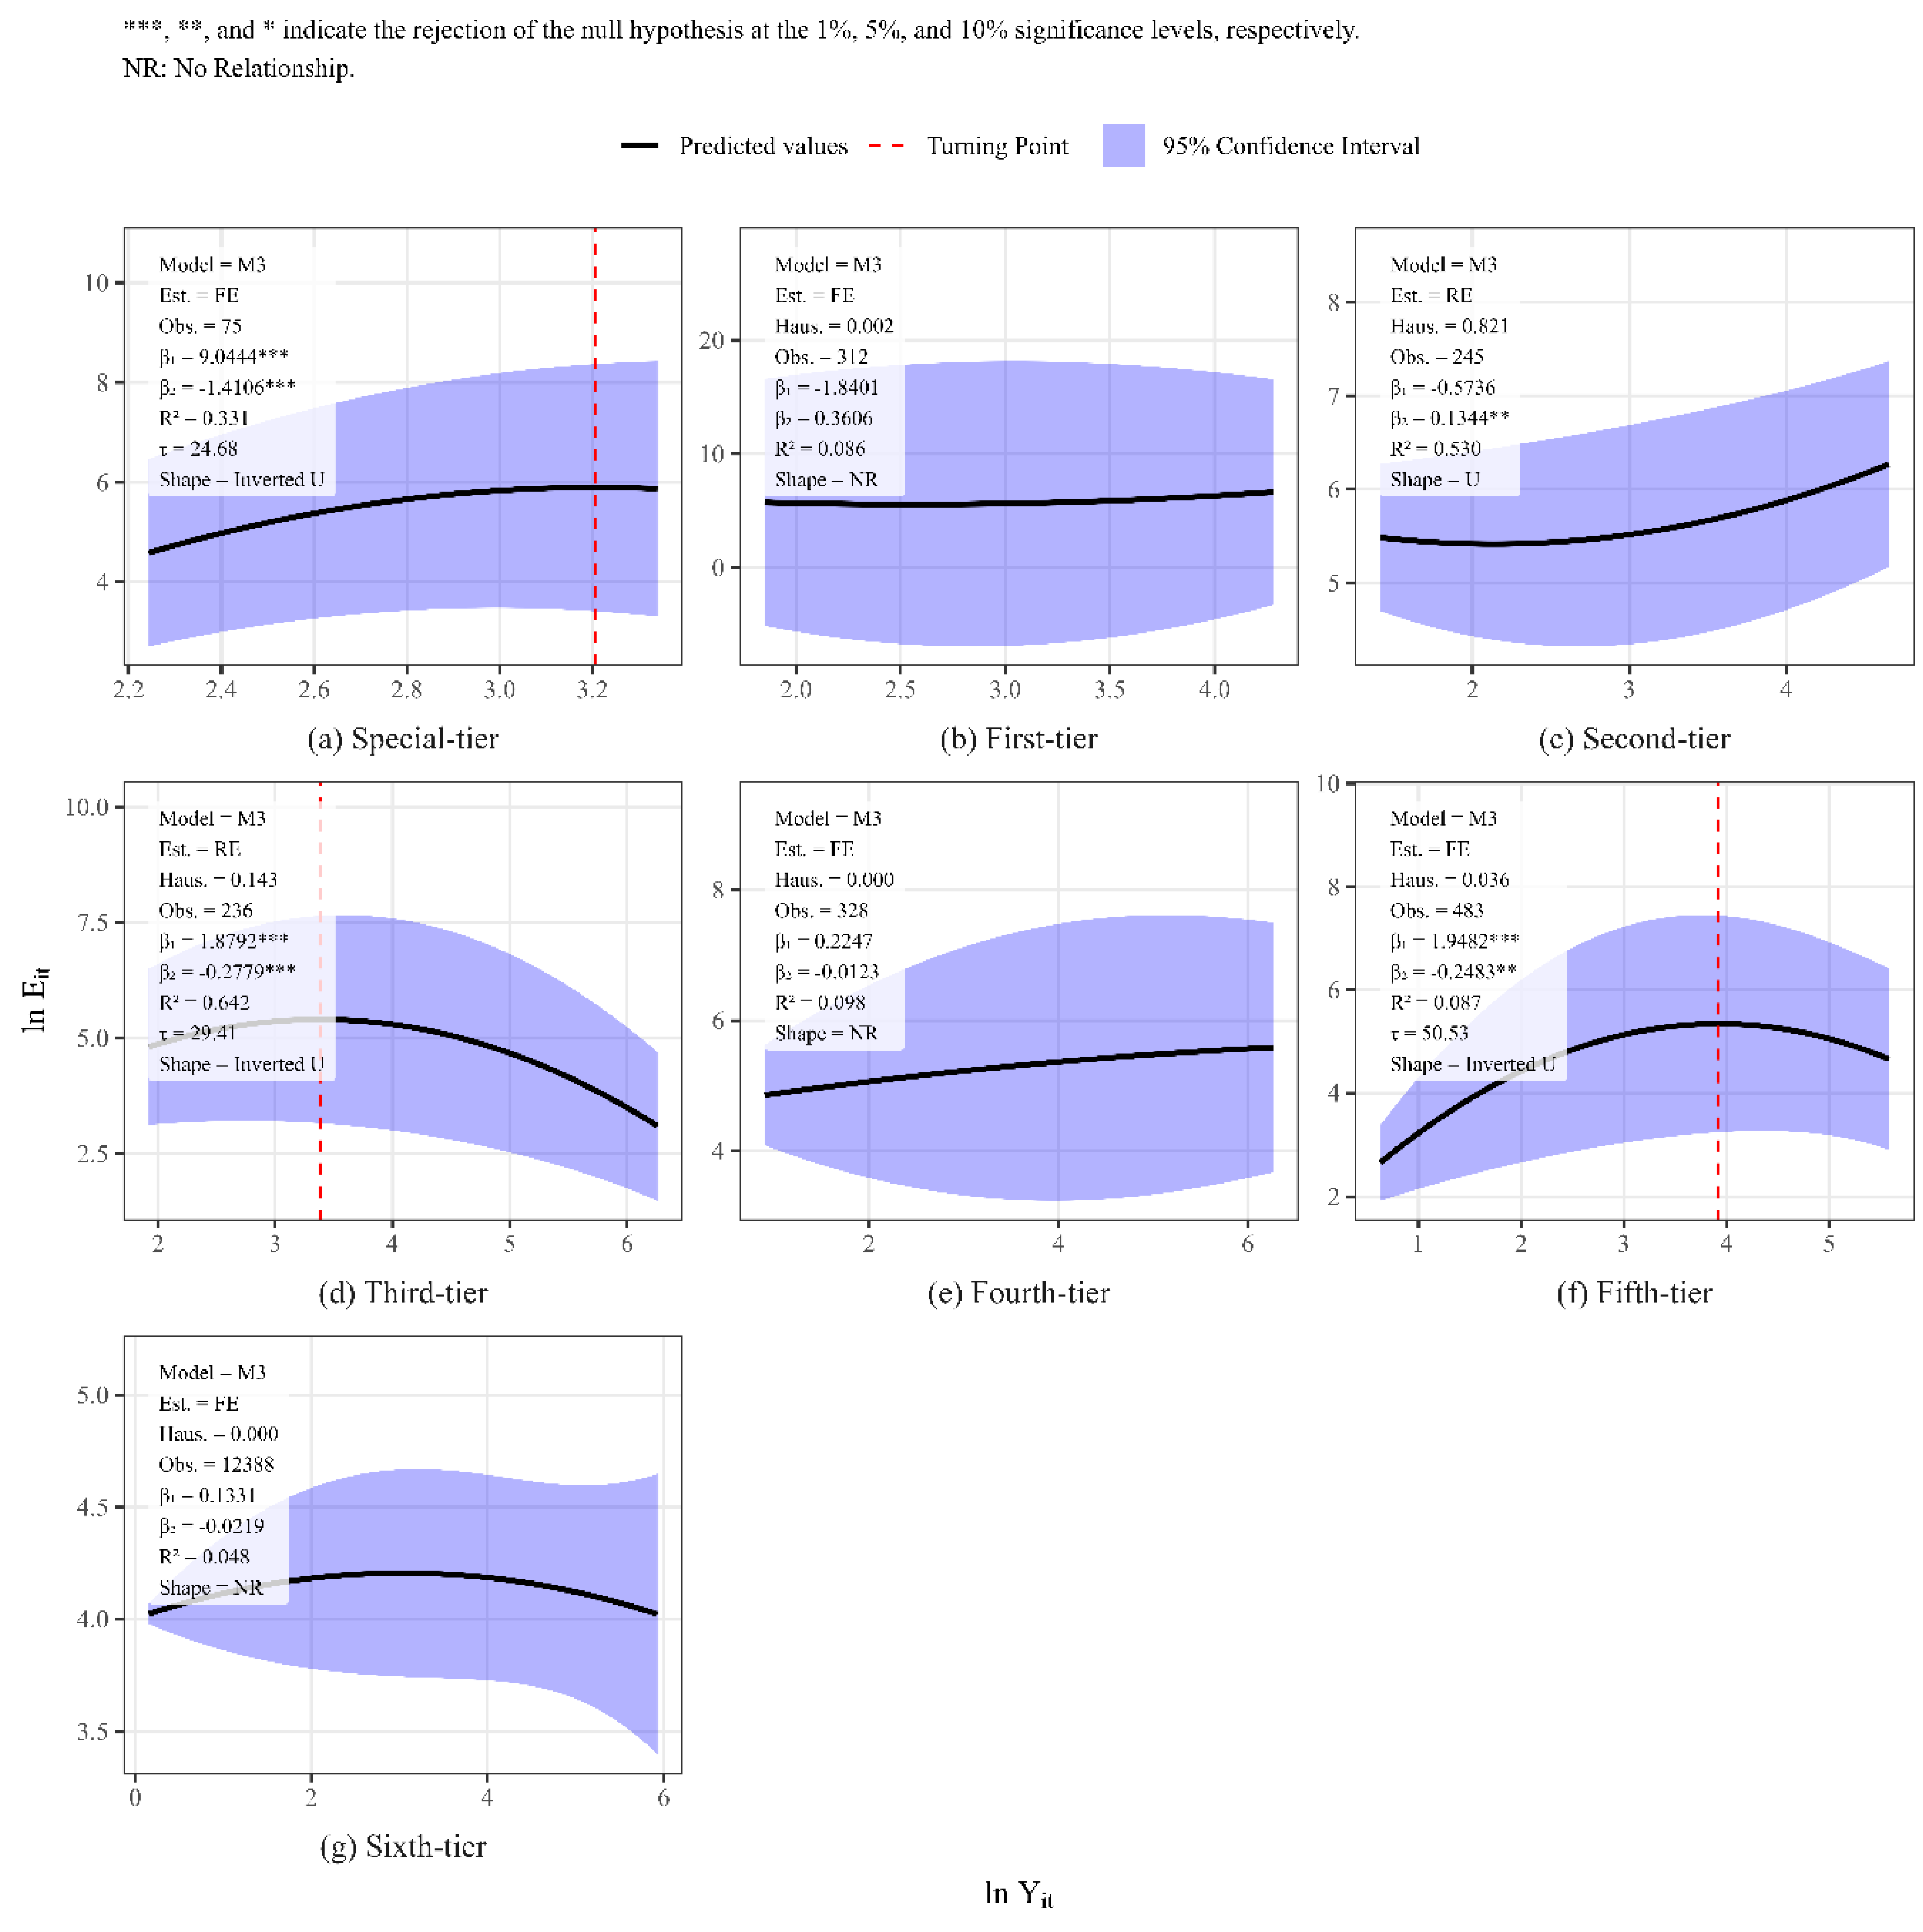
Figure 5.
SAR Robustness Check: Partial Effect of Income on Disposal.
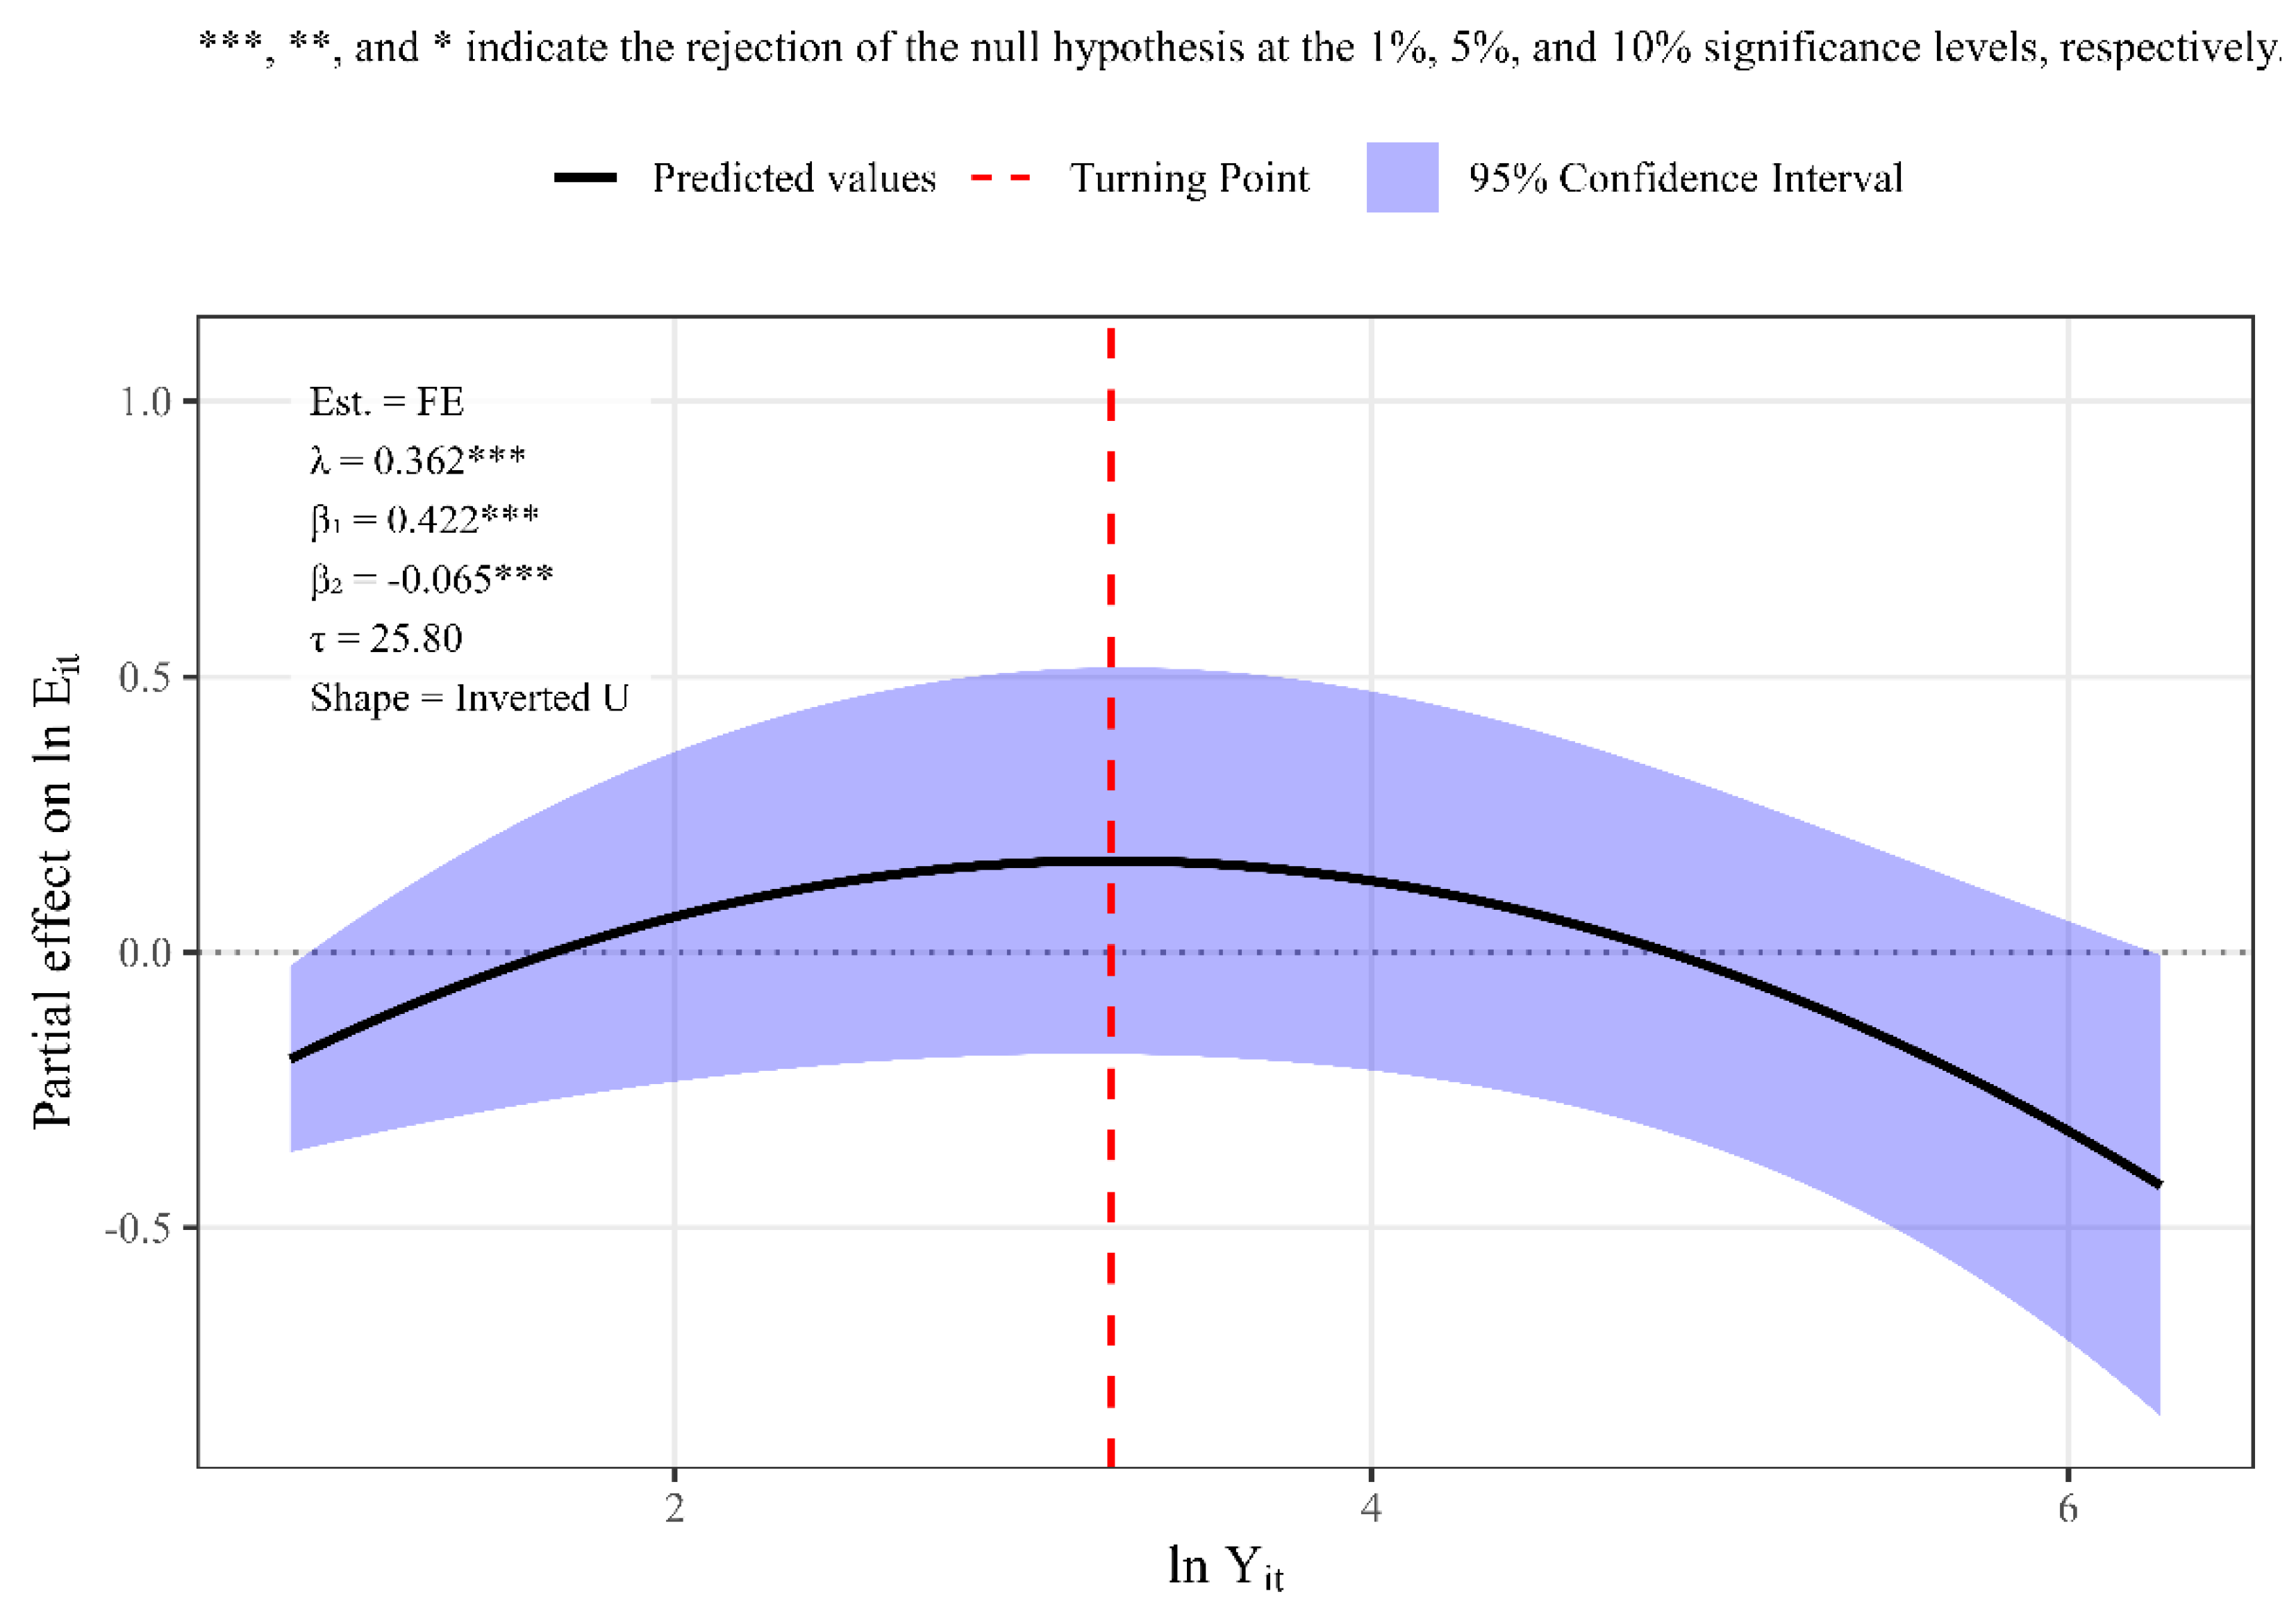
Figure 6.
Non-Parametric WKC: Partial Effect of Income on Disposal.
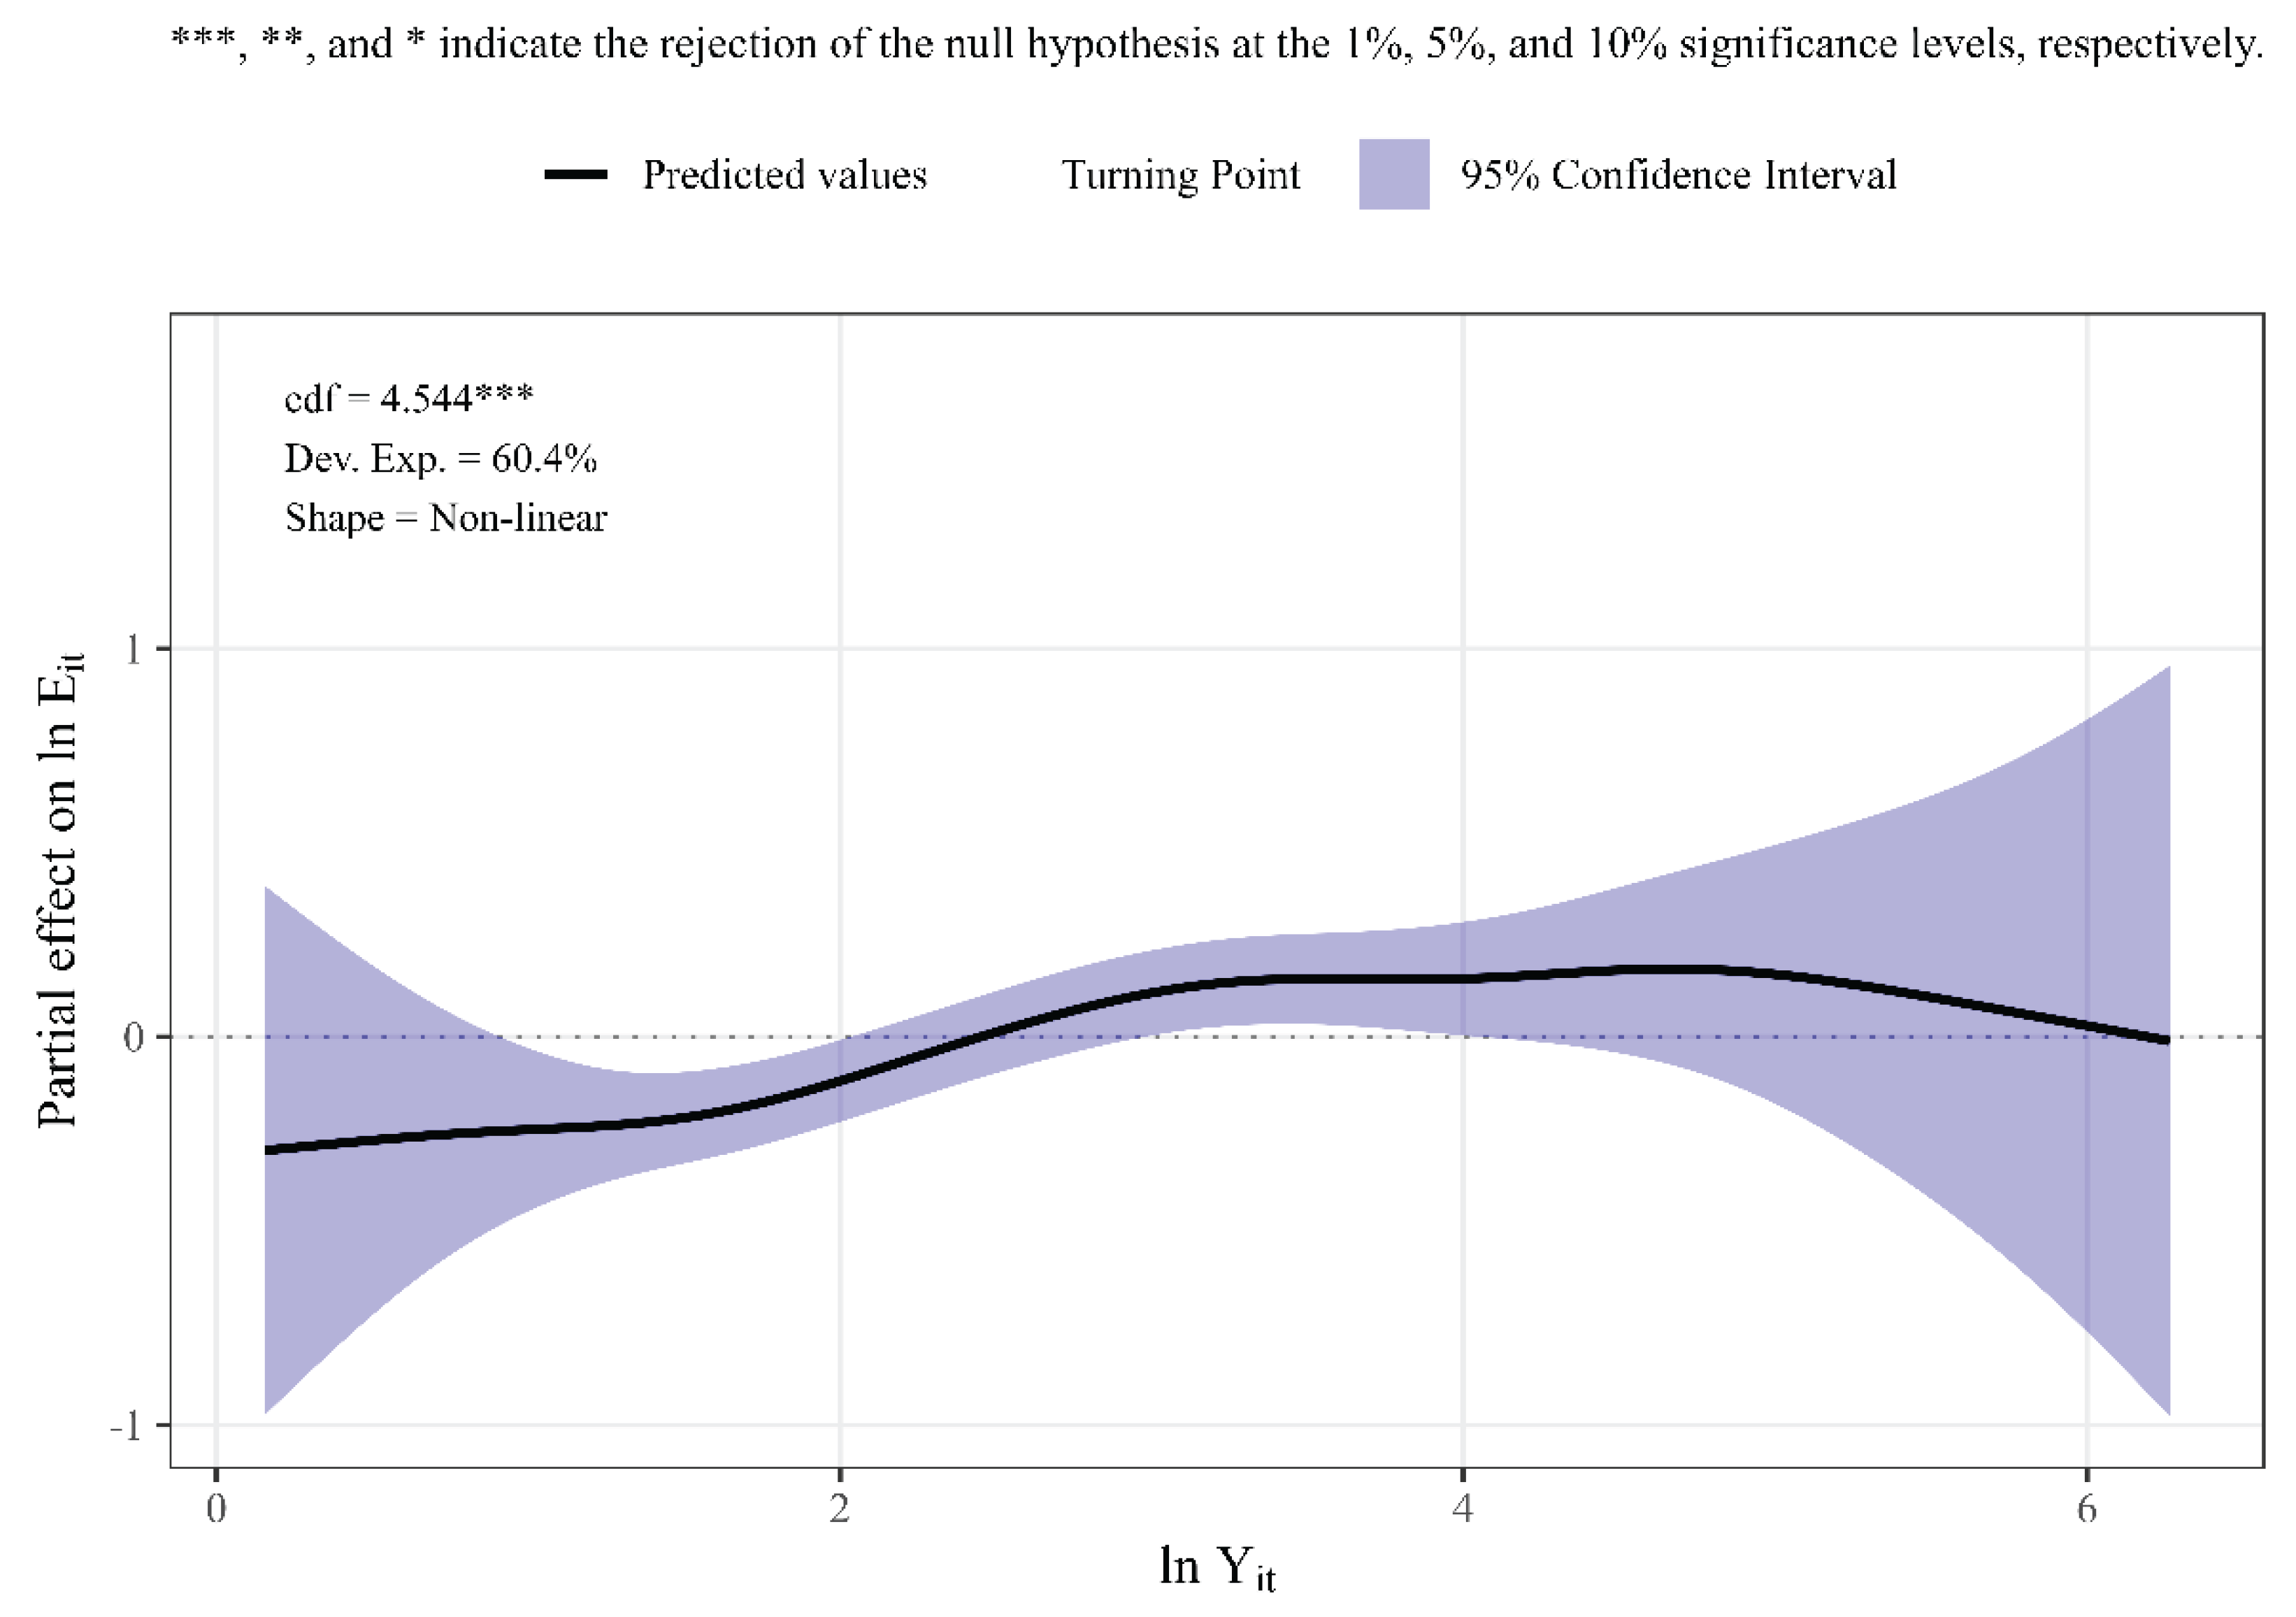

Table 1.
Colombian Municipal Categorisation Criteria.
| Category |
Population (P, Inhabitants) |
Fiscal Capacity (UCR in NMW) |
| Special-tier | P > 500,000 | UCR > 400,000 |
| First-tier | 100,001 ≤ P ≤ 500,000 | 100,000 < UCR ≤ 400,000 |
| Second-tier | 50,001 ≤ P ≤ 100,000 | 50,000 < UCR ≤ 100,000 |
| Third-tier | 30,001 ≤ P ≤ 50,000 | 30,000 < UCR ≤ 50,000 |
| Fourth-tier | 20,001 ≤ P ≤ 30,000 | 25,000 < UCR ≤ 30,000 |
| Fifth-tier | 10,001 ≤ P ≤ 20,000 | 15,000 < UCR ≤ 25,000 |
| Sixth-tier | P ≤ 10,000 | UCR ≤ 15,000 |
Note: According to the legislation, if a municipality exhibits a discrepancy between its population and revenue thresholds, the fiscal capacity (UCR) predominantly determines its final categorisation.
Table 2.
Colombian Municipal Categorisation Criteria.
| Specification | Note | |
| Baseline (M3, logarithm) | 5.93*** | Full recovery panel |
| Informal-recycling adjustment (+20%) | 5.84*** | Fourth- to Sixth-tier inflated |
| Inverse hyperbolic sine (M3-IHS) | 2.77*** | Robust to near-zero values |
| Aligned common sample (2016–2023) | 2.12*** | Municipalities reporting both streams |
| Heckman selection-corrected | 1.27 (n.s.) | Inverse Mills ratio −0.87*** |
| Substitution test (recovery − disposal slope) | 1.99** | Stacked model, aligned sample |
Coefficients are the income slope (α₁) on log GDP per capita. *** and ** denote significance at the 1% and 5% levels; n.s. denotes non-significant.
Disclaimer/Publisher’s Note: The statements, opinions and data contained in all publications are solely those of the individual author(s) and contributor(s) and not of MDPI and/or the editor(s). MDPI and/or the editor(s) disclaim responsibility for any injury to people or property resulting from any ideas, methods, instructions or products referred to in the content. |
© 2026 by the authors. Licensee MDPI, Basel, Switzerland. This article is an open access article distributed under the terms and conditions of the Creative Commons Attribution (CC BY) license (http://creativecommons.org/licenses/by/4.0/).
Copyright: This open access article is published under a Creative Commons CC BY 4.0 license, which permit the free download, distribution, and reuse, provided that the author and preprint are cited in any reuse.