

Submitted:
09 July 2026
Posted:
10 July 2026
You are already at the latest version
Abstract
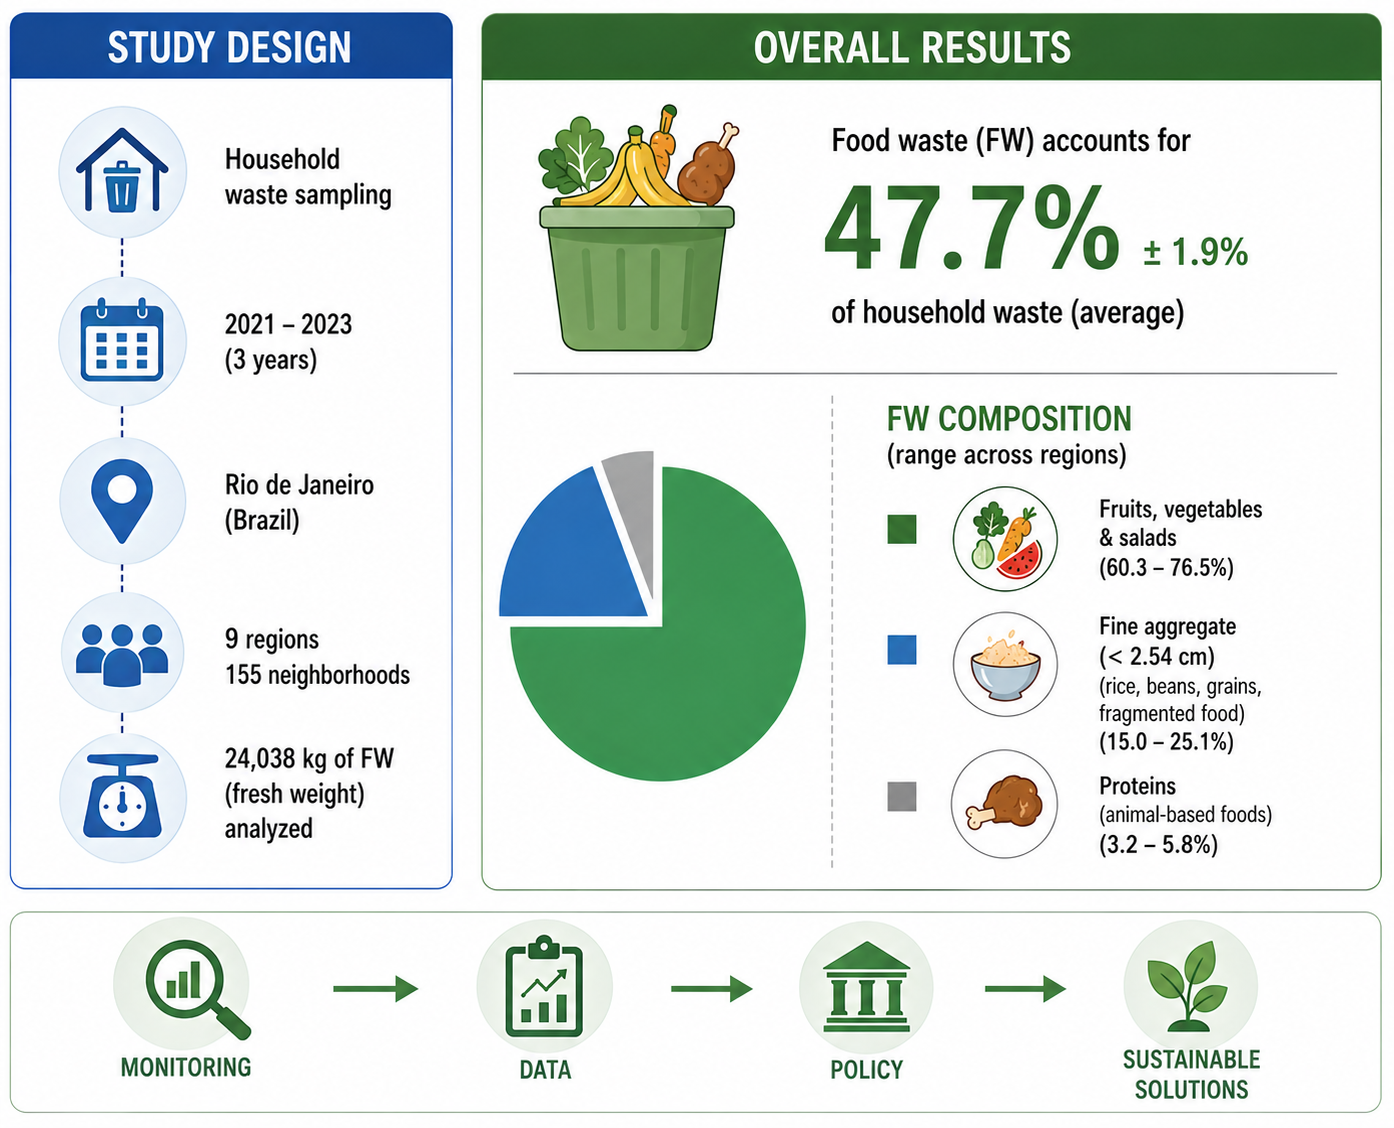
Household food waste remains a huge challenge for solid waste management in municipalities worldwide, especially in the Global South. Existing studies that measured food waste (FW) in cities are scarce, have limited geographic scope, and have limited timeframes. In that direction, the current investigation provides data on the FW composition of nine regions of the municipality of Rio de Janeiro (Brazil), based on a three-year sampling across 155 neighborhoods. Waste samples were collected from 2021 to 2023. In total, about 24,038 kg (fresh weight) were analyzed. Results showed that FW accounts for an average of 47.7±1.9% of household waste in the study period. The FW composition in the city of Rio de Janeiro ranged from 60.3 – 76.5% for fruits, vegetables, and salads, 15.0 – 25.1% for fine aggregate (small-sized food residues < 2.54 cm, like rice, beans, grains, and fragmented food particles), and 3.2 – 5.8% for proteins (discarded animal-based protein foods like chicken and meat). The chi-square good-ness-of-fit test was applied to evaluate whether the FW composition in each of the nine regions differed from the mean FW composition of the Rio de Janeiro municipality. The findings revealed statistically significant differences (p-value < 0.05) in the average FW fractions in specific regions and years compared with the city’s average composition. Thus, one of the key takeaways of this investigation was that the percentages of discharged food waste fractions vary over time and across locations, even within the same municipality. The present research took a first step toward understanding the food waste problem in Rio de Janeiro (Brazil) and underscores the importance of monitoring food waste data to guide the development of locally specific strategies for sustainable urban food systems, including waste prevention, recycling, and food recovery.
Keywords:
food recovery
; global south
; household solid waste
; recycling
; urban food systems
; waste composition
; waste prevention
1. Introduction
Food waste (FW) is a global issue, with about 1.3 billion metric tons of edible food discarded every year, of which 19% occurs at the post-harvest stage and 60% at the household level. On average, households generate approximately 55 kg of FW per person per year worldwide, corresponding to economic losses of nearly 1 trillion USD annually [1]. As a definition, which varies widely across cities and countries, FW refers explicitly to discarding food intended for human consumption that occurs between the retail and consumer stages. It comprises any raw or cooked substance that is discarded or intended or required to be discarded [1,2].
The FW is the leading source of organic waste in urban areas, especially in developing economies localized in the Global South. Globally, organic fraction comprises 44% of total municipal solid waste, rising to 50% in low- and middle-income countries [3]. Cities grapple with substantial daily quantities of FW, which are often disposed of in dumpsites and landfills [4,5]. This scenario intensifies social inequalities and results in economic and environmental burdens [6,7].
At the 28th Conference of the Parties (COP 28) in Dubai, 159 world leaders came together to officially support the Declaration on Sustainable Agriculture, Resilient Food Systems, and Climate Action. This endorsement underscores the critical need to evolve food systems toward sustainability as a strategic response to the challenges posed by climate change [8]. The declaration articulates a commitment to fostering sustainable practices in production and consumption, emphasizing the reduction of food loss and waste management as a relevant topic to this effort [8,9].
Waste minimization and FW valorization align with Sustainable Development Goals (SDGs). SDG 2 (zero hunger), SDG 7 (affordable and clean energy), SDG 11 (sustainable cities and communities), SDG 12 (responsible consumption and production), and SDG 13 (climate action) [4,10]. To effectively minimize and/or valorize organic fraction of solid waste, it is imperative to implement circular strategies that prioritize managing the FW through prevention or repurposing it as a valuable resource for energy and value-added materials [11,12,13,14]. To this end, quantitative and qualitative information on FW is fundamental to the definition of local strategies and oriented policies.
However, despite the urgent need to address this issue, most cities do not even measure the total amount of food wasted. There is a lack of primary data-based studies, leaving both the public and private sectors unaware of the true scale of the problem [15,16]. Another limitation is that many studies measuring FW are small-scale, with limited geographic areas and restricted timeframes, which impede the observation of eventual changes over time [17].
Among the existing studies on qualitative and quantitative analyses of FW, Edjabou et al. [18] evaluated 12 metric tons of residual Danish food waste collected from 1,474 households without source segregation of the organic fraction. The results showed that the FW generation rate was 183 ± 10 kg per household per year. Avoidable food waste accounted for about 57% of this amount. This study also showed that the mass of avoidable food waste per resident increases with household size; however, the mass per person did not differ among residence sizes [18]. In another research, an FW gravimetric analysis was conducted with 100 single-family households in London, Ontario, Canada, during the first wave of the COVID-19 pandemic (June 2020). It was observed that sample households sent 2.81 kg of FW to landfills per week, with approximately 52% of this waste being edible food.
Beyond estimating the amount of food waste and loss, it is also relevant to identify the components of FW to inform the design of effective prevention strategies. By analyzing the organic fraction of household waste, cities can identify the primary categories of food waste, gain insights into waste generation patterns and their leading causes, aiming to develop best practices and targeted policies [19].
In this context, the current research analyzes the gravimetric composition of food waste from nine regions of the municipality of Rio de Janeiro, Brazil, covering the period from February 2021 to December 2023. Therefore, this study aimed to: (i) quantify the share of FW in household waste in the municipality of Rio de Janeiro; (ii) characterize the composition of FW into six food categories; and (iii) assess whether FW composition differs between regions and over the period 2021–2023. Although gravimetric characterization studies of household solid waste have previously been conducted in several Brazilian municipalities, these investigations have generally been limited to single campaigns, short monitoring periods, or restricted geographic areas [20,21,22]. To the best of our knowledge, this is the first study in Brazil to conduct a gravimetric analysis of FW using compositional analysis with a large sample size (155 neighborhoods) and an extended observation period (three years). As an initial evaluation, this study takes a first step toward understanding the FW issue in Rio de Janeiro (Brazil). It may contribute to the development of context-specific strategies on waste management and food waste recovery to support decision-making in cities facing similar challenges.
2. Materials and Methods
2.1. Case Study
Rio de Janeiro is the second-largest city in Brazil, with a total population of 6,211,223 inhabitants in 2022. It has a unique and complex geographical landscape, shaped by mountains and the sea, where urbanization has transformed parts of the natural landscape in the metropolitan area. The entire population resides in urban areas, covering a total area of 1,200.329 km2 [23].
Rio de Janeiro is divided into four Zones – Central, South, North, and West – based on their location relative to the historic city center and shared socio-economic characteristics. Additionally, five planning areas reflect land-use patterns, human occupation, and environmental and socio-economic factors, thereby guiding government policies and actions, including waste management [24].
Rio de Janeiro generates approximately 9,000 metric tons of municipal solid waste daily, which is managed by the Municipal Urban Cleaning Company (COMLURB). Like other major cities worldwide, it faces challenges in implementing waste management policies and FW reduction strategies. Approximately 95% of MSW is disposed of in landfills. Household waste accounts for about 54% of municipal solid waste, with each person producing an estimated 0.70 kg per day in 2020. This year, about 1.39% of household waste was directed to selective collection (ca. 123 metric tons per day). In contrast, only 0.11% of organic waste was composted and/or anaerobically digested (ca. 10 metric tons per day) [25].
2.2. Household Waste Sampling and Analysis
Household waste samples were collected from Monday to Friday, excluding holidays, and always before the regular waste pickup. Holidays were excluded from the sampling to avoid atypical waste-generation patterns associated with festive periods and to ensure that the samples were representative of regular household waste production. The samples were collected from individual houses, condominiums, and apartment buildings at their doorstep. They were randomly collected, placed into a 240-liter container, and transported by non-compacting trucks. In total, 1391 samples of household waste were collected from February 2021 to December 2023.
Samples were collected from 155 of 165 neighborhoods in Rio de Janeiro, representing 95.5% of the total population and covering nine administrative subdivisions (sub-prefectures) (n = 1, 2, 3…9) across the municipality’s four geographic zones (Central, South, North, and West). This administrative division was adopted to ensure broad spatial coverage of the municipality and to enable comparisons among areas with distinct urban characteristics. The number of samples in each municipal region was determined based on the total population in the selected area and the research center’s processing capacity for gravimetric analysis (Table S1). All regions of the city were sampled throughout the study years, with samples collected randomly across different months. Consequently, the study does not allow for a comparison of the effects of seasons (e.g., dry and wet) on the profile of the generated waste.
In this investigation, household waste was grouped into four categories: organic matter, paper, plastic, and other materials. Other materials included glass, metals, and rejects, among other categories that are not important to this study’s assessment. The analysis was performed by weighing the materials to determine the mass percentage of the specific waste component in accordance with Equation 1.
Where:
Ci = percentage of the segregated waste fraction (e.g., organic matter, paper, plastic, others), in %.
wi = weight of the specific segregated fraction, in kg.
wt = total weight of the waste sample being analyzed, in kg
2.3. FW Gravimetric Analysis
To analyze FW, we used the list of categories presented in Table 1, which reflects the main food categories consumed by Brazilian families [26]. Overall, FW was classified into six broad categories: (i) fruits, vegetables, and salads; (ii) confectionery, cakes, and desserts; (iii) proteins; (iv) bakery products, pizza, and pasta; (v) fine aggregates (e.g., rice, beans, grains, and fragmented food particles); and (vi) food and leftovers remaining in packaging. This classification was adopted to facilitate the characterization and quantification of the different waste fractions generated.
The category “fine aggregate” refers to organic residues smaller than 2.54 cm, such as spent coffee grounds, flour, grains, rice, and bean grains, whether cooked or raw. Prior to segregation, the food waste was placed on a table fitted with a one-inch mesh. Small-sized food residues that passed through the mesh were classified within this category.
This study adopted the United Nations Environment Programme (UNEP) definition of food waste, which includes both edible and inedible food fractions. The UNEP’s objective is to distinguish between avoidable and unavoidable waste to guide solutions in accordance with the food waste management hierarchy [17]. However, because we did not segregate edible and inedible fractions in this study, comparisons with other research should be approached with caution.Packaging was included in the analysis even when it still contained food residues, as complete separation was not always possible, particularly for products such as cottage cheese, yogurt, jams, and sauces. In some cases, packaging weight influenced the measurements, as observed for jams, which are often sold in heavy containers, and bottled spices, where the packaging may weigh more than the contents [27]. This approach was adopted to ensure consistency in the sorting procedure across all samples. Consequently, the reported mass of this fraction may slightly overestimate the actual food waste content. In our analysis, drinks (e.g., alcoholic beverages, soda, etc.) were not included in the gravimetric evaluation of FW.
In total, about 24,038 kg of FW (fresh weight, i.e., the as-collected mass including natural moisture content; wet basis) was analyzed in the study period from February 2021 to December 2023. Photographs were taken throughout the weighing process. This was also helpful for classifying items in doubt [28].
2.4. Statistics
Statistical analyses were conducted to assess whether FW composition differed among regions. A chi-square goodness-of-fit test was applied to assess whether the observed distribution of FW categories in each of the city’s nine regions differed significantly from the overall distribution observed for the municipality of Rio de Janeiro. The null hypothesis assumed that the regional FW composition was consistent with the citywide composition, whereas the alternative hypothesis assumed that the distributions differed. For each year, the observed FW category distribution in each region was compared with the expected distribution, defined as the citywide mean composition of the six FW categories calculated from the combined 2021–2023 dataset. The chi-square goodness-of-fit test was performed on the mass of each FW category by region and year, with 5 degrees of freedom (6 categories) and a significance level of p < 0.05. The mass (kg) of each food waste category by region and year is provided in Table S2.
Because separate chi-square goodness-of-fit tests were performed for each region and year (nine regions × three years), no formal correction for multiple comparisons was applied. Consequently, the statistical analyses should be considered exploratory, and some statistically significant results may reflect chance due to the increased risk of Type I error.
All analyses were performed using Jamovi software (version 2.5.3).
3. Results
3.1. Household Waste Composition in the Rio de Janeiro Municipality (2021 – 2023)
Figure 1 shows the household waste composition in the municipality of Rio de Janeiro from 2021 to 2023, highlighting the predominant fractions, i.e., organic, paper, plastic, and other materials.
Organic matter was the largest fraction of household waste in Rio de Janeiro, averaging 47.7% (SD = 1.9%) over the three years.
Results also align with historical data for the municipality of Rio de Janeiro from 1995 to 2025, which show an organic fraction ranging from approximately 45.4% to 61.4% and an average of 51.8% (SD = 4.4%) during this period [29].
Recyclables, i.e., paper and plastic fractions, underwent variations during the 2021-2023 period of analysis. In 2021, paper and plastic accounted for 15.4% and 15.6% of household waste, respectively. The predominance of these fractions shifts from 2022 and beyond. Based on the city’s historical data, this change occurred for the first time in 2022 since 2010 [29].
3.2. FW Composition in the Rio de Janeiro Municipality (2021 – 2023)
The assessment of food waste composition in 2021–2023 in Rio de Janeiro is shown in Figure 2.
The most relevant food waste category comprised fruits, vegetables, and salads, accounting for 70.8% (SD = 8.9%) of the FW generated between 2021 and 2023. Fine aggregate (mainly rice and beans, as observed during gravimetric analysis) accounted for 18.2% (SD = 5.7%) of the total mass, derived primarily from leftovers and raw grains. These values represent the mean percentages for the 2021–2023 period. Together, these two categories accounted for 89.0% of the total FW in the study period.
The protein content in FW was low. It represented 4.3% (SD = 1.3%) of the average composition in 2021–2023. This result aligns with global studies indicating that the protein FW fraction, such as meat and chicken, accounts for no more than 10% of total food waste [30].
It is worth noting that although we did not separate edible and inedible fractions in this gravimetric assessment, considerable amounts of edible food were qualitatively identified in all food waste samples. Whole and partially consumed fruits and vegetables, chicken meat, and bread rolls were the main examples found during the FW sampling, as indicated by visual registrations (Figure 3), indicating the presence of edible parts in the wasted food.
3.3. Comparison of Food Waste Composition Across the Nine Regions of the Rio de Janeiro Municipality
Table 2 presents the mean FW composition based on data collected from the nine city regions over three years (2021-2023) and the average FW composition over the study period.
The food waste composition in the city of Rio de Janeiro ranged from 60.3 – 76.5% for Fruits, vegetables, and salads, 15.0 – 25.1% for fine aggregate, and 3.2 – 5.8% for proteins during the study period. This common pattern remained consistent across the city’s regions, but some categories saw changes in their contributions. For instance, Region 2 (North Zone) showed the lowest mean percentage of fruits, vegetables, and salads in FW (68.4±9.8%) and the highest percentage of fine aggregate waste (e.g., rice, beans, grains, flour, and fragmented food particles) (20.2±6.1%). In contrast, the South Zone (Region 6) and the West Zone, specifically the Barra neighborhood (Region 3), account for 15.9±5.8% and 15.2±5.2% of fine aggregate waste, respectively.
The chi-square goodness-of-fit test was applied to evaluate whether the FW composition in each of the nine regions differed from the mean FW composition of the Rio de Janeiro municipality (Table 3).
The findings revealed statistically significant differences (p-value < 0.05) in the average food waste fractions in specific regions and years compared with the city’s average composition. In 2021, Region 4 (West Zone) exhibited a distinct FW composition compared with the municipal average (p-value < 0.01), as well as Regions 2 and 9 in the North zone of the city (p-value < 0.05). In 2022, similar disparities were observed in the Region 5 (Central Zone), 6 (South Zone), and 7 (West Zone). These results indicate that FW composition can vary considerably across regions within the city, potentially reflecting differences in socioeconomic conditions, dietary patterns, consumption behaviors, and other local characteristics. However, no direct analysis was performed to correlate these factors with the observed FW composition. Therefore, this interpretation should be considered speculative.
4. Discussion
4.1. Household Waste Composition in the Rio de Janeiro Municipality (2021 – 2023)
From 2021 to 2023, organic matter accounted for an average of 47.7±1.9% of household waste in the municipality of Rio de Janeiro (Brazil). This result corroborates the observations of Kaza et al. [3], indicating that cities from lower- and middle-income countries, such as Brazil, generate a higher proportion of food and green waste (50%) compared to those in higher-income nations (32%), contributing to the high organic content in the municipal solid waste.
In this study, 2021 exhibited the lowest average proportion of organic waste in the city (45.4%). This pattern may be related, at least in part, to social measures implemented during the second wave of the Coronavirus disease 2019/2020 (COVID-19/2020) pandemic, which could have encouraged more efficient household food management, as observed in other contexts [31,32]. Although consistent with trends reported during the COVID-19 pandemic, this explanation remains speculative, and other factors, including economic conditions and changes in waste collection practices, may also have influenced the observed reduction in organic waste.
In addition, the higher proportions of paper/cardboard (16.0% in 2022 and 15.6% in 2023) compared with plastic (12.9% and 13.0% in 2022 and 2023, respectively) suggest that local legislation and public health measures may have influenced household waste composition during the study period. Specifically, State Law No. 8.006/2018, which prohibits the distribution of plastic bags in commercial establishments such as supermarkets and grocery stores, has been in effect in Rio de Janeiro since 2019. Furthermore, the increase in paper/cardboard packaging waste may be attributed to the effects of the COVID-19/2020 pandemic on food delivery services and online shopping. Similar trends were reported by Saha et al. [33] in Fargo, North Dakota, United States of America (USA), where cardboard recycling increased by 5.8% in 2020 compared with 2019 and by 13.0% in 2021 compared with 2020. According to the authors, this increase was likely associated with greater reliance on online shopping during the pandemic and the persistence of these consumption habits thereafter. However, these factors should be interpreted as plausible contributing drivers rather than definitive explanations, as no direct data on online shopping behavior, e-commerce, or plastic bag usage were available to confirm their individual effects.
4.2. FW Composition in the Rio de Janeiro Municipality (2021 – 2023)
The ranking of the most wasted food categories in the city of Rio de Janeiro (Brazil) was as follows: fruits, vegetables, and salads > fine aggregate > proteins. This common pattern has similarities with other reported studies in the literature – illustrated in Table 4 for comparative analysis.. It is important to note that studies vary in methodologies, functional units and sample sizes, which demands a cautious evaluation of results. For instance, in studies that rely on indirect methods for measuring FW, such as surveys and food diaries, consumers tend to underestimate the amount of waste they produce. Therefore, the data should be compared and interpreted as indicative of general patterns rather than precise differences. Additionally, data are presented as mean percentages, including those from the present study, to ensure comparability with previous studies that reported average FW composition based on a single quantity of waste (fresh weight or dry mass) rather than extended observation periods.
Similar results confirming the dominance of the fruit and vegetable category in FW generated in households were also reported in previous quantitative research conducted in various countries [18,30,35,36]. In that direction, it was observed that the percentage of fruits, vegetables, and salads in the current study (70.8%) gets close to those reported by Elimelech et al. (2018) in Israel, where the fruit and vegetable category accounted for 67.5% of the total avoidable FW analyzed.
On the other hand, the proportion of fruits, vegetables, and salads identified in our study was substantially higher than that reported in other countries with developed economies. In the United Kingdom, a report by a non-governmental organization found that fresh vegetables and salads accounted for 28% of edible food waste in 2022, while fresh fruits accounted for 8% [30]. Likewise, a study conducted in Denmark reported that vegetables and salads accounted for an average of 30% of food waste, while fresh fruits contributed approximately 16% [18]. A similar distribution was observed in Croatia, where fruits and vegetables together comprised nearly half of the total food waste generated (46%) [35].
This analysis is particularly critical regarding the fruit, vegetable, and salad category, as it exhibits the highest percentage of fractions unsuitable for consumption. The comparisons focus on identifying which fractions of food waste are most significant in various countries. The goal is not to determine whether one country wastes more or less of a specific category than another. Instead, it aims to find out whether the most wasted food categories are consistent across studies from different nations. Yet this comparison should be interpreted with caution, as some studies from developed economies accounted only for the edible parts of FW [30,35], whereas our research included both edible and inedible food waste.
The high rate of disposal of fruits, vegetables, and salads in Rio de Janeiro (Brazil) is thought to be influenced by several factors. Bananas and oranges are the most consumed fruits in Brazil [26]. Their high perishability may be exacerbated by climatic conditions and poor infrastructure, including inadequate storage, which accelerates waste generation [38]. Besides, spoiled whole fruits and vegetables, identified during our qualitative analysis, could indicate poor planning in food purchases and consumption. Porpino et al. [39] investigated the antecedents of FW among 14 Brazilian lower-middle-class families. They reported that excessive purchasing, overpreparation, and inappropriate food conservation are factors influencing food waste in the households analyzed. In addition, consumers often tend to overpurchase fresh products but fail to consume them before they spoil. This might result in greater food loss and waste (FLW) [39].
The predominance of fruit and vegetable waste in Brazil, as observed in other Latin American countries, might also be related to supply chain inefficiencies (postharvest losses, logistics, and cooling facilities) and market dynamics (quality standards and oversupply) [13,40,41]. A recent study estimated that about 5.18 million metric tons of FLW were generated in Chile in 2021, with fruit as the largest contributor at 2.5 million metric tons (48% of the total FLW), followed by vegetables at 0.8 million metric tons (16%) [40]. According to this study, 67% of fruit loss and waste in Chile occurred during agricultural production, post-harvest handling, and storage, accounting for approximately 30% of the country’s total FLW [40]. Fruits and vegetables are highly susceptible to mechanical damage during both manual and automated harvesting, as well as subsequent handling and transportation. In addition, retailers and consumers often reject produce with minor cosmetic imperfections, even when it remains safe, edible, and nutritionally intact. As a result, a considerable proportion of fruits and vegetables might be discarded before reaching consumers or shortly after purchase due to reduced marketability and perceived quality [41].
In this work, the second-largest category of FW was fine aggregate (e.g., rice, beans, fragmented food particles, and others < 2.54 cm), comprising approximately 18.2% of the city’s FW. This result aligned with [35], who reported the category of “other foods”, comprising egg shells, tea leaves, and coffee grounds, as the second most representative category accounting for 12% of FW composition. It should be noted that, in the present study, the fine aggregate fraction comprises a heterogeneous mixture of edible and inedible food residues (e.g., rice, beans, flour, coffee grounds, and fragmented food particles); therefore, comparisons with the “other foods” category reported in previous studies should be interpreted as approximate rather than direct.
Interestingly, although the composition of the fine-aggregate fraction was not quantitatively characterized in this study, technicians conducting the gravimetric analysis qualitatively observed that rice and beans constituted a considerable portion of this fraction. Rice and beans are staples of the traditional Brazilian diet, with around 40% (in mass) of the food Brazilians purchase by weight [26]. Consequently, a high portion of rice and beans is expected to be discarded by Brazilian households.
Lourenço et al. [23] employed a two-stage methodology that combined an online survey of 1,764 Brazilian respondents with an 8-day digital FW diary (including smartphone photos) from 686 households to quantify and categorize food waste using standardized measurements and statistical analyses. They reported that rice accounted for 21.96% of total FW, while beans accounted for 15.99%, concluding that these are the two most consumed and wasted food groups in Brazil.
The qualitative observations obtained in this study, together with evidence from the literature, suggest that the composition of FW generally mirrors the dietary habits and consumption patterns of the populations from which it originates.
The third most representative category represented a small share of the food waste analyzed. The protein content in FW was relatively low, at less than 5% of the municipality’s average composition. This result aligns with other studies, which report values ranging from 3% to 11% of fresh weight, though these vary depending on methodology and whether inedible fractions (e.g., bones) are included [18,34,37].
Another important finding of this investigation is regarding the differences in FW composition across the city’s regions over time. Differences were reported for Regions 2, 4, and 9 in 2021, and for Regions 5, 6, and 7 in 2022. Here, the observed differences could be partially attributable to income levels across regions. The North and Central Zones are predominantly lower-income, whereas the South Zone and Region 3 of the West Zone, named “Barra da Tijuca”, are mainly higher-income. This socioeconomic contrast suggests a potential contribution to the observed variations in FW composition among these areas. This hypothesis is partially supported by Ilakovac et al. [35], who conducted a self-reported survey in which 115 Croatian households recorded the frequency and portion sizes of different FW categories discarded over 7 days. The study found that household income showed positive correlations with the disposal of cakes and biscuits, milk and dairy products (p-value < 0.01), pasta, rice, and fish (p-value < 0.05). In contrast, no significant relationship was observed between income and the disposal of fruits, vegetables, meat, bread and buns, prepared meals, fruit- and vegetable-based products, or unavoidable food waste. The authors concluded that income influences the composition of FW through differences in purchasing power and consumption patterns. While lower-income households tend to minimize waste due to financial constraints, higher-income households exhibit greater waste in selected, often higher-value food categories such as cakes, biscuits, and fish. Nevertheless, because we did not collect household-level socioeconomic data, the hypothesized link between income distribution and regional FW composition remains speculative in this study and should be examined in future studies that integrate gravimetric data with detailed sociodemographic information..
Differences in FW composition across the regions of Rio de Janeiro highlight the need to develop region-specific strategies for organic waste management that account for local FLW generation profiles. Municipal authorities could implement targeted FLW campaigns focused on waste prevention and source segregation, taking regional characteristics into account, while investing in waste management infrastructure (e.g., composting and anaerobic digestion facilities) near areas with high FW generation to reduce transportation distances and associated energy costs.
4.3. Study Limitations and Prospects
Gravimetric analysis is one of the most widely used methods for determining household composition. Still, some pitfalls can compromise data quality. In this study, the authors designed experimental procedures to address drawbacks such as temporal variability by excluding holidays and festivities from the sampling. On the other hand, seasonal variability (i.e., dry and wet seasons) was not accounted for in this assessment. It should be properly addressed in future evaluations, because moisture fluctuations in FW may reflect water content rather than actual material mass. Another potential limitation of this study is that the doorstep collection approach may underrepresent households in multi-family buildings with distinct waste-collection logistics, potentially introducing sampling bias.
Furthermore, FW sorting is highly dependent on operator judgment, and common problems such as misclassification, inconsistent separation among technicians, and fatigue during long sorting sessions can compromise the results. Finally, our decision to aggregate the weight of packaging when it contained food and leftovers, like yogurt and jam, is problematic because the packaging’s relative mass contribution can distort the percentage within the FW category. The reported proportion of the “food and leftovers in packaging” fraction may be slightly overestimated because, when separation of food residues from packaging was impractical, the combined mass was recorded during waste sorting. Therefore, despite the category of food and leftovers in packaging having represented only 2.9±0.2% during the study period and less than 5% across the nine regions of Rio de Janeiro, these results should be interpreted with caution, and future investigations must consider segregating residues in packages and quantifying liquid food waste.
We were also unable to separate the edible and inedible fractions of food waste and weigh them separately during this physical assessment. Thus, comparisons with other studies that performed this separation may be under- or overestimated; therefore, the findings should be evaluated with caution.
Finally, it should be noted that the statistical analyses applied in this work were appropriate for the study objectives; future research could benefit from complementary analytical approaches to better evaluate temporal and spatial variation in FW composition. In particular, multivariate and compositional data analysis methods, such as principal component analysis (PCA) applied to centered log-ratio-transformed compositions, or models incorporating region and year as explanatory factors (e.g., generalized linear models), may provide a more comprehensive evaluation of the joint variation among food waste categories.
Future research will expand upon these findings and address the limitations identified herein to improve the reliability and generalizability of the results. Our findings alert public officials and show that gravimetric analysis data can serve as indicators for prioritizing and monitoring waste management efforts in the city. In this sense, a key recommendation is that cities consider conducting periodic compositional analyses of food waste, as is the case in Rio de Janeiro. Another argument in favor of food waste compositional analysis across different regions (neighborhoods) of a city is that the data generated can yield powerful insights into the quality of residents’ diets. For example, Gupta et al. [42] investigated the composition of food waste across different neighborhoods in Seattle, USA. The researchers found a greater presence of unprocessed foods in household waste, such as inedible parts of fruits, vegetables, and salads, in some regions, indicating higher-quality diets there. Results like these can guide the development of policies and context-specific strategies.
This study offers valuable evidence to support the development of policies for food loss and waste management. In that direction, municipal authorities should implement communication and educational campaigns to increase public awareness and encourage behavioral changes that reduce FLW. In parallel, surplus edible food should be recovered and redistributed through food banks, charities, and other donation networks before being redirected to animal feed or industrial applications, whenever permitted by food safety regulations.
Investments in separate collection systems and organic waste valorization infrastructure, such as anaerobic digestion, as well as in decentralized solutions, such as home composting, are essential. These solutions would divert organic waste from landfills, reduce greenhouse gas emissions associated with improper disposal, and contribute to a more circular and resource-efficient waste management system in the municipality of Rio de Janeiro.
5. Conclusions
This three-year physical assessment of household waste in the municipality of Rio de Janeiro (Brazil) found that FW accounted for an average of 47.7±1.7%. About 24,038 kg of FW (fresh weight) were analyzed in the study period. The ranking of the most wasted food categories in the city of Rio de Janeiro aligned with previous quantitative studies, with fruits, vegetables, and salads (70.8±8.9%) > fine aggregates (18.2±5.7%) > proteins (4.3±1.3%). Our findings revealed that the FW composition varied considerably across regions within the city between 2021 and 2022 (p-value < 0.05), potentially reflecting differences in socioeconomic conditions, dietary patterns, consumption behaviors, and other local characteristics. This aspect warrants future investigations to guide policies and locally specific strategies for waste prevention and valorization. The present research took a first step toward understanding the food waste problem in Rio de Janeiro (Brazil). Future research will expand upon the findings and address the limitations identified in this study to improve the reliability and generalizability of the results.
Supplementary Materials
The following supporting information can be downloaded at the website of this paper posted on Preprints.org. Table S1. Zones and regions of the city of Rio de Janeiro (n = 9) included in the gravimetric analysis, with corresponding region codes, number of neighborhoods, total population, and households. Table S2. Raw mass (kg) of each food waste category by region and year in the municipality of Rio de Janeiro.
Author Contributions
Conceptualization, G.F.VA., B.R.Q., A.L.F.M, A.F.L., B.O.F., and F.A.O; Methodology, G.F.V.A., B.R.Q., A.L.F.M., A.F.L., F.B.B., and F.A.O; Validation, R.A. and F.A.O.; Formal Analysis, G.F.VA.; Investigation, G.F.VA., B.R.Q., A.L.F.M. and A.F.L.; Data Curation, F.A.O and R.A.; Writing – Original Draft Preparation, G.F.V.A., B.R.Q. and F.A.O.; Visualization, R.A. and F.A.O, Writing – Review & Editing, F.A.O and R.A.; Supervision, B.R.Q. and F.A.O.; Project Administration, B.O.F.; Funding Acquisition, R.A.
Funding
The APC was funded by Fundação de Amparo à Pesquisa do Estado do Rio de Janeiro - FAPERJ (E-26/204.425/2024).
Acknowledgments
This work was supported by the Municipal Company of Urban Cleaning – COMLURB, Rio de Janeiro, Brazil.
Conflicts of Interest
Authors B.R.Q., A.L.F.M, A.F.L., F.B.B, and B.O.F were employed by the Municipal Company of Urban Cleaning – COMLURB. The remaining authors declare that the research was conducted in the absence of any commercial or financial relationships that could be construed as a potential conflict of interest. The authors declare that this study received funding from Fundação de Amparo à Pesquisa do Estado do Rio de Janeiro - FAPERJ (E-26/204.425/2024), The funder was not involved in the study design, collection, analysis, interpretation of data, the writing of this article or the decision to submit it for publication.
Abbreviations
The following abbreviations are used in this manuscript:
| COVID | Coronavirus disease |
| FLW | Food loss and waste |
| FW | Food waste |
| SD | Standard deviation |
| SDG | Sustainable Development Goal |
| UNEP | United Nations Environment Programme |
| USA | United States of America |
References
- Sivalingam, S.; Nandhitha, S.; Pragadheeshwaran, S.T. A Comprehensive Review on Cradle to Cradle Strategies for Sustainable Food Waste Valorization. Discov. Food 2026, 6, 226. [Google Scholar] [CrossRef]
- Abdel-Shafy, H.I.; Mansour, M.S.M. Solid Waste Issue: Sources, Composition, Disposal, Recycling, and Valorization. Egypt. J. Pet. 2018, 27, 1275–1290. [Google Scholar] [CrossRef]
- Kaza, S.; Yao, L.C.; Bhada-Tata, P.; Van Woerden, F.; Levine, D. What a Waste 2.0: A Global Snapshot of Solid Waste Management to 2050; World Bank: Washington, DC, 2018; ISBN 978-1-4648-1329-0. [Google Scholar]
- Sarker, A.; Ahmmed, R.; Ahsan, S.M.; Rana, J.; Ghosh, M.K.; Nandi, R. A Comprehensive Review of Food Waste Valorization for the Sustainable Management of Global Food Waste. Sustain. Food Technol. 2024, 2, 48–69. [Google Scholar] [CrossRef]
- Agamuthu, P.; Babel, S. Waste Management Developments in the Last Five Decades: Asian Perspective. Waste Manag. Res. J. A Sustain. Circ. Econ. 2023, 41, 1699–1716. [Google Scholar] [CrossRef] [PubMed]
- Willett, W.; Rockström, J.; Loken, B.; Springmann, M.; Lang, T.; Vermeulen, S.; Garnett, T.; Tilman, D.; DeClerck, F.; Wood, A.; et al. Food in the Anthropocene: The EAT–Lancet Commission on Healthy Diets from Sustainable Food Systems. Lancet 2019, 393, 447–492. [Google Scholar] [CrossRef] [PubMed]
- Crippa, M.; Solazzo, E.; Guizzardi, D.; Monforti-Ferrario, F.; Tubiello, F.N.; Leip, A. Food Systems Are Responsible for a Third of Global Anthropogenic GHG Emissions. Nat. Food 2021, 2, 198–209. [Google Scholar] [CrossRef] [PubMed]
- COP28 UAE Declaration on Sustainable Agriculture, Resilient Food Systems, and Climate Action. Available online: https://www.cop28.com/en/food-and-agriculture (accessed on 1 June 2026).
- IPES-Food How Local Governments Are Driving Action on Climate Change through Food FROM PLATE TO PLANET FROM PLATE TO PLANET Project Managers: Nicole Pita et Chantal Wei-Ying Clément This Report Was Developed with the Support of the Full IPES-Food Panel, Including V. 2023.
- Manzoor, S.; Fayaz, U.; Dar, A.H.; Dash, K.K.; Shams, R.; Bashir, I.; Pandey, V.K.; Abdi, G. Sustainable Development Goals through Reducing Food Loss and Food Waste: A Comprehensive Review. Futur. Foods 2024, 9, 100362. [Google Scholar] [CrossRef]
- Papargyropoulou, E.; Fearnyough, K.; Spring, C.; Antal, L. The Future of Surplus Food Redistribution in the UK: Reimagining a ‘Win-Win’ Scenario. Food Policy 2022, 108, 102230. [Google Scholar] [CrossRef]
- Papargyropoulou, E.; Lozano, R.; K. Steinberger, J.; Wright, N.; Ujang, Z. Bin The Food Waste Hierarchy as a Framework for the Management of Food Surplus and Food Waste. J. Clean. Prod. 2014, 76, 106–115. [Google Scholar] [CrossRef]
- Oroski, F. de A. Understanding Food Surplus: Challenges and Strategies for Reducing Food Waste – A Mini-Review. Waste Manag. Res. J. A Sustain. Circ. Econ. 2025, 43, 1400–1409. [Google Scholar] [CrossRef] [PubMed]
- Teigiserova, D.A.; Hamelin, L.; Thomsen, M. Towards Transparent Valorization of Food Surplus, Waste and Loss: Clarifying Definitions, Food Waste Hierarchy, and Role in the Circular Economy. Sci. Total Environ. 2020, 706, 136033. [Google Scholar] [CrossRef] [PubMed]
- Krah, C.Y.; Bahramian, M.; Hynds, P.; Priyadarshini, A. Household Food Waste Generation in High-Income Countries: A Scoping Review and Pooled Analysis between 2010 and 2022. J. Clean. Prod. 2024, 471, 143375. [Google Scholar] [CrossRef]
- Xue, L.; Liu, G.; Parfitt, J.; Liu, X.; Van Herpen, E.; Stenmarck, Å.; O’Connor, C.; Östergren, K.; Cheng, S. Missing Food, Missing Data? A Critical Review of Global Food Losses and Food Waste Data. Environ. Sci. Technol. 2017, 51, 6618–6633. [Google Scholar] [CrossRef] [PubMed]
- United Nations Environment Programme Food Waste Index Report 2024; Nairobi, 2024; ISBN 9789280741391.
- Edjabou, M.E.; Petersen, C.; Scheutz, C.; Astrup, T.F. Food Waste from Danish Households: Generation and Composition. Waste Manag. 2016, 52, 256–268. [Google Scholar] [CrossRef] [PubMed]
- Lourenco, C.E.; Porpino, G.; Araujo, C.M.L.; Vieira, L.M.; Matzembacher, D.E. We Need to Talk about Infrequent High Volume Household Food Waste: A Theory of Planned Behaviour Perspective. Sustain. Prod. Consum. 2022, 33, 38–48. [Google Scholar] [CrossRef]
- Franco, C.S.; Oliveira, L.F.C.; Silva, A.M.; Fia, R.; Moreira, S.N. Household Solid Waste: Influence of City Size and Economic Class in Southern Minas Gerais, Brazil. J. Solid Waste Technol. Manag. 2016, 42, 308–318. [Google Scholar] [CrossRef]
- da Silva, G.P.C.; Assunção, F.P. da C.; Pereira, D.O.; Ferreira, J.F.H.; Mathews, J.C.; Sandim, D.P.R.; Borges, H.R.; do Nascimento, M.S.C.; Mendonça, N.M.; de Sousa Brandão, I.W.; et al. Analysis of the Gravimetric Composition of Urban Solid Waste from the Municipality of Belém/PA. Sustainability 2024, 16, 5438. [Google Scholar] [CrossRef]
- Mondelli, G.; Juarez, M.B.; Jacinto, C.; de Oliveira, M.A.; Coelho, L.H.G.; Biancardi, C.B.; de Castro Faria, J.L. Geo-Environmental and Geotechnical Characterization of Municipal Solid Waste from the Selective Collection in São Paulo City, Brazil. Environ. Sci. Pollut. Res. 2022, 29, 19898–19912. [Google Scholar] [CrossRef] [PubMed]
- IBGE CIDADES E ESTADOS DO BRASIL. Available online: https://cidades.ibge.gov.br/brasil/rj/rio-de-janeiro/panorama (accessed on 3 June 2026).
- de Almeida, R.; Lúcio de Souza Teixeira, R. Impacts of the COVID-19/2020 Pandemic on the Waste Sector of Rio de Janeiro Municipality, Brazil: Assessment on Solid Waste Production in 2018 – 2023. Waste Manag. Bull. 2024, 2, 162–171. [Google Scholar] [CrossRef]
- Prefeitura da Cidade do Rio de Janeiro Plano Municipal de Gestão Integrada de Resíduos Sólidos – PMGIRS Da Cidade Do Rio de Janeiro; Rio de Janeiro, 2020.
- IBGE Pesquisa de Orçamentos Familiares 2017-2018: Análise Do Consumo Alimentar Pessoal No Brasil; 2020; ISBN 9788524041389.
- Lebersorger, S.; Schneider, F. Discussion on the Methodology for Determining Food Waste in Household Waste Composition Studies. Waste Manag. 2011, 31, 1924–1933. [Google Scholar] [CrossRef] [PubMed]
- Okayama, T.; Watanabe, K.; Yamakawa, H. Sorting Analysis of Household Food Waste—Development of a Methodology Compatible with the Aims of SDG12.3. Sustainability 2021, 13, 8576. [Google Scholar] [CrossRef]
- Prefeitura da Cidade do Rio de Janeiro Principais Características Do Lixo Domiciliar: Composição Gravimétrica Percentual, Peso Específico e Teor de Umidade Segundo as Áreas de Planejamento (AP) Do Município Do Rio de Janeiro Entre 1995-2024. Available online: https://www.data.rio/documents/ccdc3c0946ff430db6ef479befe8a5a5/about (accessed on 5 June 2026).
- WRAP. Household Food and Drink Waste in the United Kingdom 2022; 2025. [Google Scholar]
- Yousefi, M.; Oskoei, V.; Jonidi Jafari, A.; Farzadkia, M.; Hasham Firooz, M.; Abdollahinejad, B.; Torkashvand, J. Municipal Solid Waste Management during COVID-19 Pandemic: Effects and Repercussions. Environ. Sci. Pollut. Res. 2021, 28, 32200–32209. [Google Scholar] [CrossRef] [PubMed]
- Jribi, S.; Ben Ismail, H.; Doggui, D.; Debbabi, H. COVID-19 Virus Outbreak Lockdown: What Impacts on Household Food Wastage? Environ. Dev. Sustain. 2020, 22, 3939–3955. [Google Scholar] [CrossRef] [PubMed]
- Saha, B.; Khan, M.T.; Graupman, M.; Aslam, H.M.U.; Gupta, A.K.; Helmin, G.; Larson, M.; Chard, K.; Hayes, B.; Anderson, R.; et al. Impacts of the COVID-19 Pandemic on Landfilling and Recycling in the City of Fargo, North Dakota, USA. J. Air Waste Manag. Assoc. 2023, 73, 618–624. [Google Scholar] [CrossRef] [PubMed]
- Hermanussen, H.; Loy, J.-P.; Egamberdiev, B. Determinants of Food Waste from Household Food Consumption: A Case Study from Field Survey in Germany. Int. J. Environ. Res. Public Health 2022, 19, 14253. [Google Scholar] [CrossRef] [PubMed]
- Ilakovac, B.; Voca, N.; Pezo, L.; Cerjak, M. Quantification and Determination of Household Food Waste and Its Relation to Sociodemographic Characteristics in Croatia. Waste Manag. 2020, 102, 231–240. [Google Scholar] [CrossRef] [PubMed]
- Elimelech, E.; Ayalon, O.; Ert, E. What Gets Measured Gets Managed: A New Method of Measuring Household Food Waste. Waste Manag. 2018, 76, 68–81. [Google Scholar] [CrossRef] [PubMed]
- Parizeau, K.; von Massow, M.; Martin, R. Household-Level Dynamics of Food Waste Production and Related Beliefs, Attitudes, and Behaviours in Guelph, Ontario. Waste Manag. 2015, 35, 207–217. [Google Scholar] [CrossRef] [PubMed]
- dos Santos, R.H.; Malacoski, F.C.F.; Schiavi, S.M. de A.; de Souza, J.P. CADEIA DE FRUTAS, VERDURAS E LEGUMES NO BRASIL: UMA REVISÃO BIBLIOGRÁFICA SOBRE AS TRANSAÇÕES E ESTRUTURAS DE GOVERNANÇA. Organ. Rurais Agroindustriais 2022, 24, 1–17. [Google Scholar] [CrossRef]
- Porpino, G.; Parente, J.; Wansink, B. Food Waste Paradox: Antecedents of Food Disposal in Low Income Households. Int. J. Consum. Stud. 2015, 39, 619–629. [Google Scholar] [CrossRef]
- Durán-Sandoval, D.; Durán-Romero, G.; López, A.M. Assessing Food Loss and Waste in Chile: Insights for Policy and Sustainable Development Goals. Resources 2024, 13, 91. [Google Scholar] [CrossRef]
- Costa, B.V. de L.; Cordeiro, N.G.; Bocardi, V.B.; Fernandes, G.R.; Pereira, S.C.L.; Claro, R.M.; Duarte, C.K. Food Loss and Food Waste Research in Latin America: Scoping Review. Cien. Saude Colet. 2024, 29. [Google Scholar] [CrossRef] [PubMed]
- Gupta, S.; Rose, C.M.; Buszkiewicz, J.; Otten, J.; Spiker, M.L.; Drewnowski, A. Inedible Food Waste Linked to Diet Quality and Food Spending in the Seattle Obesity Study SOS III. Nutrients 2021, 13, 479. [Google Scholar] [CrossRef] [PubMed]
Figure 1.
Composition of household waste in Rio de Janeiro municipality (2021–2023): mean proportions of organic matter, paper, plastic, and other materials.
Figure 1.
Composition of household waste in Rio de Janeiro municipality (2021–2023): mean proportions of organic matter, paper, plastic, and other materials.
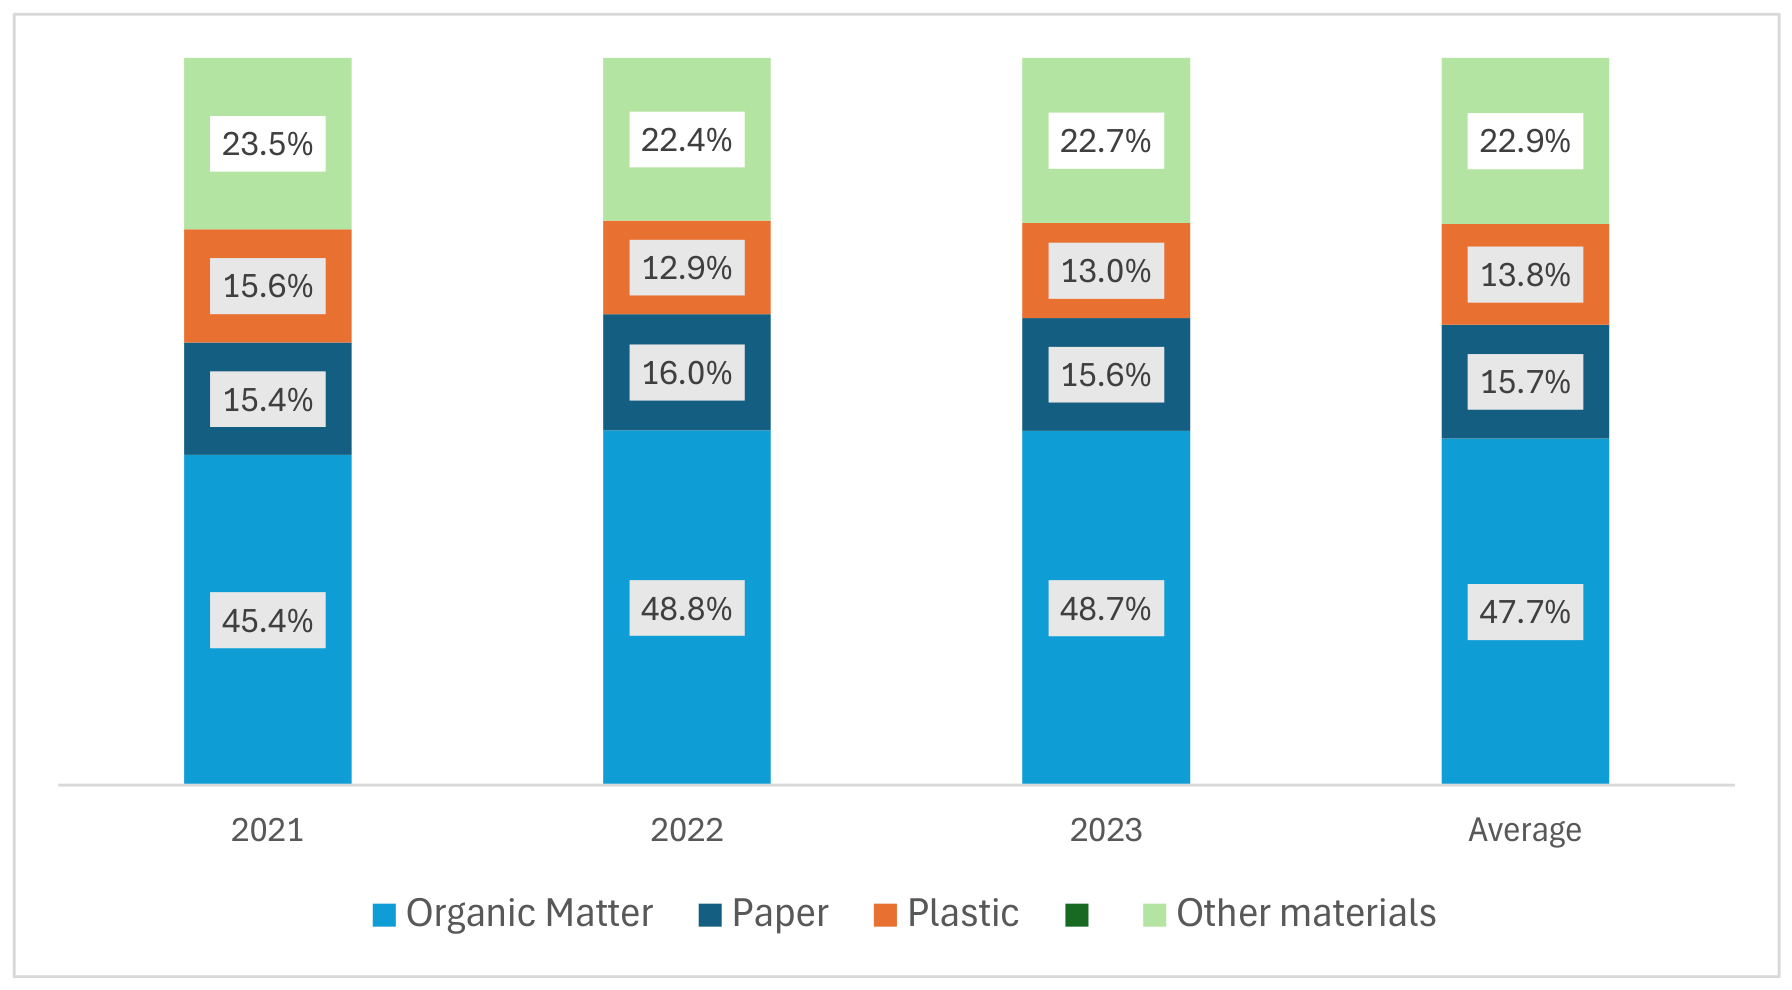
Figure 2.
FW composition in the Rio de Janeiro municipality (2021 – 2023), with the mean value over the period.
Figure 2.
FW composition in the Rio de Janeiro municipality (2021 – 2023), with the mean value over the period.
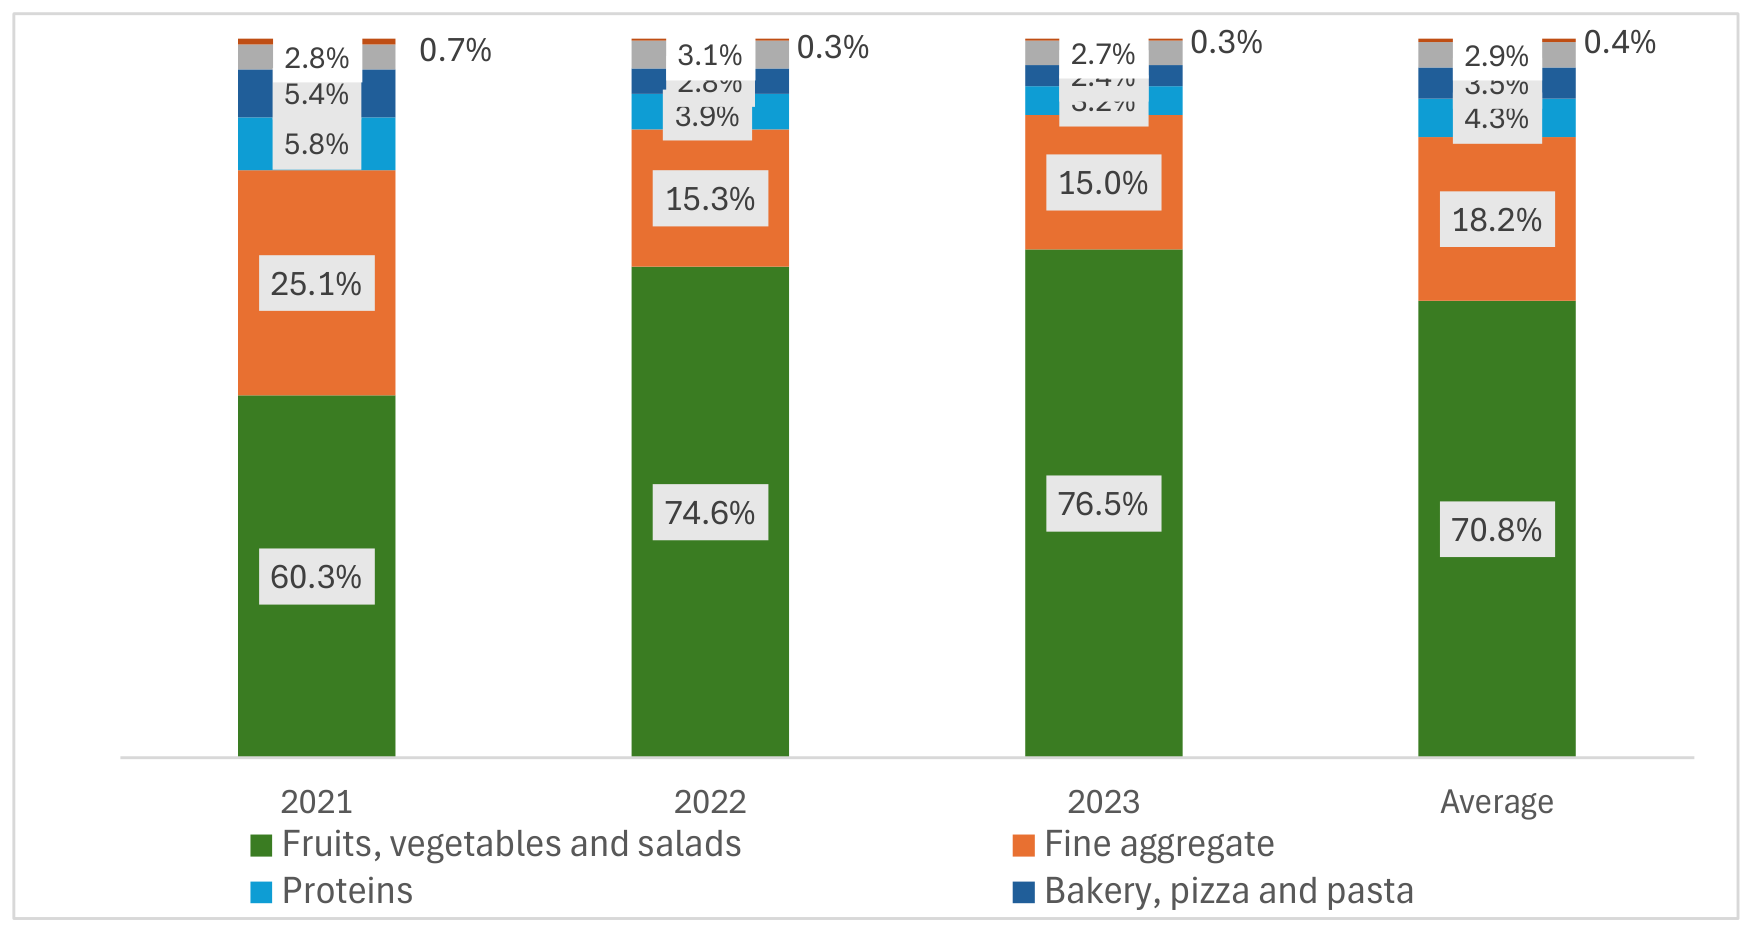
Figure 3.
Examples of edible food waste identified in the study: (a) eggplants, (b) leafy vegetables (cabbage and watercress), (c) raw chicken meat, (d) bread rolls, (e) cheese and processed bread, and (f) yogurt and cottage cheese.
Figure 3.
Examples of edible food waste identified in the study: (a) eggplants, (b) leafy vegetables (cabbage and watercress), (c) raw chicken meat, (d) bread rolls, (e) cheese and processed bread, and (f) yogurt and cottage cheese.
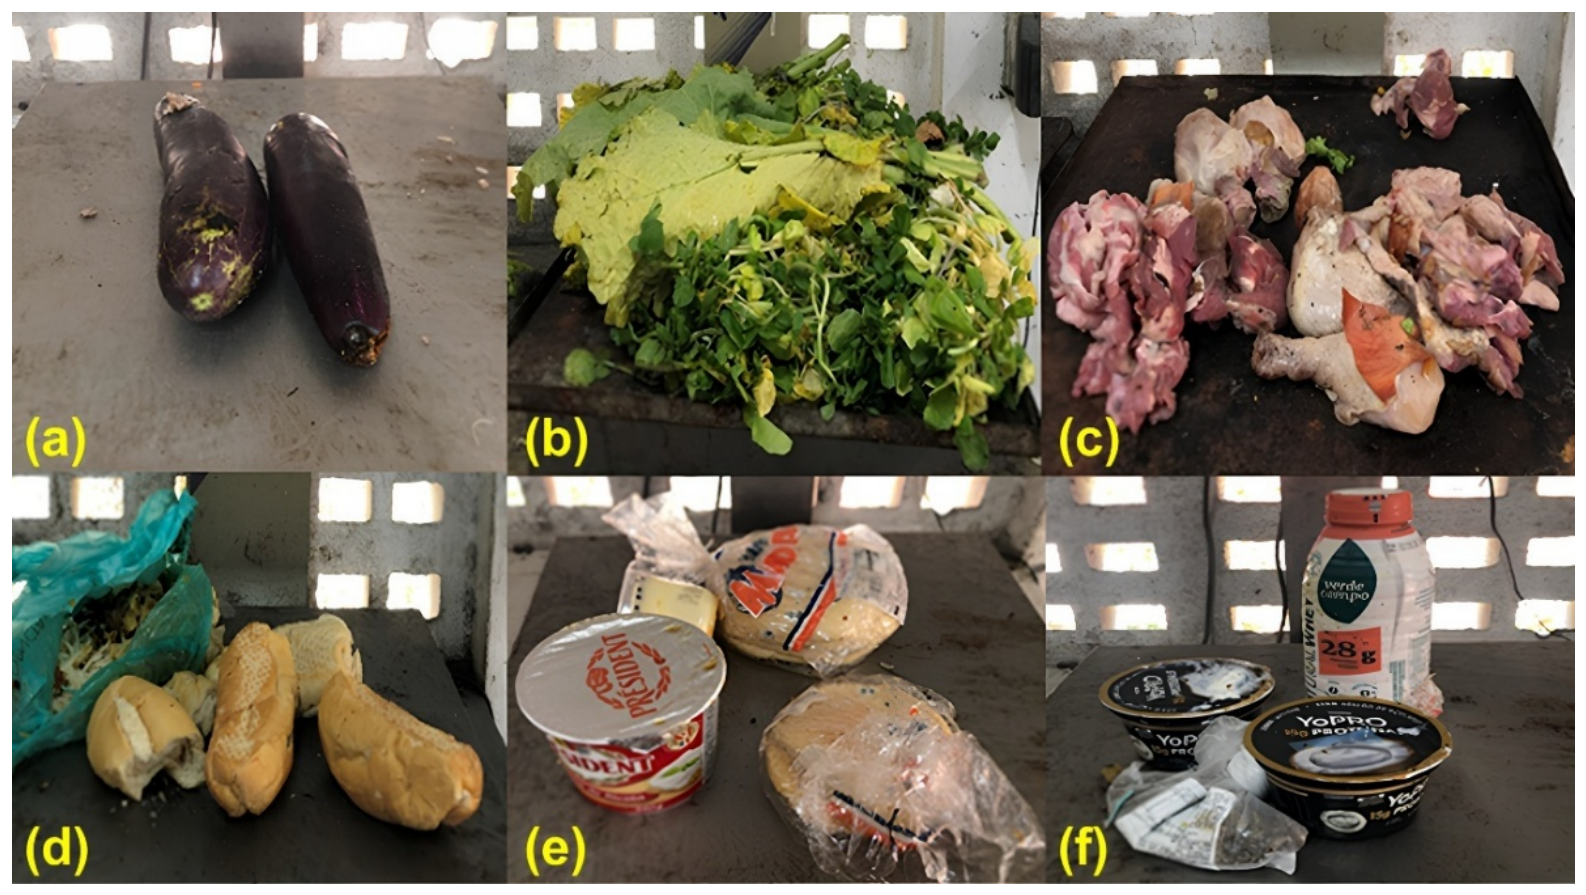

Table 1.
Classification of FW categories adopted in the gravimetric assessment in this study.
| Category | Description | Examples |
|---|---|---|
| Fruits, vegetables, and salads | It comprises discarded fruits, vegetables, and salad items, including both edible portions and inedible parts generated during food preparation, consumption, and storage | Unused or spoiled fruits, salads, and vegetables, peels, seeds, stems, cores, and outer leaves |
| Confectionery, cakes, and desserts | Discarded sweet food and dessert preparations | Snacks, cakes, pastries, cookies, puddings, etc. |
| Proteins | Discarded animal-based protein foods | Meat, chicken, fish (edible and inedible parts), eggs, as well as associated edible and inedible residues (e.g., bones, skin, and cartilage). |
| Bakery, pizza, and pasta | It includes discarded bakery products, encompassing both prepared and unconsumed portions generated during food preparation and consumption | Bread, pizza, pasta, and cereal-based foods |
| Fine aggregate | Small-sized food residues with a characteristic size of less than one inch (2.54 cm) | Rice, beans, grains, flour, coffee grounds, and fragmented food particles |
| Food and leftovers remaining in packaging | Residues and leftover food items that remained partially or fully contained within their original packaging when complete separation of the contents from the packaging was not feasible | Closed packaging and partially consumed items, such as yogurt, cottage cheese, sauces, jams |
Table 2.
Average FW composition percentage per region within each zone of the Rio de Janeiro municipality, for the period 2021–2023. SD = standard deviation.
Table 2.
Average FW composition percentage per region within each zone of the Rio de Janeiro municipality, for the period 2021–2023. SD = standard deviation.
| FW components | Zones and regions of Rio de Janeiro, Mean±SD (Mín – Máx) | |||||||||
|---|---|---|---|---|---|---|---|---|---|---|
| North | West | Central | South | FW composition of RJ city | ||||||
| Region 1 |
Region 2 |
Region 9 |
Region 3 |
Region 4 |
Region 7 |
Region 8 |
Region 5 |
Region 6 |
||
| Fruits, vegetables, and salads | 74.6±8.0% (64.3 – 78.8%) | 68.4±9.8% (57. 8 – 74.8%) | 73.1±4.0% (67.8 – 75.7%) | 74.3±7.8% (64.2 – 79.3%) | 70.6±9.0% (61.1 – 77.1%) | 71.3±7.5% (61.8 – 75.6%) | 73.0±10.1% (59.5 – 78.5%) | 69.3±8.2% (57.2 – 76.6%) | 73.1±6.9% (64.8 – 76.7%) | 70.8±8.9% (60.3 – 76.5%) |
| Confectionery, cakes, and desserts | 0.3±0.1% (0.21 – 0.58%) | 0.4±0.1% (0.3 – 0.5%) | 0.3±0.1% (0.12 – 0.35%) | 0.30±0.04% (0.22 – 0.30) | 0.9±0.7% (0.32 – 1.63%) | 0.2±0.1% (0.16 – 0.34%) | 0.3±0.2% (0.22 – 0.65%) | 0.3±0.3% (0.10 – 0.73%) | 0.3±0.2% (0.11 – 0.37%) | 0.4±0.1% (0.32 – 0.68%) |
| Proteins | 3.6±1.2% (2.7 – 5.1) | 4.5±1.7±% (3,0 – 6.3%) | 4.5±1.0% (3.7 – 5.7%) | 3.5±0.7% (2.7 – 3.9%) | 4.3±1.3% (3.2 – 5.6%) | 3.7±1.5% (2.9 – 5.6%) | 3.7±1.1% (3.1 – 5.2%) | 5.7±1.3% (3.7 – 7.1%) | 4.3±0.6% (3.8 – 5.0%) | 4.3±1.3% (3.2 – 5.8%) |
| Bakery, pizza, and pasta | 2.9±1.4% (1.8 – 4.6%) | 3.8±1.8% (2.3 – 5.8%) | 2.8±0.7% (2.3 – 3.7%) | 3.2±1.8% (2.3 – 5.5%) | 3.1±1.4% (2.0 – 4.6%) | 4.0±2.0% (2.6 – 6.4%) | 3.0±1.7% (2.1 – 5.3%) | 4.6±1.5% (3.3 – 6.9%) | 2.6±0.4% (2.4 – 3.2%) | 3.5±1.6% (2.4 – 5.4%) |
| Fine aggregate | 15.6±4.7% (13.0 – 21.6%) | 20.2±6.1% (16.2 – 27.1%) | 15.1±2.3% (13.2 – 17.8%) | 15.2±5.2% (12.2 – 22.0%) | 18.0±5.7% (13.8 – 23.8%) | 18.5±4.2% (15.4 – 23.5%) | 17.8±6.6% (24.6 – 14.2%) | 17.8±5.0% (13.8 – 25.2%) | 15.9±5.8% (12.1 – 22.9%) | 18.2±5.7% (15.0 – 25.1%) |
| Food and leftovers in packaging | 3.0±1.0% (2.1 – 3.9%) | 2.8±0.3% (2.6 – 3.2%) | 4.1±1.2% (2.8 – 5.2%) | 3.6±0.4% (3.4 – 4.0%) | 3.1±0.4% (2.7 – 3.4%) | 2.3±0.9% (1.5 – 3.3%) | 2.2±0.4% (1.9 – 2.7%) | 2.4±0.4% (2.0 – 2.9%) | 3.7±1.1% (2.6 – 4.8%) | 2.9±0.2% (2.7 – 3.1%) |
Table 3.
Results of the adherence test (p-value) for FW composition in each of the nine regions of the Rio de Janeiro municipality (2021–2023).
Table 3.
Results of the adherence test (p-value) for FW composition in each of the nine regions of the Rio de Janeiro municipality (2021–2023).
| Regions | 2021 | 2022 | 2023 |
|---|---|---|---|
| Region 1 | 0.5026 | 0.5582 | 0.7826 |
| Region 2 | 0.0312* | 0.5150 | 0.0785 |
| Region 3 | 0.3099 | 0.8172 | 0.4192 |
| Region 4 | 0.0075* | 0.5441 | 0.8475 |
| Region 5 | 0.3974 | 0.0317* | 0.5592 |
| Region 6 | 0.0630 | 0.0135* | 0.6219 |
| Region 7 | 0.6949 | 0.0219* | 0.8985 |
| Region 8 | 0.9500 | 0.2463 | 0.5550 |
| Region 9 | 0.0421* | 0.3248 | 0.5548 |
*p-value < 0.05.
Table 4.
Three most wasted food categories reported in the literature, with mean values from each study.
Table 4.
Three most wasted food categories reported in the literature, with mean values from each study.
| Country | Method | 1st category | 2nd category | 3rd category | Reference | ||
|---|---|---|---|---|---|---|---|
| United Kingdom | Survey and compositional analysis | Fresh vegetables and salads 28% |
All other food and drink 19% |
Meals (home-made and pre-prepared 12% |
[30] | ||
| German | Questionnaire-based surveys and diary (self-assessment) | Fruit and vegetables 34% |
Bakery products 14% |
Dairy products 14% |
[34] | ||
| Croatia | Diary (self-assessment) | Fruit and vegetables 46% | Other foods (eggshells, coffee grounds, others) 12% | Bakery 9% | [35] | ||
| Israel | Survey and compositional analysis | Fruits and vegetables 67.5% | Bread/ bakery 14.1% | Milk and dairy products 8% | [36] | ||
| Denmark | Compositional analysis | Fresh vegetables and salads 30% | Fresh fruit 17% | Bakery 13% | [18] | ||
| Canada | Survey and compositional analysis | Fruits and vegetables 63% | Bread and cereals -14% | Meat and Fish 9% | [37] | ||
| Brazil | Compositional analysis | Fruits, vegetables, and salads 70.8% |
Fine aggregate (rice, beans, fragmented food particles) 18.2% |
Proteins 4.3% |
Current study |
Disclaimer/Publisher’s Note: The statements, opinions and data contained in all publications are solely those of the individual author(s) and contributor(s) and not of MDPI and/or the editor(s). MDPI and/or the editor(s) disclaim responsibility for any injury to people or property resulting from any ideas, methods, instructions or products referred to in the content. |
© 2026 by the authors. Licensee MDPI, Basel, Switzerland. This article is an open access article distributed under the terms and conditions of the Creative Commons Attribution (CC BY) license (http://creativecommons.org/licenses/by/4.0/).
Copyright: This open access article is published under a Creative Commons CC BY 4.0 license, which permit the free download, distribution, and reuse, provided that the author and preprint are cited in any reuse.