
Submitted:
07 July 2026
Posted:
09 July 2026
You are already at the latest version
Abstract
This study presents an enhanced unified feature representation for classical one-class anomaly detection in industrial image inspection using the MVTec AD dataset. Experiments were conducted on all fifteen categories of the MVTec AD dataset, including object and texture categories. Unlike raw pixel-based representations, the proposed feature representation integrates raw intensity information, histogram of oriented gradients (HOG), local binary pattern (LBP), gray-level co-occurrence matrix (GLCM)-based texture descriptors, and basic statistical intensity features. These complementary descriptors were evaluated with classical one-class anomaly detection methods, including PCA-based reconstruction, kNN-density, Local Outlier Factor, One-Class SVM with RBF kernel, Isolation Forest, and Mahalanobis-PCA. Considering the class imbalance inherent in anomaly detection tasks, Average Precision (AP) was used as the primary evaluation metric, while ROC-AUC and F1@95%-training-quantile were reported as supporting metrics. The results showed that PCA-based reconstruction achieved the strongest overall performance with a mean ROC-AUC of 0.8289, mean AP of 0.9254, and mean F1@95%-training-quantile of 0.8343. Category-based analyses showed particularly strong discrimination in the bottle, toothbrush, leather, transistor, and zipper categories, whereas carpet, screw, and grid remained more challenging. The findings indicate that carefully designed classical feature representations can provide an explainable and CPU-friendly baseline for industrial anomaly detection, particularly at the model-inference stage, while feature extraction remains the dominant computational cost.
Keywords:
PCA reconstruction
; HOG
; LBP
; GLCM
; industrial image inspection
1. Introduction
Visual-based quality control systems play a critical role in error detection and reliability in industrial production processes. Traditional inspection methods are mostly based on human observation and have limitations in terms of scalability, consistency, and cost. Therefore, automated visual anomaly detection methods have become an important research area in recent years [1,2,3]. In particular, the rarity of defective samples and unbalanced data distribution in production lines distinguish the problem from classical supervised classification approaches [4]. The anomaly detection literature is generally examined under two main categories: supervised and one-class approaches. Although supervised methods produce successful results when a sufficient number of defective samples are available, the limited number of defective samples in industrial applications reduces the generalizability of these methods [5,6]. Therefore, one-class learning and novelty detection approaches offer more suitable solutions [7]. One-class support vector machines (One-Class SVM) are one of the most widely used methods in the field of anomaly detection. This approach, proposed by Schölkopf et al., detects deviations by learning the boundary of normal data [8]. Similarly, local density-based methods also play an important role. The Local Outlier Factor (LOF) method identifies anomalous samples by analyzing the local neighborhood structure of the data [9]. Isolation Forest, on the other hand, models the anomaly based on the ease of separating the anomaly by randomly dividing the samples [10].
Density estimation-based approaches are also widely discussed in the literature. k-nearest neighbor-based density estimation methods can provide simple but effective results, especially in high-dimensional data spaces [11]. In addition, dimensionality reduction and reconstruction-based approaches are widely used in anomaly detection problems. Principal Component Analysis (PCA) generates anomaly scores based on reconstruction error by obtaining a low-dimensional representation of the data [12]. PCA-based reconstruction methods are considered powerful and computationally efficient approaches, particularly for industrial visual anomaly detection tasks [13]. Reconstruction-based anomaly detection approaches remain widely used in industrial visual inspection because they model deviations from the learned normal data distribution through reconstruction error analysis [14,15]. Such approaches are particularly attractive for lightweight anomaly detection systems due to their computational efficiency and interpretability. In recent years, deep learning-based methods have also achieved significant success in visual anomaly detection. Autoencoder architectures perform defect detection based on reconstruction error by learning the representation of normal samples [16,17,18]. The MVTec AD dataset proposed by Bergmann et al. has provided a standard evaluation framework in this field and made objective comparison of methods possible [19]. The MVTec AD dataset consists of high-resolution industrial images including both object and textile categories and is widely used in the literature [20].
Heckler-Kram, Rippel, Seitzer, and Becker (2025) introduced the MVTec AD 2 dataset, bringing more realistic inspection scenarios such as transparent/overlapping objects and very small defects to the literature [21]. Mao (2025) compiled industrial image anomaly detection comprehensively, discussing the limitations of unsupervised/semi-supervised approaches and metric preferences in practical production conditions [22]. Li (2025) presented an application-oriented framework by dividing deep learning-based industrial visual anomaly detection into method families [23]. Hendria (2025) aimed to increase efficiency in industrial inspection with multi-model frameworks [24]. Hoang (2025) proposed a lightweight and practical anomaly detection-localization approach with low light/good lighting pairs [25]. Mokhtar (2025) proposed novel labeled sub-benchmarks on MVTec-AD/VisA by addressing anomaly classification with multimodal large language models [26]. Yue (2026) introduced the language-oriented “referring” anomaly segmentation paradigm [27], while diffusion inversion-based training-free anomaly localization approaches have also been strengthened [28]. In recent years, studies on industrial visual anomaly detection have shown an increase in data diversity and the importance of comparative analyses through benchmark datasets. Multi-category datasets, especially MVTec AD, play a critical role in revealing how methods behave under different product geometries and defect types. However, many studies in the literature either report performance on a single category or evaluate methods based on a limited number of metrics. This makes it difficult to analyze the category-based performance changes and metric sensitivities of the methods in a holistic manner. In this study, considering the aforementioned gap, classical one-class anomaly detection methods were systematically and comparatively analyzed on fifteen different MVTec AD categories. Both the category-based performance distributions and the category-independent average success rates of the methods were evaluated together. Furthermore, sensitivity differences between metrics were examined through the simultaneous reporting of ROC-AUC, Average Precision (AP), and F1 scores, allowing for a comparison of the methods not only in terms of overall success but also in terms of behavioral stability under different product types. A systematic comparison of classical one-class, density-based, reconstruction-based, and covariance-based methods was performed on the dataset PCA reconstruction, kNN density estimation, LOF (novelty detection), One-Class SVM (RBF kernel), Isolation Forest, and Mahalanobis-PCA methods were evaluated under the same feature extraction process. All methods generated image-level anomaly scores, and ROC-AUC, Average Precision (AP), and F1 scores were used as performance metrics. The literature indicates that the Average Precision metric is more discriminatory, especially in anomaly problems involving data imbalance [5,29,30]. Therefore, in this study, the AP metric was considered as the primary evaluation metric, while the other metrics were reported as supporting criteria. Although recent studies have mainly focused on deep learning-based industrial anomaly detection, such approaches often require high computational resources, GPU-dependent training, and relatively complex deployment conditions. In contrast, classical one-class anomaly detection methods remain attractive for industrial inspection systems due to their interpretability, lower computational complexity, and easier implementation. However, their performance strongly depends on the quality of the feature representation. Raw pixel-based representations may be insufficient to capture edge orientation, local texture changes, and second-order statistical relationships that are critical for detecting subtle industrial defects. Therefore, the design of an enhanced yet computationally lightweight feature representation remains an important research need.
The aim of this study is to systematically evaluate classical one-class anomaly detection methods under an enhanced unified feature representation on all fifteen categories of the MVTec AD dataset. The proposed representation combines raw intensity information, HOG descriptors, LBP texture patterns, GLCM-based second-order statistical texture features, and basic intensity statistics [31,32,33]. In this way, the study investigates whether a carefully designed classical feature representation can improve the discriminative capacity and stability of one-class anomaly detection methods without relying on deep learning-based feature extraction.
The main contributions of this study are summarized as follows:
- A unified handcrafted feature representation combining raw intensity, HOG, LBP, GLCM, and statistical intensity descriptors is evaluated for classical one-class industrial anomaly detection.
- A direct raw pixel baseline comparison is provided to quantify the contribution of the enhanced feature representation beyond global pixel-level intensity information.
- A descriptor-level ablation study is conducted to analyze the individual and combined effects of raw intensity, HOG, LBP, GLCM, and statistical features.
- Multiple classical one-class anomaly detection methods, including PCA reconstruction, kNN-density, LOF, One-Class SVM, Isolation Forest, and Mahalanobis-PCA, are evaluated under the same experimental protocol.
- A training-score-based thresholding strategy is used for F1 evaluation to avoid information leakage from the test set.
- CPU-based computational efficiency measurements are reported to quantitatively support the lightweight model-inference claim.
- Category-level strengths and limitations are analyzed to clarify the behavior of handcrafted feature-based models on texture-dominated and subtle-defect categories.
2. Materials and Methods
2.1. Dataset Description
In this study, all fifteen categories of the MVTec AD dataset were used, including bottle, cable, capsule, carpet, grid, hazelnut, leather, metal_nut, pill, screw, tile, toothbrush, transistor, wood, and zipper. These categories include both object and texture classes and provide a comprehensive benchmark for evaluating anomaly detection performance under different industrial surface structures, product geometries, and defect characteristics. Only normal samples were used during the training phase, while both normal and defective samples were evaluated during the testing phase. The number of training and test samples for each category is presented in Table 1. All images were resized to 256 × 256 pixels before feature extraction.
2.2. Enhanced Unified Feature Representation
All images were first converted to grayscale and resized to a fixed spatial resolution to ensure experimental consistency. In addition, histogram equalization and Gaussian smoothing were applied as preprocessing steps to reduce illumination-related variations and suppress minor noise effects. Instead of relying only on raw pixel-level representations, this study used an enhanced unified feature representation that combines complementary structural, local texture, statistical texture, and intensity-based descriptors.
The raw intensity component was obtained by resizing each image to 64×64 pixels and converting it into a normalized one-dimensional vector. This component preserves global appearance information. To capture edge orientation and structural shape information, histogram of oriented gradients (HOG) descriptors were extracted. HOG features are particularly useful for representing local gradient distributions and structural changes caused by surface defects. Local binary pattern (LBP) descriptors were used to describe local texture variations by encoding neighborhood intensity differences. Since many industrial defects appear as local textural irregularities, LBP provides a useful representation for texture-sensitive anomaly detection. In addition, gray-level co-occurrence matrix (GLCM)-based features were extracted to capture second-order statistical texture relationships. The GLCM descriptors included contrast, dissimilarity, homogeneity, energy, correlation, and angular second moment values calculated over multiple distances and orientations. Finally, basic statistical intensity descriptors, including mean, standard deviation, minimum, maximum, median, and quartile values, were added to represent global intensity distribution characteristics. The final enhanced feature vector was constructed by concatenating raw intensity features, HOG descriptors, LBP histograms, GLCM texture features, and statistical intensity features. Before model training, all feature dimensions were standardized using z-score normalization. Since one-class anomaly detection methods are sensitive to feature scale, standardization was applied using only the normal training samples and then transferred to the test set. Dimensionality reduction was performed using PCA where required by the corresponding anomaly detection method. To improve reproducibility, the main preprocessing and feature extraction parameters used in the proposed enhanced unified representation are summarized in Table 2.
Representative normal and defective images from all fifteen MVTec AD categories are shown in Figure 1.
As observed in Figure 1, defects exhibit different morphological and structural characteristics across the MVTec AD categories. While some defects are concentrated in localized and small regions, others are distributed over larger surface areas. This variability increases the difficulty of anomaly detection, particularly when only raw pixel representations are used. The representative samples presented in Figure 1 demonstrate the visual diversity and structural complexity of industrial anomalies under different category structures. Therefore, this study employs an enhanced unified feature representation designed to capture complementary structural, local texture, statistical texture, and intensity-based information. The overall workflow of the proposed feature extraction and anomaly detection framework is illustrated in Figure 2.
2.3. Anomaly Detection Methods
Classical one-class anomaly detection methods were evaluated under the proposed enhanced unified feature representation framework on all fifteen categories of the MVTec AD dataset. All anomaly detection models were trained exclusively using normal (defect-free) training samples, while both normal and defective samples were evaluated during the testing phase. Instead of producing direct binary predictions, all evaluated methods generated continuous anomaly scores for each sample. These anomaly scores were subsequently used to calculate threshold-independent and threshold-dependent performance metrics. The evaluated methods included PCA-based reconstruction error (PCA(recon)), kNN-density, Local Outlier Factor (LOF) in novelty detection mode, One-Class SVM with radial basis function (RBF) kernel, Isolation Forest, and Mahalanobis distance with shrinkage covariance after PCA dimensionality reduction. In the PCA(recon) approach, anomaly scores were obtained from reconstruction errors after dimensionality reduction. The kNN-density method calculated anomaly scores according to neighborhood distance distributions in the feature space. The LOF method evaluated local density deviations between neighboring samples to identify anomalies. One-Class SVM constructed a nonlinear decision boundary using the RBF kernel to separate normal samples from outliers. Isolation Forest generated anomaly scores based on random tree partitioning and isolation depth. The Mahalanobis-based model computed anomaly scores according to the distance of test samples from the normal training distribution in the PCA-reduced feature space, using shrinkage covariance estimation to improve numerical stability in high-dimensional feature representations.
To improve the reliability of the comparison, several parameter variants were evaluated for the distance-based, density-based, and ensemble-based methods. For the kNN-density method, neighborhood sizes of k = 3, 5, 10, and 20 were tested. For LOF, neighborhood sizes of 10, 20, and 35 were evaluated. For One-Class SVM, different ν parameter values were examined using the RBF kernel. Isolation Forest was evaluated using different numbers of estimators. PCA-based reconstruction models were configured to preserve the majority of the variance within the feature space during dimensionality reduction. The final comparison reports the best-performing parameter configurations together with the PCA reconstruction baseline. For reproducibility, the final parameter configuration selected for each anomaly detection method is reported together with the experimental results, and PCA-based dimensionality reduction was fixed according to the variance-retention strategy specified in Table 2.
Three performance metrics were calculated for each category and method: ROC-AUC, Average Precision (AP), and F1 score. ROC-AUC was used to evaluate the threshold-independent discrimination capacity of the methods. Since industrial anomaly detection problems inherently involve class imbalance, Average Precision (AP) was considered as the primary evaluation metric. AP represents the area under the precision-recall curve and provides a more informative evaluation under imbalanced conditions. The F1 score was used to analyze the balance between precision and recall at a selected decision threshold. Because anomaly detection methods generate continuous anomaly scores rather than direct binary outputs, a fixed decision threshold was required for threshold-dependent evaluation. To avoid information leakage from the test set, the decision threshold was not optimized using test labels. For each category and method, the threshold was determined only from the anomaly scores of normal training samples. Specifically, the 95th percentile of the normal training-score distribution was used as the operating threshold, corresponding to an approximately 5% expected false-positive rate on normal data. Therefore, the threshold-dependent performance is reported as F1@95%-training-quantile, while ROC-AUC and Average Precision (AP) are reported as threshold-independent metrics.
2.4. Evaluation Metrics
Three evaluation metrics were employed to analyze the performance of the anomaly detection methods from complementary perspectives: ROC-AUC, AP, and F1 score. Since anomaly detection methods generate continuous anomaly scores rather than direct class labels, the combined use of multiple evaluation metrics provides a more comprehensive interpretation of discrimination capability and classification behavior under different decision conditions. ROC-AUC was used to evaluate the threshold-independent discrimination performance of the models. This metric analyzes the relationship between the true positive rate and false positive rate across varying threshold values and reflects the overall capability of the model to distinguish normal samples from anomalous samples. Because ROC-AUC evaluates performance independently of a fixed threshold, it is widely used for global model comparison in industrial anomaly detection studies. In addition to ROC-AUC, AP was employed as a primary evaluation metric due to the class imbalance inherent in anomaly detection problems. AP represents the area under the precision-recall curve and provides a more informative assessment in scenarios where defective samples are considerably fewer than normal samples. Compared with ROC-based evaluation, AP is more sensitive to false positive behavior under imbalanced conditions and therefore provides a more realistic interpretation of practical industrial inspection performance.
The F1 score was used to evaluate threshold-dependent decision performance. To avoid information leakage from the test set, the decision threshold was not optimized using test labels. Instead, for each category and method, the threshold was determined only from the anomaly scores of normal training samples. Specifically, the 95th percentile of the normal training-score distribution was used as the operating threshold, corresponding to an approximately 5% expected false-positive rate on normal data. Therefore, the threshold-dependent performance is reported as F1@95%-training-quantile, while ROC-AUC and Average Precision (AP) are interpreted as threshold-independent ranking metrics.
2.5 Computational Efficiency Evaluation
To quantitatively support the computationally lightweight nature of the evaluated anomaly detection pipeline, a CPU-based efficiency analysis was conducted. All methods were evaluated under the same hardware and software environment without GPU acceleration. The measured indicators included average feature extraction time per image, average model training time per category, average single-image inference latency, and peak memory usage. These measurements were used to assess whether the proposed enhanced unified feature representation and classical one-class anomaly detection models provide a practical low-resource alternative for industrial inspection scenarios. The detailed computational efficiency results are presented in Section 3.6.
3. Results
3.1. Raw Pixel Baseline and Enhanced Feature Representation Comparison
To directly evaluate the contribution of the proposed enhanced unified feature representation, an additional raw pixel baseline experiment was conducted. In this baseline, each image was represented only by the resized 64 × 64 grayscale intensity vector, without HOG, LBP, GLCM, or statistical descriptors. The same one-class anomaly detection protocol was applied to both the raw pixel baseline and the proposed enhanced representation. The comparison between the raw pixel baseline and the enhanced unified feature representation is presented in Table 3.
As shown in Table 3, the enhanced unified feature representation improved the mean ROC-AUC from 0.7541 to 0.8289, the mean AP from 0.8861 to 0.9254, and the mean F1@95%-training-quantile from 0.8064 to 0.8343 compared with the raw pixel-only baseline. These results indicate that the combined use of structural, local texture, second-order texture, and statistical intensity descriptors provides additional discriminative information beyond global pixel-level intensity patterns.
3.1.1. Category-Based ROC-AUC Analysis
Category-based ROC-AUC values were analyzed to evaluate how the anomaly detection performance of the evaluated methods changed across different industrial categories. Since the evaluated MVTec AD categories include different surface structures, texture distributions, and defect characteristics, category-level evaluation provides a more detailed understanding than reporting only average performance values. The category-based ROC-AUC heatmap of the top-performing classical one-class anomaly detection models under the enhanced unified feature representation is presented in Figure 3.
Figure 3 shows that PCA(recon) achieved the most consistent and generally strongest ROC-AUC performance across the fifteen MVTec AD categories. The highest discrimination performance was observed in the bottle, toothbrush, leather, transistor, and zipper categories. In contrast, carpet, screw, and grid produced relatively lower ROC-AUC values, indicating that texture-dominated or subtle defect patterns remain more challenging for classical anomaly detection models.
The heatmap also shows that kNN-density variants produced competitive performance in several categories, particularly bottle, cable, pill, tile, toothbrush, transistor, and zipper. IsolationForest(200) achieved strong performance in bottle, leather, transistor, and zipper but showed lower consistency in categories such as grid and screw. Overall, the category-wise results indicate that the proposed enhanced unified feature representation improves the applicability of classical one-class anomaly detection methods across diverse industrial inspection scenarios.
3.2. Mean Performance Comparison
Performance evaluation was conducted using ROC-AUC, Average Precision (AP), and F1 score metrics. ROC-AUC was used to evaluate the threshold-independent discrimination capability of the anomaly detection methods. Since anomaly detection problems inherently involve class imbalance, Average Precision (AP) was considered as a particularly important evaluation metric because it reflects the area under the precision-recall curve and provides more reliable performance interpretation under imbalanced conditions. The threshold-dependent F1 score was recalculated using the 95th percentile threshold determined from the normal training-score distribution, rather than using an optimal threshold selected from the test set. The category-independent mean performance comparison of the evaluated classical one-class anomaly detection methods is presented in Table 4. For visual clarity, Figure 4 presents only the mean ROC-AUC and AP comparison of the evaluated methods, whereas the threshold-dependent F1@95%-training-quantile results are reported in Table 4.
Table 4 presents the category-independent mean performance comparison across all fifteen MVTec AD categories under the revised evaluation protocol. PCA(recon) achieved the strongest threshold-independent performance with a mean ROC-AUC of 0.8289 and a mean AP of 0.9254. Under the training-score-based thresholding strategy, PCA(recon) also obtained the highest mean F1@95%-training-quantile value of 0.8343. In contrast, the other classical methods showed substantially lower F1@95%-training-quantile values, indicating that their anomaly score distributions were less suitable for direct deployment using a fixed threshold derived only from normal training samples. These results highlight the importance of separating threshold-independent ranking performance from threshold-dependent decision performance in one-class anomaly detection.
Figure 4.
Mean ROC-AUC and AP comparison of the evaluated classical one-class anomaly detection methods.
Figure 4.
Mean ROC-AUC and AP comparison of the evaluated classical one-class anomaly detection methods.
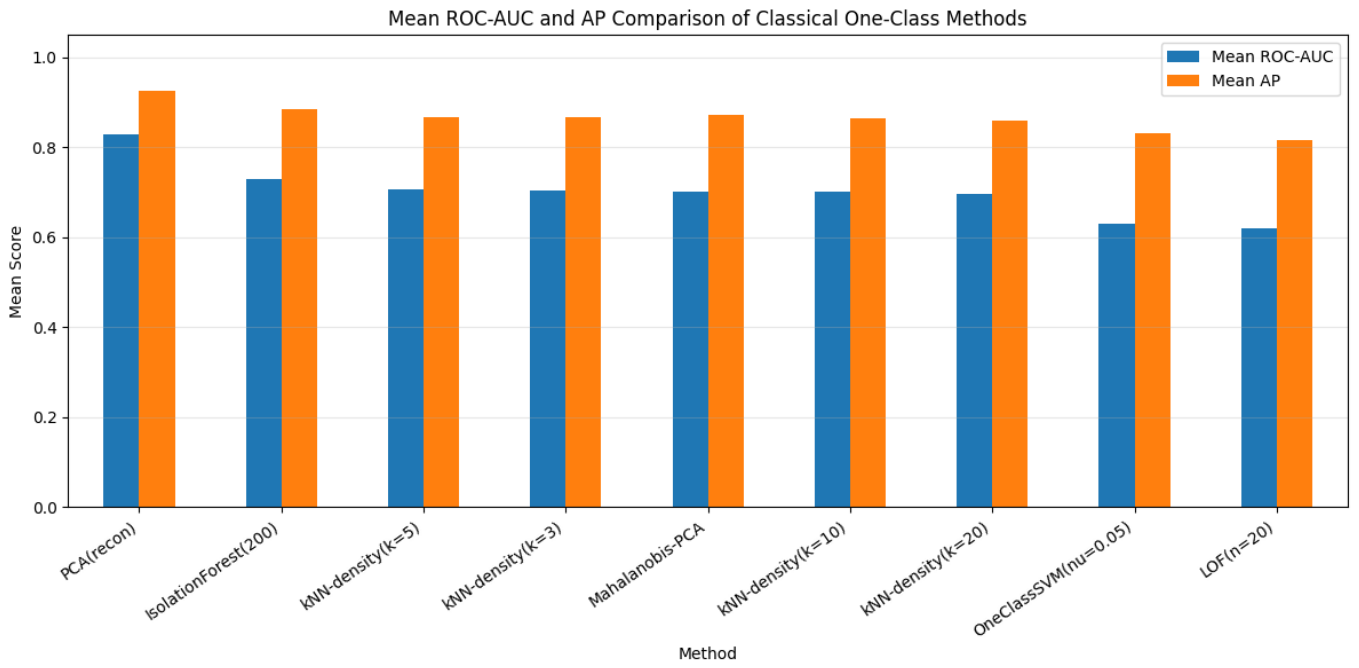
As shown in Figure 4, PCA(recon) achieved the highest mean ROC-AUC and mean AP values among the evaluated methods, while IsolationForest(200) and the kNN-density variants formed the second performance group.
3.3. Ablation Study of Feature Components
To analyze the contribution of each descriptor group within the proposed enhanced unified feature representation, an ablation study was conducted using the PCA(recon) model. In this analysis, different feature combinations were evaluated under the same one-class anomaly detection protocol. The ablation results are presented in Table 5.
As shown in Table 5, the ablation study indicates that HOG was the most influential individual descriptor group, achieving a mean ROC-AUC of 0.8082 and a mean AP of 0.9163 when used alone. The raw intensity representation also provided a relatively strong baseline, whereas LBP, GLCM, and statistical features alone produced lower average performance. When descriptor groups were combined, the performance increased progressively, and the full representation achieved the best overall threshold-independent performance with a mean ROC-AUC of 0.8289 and a mean AP of 0.9254. These findings indicate that the proposed enhanced unified representation benefits from the joint use of structural, local texture, second-order texture, and statistical intensity descriptors rather than relying on a single feature group.
3.4. Best Model Analysis
The category-based ROC-AUC performance of the best-performing PCA(recon) model is presented in Figure 5.
Figure 5 presents the category-wise ROC-AUC performance of the best-performing PCA(recon) model across all fifteen MVTec AD categories. PCA(recon) achieved very strong discrimination performance in bottle, toothbrush, leather, transistor, and zipper categories, with ROC-AUC values above 0.95 in several cases. The model also produced competitive performance in cable, capsule, metal_nut, pill, and hazelnut categories.
However, lower ROC-AUC values were observed in carpet, screw, grid, tile, and wood categories. This suggests that texture-dominated surfaces, small structural changes, and subtle defect patterns may still be challenging for reconstruction-based classical anomaly detection. Nevertheless, the overall category distribution suggests that PCA(recon), when supported by the proposed enhanced unified feature representation, provides a favorable balance between discrimination capability, computational simplicity, and interpretability among the evaluated classical one-class models.
3.5. Performance Stability and Method Reliability
Category-based analyses demonstrated that anomaly detection performance varied depending on the structural complexity and texture characteristics of the evaluated MVTec AD categories. Although some methods achieved strong discrimination performance in specific categories, their stability across all categories differed considerably. Among the evaluated approaches, PCA(recon) produced the most consistent overall performance in terms of ROC-AUC and AP across the fifteen categories. The bottle and zipper categories generally produced the highest anomaly discrimination performance for most methods, indicating that defects in these categories were more distinguishable through the proposed enhanced feature representation. In contrast, the metal_nut category remained relatively more challenging due to its more complex texture and structural characteristics. The kNN-density variants also exhibited stable and competitive behavior across different categories, suggesting that neighborhood-based anomaly scoring can effectively model local anomaly distributions within the feature space. Overall, the findings indicate that carefully designed feature representations can improve the reliability and stability of classical one-class anomaly detection methods; however, the relatively lower performance observed in carpet, screw, grid, tile, and wood shows that texture-dominated surfaces and very small or subtle defects remain challenging for handcrafted feature-based models.
In particular, reconstruction-based and density-based approaches provided more stable discrimination capability than the other evaluated classical approaches under the proposed enhanced unified feature representation framework.
3.6. Computational Efficiency Analysis
To provide quantitative evidence for the lightweight nature of the proposed pipeline, computational efficiency measurements were performed under the same CPU-based experimental environment. The measured indicators included feature extraction time, model training time, single-image inference latency, and peak memory usage. The computational efficiency results of the evaluated classical one-class anomaly detection methods are presented in Table 6.
As shown in Table 6, all evaluated models were executed without GPU acceleration. The average feature extraction time was 185.3022 ms per image, while the single-image inference latency remained below 1 ms for all evaluated anomaly detection models. Among the tested methods, One-Class SVM and Mahalanobis-PCA provided the lowest inference latencies, whereas IsolationForest(200) required the longest average training time. These results provide quantitative CPU-based evidence that the proposed pipeline can be considered computationally lightweight at the model-inference stage, although feature extraction remains the dominant computational cost.
4. Discussion
The findings of this study demonstrate that the performance of classical one-class anomaly detection methods is strongly influenced by both category characteristics and feature representation quality. Unlike conventional raw pixel-based approaches, the proposed enhanced unified feature representation integrates structural descriptors, local texture patterns, statistical texture relationships, and global intensity information within a single framework. This combination substantially improved the discrimination capability of several classical anomaly detection models across the evaluated MVTec AD categories. Category-based analyses showed that anomaly detection performance varied considerably depending on the structural complexity and defect characteristics of the evaluated categories. In particular, the bottle and zipper categories consistently produced higher ROC-AUC and AP values for most evaluated methods. This indicates that defects in these categories contain more distinguishable structural and textural patterns under the proposed feature representation. In contrast, the metal_nut category remained relatively more challenging, suggesting that certain industrial defect structures may require more localized or category-specific representations.
Among all evaluated methods, PCA(recon) achieved the strongest and most stable overall performance in terms of ROC-AUC and AP, while also obtaining the highest mean F1@95%-training-quantile under the revised thresholding protocol. This finding suggests that reconstruction-based anomaly scoring benefits considerably from the proposed enhanced feature representation. Since PCA reconstruction error measures deviations from the learned normal data distribution, the integration of complementary feature descriptors appears to improve the separability between normal and anomalous samples. The kNN-density variants also produced competitive and stable performance across categories, indicating that neighborhood-based density estimation can effectively model local anomaly distributions within the feature space. An important finding of this study is that carefully designed feature representations can substantially improve the effectiveness of classical anomaly detection methods without requiring GPU-dependent deep learning architectures. The proposed framework combines raw intensity features, HOG descriptors, LBP texture representations, GLCM-based second-order statistical texture features, and basic statistical intensity descriptors. Each component contributes complementary information regarding structural edges, local texture changes, spatial relationships, and global intensity distributions. This integrated representation enables classical models to produce more reliable anomaly scores under varying industrial inspection conditions.
From a practical industrial perspective, the proposed framework offers several advantages. Compared with GPU-dependent deep learning pipelines, the evaluated classical models offer advantages in terms of interpretability, simple implementation, and low model-inference cost. In addition, the evaluated models do not require GPU-dependent training procedures, making them attractive for lightweight industrial inspection systems and embedded quality-control applications. Nevertheless, this study has several limitations. First, the experiments were conducted on the fifteen categories of the MVTec AD dataset using image-level anomaly detection. Although these categories represent different industrial structures and defect patterns, future studies should validate the proposed framework on additional industrial anomaly detection datasets collected under different imaging and production conditions. Second, although the proposed enhanced unified feature representation substantially improved classical anomaly detection performance, the framework does not include deep feature extraction. Future studies may investigate hybrid approaches that combine lightweight classical anomaly detection models with deep representation learning techniques such as autoencoder-based or transformer-based industrial anomaly detection frameworks. Overall, the findings demonstrate that enhanced feature engineering remains highly important for industrial anomaly detection problems. The results indicate that carefully optimized classical one-class anomaly detection methods can still provide competitive, interpretable, and computationally efficient alternatives for industrial quality-control systems.
5. Conclusions
This study investigated the effectiveness of classical one-class anomaly detection methods under an enhanced unified feature representation framework for industrial image inspection. A comprehensive experimental analysis was conducted on all fifteen categories of the MVTec AD dataset. Unlike conventional pixel-based approaches, the proposed framework combined raw intensity information with HOG, LBP, GLCM, and statistical intensity descriptors in order to construct a richer and more discriminative feature space for anomaly detection. The experimental findings demonstrated that feature representation quality has a direct impact on anomaly detection performance. A systematic comparison of classical one-class and density-based methods was performed on the dataset. The kNN-density variants also produced competitive results and showed stable behavior across different industrial categories. The results further revealed that anomaly detection success changes considerably depending on category structure, texture complexity, and defect distribution characteristics. The proposed enhanced feature representation enabled classical methods to produce interpretable anomaly scores in a CPU-friendly setting; however, the results should be interpreted within the scope of the evaluated classical one-class models rather than as a complete replacement for modern deep learning-based anomaly detection approaches.
In particular, the integration of structural descriptors, local texture patterns, second-order statistical texture relationships, and global intensity characteristics improved the separability between normal and defective samples under varying industrial inspection conditions. These findings indicate that carefully designed lightweight feature engineering strategies can strengthen explainable classical anomaly detection pipelines, particularly in resource-constrained industrial inspection scenarios. The computational efficiency analysis further showed that all evaluated models operated without GPU acceleration and achieved sub-millisecond average inference latency, although the handcrafted feature extraction stage represented the main computational cost. Another important outcome of the study is that category-level analysis provides more informative insights than relying only on global average performance values. Although some categories produced consistently high discrimination performance, others remained relatively more challenging due to their structural characteristics. This observation highlights the importance of category-aware evaluation in industrial anomaly detection research. Despite these findings, some limitations should be noted. The lower performance observed in texture-dominated and subtle-defect categories indicates that handcrafted feature-based one-class models may not fully capture highly localized or complex anomaly patterns. Therefore, future work should include broader validation on additional industrial anomaly detection datasets and more extensive comparisons with modern lightweight deep learning-based anomaly detection models.
In conclusion, the findings suggest that classical one-class anomaly detection methods can serve as practical, interpretable, and resource-efficient baselines for industrial quality-control systems when supported by enhanced feature representations. The proposed framework offers advantages in terms of interpretability, deployment simplicity, and low model-inference cost, making it suitable as a lightweight baseline for resource-constrained industrial inspection environments. Future studies may extend the analysis to additional industrial anomaly detection datasets, such as VisA or MVTec AD 2, and investigate hybrid frameworks that combine enhanced classical feature representations with deep representation learning approaches.
Author Contributions
Conceptualization, Ç.E.; methodology, Ç.E.; software, Ç.E.; validation, Ç.E.; formal analysis, Ç.E.; investigation, Ç.E.; resources, Ç.E.; data curation, Ç.E.; writing—original draft preparation, Ç.E.; writing—review and editing, Ç.E.; visualization, Ç.E.; supervision, Ç.E.; project administration, Ç.E. The author has read and agreed to the published version of the manuscript.
Funding
This research received no external funding.
Data Availability Statement
The dataset analyzed in this study is publicly available. The MVTec AD dataset can be accessed at: https://www.mvtec.com/company/research/datasets/mvtec-ad. The data generated during the experimental analysis are available from the corresponding author upon reasonable request. The revised experimental protocol, including the feature extraction parameters, training-score-based thresholding procedure, raw pixel baseline, ablation analysis, and computational efficiency measurements, is described in sufficient detail in the manuscript to support reproducibility.
Conflicts of Interest
The author declares no conflicts of interest.
Abbreviations
The following abbreviations are used in this manuscript:
| AD | Anomaly Detection |
| AUC | Area Under the Curve |
| CNN | Convolutional Neural Network |
| DL | Deep Learning |
| GPU | Graphics Processing Unit |
| HOG | Histogram of Oriented Gradients |
| kNN | k-Nearest Neighbors |
| ML | Machine Learning |
| PCA | Principal Component Analysis |
| ROC | Receiver Operating Characteristic |
| RBF | Radial Basis Function |
| SVM | Support Vector Machine |
| LOF | Local Outlier Factor |
References
- Chandola, V., Banerjee, A., & Kumar, V. (2009). Anomaly detection: A survey. ACM Computing Surveys, 41(3), 1–58. [CrossRef]
- Abdullah, M. Y. (2024). Marble surface anomaly detection using autoencoder architecture (Master’s thesis, Sakarya University).
- Gökkaya, H. (2020). Detection and classification of defective metal nuts using deep learning techniques (Master’s thesis, Dokuz Eylül University).
- Pimentel, M. A. F., Clifton, D. A., Clifton, L., & Tarassenko, L. (2014). A review of novelty detection. Signal Processing, 99, 215–249. [CrossRef]
- Davis, J., & Goadrich, M. (2006). The relationship between Precision-Recall and ROC curves. In Proceedings of the 23rd International Conference on Machine Learning (pp. 233–240). [CrossRef]
- Tutar, H. (2024). Anomaly detection in video images using hybrid machine learning algorithms (Master’s thesis, Istanbul Aydın University).
- Tax, D. M. J., & Duin, R. P. W. (2004). Support vector data description. Machine Learning, 54(1), 45–66. [CrossRef]
- Schölkopf, B., Platt, J. C., Shawe-Taylor, J., Smola, A. J., & Williamson, R. C. (2001). Estimating the support of a high-dimensional distribution. Neural Computation, 13(7), 1443–1471. [CrossRef]
- Breunig, M. M., Kriegel, H. P., Ng, R. T., & Sander, J. (2000). LOF: Identifying density-based local outliers. In Proceedings of the ACM SIGMOD International Conference on Management of Data (pp. 93–104). [CrossRef]
- Liu, F. T., Ting, K. M., & Zhou, Z. H. (2008). Isolation forest. In Proceedings of the IEEE International Conference on Data Mining (pp. 413–422). [CrossRef]
- Ramaswamy, S., Rastogi, R., & Shim, K. (2000). Efficient algorithms for mining outliers from large data sets. In Proceedings of the ACM SIGMOD International Conference on Management of Data (pp. 427–438). [CrossRef]
- Pearson, K. (1901). On lines and planes of closest fit to systems of points in space. The London, Edinburgh, and Dublin Philosophical Magazine and Journal of Science, 2(11), 559–572. [CrossRef]
- Jackson, J. E. (1991). A user’s guide to principal components. Wiley.
- Jolliffe, I. T. (2002). Principal component analysis (2nd ed.). Springer. [CrossRef]
- Shyu, M. L., Chen, S. C., Sarinnapakorn, K., & Chang, L. (2003). A novel anomaly detection scheme based on principal component classifier. In Proceedings of the IEEE Foundations and New Directions of Data Mining Workshop (pp. 172–179).
- Sakurada, M., & Yairi, T. (2014). Anomaly detection using autoencoders with nonlinear dimensionality reduction. In Proceedings of the MLSDA Workshop (pp. 4–11). [CrossRef]
- Şeker, A., Diri, B., & Balık, H. H. (2017). Derin öğrenme yöntemleri ve uygulamaları hakkında bir inceleme. Gazi Mühendislik Bilimleri Dergisi, 3(3), 47–64.
- Şanlialp, İ., & Yıldız, M. (2025). Sistem çağrısı verilerinde derin öğrenme mimarileri kullanılarak anomali tespitinin değerlendirilmesi: Performans ve enerji verimliliği. Süleyman Demirel Üniversitesi Fen Bilimleri Enstitüsü Dergisi, 29(2), 388–396.
- Bergmann, P., Fauser, M., Sattlegger, D., & Steger, C. (2019). MVTec AD: A comprehensive real-world dataset for unsupervised anomaly detection. In Proceedings of the IEEE/CVF Conference on Computer Vision and Pattern Recognition (pp. 9592–9600). [CrossRef]
- Ruff, L., Vandermeulen, R., Görnitz, N., et al. (2018). Deep one-class classification. In Proceedings of the International Conference on Machine Learning (pp. 4393–4402).
- Heckler-Kram, L., Neudeck, J. H., Scheler, U., König, R., & Steger, C. (2025). The MVTec AD 2 dataset: Advanced scenarios for unsupervised anomaly detection. arXiv preprint arXiv:2503.21622. [CrossRef]
- Mao, Y., Chen, Z., Liu, Y., Dong, C., & Song, K. (2025). A survey on industrial image anomaly detection: Methods, benchmarks and rethinks. Measurement, 118377. [CrossRef]
- Li, Z. (2025). A survey of deep learning for industrial visual anomaly detection. Artificial Intelligence Review.
- Hendria, W. F., Kim, H., & Seo, D. (2025). Multi-model anomaly detection for industrial inspection with dynamic loss weighting and soft-hard features loss. Neural Computing and Applications, 37(21), 17031–17054. [CrossRef]
- Hoang, D. C., Tan, P. X., Nguyen, A. N., Pham, M. K., Duong, T. H. A., Huynh, T. M., et al. (2025). Unsupervised industrial anomaly detection using paired well-lit and low-light images. Journal of Computational Design and Engineering, 12(5), 41–61. [CrossRef]
- Mokhtar, S., Mousakhan, A., Galesso, S., Tayyub, J., & Brox, T. (2025). Detect, classify, act: Categorizing industrial anomalies with multi-modal large language models. In Proceedings of the IEEE/CVF Conference on Computer Vision and Pattern Recognition (pp. 4058–4067).
- Yue, P., Jiang, X., Lu, Y., Lin, J., Zhang, S., & Cao, L. (2025). Referring industrial anomaly segmentation. In Chinese Conference on Pattern Recognition and Computer Vision (pp. 61–75). Springer.
- Hicsonmez, S., Shabayek, A. E. R., & Aouada, D. (2026). Training free zero-shot visual anomaly localization via diffusion inversion. arXiv preprint arXiv:2601.08022.
- Obi, J. C. (2023). A comparative study of several classification metrics and their performances on data. World Journal of Advanced Engineering Technology and Sciences, 8(1), 308–314. [CrossRef]
- He, K., Lu, Y., & Sclaroff, S. (2018). Local descriptors optimized for average precision. In Proceedings of the IEEE/CVF Conference on Computer Vision and Pattern Recognition (pp. 596–605).
- Dalal, N., & Triggs, B. (2005). Histograms of oriented gradients for human detection. In Proceedings of the IEEE Computer Society Conference on Computer Vision and Pattern Recognition (pp. 886–893). [CrossRef]
- Ojala, T., Pietikäinen, M., & Harwood, D. (1996). A comparative study of texture measures with classification based on featured distributions. Pattern Recognition, 29(1), 51–59. [CrossRef]
- Haralick, R. M., Shanmugam, K., & Dinstein, I. (1973). Textural features for image classification. IEEE Transactions on Systems, Man, and Cybernetics, SMC-3(6), 610–621. [CrossRef]
Figure 1.
Representative normal and defective samples from all fifteen MVTec AD categories.
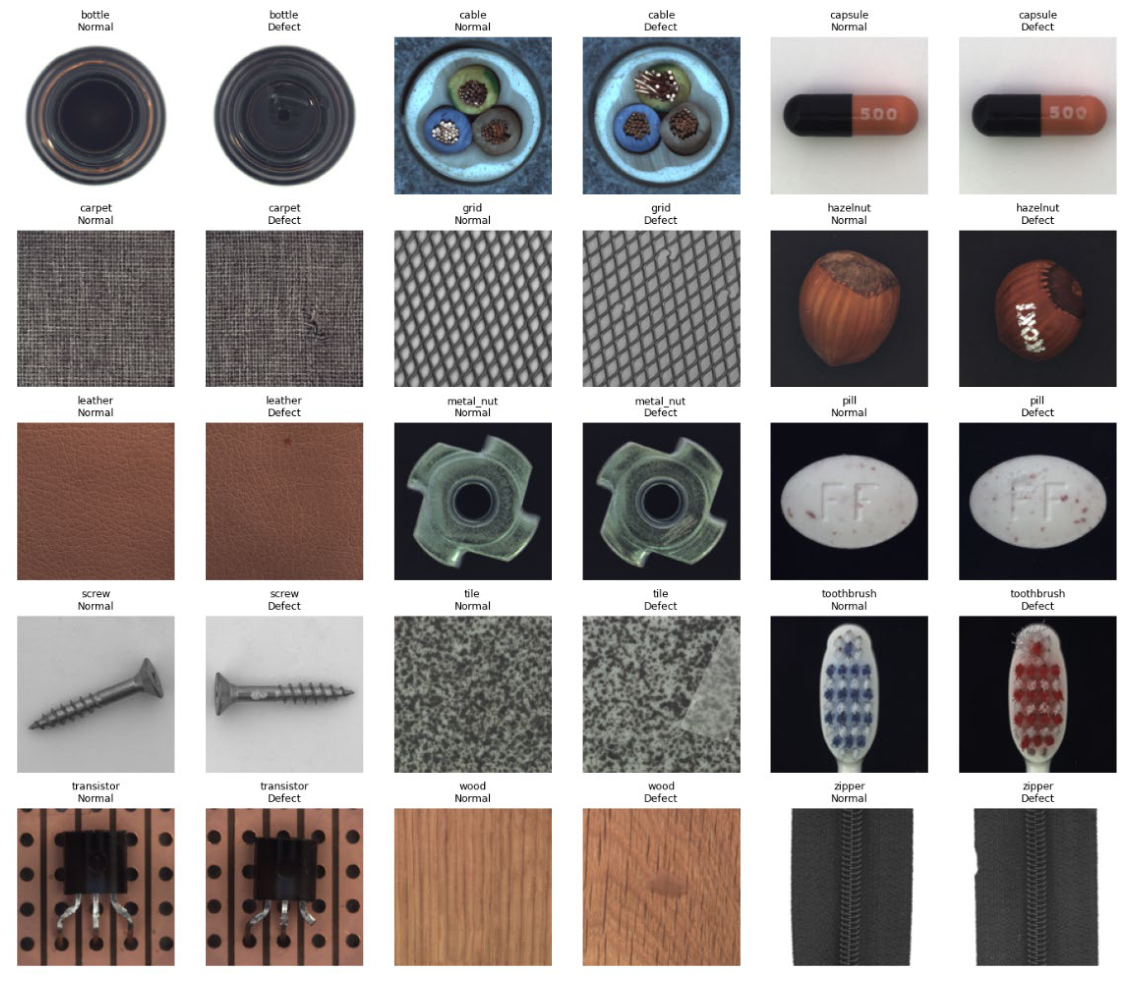
Figure 2.
Overall workflow of the enhanced unified feature representation and classical one-class anomaly detection pipeline.
Figure 2.
Overall workflow of the enhanced unified feature representation and classical one-class anomaly detection pipeline.
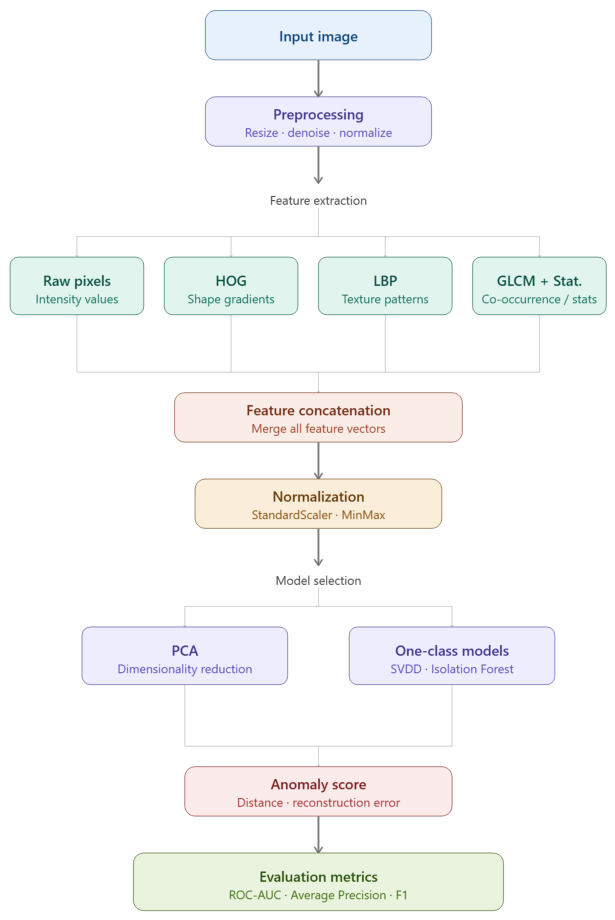
Figure 3.
Category-based ROC-AUC heatmap of the top-performing classical one-class models under the enhanced unified feature representation.
Figure 3.
Category-based ROC-AUC heatmap of the top-performing classical one-class models under the enhanced unified feature representation.
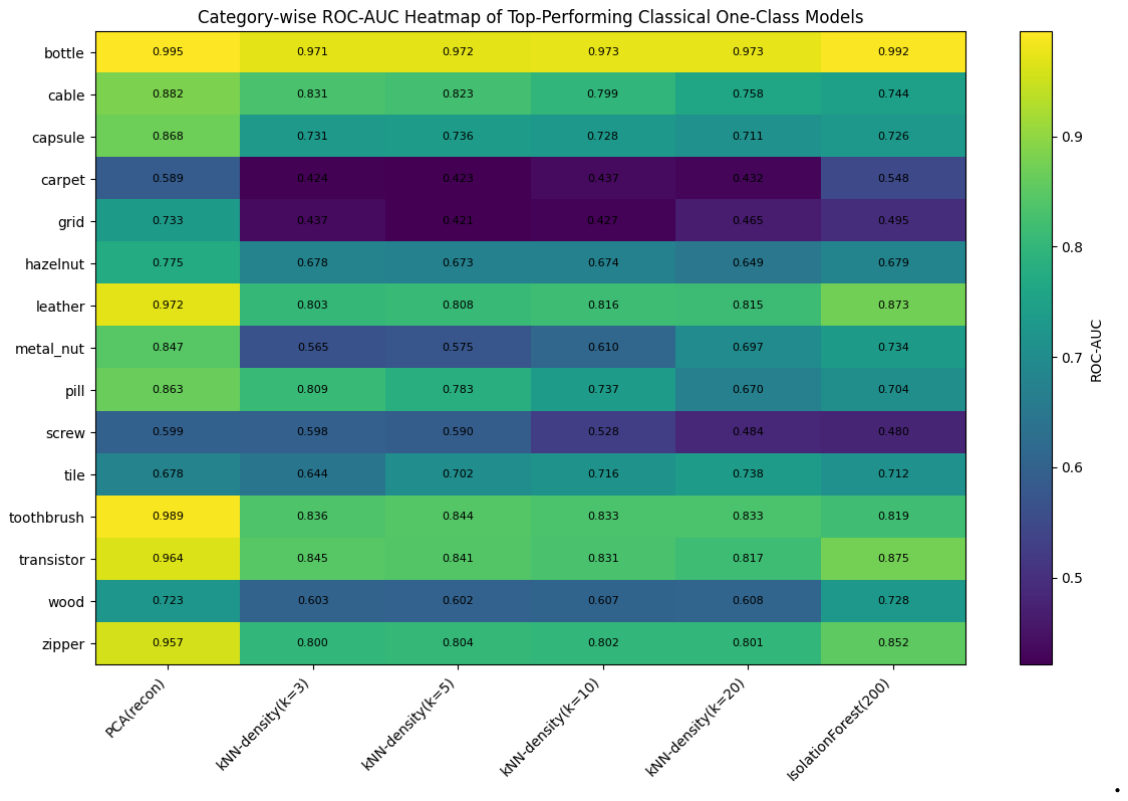
Figure 5.
Category-based ROC-AUC results of the best-performing PCA reconstruction model.
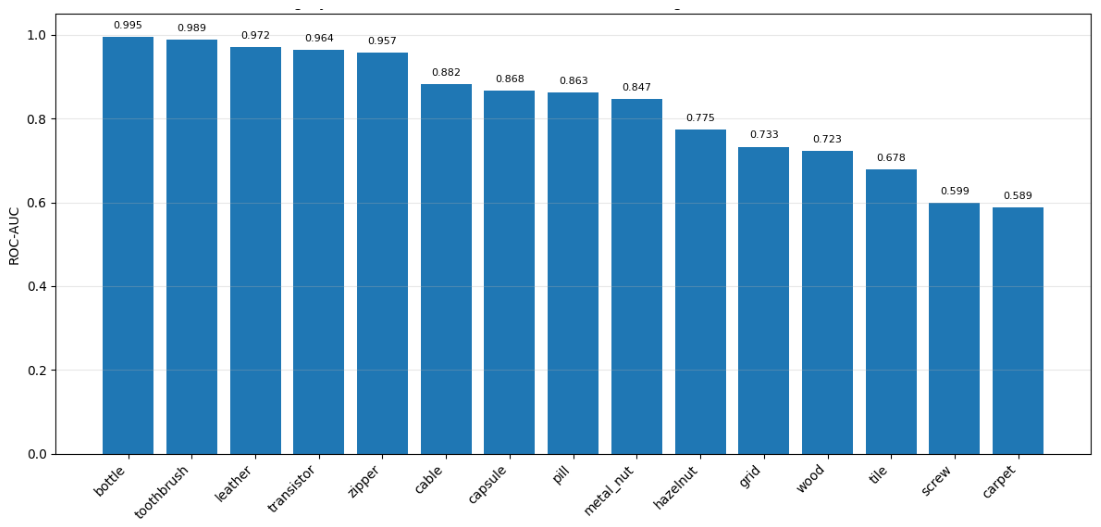

Table 1.
Distribution of training and test samples for all fifteen MVTec AD categories.
| Category | Train (Good) | Test (Good) | Test (Defect) | Test (Total) |
|---|---|---|---|---|
| bottle | 209 | 20 | 63 | 83 |
| cable | 224 | 58 | 92 | 150 |
| capsule | 219 | 23 | 109 | 132 |
| carpet | 280 | 28 | 89 | 117 |
| grid | 264 | 21 | 57 | 78 |
| hazelnut | 391 | 40 | 70 | 110 |
| leather | 245 | 32 | 92 | 124 |
| metal_nut | 220 | 22 | 93 | 115 |
| pill | 267 | 26 | 141 | 167 |
| screw | 320 | 41 | 119 | 160 |
| tile | 230 | 33 | 84 | 117 |
| toothbrush | 60 | 12 | 30 | 42 |
| transistor | 213 | 60 | 40 | 100 |
| wood | 247 | 19 | 60 | 79 |
| zipper | 240 | 32 | 119 | 151 |
Table 2.
Preprocessing and feature extraction parameters used in the enhanced unified feature representation.
Table 2.
Preprocessing and feature extraction parameters used in the enhanced unified feature representation.
| Component | Parameter | Value |
|---|---|---|
| Image resizing | Input image size | 256 × 256 |
| Raw intensity | Resized feature size | 64 × 64 |
| Histogram equalization | Method | Grayscale histogram equalization |
| Gaussian smoothing | Sigma | 0.6 |
| HOG | Number of orientations | 9 |
| HOG | Pixels per cell | 16 × 16 |
| HOG | Cells per block | 2 × 2 |
| HOG | Block normalization | L2-Hys |
| LBP | Radius | 2 |
| LBP | Number of points | 16 |
| LBP | Mode | Uniform |
| LBP | Histogram bins | 18 bins |
| GLCM | Gray levels | 256 |
| GLCM | Distances | 1, 2, 4 |
| GLCM | Angles | 0°, 45°, 90°, 135° |
| GLCM | Symmetric | True |
| GLCM | Normalized | True |
| GLCM | Texture features | contrast, dissimilarity, homogeneity, energy, correlation, ASM |
| Statistical features | Descriptors | mean, standard deviation, minimum, maximum, median, 25th percentile, 75th percentile |
| Standardization | Fitting data | Normal training samples only |
| PCA | Component selection | 95% variance retained |
Table 3.
Comparison between the raw pixel baseline and the enhanced unified feature representation.
| Feature representation | Method | Mean ROC-AUC | Mean AP | Mean F1@95%-training-quantile |
|---|---|---|---|---|
| Raw pixels only | PCA(recon) | 0.7541 | 0.8861 | 0.8064 |
| Enhanced unified representation | PCA(recon) | 0.8289 | 0.9254 | 0.8343 |
Table 4.
Mean ROC-AUC, AP, and F1@95%-training-quantile comparison of the evaluated classical one-class anomaly detection methods.
Table 4.
Mean ROC-AUC, AP, and F1@95%-training-quantile comparison of the evaluated classical one-class anomaly detection methods.
| Method | Mean ROC-AUC | Mean AP | Mean F1@95%-training-quantile |
|---|---|---|---|
| PCA(recon) | 0.8289 | 0.9254 | 0.8343 |
| IsolationForest(200) | 0.7307 | 0.8841 | 0.1077 |
| kNN-density(k=5) | 0.7067 | 0.8668 | 0.1079 |
| kNN-density(k=3) | 0.7049 | 0.8675 | 0.1079 |
| Mahalanobis-PCA | 0.7024 | 0.8729 | 0.1267 |
| kNN-density(k=10) | 0.7013 | 0.8642 | 0.1096 |
| kNN-density(k=20) | 0.6967 | 0.8607 | 0.1110 |
| OneClassSVM(nu=0.05) | 0.6297 | 0.8305 | 0.1542 |
| LOF(n=20) | 0.6204 | 0.8160 | 0.1150 |
Table 5.
Ablation study of feature components using the PCA(recon) model.
| Feature set | Mean ROC-AUC | Mean AP | Mean F1@95%-training-quantile |
|---|---|---|---|
| Raw only | 0.7541 | 0.8861 | 0.8064 |
| HOG only | 0.8082 | 0.9163 | 0.8343 |
| LBP only | 0.5616 | 0.7871 | 0.3737 |
| GLCM only | 0.6650 | 0.8502 | 0.4524 |
| Statistical only | 0.5649 | 0.7903 | 0.3143 |
| Raw + HOG | 0.8265 | 0.9237 | 0.8343 |
| Raw + HOG + LBP | 0.8264 | 0.9234 | 0.8343 |
| Raw + HOG + LBP + GLCM | 0.8286 | 0.9253 | 0.8343 |
| Full representation | 0.8289 | 0.9254 | 0.8343 |
Table 6.
Computational efficiency comparison of the evaluated anomaly detection methods.
| Method | Feature extraction time (ms/image) | Training time (s/category) | Inference latency (ms/image) | Peak memory usage (MB) | GPU used |
|---|---|---|---|---|---|
| PCA(recon) | 185.3022 | 0.5522 | 0.9556 | 46.5335 | No |
| kNN-density(k=5) | 185.3022 | 0.0022 | 0.4915 | 36.2111 | No |
| LOF(n=20) | 185.3022 | 0.0404 | 0.2690 | 36.2111 | No |
| OneClassSVM(nu=0.05) | 185.3022 | 0.0071 | 0.0387 | 36.2111 | No |
| IsolationForest(200) | 185.3022 | 2.9610 | 0.6486 | 36.2111 | No |
| Mahalanobis-PCA | 185.3022 | 0.1062 | 0.1858 | 36.2111 | No |
Disclaimer/Publisher’s Note: The statements, opinions and data contained in all publications are solely those of the individual author(s) and contributor(s) and not of MDPI and/or the editor(s). MDPI and/or the editor(s) disclaim responsibility for any injury to people or property resulting from any ideas, methods, instructions or products referred to in the content. |
© 2026 by the authors. Licensee MDPI, Basel, Switzerland. This article is an open access article distributed under the terms and conditions of the Creative Commons Attribution (CC BY) license (http://creativecommons.org/licenses/by/4.0/).
Copyright: This open access article is published under a Creative Commons CC BY 4.0 license, which permit the free download, distribution, and reuse, provided that the author and preprint are cited in any reuse.


