

Submitted:
06 July 2026
Posted:
08 July 2026
You are already at the latest version
Abstract
1) Background/Objectives: Sarcopenia is common in older surgical candidates and may affect perioperative risk and recovery after total hip arthroplasty (THA). Quantifying its burden and severity gradient in THA pathways can inform surgeon-led optimization. 2) Methods: A cross-sectional analysis of baseline preoperative data at a tertiary center (October 2019 to December 2022) was conducted. Consecutive adults with hip osteoarthritis undergoing primary THA were screened. Sarcopenia was staged per EWGSOP2: probable (low handgrip), confirmed (probable and low skeletal muscle index by whole-body DXA), and severe (confirmed and low gait speed). 3) Results: Of 312 screened patients, 203 completed baseline assessment (95 men, 108 women). According to the EWGSOP2 algorithm, 57 patients had low handgrip strength, 30 fulfilled criteria for confirmed sarcopenia, and 21 had severe sarcopenia. No significant association was observed for sex. Sarcopenia diagnosis was associated with older age, lower body mass index (BMI), higher comorbidity burden, lower functional independence, greater cognitive impairment, poorer mental health, and worse hip-related function (all p < 0.05). In multivariable analysis, older age (OR 1.104 per year; 95% CI 1.031-1.183), lower BMI (OR 0.877 per kg/m2; 95% CI 0.785-0.978), and lower functional independence (Barthel Index: OR 0.940 per point; 95% CI 0.895-0.988) were independently associated with confirmed sarcopenia. Increasing sarcopenia severity was associated with higher pain intensity, lower hemoglobin levels, poorer proximal femoral morphology, and worse hip-related quality of life (all p < 0.05). 4) Conclusions: In THA candidates, sarcopenia is prevalent and is related to older age, lower BMI and lower functional independence. Integrating EWGSOP2-based sarcopenia screening may identify patients with poorer baseline reserve who could benefit from targeted nutritional and functional optimization strategies before surgery.
Keywords:
sarcopenia
; EWGSOP2
; total hip arthroplasty
; DXA
; hip osteoarthritis
1. Introduction
Sarcopenia is an age-related, progressive skeletal muscle disorder characterized by the loss of skeletal muscle mass and function [1]. In 2010, the European Working Group on Sarcopenia in Older People (EWGSOP) established unified diagnostic criteria to facilitate the identification and treatment of sarcopenia worldwide [2]. EWGSOP2 updated this consensus in 2018, incorporating the latest scientific evidence accumulated over the previous decade. This revision emphasized low muscle strength as the primary parameter for the diagnosis of sarcopenia in clinical practice and defined sarcopenia as severe when physical performance is impaired [3]. Sarcopenia has been linked to an increase in falls, fractures, disability, and mortality, with potential effects on postoperative outcomes, which demonstrates its perioperative relevance [3,4,5].
Osteoarthritis (OA) is recognized as a contributor to secondary sarcopenia, as chronic pain, reduced mobility, and low-grade systemic inflammation associated with the disease promote physical inactivity and muscle catabolism [6]. Moreover, emerging evidence suggests that reductions in lean mass may increase the risk of developing hip OA through biomechanical instability and systemic health impairment [6,7]. In this context, sarcopenia and OA appear as closely interrelated conditions: OA-related pain and functional limitation promote muscle loss, while declining muscle mass and strength may further compromise joint stability and accelerate disease progression [8].
Sarcopenia—or the risk of developing it—is common among patients undergoing arthroplasty. Using SARC-F, a validated questionnaire for identifying patients at risk of sarcopenia, 72.3% of adults scheduled for total hip arthroplasty (THA) screened positive [9]. Beyond prevalence, sarcopenia has significant implications for outcomes after THA in patients with OA, including increased risk of dislocation and aseptic loosening, delayed functional recovery, poorer patient-reported outcomes (PROs), higher incidence of urinary tract infections, greater 90-day readmissions, elevated risk of falls and fragility fractures—particularly in older adults—and increased episode-of-care costs [5,10,11,12]. A systematic review across hip and knee arthroplasty studies corroborates the adverse impact of sarcopenia on function and independence [13].
Consequently, the quantitative assessment of sarcopenia and the analysis of its severity represent a significant clinical strategy for orthopedic surgeons. Based on this reasoning, the aim of this study is to quantify the prevalence and severity of sarcopenia in a consecutive cohort of patients undergoing THA and to assess the association with a range of clinical variables.
2. Materials and Methods
This study reports a cross-sectional analysis of baseline data from a single-center prospective observational cohort of consecutive adults aged 50-90 years with unilateral or bilateral hip OA undergoing THA between 2019 and 2022 at Hospital Universitari de Bellvitge (L’Hospitalet de Llobregat, Barcelona, Spain). Exclusion criteria were conditions associated with secondary OA (proximal femoral deformity, femoral head osteonecrosis, inflammatory disease), conditions associated with sarcopenia (severe chronic and inflammatory diseases), major psychiatric disorders, severe lower-limb articular pathology, and BMI >40 kg/m2. These criteria were applied to minimize clinical heterogeneity, thereby improving the internal validity for the evaluation of sarcopenia in the cohort.
The study protocol was approved by the local ethics committee (PR217/19, 21 November 2019). All included participants provided written informed consent.
Sarcopenia diagnostic variables
Sarcopenia was diagnosed according to the EWGSOP2 criteria [3]. Muscle strength was assessed by handgrip strength, measured using a hydraulic dynamometer (Saehan SH5001, Saehan Corporation, Yangsan, South Korea). Measurements were performed in the dominant hand with the handle set in the second position. Participants were seated with the elbow flexed at 90°, and three maximal contractions were recorded; the mean value was used for analysis. Probable sarcopenia was defined as handgrip strength <27 kg in men and <16 kg in women. Sarcopenia was confirmed by low muscle quantity assessed using whole-body composition dual-energy X-ray absorptiometry (DXA) (Horizon Wi, Hologic Inc., Bedford, MA, USA). Scans were performed with the participants supine, centered on the scanning table, with the arms alongside the body and hands facing the thighs without contact. Appendicular lean mass was used to compute the skeletal muscle index (SMI = appendicular lean mass/height2), and sarcopenia was confirmed when SMI < 7.0 kg/m2 in men or < 5.5 kg/m2 in women. To assess sarcopenia severity, gait speed was measured using the 6-m gait speed test. Participants were instructed to walk at their usual pace over a 6-m course, and time was recorded using a stopwatch to calculate gait speed (m/s). Severe sarcopenia was defined as gait speed ≤ 0.8 m/s.
Participant selection and EWGSOP2-based classification are summarized in Figure 1.
Demographic and Anthropometric Characteristics
This domain included age, sex, and body mass index (BMI). Age was categorized into four groups (50-59, 60-69, 70-79, and ≥ 80 years). Sex was classified into male or female. BMI (kg/m2) was classified as underweight (< 18.5), normal weight (18.5-24.9), overweight (25-29.9), class I obesity (30-34.9), class II obesity (35-39.9), and class III obesity (≥ 40).
Baseline Clinical Status and Health-Related Measures
Baseline clinical status and health-related measures were assessed using a combination of clinical, laboratory, functional, cognitive, and PROs variables. Pain was measured using the Visual Analog Scale (VAS).
Laboratory parameters included serum hemoglobin and serum albumin concentrations.
Perioperative risk was assessed using the American Society of Anesthesiologists (ASA) Physical Status Classification [14]. Preoperative physical status was classified from I to IV: I, healthy patient; II, patient with mild systemic disease; III, patient with severe systemic disease; IV, patient with severe systemic disease that is a constant threat to life. The score was assigned by the attending anesthesiologist during the preoperative assessment.
Comorbidity burden was evaluated using the Charlson Comorbidity Index, which assigns weighted points to predefined comorbid conditions to generate a summary score, with higher values indicating greater comorbidity burden [15].
Functional independence was quantified with the Barthel Index [16] (range 0-100, with higher scores indicating greater independence in activities of daily living).
Cognitive function was evaluated using the Global Deterioration Scale (GDS) described by Barry Reisberg (stages 1-7), with lower scores reflecting better cognitive status: 1 indicates no cognitive decline, 2-3 mild cognitive impairment, 4 moderate cognitive decline, 5 moderately severe decline, 6 severe decline, and 7 very severe cognitive decline [17].
Health-related quality of life was measured with the 12-Item Short Form Health Survey (SF-12, version 1), including the Physical Component Summary (PCS) and Mental Component Summary (MCS) scores, where higher values indicate better perceived physical and mental health [18].
Radiographic Characteristics of the Proximal Femur
Radiological evaluation included the assessment of radiographic OA using the Tönnis grading scale [19] (grades 0-3, where 0 indicates no OA and 3 severe OA), as well as the characterization of proximal femur morphology using the Dorr classification (types A-C) [20], the Canal-to-Calcar Ratio (CCR) [21], and the Cortical Thickness Index (CTI) [22]. In the Dorr classification, type A indicates a narrow canal with thick cortices, type B an intermediate morphology, and type C a wide canal with thin cortices. The CCR was calculated as the ratio of the femoral canal width measured 100 mm distal to the lesser trochanter to the calcar canal width. Higher values indicate a wider canal and thinner cortices. The CTI was calculated as the ratio of the combined medial and lateral cortical thickness to the total femoral width at 100 mm distal to the lesser trochanter. This index reflects the relative cortical thickness of the femoral diaphysis on anteroposterior radiographs, with lower values indicating thinner cortices.
Functional Outcomes
Functional outcomes were assessed using validated functional and PROs, including the modified Harris Hip Score (mHHS) [23], which assesses pain and hip function with higher scores indicating better function; the Western Ontario and McMaster Universities Osteoarthritis Index (WOMAC) [24], which evaluates pain, stiffness, and physical function, with higher scores indicating worse symptoms and functional limitation; and the HOOS-12 (12-item Hip disability and Osteoarthritis Outcome Score) [25], a short-form PRO measure assessing hip-related pain, function, and quality of life, with higher scores reflecting better hip-related outcomes.
Statistical Analysis
The study was designed in 2019, and the sample size was estimated a priori for a cross-sectional prevalence study based on the expected prevalence of sarcopenia and a predefined absolute precision. Based on previously reported prevalence rates ranging from 10.5% to 28.9% in patients undergoing THA [26], with a 95% confidence level, and an absolute precision of approximately 6.5%, the required sample size was estimated to be 187 patients using the upper prevalence estimate. Allowing for potential missing data or incomplete assessments, a target sample size of approximately 200 patients was considered adequate and feasible for estimating sarcopenia prevalence in this clinical cohort. Quantitative variables were summarized as mean ± SD or median [IQR], as appropriate, and categorical variables as counts and percentages (n, %). Normality was assessed using the Shapiro-Wilk test.
Variables that form part of the EWGSOP2 case definition (handgrip strength, gait speed, and SMI) were not inferentially compared across sarcopenia categories to avoid incorporation bias. However, sex-stratified descriptive comparisons were reported to characterize baseline differences in EWGSOP2 definitional measures.
Baseline characteristics were compared between patients with and without confirmed sarcopenia. Categorical variables were compared using the χ2 test or Fisher’s exact test when appropriate, and continuous variables using the Student’s t-test/ANOVA or Mann-Whitney U test where appropriate. Variables showing between-group differences in univariable analyses (p < 0.05) and clinically relevant covariates (age and sex) were considered for multivariable logistic regression using a forward conditional selection procedure to examine variables independently associated with confirmed sarcopenia; results were expressed as odds ratios (OR) with 95% confidence intervals (CI).
EWGSOP2 sarcopenia severity was treated as an ordered factor with four mutually exclusive categories (0 = No, 1 = Probable, 2 = Confirmed, 3 = Severe). To assess monotonic trends across them, we used the Jonckheere-Terpstra test for continuous/ordinal outcomes and the linear-by-linear association test (Cochran-Armitage trend in SPSS) for categorical variables. When expected cell counts were < 5, exact tests (Fisher’s exact or exact linear-by-linear association) were reported. For each trend test, we also reported the effect size as r = Z/√N, indicating direction (increase/neutral/decrease) across severity. All tests were two-sided with α = 0.05 and were performed on available cases (no imputation).
All statistical analyses were conducted using IBM SPSS Statistics v25 (IBM Corp., Armonk, NY, USA).
3. Results
A total of 203 patients were included in the final analytic cohort (Figure 1): 95 men (46.8%) and 108 women (53.2%). Mean age was 69.3 ± 8.5 years, with men being younger than women (67.8 ± 8.4 vs. 70.7 ± 8.4 years; p = 0.015). EWGSOP2 definitional measures differed by sex: handgrip strength was higher in men than in women (36.0 [28.8-40.25] kg vs. 18.95 [15.7-22.45] kg; p < 0.001), SMI was higher in men than in women (7.06 ± 0.76 vs. 5.73 ± 0.84 kg/m2; p < 0.001), and 6-m walking speed was higher in men than in women (0.93 ± 0.28 vs. 0.78 ± 0.24 m/s; p < 0.001).
According to the EWGSOP2 diagnostic algorithm, 57 patients (28.1%) presented low handgrip strength. Of these, 30 patients (14.8% of the total cohort) also had low SMI and were therefore classified as having confirmed sarcopenia; among them, 21 patients (10.3% of the total cohort) additionally showed low physical performance and fulfilled criteria for severe sarcopenia.
Sex-stratified analyses were not performed, as neither confirmed nor severe sarcopenia differed by sex.
Patients with confirmed sarcopenia were significantly older (p < 0.001), had lower BMI (p < 0.05), higher comorbidity burden as measured by the Charlson Comorbidity Index (p < 0.05), lower functional independence (Barthel Index, p < 0.001), greater cognitive impairment (GDS, p < 0.001), poorer mental health status (SF-12 MCS, (p < 0.01) and worse hip-related function (mHHS, p < 0.05, WOMAC symptoms < 0.05). No significant differences were found for the remaining variables (Table 1).
Across EWGSOP2 severity categories (Table 2), greater severity was associated with older age (p < 0.001), higher pain intensity (VAS, p = 0.001), small but significant reductions in hemoglobin levels (p < 0.05), greater comorbidity burden (Charlson Comorbidity Index, p < 0.001), lower functional independence (Barthel Index, p < 0.001), worse cognitive status (GDS, p < 0.001), and poorer mental health (SF-12 MCS, p < 0.001). A significant association was also observed between sarcopenia severity and proximal femoral morphology (Dorr Classification (p < 0.05) and CCR (p < 0.05). Regarding PROs, greater EWGSOP2 severity was associated with worse functional outcomes, including lower hip function (mHHS, p < 0.001) and reduced HOOS-12 Quality of Life (p < 0.05), higher WOMAC total scores (p < 0.05), and higher WOMAC Symptoms scores (p < 0.05). No other variables were significantly associated with severity.
Multivariable analyses were performed to examine variables independently associated with sarcopenia diagnosis. Variables showing significant between-group differences in univariable analyses, together with age and sex as clinically relevant covariates, were considered for model selection. In the final model, confirmed sarcopenia was independently associated with older age (OR 1.104 per year; 95% CI 1.031-1.183; p = 0.005), lower BMI (OR 0.877 per kg/m2; 95% CI 0.785-0.978; p = 0.019), and lower functional independence, as reflected by the Barthel Index (OR 0.940 per point; 95% CI 0.895-0.988; p = 0.014). Model fit was moderate (Nagelkerke R2 = 0.257).
4. Discussion
In this consecutive THA cohort, EWGSOP2-defined sarcopenia was common, affecting nearly 15% of the patients, and, more importantly, was associated with multidimensional impairments, including reduced physical and cognitive reserve. Taken together, this profile suggests lower physiological reserve in patients with sarcopenia, which may be clinically relevant in the perioperative setting and may limit patients’ capacity to cope with stressors and recovery demands. These findings emphasize the importance of preoperative identification, targeted optimization of nutrition and physical function, and individualized rehabilitation strategies to support recovery and maintain independence.
An additional finding of this study is the presence of a clear clinical gradient across sarcopenia categories defined by the EWGSOP2 criteria. Increasing severity was associated with worsening overall health status, characterized by greater pain, lower hemoglobin levels, higher anesthetic risk, greater comorbidity burden, poorer cognitive status, lower health-related quality of life and worse hip-related PROs, suggesting that sarcopenia reflects a continuum of declining physiological reserve rather than a binary condition. This pattern further supports the clinical relevance of staging sarcopenia severity, as more advanced stages may identify patients with less favorable baseline profile before THA. Whether this translates into greater vulnerability or poorer postoperative recovery cannot be determined from the present cross-sectional analysis and should be assessed in longitudinal studies specifically evaluating postoperative outcomes. Previous studies have shown that sarcopenia is associated with poorer functional outcomes, increased complication rates, and greater healthcare costs in patients undergoing total hip arthroplasty [10,12,13,27,28,29]. These findings support the role of sarcopenia as a relevant perioperative risk phenotype and emphasize the need for systematic screening and diagnosis in candidates for THA using standardized diagnostic criteria to improve consistency and comparability across studies [29,30]. In this context, several approaches to case identification and diagnosis have been proposed.
In the present study, sarcopenia was assessed directly using objective measurements of muscle strength and muscle mass. This approach focuses on the diagnostic components of the EWGSOP2 framework rather than on initial screening. Importantly, SARC-F, recommended by the EWGSOP2 consensus as a case-finding tool for sarcopenia, has consistently shown high specificity but limited sensitivity for detecting sarcopenia, with reported sensitivities ranging from approximately 13-35% and specificities around 85-90%, depending on the population and diagnostic criteria used [31,32,33]. Consequently, reliance on questionnaire-based prescreening may lead to underdetection of sarcopenia, whereas direct assessment of muscle strength and mass may allow a more comprehensive identification of cases in clinical research settings.
BMI is commonly recorded in clinical practice as a general indicator of body size and nutritional status, but it does not distinguish between fat mass, muscle mass, and, obviously, muscle function. Consequently, BMI may fail to detect individuals with substantial muscle loss or weakness despite normal or elevated body weight, and it has been shown not to be a reliable screening measure for sarcopenia in older adults [34]. In contrast, handgrip strength directly measures muscle function and has emerged as a key diagnostic component of sarcopenia with strong associations with adverse outcomes independent of BMI or lean mass alone [35]. Indeed, low grip strength has been validated as a pragmatic marker of overall muscle health, predicting mobility impairment, disability, and mortality more consistently than BMI-based definitions [36]. Although lower BMI was independently associated with sarcopenia in our cohort, BMI alone is insufficient for case identification. The central role of muscle strength within the EWGSOP2 framework supports the inclusion of direct strength assessment (e.g., grip strength) in routine sarcopenia screening.
Interestingly, Dorr classification and CCR differed significantly across EWGSOP2 severity categories. Patients with more advanced sarcopenia showed a lower prevalence of Dorr A morphology and a greater representation of Dorr C morphology, suggesting an association between impaired muscle status and less favorable proximal femoral morphology. To our knowledge, this relationship has not been previously investigated in patients undergoing THA. This finding is biologically plausible within the framework of the muscle-bone unit, in which deterioration of muscle and bone health frequently coexist [37,38]. The concordant findings for Dorr classification and CCR suggest that increasing sarcopenia severity may be accompanied by structural changes in proximal femoral morphology.
The association between lower Barthel Index scores and confirmed sarcopenia observed in our cohort suggests that reduced independence in activities of daily living is closely linked to impaired muscle health in arthroplasty candidates. In the multivariable model, each 10-point decrease in Barthel Index was associated with an approximately 1.86-fold higher odds of sarcopenia diagnosis. This finding is consistent with previous evidence reporting lower Barthel Index scores in patients with sarcopenia compared with non-sarcopenic patients undergoing hip or knee replacement [13]. Similarly, poorer Barthel Index scores in sarcopenic THA patients than in non-sarcopenic THA patients before injury, at 3 months, and at 1 year after surgery was found [39]. Taken together, these findings support that sarcopenia is not only a disorder of muscle quantity and strength, but also a clinically relevant phenotype associated with reduced functional reserve before surgery and potentially slower functional recovery thereafter [13,39].
In patients undergoing THA, a minimal EWGSOP2 screening appears feasible and informative: handgrip strength may serve as an initial screening step, followed by DXA-derived SMI assessment when muscle strength is reduced (approximately one quarter of the cohort), and physical performance testing when feasible. This approach allows a more structured characterization of preoperative reserve, rather than providing direct prognostic evidence for postoperative outcomes [40]. However, hip OA may substantially impair gait mechanics (and therefore confound gait-speed-based severity grading). The alternative performance measures recommended by EWGSOP2—most commonly the Short Physical Performance Battery (SPPB), the Timed Up and Go (TUG), or the 400-m walk test [2]—may also be influenced by OA-related pain and load intolerance and should therefore be interpreted as markers of overall functional limitation rather than muscle-specific impairment alone.
Other recommended methods for sarcopenia screening and diagnosis include calf circumference (CC) measurement [41] and body mass index-adjusted calf circumference (BMI-adjusted CC) [42]. CC is a simple and easily applicable method; however, the measurement protocol remains a matter of debate, as differences have been reported between lower limbs and depending on whether CC is assessed in the seated or standing position [43] and cutoff values differ across guidelines [44]. As with other surrogate measures of muscle mass, CC-based methods may be influenced by muscle disuse secondary to prolonged periods of immobility, which are common in advanced age and in patients with lower-limb OA [45].
Computed tomography (CT) and magnetic resonance imaging (MRI) are considered the most accurate imaging modalities for assessing muscle quantity, quality, and fat infiltration; however, their cost, limited availability, and radiation exposure (for CT) preclude their routine use in clinical practice [2]. In THA populations, CT-derived muscle measurements have shown perioperative relevance: lower psoas/paravertebral muscle area and density have been associated with postoperative complications, while CT-based skeletal muscle assessment at T12 has identified sarcopenic patients with lower BMI, poorer functional capacity, and higher complication burden [11,28]. In recent years, ultrasound has emerged as a promising diagnostic tool for sarcopenia due to its accessibility, versatility, and lack of ionizing radiation [46], with rectus femoris cross-sectional area (RF-CSA) standing out as a reliable method with moderate diagnostic accuracy. At the same time, as with other imaging-based techniques, appropriate training and experience are required to ensure accurate acquisition and interpretation of findings [47]. These techniques may also provide information beyond the muscle quantity (SMI) captured by DXA, particularly regarding muscle quality and fat infiltration. Nevertheless, they do not fully capture muscle quality or functional capacity, which are more accurately reflected by objective strength and physical performance measures.
Another emerging diagnostic approach is the creatinine-to-cystatin C ratio (Cr/CysC), which has been proposed as an indirect biomarker of muscle mass. This ratio has shown correlations with skeletal muscle index (SMI) and muscle strength, suggesting a potential complementary role as a screening tool for sarcopenia. However, its diagnostic performance may be affected by confounding factors such as renal function and inflammatory status, and therefore it should be regarded as a complementary marker rather than a standalone diagnostic method [48,49]. Evidence on the Cr/CysC ratio in THA candidates remains lacking.
Clinically meaningful functional gains with preoperative resistance training have been documented in joint replacement [50], and multimodal prehabilitation—progressive strengthening (including targeted hip-abductor exercises when weakness is evident) combined with nutritional optimization—appears promising for improving preoperative status and supporting recovery [36,40,51]. Sarcopenia represents a modifiable risk factor in this population, and its identification allows targeted interventions to maximize functional recovery. Expert guidance underscores progressive resistance exercise with adequate protein intake as first-line management [52], and integration into preassessment or optimization clinics is feasible and safe [53]. These findings support a risk-stratified approach in which sarcopenia detection may guide individualized prehabilitation and optimization before surgery. Overall, this study provides clinically relevant evidence on muscle health and body composition assessment in THA candidates and may support the integration of sarcopenia screening into preoperative nutritional and functional optimization pathways.
This study has certain limitations that should be acknowledged. First, the single-center design and the relatively small number of patients with confirmed sarcopenia may limit generalizability and reduce the precision of some estimates. In addition, the exclusion criteria may have selected a relatively healthier population, potentially underestimating sarcopenia prevalence and limiting generalizability to frailer or more comorbid patients. However, many of the excluded patients, particularly those with severe comorbidities or marked functional impairment, may already represent a subgroup with clinically evident muscle decline or sarcopenia. As the cohort was not specifically sized for sarcopenia-related analyses, some subgroup comparisons and multivariable results should be interpreted cautiously, given the limited number of confirmed sarcopenia cases. Finally, walking speed, used to define severe sarcopenia, may have been influenced by hip OA-related functional limitation.
Despite these limitations, the study has notable strengths, including its prospective design with consecutive patient enrollment and the use of standardized EWGSOP2 diagnostic criteria, with muscle mass objectively confirmed by DXA, which enhances methodological robustness and comparability with recent literature. Moreover, the multidimensional assessment of clinical and functional status allowed a comprehensive characterization of the sarcopenic phenotype in patients undergoing THA.
5. Conclusions
In patients undergoing THA, sarcopenia affects a relevant proportion of individuals, and greater EWGSOP2 severity is associated with a poorer baseline clinical and functional profile. Older age, lower BMI and lower functional independence are associated with sarcopenia. These findings support the value of preoperative sarcopenia screening to identify patients with poorer baseline reserve who may benefit from targeted nutritional and functional optimization strategies before surgery.
Author Contributions
M.D.C.-R.: Conceptualization, Methodology, Formal analysis, Visualization, Investigation, Writing Original Draft, Writing—Review & Editing, Project administration. B.P.V: Investigation, Formal analysis, Writing—Original Draft. D.R.-P.: Resources, Writing—Review & Editing. J.L.A.-F.: Resources, Supervision, Writing—Review & Editing. C.G.-V.: Resources, Supervision, Formal analysis, Writing—Original Draft, Writing—Review & Editing, Data curation.
Funding
No financial support was received for the conduct, authorship, or publication of this study.
Institutional Review Board Statement
The study was approved by the Ethics Committee of Hospital Universitari de Bellvitge (21 November 2019, code: PR217/19) and conducted in accordance with the Declaration of Helsinki.
Informed Consent Statement
All participants provided written informed consent.
Data Availability Statement
The datasets generated and analyzed during the current study are available from the corresponding author [MDR] upon reasonable request.
Acknowledgments
Not applicable.
Conflicts of Interest
The authors declare no conflicts of interest.
Abbreviations and Units Compliance
| ASA | American Society of Anesthesiologists |
| BMI | Body Mass Index |
| CC | Calf Circumference |
| CCR | Canal-to-Calcar Ratio |
| CT | Computed Tomography |
| CTI | Cortical Thickness Index |
| Cr/CysC | Creatinine-to-cystatin C ratio |
| DXA | Dual-energy X-ray Absorptiometry |
| EWGSOP | European Working Group on Sarcopenia in Older People |
| GDS | Reisberg Global Deterioration Scale |
| HOOS-12 | 12-item Hip disability and Osteoarthritis Outcome Score |
| MCS | Mental Component Summary |
| mHHS | Modified Harris Hip Score |
| MRI | Magnetic Resonance Imaging |
| OA | Osteoarthritis |
| PCS | Physical Component Summary |
| PROs | Patient-Reported Outcomes |
| QoL | Quality of Life |
| SF-12 | 12-Item Short Form Survey |
| SMI | Skeletal Muscle Index |
| SPPB | Short Physical Performance Battery |
| RF-CSA | Rectus femoris cross-sectional area |
| THA | Total Hip Arthroplasty |
| TUG | Timed Up and Go |
| VAS | Visual Analog Scale |
| WOMAC | Western Ontario and McMaster Universities Osteoarthritis Index |
References
- Rosenberg, I.H. Sarcopenia: Origins and clinical relevance. J. Nutr. 1997, 127, 990S–991S. [Google Scholar] [CrossRef] [PubMed]
- Cruz-Jentoft, A.J.; Baeyens, J.P.; Bauer, J.M.; Boirie, Y.; Cederholm, T.; Landi, F.; Martin, F.C.; Michel, J.P.; Rolland, Y.; Schneider, S.M.; Topinková, E.; Vandewoude, M.; Zamboni, M. Sarcopenia: European consensus on definition and diagnosis: Report of the European Working Group on Sarcopenia in Older People. Age Ageing 2010, 39, 412–423. [Google Scholar] [CrossRef] [PubMed]
- Cruz-Jentoft, A.J.; Bahat, G.; Bauer, J.; Boirie, Y.; Bruyère, O.; Cederholm, T.; Cooper, C.; Landi, F.; Rolland, Y.; Sayer, A.A.; Schneider, S.M.; Sieber, C.C.; Topinkova, E.; Vandewoude, M.; Visser, M.; Zamboni, M.; Writing Group for the European Working Group on Sarcopenia in Older People 2 (EWGSOP2), and the Extended Group for EWGSOP2. Sarcopenia: Revised European consensus on definition and diagnosis. Age Ageing 2019, 48, 16–31, Erratum in Age Ageing 2019, 48, 601. [Google Scholar] [CrossRef] [PubMed]
- Cruz-Jentoft, A.J.; Sayer, A.A. Sarcopenia. Lancet 2019, 393, 2636–2646. [Google Scholar] [CrossRef] [PubMed]
- Yeung, S.S.Y.; Reijnierse, E.M.; Pham, V.K.; Trappenburg, M.C.; Lim, W.K.; Meskers, C.G.M.; Maier, A.B. Sarcopenia and its association with falls and fractures in older adults: A systematic review and meta-analysis. J. Cachexia Sarcopenia Muscle 2019, 10, 485–500. [Google Scholar] [CrossRef] [PubMed]
- Shorter, E.; Sannicandro, A.J.; Poulet, B.; Goljanek-Whysall, K. Skeletal muscle wasting and its relationship with osteoarthritis: A mini-review of mechanisms and current interventions. Curr. Rheumatol. Rep. 2019, 21, 40. [Google Scholar] [CrossRef] [PubMed]
- Jin, Z.; Wang, R.; Jin, L.; Wan, L.; Li, Y. Causal relationship between sarcopenia with osteoarthritis and the mediating role of obesity: A univariate, multivariate, two-step Mendelian randomization study. BMC Geriatr. 2024, 24, 469. [Google Scholar] [CrossRef] [PubMed]
- Pickering, M.E.; Chapurlat, R. Where two common conditions of aging meet: Osteoarthritis and sarcopenia. Calcif. Tissue Int. 2020, 107, 203–211. [Google Scholar] [CrossRef] [PubMed]
- Lovett, M.; Negm, A.; Ioannidis, G.; Petrucelli, D.; Winemaker, M.; Adachi, J.D.; Papaioannou, A. Identifying patients with osteoarthritis at risk of sarcopenia using the SARC-F. Can. Geriatr. J. 2021, 24, 1–7. [Google Scholar] [CrossRef] [PubMed]
- Chang, K.; Albright, J.A.; Testa, E.J.; Balboni, A.B.; Daniels, A.H.; Cohen, E. Sarcopenia is associated with an increased risk of postoperative complications following total hip arthroplasty for osteoarthritis. Biology 2023, 12, 295. [Google Scholar] [CrossRef] [PubMed]
- Ay, M.; Cetin, H.; Cay, N. CT evaluation for sarcopenia involving the psoas and paravertebral muscles in patients with total hip arthroplasty. Skelet. Radiol. 2022, 51, 587–593. [Google Scholar] [CrossRef] [PubMed]
- Tanaka, S.; Kayamoto, A.; Terai, C.; Nojiri, S.; Fugane, Y.; Mori, T.; Nagaya, M.; Kako, M.; Iida, H.; Osawa, Y.; Takegami, Y.; Nishida, Y. Preoperative sarcopenia severity and clinical outcomes after total hip arthroplasty. Nutrients 2024, 16, 2085. [Google Scholar] [CrossRef] [PubMed]
- Longo, U.G.; De Salvatore, S.; Borredon, A.; Manon, K.Y.; Marchetti, A.; De Marinis, M.G.; Denaro, V. The effects of sarcopenia on hip and knee replacement surgery: A systematic review. Medicina 2023, 59, 524. [Google Scholar] [CrossRef] [PubMed]
- Keats, A.S. The ASA classification of physical status: A recapitulation. Anesthesiology 1978, 49, 233–236. [Google Scholar] [CrossRef] [PubMed]
- Charlson, M.E.; Pompei, P.; Ales, K.L.; MacKenzie, C.R. A new method of classifying prognostic comorbidity in longitudinal studies: Development and validation. J. Chronic Dis. 1987, 40, 373–383. [Google Scholar] [CrossRef] [PubMed]
- Shah, S.; Vanclay, F.; Cooper, B. Improving the sensitivity of the Barthel Index for stroke rehabilitation. J. Clin. Epidemiol. 1989, 42, 703–709. [Google Scholar] [CrossRef] [PubMed]
- Reisberg, B.; Ferris, S.H.; de Leon, M.J.; Crook, T. The Global Deterioration Scale for assessment of primary degenerative dementia. Am. J. Psychiatry 1982, 139, 1136–1139. [Google Scholar] [CrossRef] [PubMed]
- Ware, J.E., Jr.; Kosinski, M.; Keller, S.D. A 12-item short-form health survey: Construction of scales and preliminary tests of reliability and validity. Med. Care 1996, 34, 220–233. [Google Scholar] [CrossRef] [PubMed]
- Kovalenko, B.; Bremjit, P.; Fernando, N. Classifications in brief: Tönnis classification of hip osteoarthritis. Clin. Orthop. Relat. Res. 2018, 476, 1680–1684. [Google Scholar] [CrossRef] [PubMed]
- Dorr, L.D.; Faugere, M.C.; Mackel, A.M.; Gruen, T.A.; Bognar, B.; Malluche, H.H. Structural and cellular assessment of bone quality of proximal femur. Bone 1993, 14, 231–242. [Google Scholar] [CrossRef] [PubMed]
- Sah, A.P.; Thornhill, T.S.; LeBoff, M.S.; Glowacki, J. Correlation of plain radiographic indices of the hip with quantitative bone mineral density. Osteoporos. Int. 2007, 18, 1119–1126. [Google Scholar] [CrossRef] [PubMed]
- Nguyen, B.N.; Hoshino, H.; Togawa, D.; Matsuyama, Y. Cortical thickness index of the proximal femur: A radiographic parameter for preliminary assessment of bone mineral density and osteoporosis status in the age 50 years and over population. Clin. Orthop. Surg. 2018, 10, 149–156. [Google Scholar] [CrossRef] [PubMed]
- Byrd, J.W.; Jones, K.S. Prospective analysis of hip arthroscopy with 2-year follow-up. Arthroscopy 2000, 16, 578–587. [Google Scholar] [CrossRef] [PubMed]
- Batlle-Gualda, E.; Esteve-Vives, J.; Piera, M.C.; Hargreaves, R.; Cutts, J. Adaptación transcultural del cuestionario WOMAC específico para artrosis de rodilla y cadera. Rev. Esp. Reumatol. 1999, 26, 38–45. [Google Scholar]
- Gandek, B.; Roos, E.M.; Franklin, P.D.; Ware, J.E., Jr. Item selection for 12-item short forms of the Knee injury and Osteoarthritis Outcome Score (KOOS-12) and Hip disability and Osteoarthritis Outcome Score (HOOS-12). Osteoarthr. Cartil. 2019, 27, 746–753. [Google Scholar] [CrossRef] [PubMed]
- Ji, H.M.; Han, J.; Jin, D.S.; Suh, H.; Chung, Y.S.; Won, Y.Y. Sarcopenia and sarcopenic obesity in patients undergoing orthopedic surgery. Clin. Orthop. Surg. 2016, 8, 194–202. [Google Scholar] [CrossRef] [PubMed]
- Koto, S.; Ikeda, T.; Inoue, S.; Inoue, H.; Watanabe, M. Differences in preoperative function and outcome of patients with versus without sarcopenia after total hip arthroplasty. J. Phys. Ther. Sci. 2022, 34, 60–64. [Google Scholar] [CrossRef] [PubMed]
- Su, Y.; Peng, L.; Dong, D.; Ma, Z.; Gu, X. Impact of sarcopenia in elderly patients undergoing elective total hip arthroplasty on postoperative outcomes: A propensity score-matched study. BMC Anesthesiol. 2024, 24, 158. [Google Scholar] [CrossRef] [PubMed]
- Ueoka, K.; Kabata, T.; Kajino, Y.; Inoue, D.; Ohmori, T.; Ueno, T.; Yoshitani, J.; Yamamuro, Y.; Taninaka, A.; Kato, S.; Yahata, T.; Tsuchiya, H. The prevalence and impact of sarcopenia in females undergoing total hip arthroplasty: A prospective study. Mod. Rheumatol. 2022, 32, 193–198. [Google Scholar] [CrossRef] [PubMed]
- Kim, S.-Y.; Cho, W.-S.; Park, C.-B.; Kim, B.-G. Impact of sarcopenia and functional relationships between balance and gait after total hip arthroplasty. J. Clin. Med. 2025, 14, 2036. [Google Scholar] [CrossRef] [PubMed]
- Malmstrom, T.K.; Morley, J.E. SARC-F: A simple questionnaire to rapidly diagnose sarcopenia. J. Am. Med. Dir. Assoc. 2013, 14, 531–532. [Google Scholar] [CrossRef] [PubMed]
- Parra-Rodríguez, L.; Szlejf, C.; García-González, A.I.; Malmstrom, T.K.; Cruz-Arenas, E.; Rosas-Carrasco, O. Cross-cultural adaptation and validation of the Spanish-language version of the SARC-F to assess sarcopenia in Mexican community-dwelling older adults. J. Am. Med. Dir. Assoc. 2016, 17, 1142–1146. [Google Scholar] [CrossRef] [PubMed]
- Beaudart, C.; McCloskey, E.; Bruyère, O.; Cesari, M.; Rolland, Y.; Rizzoli, R.; Araujo de Carvalho, I.; Amuthavalli Thiyagarajan, J.; Bautmans, I.; Bertière, M.-C.; et al. Sarcopenia in daily practice: assessment and management. BMC Geriatr. 2016, 16, 170. [Google Scholar] [CrossRef] [PubMed]
- Janssen, I.; Heymsfield, S.B.; Ross, R. Low relative skeletal muscle mass (sarcopenia) in older persons is associated with functional impairment and physical disability. J. Am. Geriatr. Soc. 2002, 50, 889–896. [Google Scholar] [CrossRef] [PubMed]
- Studenski, S.A.; Peters, K.W.; Alley, D.E.; Cawthon, P.M.; McLean, R.R.; Harris, T.B.; Ferrucci, L.; Guralnik, J.M.; Fragala, M.S.; Kenny, A.M.; Kiel, D.P.; Kritchevsky, S.B.; Shardell, M.D.; Dam, T.-T.L.; Vassileva, M.T. The FNIH sarcopenia project: Rationale, study description, conference recommendations, and final estimates. J. Gerontol. A Biol. Sci. Med. Sci. 2014, 69, 547–558. [Google Scholar] [CrossRef] [PubMed]
- Leong, D.P.; Teo, K.K.; Rangarajan, S.; Lopez-Jaramillo, P.; Avezum, A., Jr.; Orlandini, A.; Seron, P.; Ahmed, S.H.; Rosengren, A.; Kelishadi, R.; et al. Prognostic value of grip strength: Findings from the Prospective Urban Rural Epidemiology (PURE) study. Lancet 2015, 386, 266–273. [Google Scholar] [CrossRef] [PubMed]
- Huo, Y.R.; Suriyaarachchi, P.; Gomez, F.; Curcio, C.L.; Boersma, D.; Muir, S.W.; Montero-Odasso, M.; Gunawardene, P.; Demontiero, O.; Duque, G. Phenotype of osteosarcopenia in older individuals with a history of falling. J. Am. Med. Dir. Assoc. 2015, 16, 290–295. [Google Scholar] [CrossRef] [PubMed]
- Kirk, B.; Zanker, J.; Duque, G. Osteosarcopenia: Epidemiology, diagnosis, and treatment—facts and numbers. J. Cachexia Sarcopenia Muscle 2020, 11, 609–618. [Google Scholar] [CrossRef] [PubMed]
- Kweon, S.H.; Park, J.S.; Park, B.H. Sarcopenia and its association with change of bone mineral density and functional outcome in old-aged hip arthroplasty patients. Geriatr. Orthop. Surg. Rehabil. 2022, 13, 21514593221092880. [Google Scholar] [CrossRef] [PubMed]
- Brzeszczynski, F.; Brzeszczynska, J.; Duckworth, A.D.; Murray, I.R.; Simpson, A.H.R.W.; Hamilton, D.F. The effect of sarcopenia on outcomes following orthopaedic surgery: A systematic review. Bone Jt. J. 2022, 104-B, 321–330. [Google Scholar] [CrossRef] [PubMed]
- Martone, A.M.; Ciciarello, F.; Galluzzo, V.; Calvani, R.; Zazzara, M.B.; Tosato, M.; Coelho-Junior, H.J.; Marzetti, E.; Landi, F. A simple medical device development according to normative values of calf circumference across ages: Results from the Italian Longevity Check-up 7+ (Lookup 7+) project. J. Cachexia Sarcopenia Muscle 2024, 15, 36–44. [Google Scholar] [CrossRef] [PubMed]
- Gonzalez, M.C.; Mehrnezhad, A.; Razaviarab, N.; Barbosa-Silva, T.G.; Heymsfield, S.B. Calf circumference: Cutoff values from the NHANES 1999-2006. Am. J. Clin. Nutr. 2021, 113, 1679–1687. [Google Scholar] [CrossRef] [PubMed]
- Piodena-Aportadera, M.R.B.; Lau, S.; Chew, J.; Lim, J.P.; Ismail, N.H.; Ding, Y.Y.; Lim, W.S. Calf circumference measurement protocols for sarcopenia screening: Differences in agreement, convergent validity and diagnostic performance. Ann. Geriatr. Med. Res. 2022, 26, 215–224. [Google Scholar] [CrossRef] [PubMed]
- Chen, L.K.; Woo, J.; Assantachai, P.; Auyeung, T.W.; Chou, M.Y.; Iijima, K.; Jang, H.C.; Kang, L.; Kim, M.; Kim, S.; et al. Asian Working Group for Sarcopenia: 2019 consensus update on sarcopenia diagnosis and treatment. J. Am. Med. Dir. Assoc. 2020, 21, 300–307.e2. [Google Scholar] [CrossRef] [PubMed]
- Oikawa, S.Y.; Holloway, T.M.; Phillips, S.M. The impact of step reduction on muscle health in aging: Protein and exercise as countermeasures. Front. Nutr. 2019, 6, 75. [Google Scholar] [CrossRef] [PubMed]
- Fu, H.; Wang, L.; Zhang, W.; Lu, J.; Yang, M. Diagnostic test accuracy of ultrasound for sarcopenia diagnosis: A systematic review and meta-analysis. J. Cachexia Sarcopenia Muscle 2023, 14, 57–70. [Google Scholar] [CrossRef] [PubMed]
- Nies, I.; Ackermans, L.L.G.C.; Poeze, M.; Blokhuis, T.J.; Ten Bosch, J.A. The diagnostic value of ultrasound of the rectus femoris for the diagnosis of sarcopenia in adults: A systematic review. Injury 2022, 53, S23–S29. [Google Scholar] [CrossRef] [PubMed]
- Zheng, W.H.; Hu, Y.G.; Yu, D.X.; Huang, H.B. Creatinine-to-cystatin C ratio as muscle assessment tool and predictive value for mortality and sarcopenia in patients with chronic kidney disease: A meta-analysis. Front. Nutr. 2025, 12, 1655488. [Google Scholar] [CrossRef] [PubMed]
- Zheng, W.H.; Zhu, Y.B.; Yao, Y.; Huang, H.B. Serum creatinine/cystatin C ratio as a muscle mass evaluating tool and prognostic indicator for hospitalized patients: A meta-analysis. Front. Med. 2023, 9, 1058464. [Google Scholar] [CrossRef] [PubMed]
- Jørgensen, S.L.; Kierkegaard, S.; Bohn, M.B.; Aagaard, P.; Mechlenburg, I. Effects of resistance training prior to total hip or knee replacement on post-operative recovery in functional performance: A systematic review and meta-analysis. Front. Sports Act. Living 2022, 4, 924307. [Google Scholar] [CrossRef] [PubMed]
- Pegreffi, F.; Chiaramonte, R.; Donati Zeppa, S.; Lauretani, F.; Salvi, M.; Zucchini, I.; Veronese, N.; Vecchio, M.; Bartolacci, A.; Stocchi, V.; Maggio, M. Optimizing the preoperative preparation of sarcopenic older people: The role of prehabilitation and nutritional supplementation before knee arthroplasty. Nutrients 2024, 16, 3462. [Google Scholar] [CrossRef] [PubMed]
- Bauer, J.; Morley, J.E.; Schols, A.M.W.J.; Ferrucci, L.; Cruz-Jentoft, A.J.; Dent, E.; Baracos, V.E.; Crawford, J.A.; Doehner, W.; Heymsfield, S.B.; et al. Sarcopenia: A time for action. An SCWD position paper. J. Cachexia Sarcopenia Muscle 2019, 10, 956–961. [Google Scholar] [CrossRef] [PubMed]
- Knoedler, S.; Schliermann, R.; Knoedler, L.; Wu, M.; Hansen, F.J.; Matar, D.Y.; Obed, D.; et al. Impact of sarcopenia on outcomes in surgical patients: A systematic review and meta-analysis. Int. J. Surg. 2023, 109, 4238–4262. [Google Scholar] [CrossRef] [PubMed]
Figure 1.
Study flow diagram and EWGSOP2 staging. Flow of participants from eligibility assessment to the final analytic cohort, and stepwise EWGSOP2 classification using handgrip strength, SMI, and gait speed for severe sarcopenia. Cut-offs according to EWGSOP2; gait speed measured over 6 meters; SMI derived from DXA.
Figure 1.
Study flow diagram and EWGSOP2 staging. Flow of participants from eligibility assessment to the final analytic cohort, and stepwise EWGSOP2 classification using handgrip strength, SMI, and gait speed for severe sarcopenia. Cut-offs according to EWGSOP2; gait speed measured over 6 meters; SMI derived from DXA.
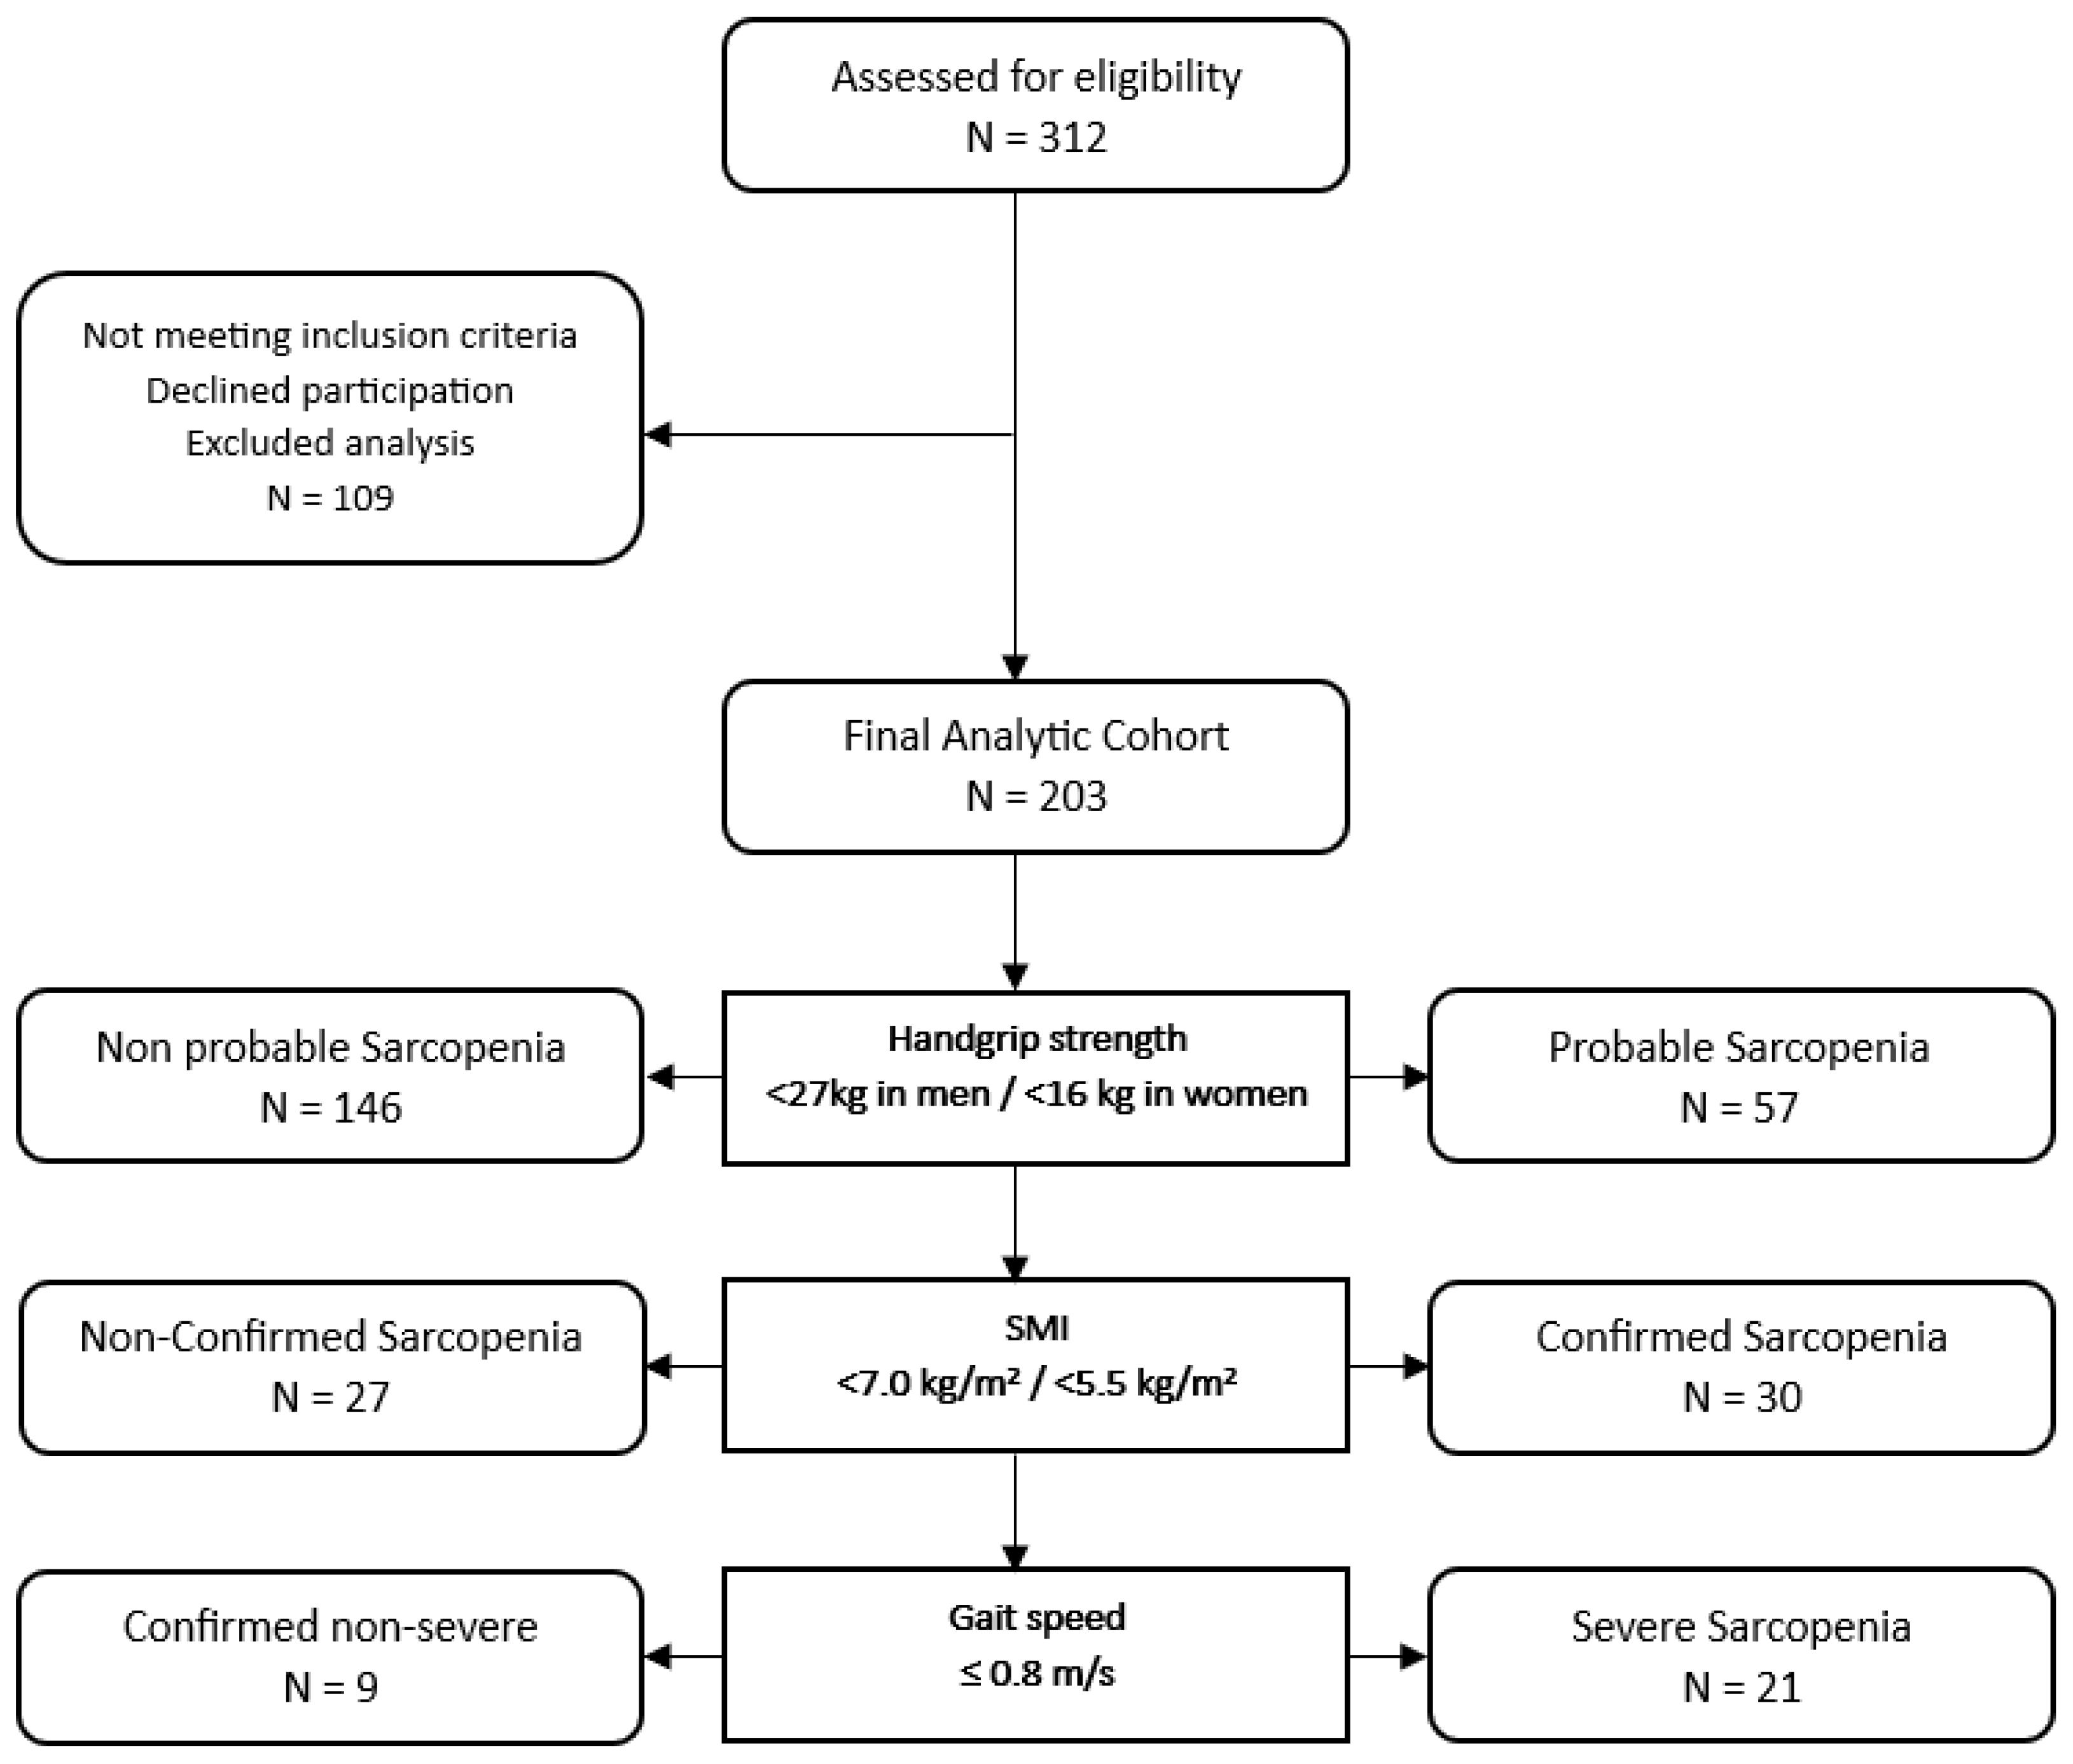

Table 1.
Baseline characteristics of patients with and without confirmed sarcopenia according to EWGSOP2 criteria. Values are presented as median [IQR] or n (%), unless otherwise stated. p-values correspond to between-group comparisons.
Table 1.
Baseline characteristics of patients with and without confirmed sarcopenia according to EWGSOP2 criteria. Values are presented as median [IQR] or n (%), unless otherwise stated. p-values correspond to between-group comparisons.
| Non-confirmed sarcopenia (n=173) |
Sarcopenia confirmed (n=30) |
p-value | ||
|---|---|---|---|---|
| Anthropometric variables | ||||
| Sex | Male | 83 (48.0%) | 12 (40.0%) | 0.437 |
| Female | 90 (52.0%) | 18 (60.0%) | ||
| Age | 70 [63-74] | 76 [69-79] | <0.001 | |
| 50-59 | 24 (13.9%) | 0 (0.0%) | 0.004 | |
| 60-69 | 61 (35.3%) | 8 (26.7%) | ||
| 70-79 | 77 (44.5%) | 15 (50.0%) | ||
| >80 | 11 (6.4%) | 7 (23.3%) | ||
| BMI | 29.4 [26.4-32.9] | 27.1 [24.7-28.9] | 0.006 | |
| <18.5 | 0 (0.0%) | 0 (0.0%) | 0.028 | |
| 18.5-24.9 | 30 (17.3%) | 10 (33.3%) | ||
| 25-29.9 | 66 (38.2%) | 15 (50.0%) | ||
| 30-34.9 | 59 (34.1%) | 4 (13.3%) | ||
| 35-39.9 | 18 (10.4%) | 1 (3.3%) | ||
| Baseline clinical variables | ||||
| VAS (0-10) | 7 [7-8] | 8 [7-9] | 0.083 | |
| ASA | I | 23 (13.3%) | 7 (23.3%) | 0.475 |
| II | 115 (66.5%) | 19 (63.3%) | ||
| III | 34 (19.7%) | 4 (13.3%) | ||
| IV | 1 (0.6%) | 0 (0.0%) | ||
| Charlson Comorbidity Index | 3 [2-3] | 3 [3-4] | 0.008 | |
| Barthel Index | 100 [95-100] | 92 [86-100] | <0.001 | |
| Reisberg GDS | 1 [1-1] | 1 [1-2] | <0.001 | |
| SF-12 PCS | 27.40 [23.51-33.12] | 27.80 [25.93-32.42] | 0.440 | |
| SF-12 MCS | 47.22 [35.88-55.86] | 37.69 [29.33-47.75] | 0.008 | |
| Proximal femur radiographic | ||||
| Tönnis | 1 | 5 (2.9%) | 1 (3.3%) | 0.991 |
| 2 | 69 (39.9%) | 12 (40.0%) | ||
| 3 | 99 (57.2%) | 17 (56.7%) | ||
| Dorr | A | 39 (22.5%) | 4 (13.3%) | 0.295 |
| B | 96 (55.5%) | 16 (53.3%) | ||
| C | 38 (22.0%) | 10 (33.3%) | ||
| CCR | 0.45 [0.40-0.49] | 0.47 [0.44-0.51] | 0.089 | |
| CTI | 0.58 [0.53-0.62] | 0.56 [0.54-0.61] | 0.349 | |
| Laboratory parameters | ||||
| Hemoglobin | 140 [133-150] | 140 [130-147] | 0.413 | |
| Albumin | 46.0 [44.0-47.0] | 46.0 [43.25-48.0] | 0.560 | |
| Functional outcomes measures | ||||
| mHHS | 48.6 [42.0-55.0] | 41.0 [32.5-46.5] | 0.004 | |
| HOOS-12 (total) | Total | 25.0 [18.7-35.4] | 25.0 [16.6-33.3] | 0.654 |
| HOOS-12 |
HPain | 25.0 [18.8-31.3] | 20.8 [12.5-31.3] | 0.415 |
| HADL | 25.0 [18.8-37.5] | 28.1 [18.8-37.5] | 0.904 | |
| HQoL | 25.0 [12.5-31.3] | 25.0 [12.5-25.0] | 0.383 | |
| WOMAC |
Total | 65 [55-75] | 68 [60-77] | 0.245 |
| WSymptom | 6 [4-7] | 6 [5-7] | 0.044 | |
| WPain | 12 [9-15] | 12 [8-14] | 0.532 | |
| WFunction | 47 [40-54] | 48 [44-55] | 0.462 | |
Values from χ2 test; Fisher’s exact test used when expected counts were <5. Continuous variables compared using Mann-Whitney U test; p<0.05 considered statistically significant.
Table 2.
Distribution of baseline variables according to EWGSOP2. Values are presented as median [IQR] or n (%) unless otherwise stated. p-values correspond to trend tests across EWGSOP2. Effect size is reported as r = Z/√N with arrows indicating direction (↑ higher, ↓ lower, ↔ no monotonic trend).
Table 2.
Distribution of baseline variables according to EWGSOP2. Values are presented as median [IQR] or n (%) unless otherwise stated. p-values correspond to trend tests across EWGSOP2. Effect size is reported as r = Z/√N with arrows indicating direction (↑ higher, ↓ lower, ↔ no monotonic trend).
| No sarcopenia (n= 146) |
Probable (n= 27) |
Confirmed non severe (n= 9) |
Severe (n= 21) |
p-value | Effect size | ||
|---|---|---|---|---|---|---|---|
| Anthropometric variables | |||||||
| Age | 68.5 [62.0-74.0] | 74.0 [70.0-78.5] | 74.0 [68.0-77.0] | 78.0 [73.0-79.0] | <0.001 | 0.38 ↑ | |
| Sex | Males | 74 (50.7%) | 9 (33.3%) | 4 (44.4%) | 8 (38.1%) | 0.171 | |
| Females | 72 (49.3%) | 18 (66.7%) | 5 (55.6%) | 13 (61.9%) | |||
| BMI | 29.2 [26.3-31.9] | 32.7 [28.6-34.4] | 24.8 [24.0-27.0] | 28.2 [25.5-29.8] | 0.839 | 0.01 ↔ | |
| Baseline clinical variables | |||||||
| VAS | 7.0 [6.0-8.0] | 8.0 [8.0-9.0] | 8.0 [7.0-8.0] | 8.0 [7.0-9.0] | 0.001 | 0.23 ↑ | |
| ASA |
I | 19 (13.0%) | 4 (14.8%) | 2 (22.2%) | 5 (23.8%) | 0.353 |
|
| II | 97 (66.4%) | 18 (66.7%) | 6 (66.7%) | 13 (61.9%) | |||
| III | 29 (19.9%) | 5 (18.5%) | 1 (11.1%) | 3 (14.3%) | |||
| IV | 1 (0.7%) | 0 (0.0%) | 0 (0.0%) | 0 (0.0%) | |||
| Charlson Comorbidity Index | 2.5 [2.0-3.0] | 3.0 [3.0-4.0] | 3.0 [2.0-3.0] | 4.0 [3.0-4.0] | <0.001 | 0.30 ↑ | |
| Reisberg Global Deterioration Scale | 1 [1-1] | 1 [1-2] | 1 [1-1] | 1 [1-1] | <0.001 | 0.40 ↑ | |
| Barthel | 100.0 [95.0-100.0] | 90.0 [90.0-95.0] | 100.0 [95.0-100.0] | 90.0 [85.0-95.0] | <0.001 | 0.43 ↓ | |
| SF-12 PCS | 27.35 [23.51-33.33] | 41 [23.70-30.85] | 32.50 [28.90-36.19] | 26.53 [23.95-29.00] | 0.722 | 0.02 ↔ | |
| SF-12 MCS | 48.83 [38.62-56.36] | 34.52 [27.66-43.26] | 43.46 [34.16-58.40] | 32.45 [27.11-44.72] | <0.001 | 0.31 ↓ | |
| Laboratory parameters | |||||||
| Hemoglobin | 141.0 [135.0-151.8] | 137.0 [126.5-142.0] | 133.0 [129.0-149.0] | 141.0 [133.0-145.0] | 0.020 | 0.16 ↓ | |
| Albumin | 46.0 [44.0-48.0] | 45.0 [43.0-46.0] | 46.0 [46.0-47.0] | 45.0 [43.0-48.0] | 0.504 | 0.05 ↔ | |
| Proximal femur radiographic | |||||||
| Tönnis |
1 | 5 (3.4%) | 0 (0.0%) | 0 (0.0%) | 1 (4.8%) | 0.899 |
|
| 2 | 57 (39.0%) | 12 (44.4%) | 5 (55.6%) | 7 (33.3%) | |||
| 3 | 84 (57.5%) | 15 (55.6%) | 4 (44.4%) | 13 (61.9%) | |||
| DORR | A | 36 (24.7%) | 3 (11.1%) | 2 (22.2%) | 2 (9.5%) | 0.030 | |
| B | 82 (56.2%) | 14 (51.9%) | 3 (33.3%) | 13 (61.9%) | |||
| C | 28 (19.2%) | 10 (37.0%) | 4 (44.4%) | 6 (28.6%) | |||
| CCR | 0.45 [0.40-0.49] | 0.46 [0.42-0.52] | 0.50 [0.46-0.51] | 0.46 [0.43-0.51] | 0.028 | 0.15 ↑ | |
| CTI | 0.58 [0.54-0.62] | 0.55 [0.52-0.63] | 0.54 [0.50-0.57] | 0.57 [0.55-0.61] | 0.216 | 0.09 ↓ | |
| Functional outcomes measures | |||||||
| mHHS | 51.0 [41.3-57.0] | 38.6 [30.5-47.9] | 52.0 [38.0-62.0] | 40.0 [32.0-46.0] | <0.001 | 0.32 ↓ | |
| HOOS-12 | Total | 25.0 [18.7-35.4] | 20.8 [12.5-27.1] | 35.4 [14.6-41.7] | 25.0 [16.6-29.2] | 0.061 | 0.13 ↓ |
| HPain | 25.0 [18.8-31.3] | 18.8 [12.5-25.0] | 25.0 [12.5-31.3] | 25.0 [12.5-31.3] | 0.123 | 0.11 ↓ | |
| HADL | 31.3 [18.8-43.8] | 25.0 [18.8-31.3] | 31.3 [18.8-43.8] | 25.0 [18.8-37.5] | 0.411 | 0.06 ↓ | |
| HQoL | 25.0 [12.5-31.3] | 12.5 [6.3-25.0] | 25.0 [12.5-43.8] | 25.0 [12.5-25.0] | 0.004 | 0.20 ↓ | |
| WOMAC | Total | 65.0 [53.3-73.8] | 72.0 [66.5-77.0] | 58.0 [45.0-67.0] | 72.0 [62.0-79.0] | 0.016 | 0.17 ↑ |
| WSymptom | 5.0 [4.0-7.0] | 7.0 [5.0-7.0] | 6.0 [4.0-7.0] | 6.0 [5.0-7.0] | 0.002 | 0.22 ↑ | |
| WPain | 12.0 [9.0-15.0] | 13.0 [10.5-15.0] | 7.0 [5.0-12.0] | 13.0 [10.0-15.0] | 0.327 | 0.07 ↑ | |
| WFunction | 47.0 [38.3-53.0] | 51.0 [47.0-57.5] | 44.0 [35.0-50.0] | 52.0 [44.0-58.0] | 0.074 | 0.13 ↑ | |
Disclaimer/Publisher’s Note: The statements, opinions and data contained in all publications are solely those of the individual author(s) and contributor(s) and not of MDPI and/or the editor(s). MDPI and/or the editor(s) disclaim responsibility for any injury to people or property resulting from any ideas, methods, instructions or products referred to in the content. |
© 2026 by the authors. Licensee MDPI, Basel, Switzerland. This article is an open access article distributed under the terms and conditions of the Creative Commons Attribution (CC BY) license (http://creativecommons.org/licenses/by/4.0/).
Copyright: This open access article is published under a Creative Commons CC BY 4.0 license, which permit the free download, distribution, and reuse, provided that the author and preprint are cited in any reuse.