

Submitted:
06 July 2026
Posted:
07 July 2026
You are already at the latest version
Abstract
The Hwange Mining Area (HMA) is located in the Mid-Zambezi Karoo Basin in northwestern Zimbabwe, is a major centre for coal mining, processing and power generation. This study evaluates the ecological and public health risks associated with these activities, focusing on radionuclide con-centrations in coal and surrounding soils. Samples were collected from four locations: (i) Hwange Colliery Company (underground and open cast mines), (1) Zambezi Gas open cast operations, (iii) Residential areas and (iv) Hwange Thermal Power station. Radionuclide concentrations were measured using Hyper-Pure Germanium (HPGe) gamma spec-trometry. Results showed lower concentrations in mining areas compared to elevated levels in resi-dential and combustion environments. Radiological hazard indices, including radium equivalent (Raeq), external hazard index (Hex) and internal hazard index (Hin) values remained below recom-mended safety limits, indicating no immediate radiological risk. However, the absorbed dose rates, annual effective doses and excess lifetime cancer risk (ELCR) were higher in residential and combustion areas, with ELCR values exceeding the global average. These findings suggest a potential long-term public health risk associated with chronic exposure. The study underscores the need for continuous environmental monitoring strengthened regulatory control, targeted radiation protection strategies to safeguard workers and nearby communities.
Keywords:
gamma spectrometry
; radiological hazards indices
; radium equivalent
; activity concentrations
1. Introduction
Coal exploration and mining in Zimbabwe began in the 1900s by the Hwange Colliery Company, then known as Wankie Colliery Company, before independence [2]. In Zimbabwe, coal is used for thermal power generation, coking industries, metallurgical processes, and general-purpose coal used in different industries for heating. A significant portion of coal is used in agriculture and steel manufacturing, while the surplus is exported to international markets [3]. Additionally, coal combustion by-products such as fly and bottom ash are used in construction and cement manufacturing.
The International Energy Agency [4] reports that global coal demand reached a peak of 8.5 billion metric tonnes in 2023 and is expected to increase in the coming years [4]. In recent years, the coal mining industry in Zimbabwe has witnessed substantial growth, with new companies starting operations. The government is also taking steps to harness the vast coal reserves, which remain largely underutilised [5].
Coal is a heterogeneous mixture composed of organic materials, predominantly hydrocarbons, with a small number of inorganic materials – minerals and trace elements that occur naturally [6]. Hwange coal is the bituminous type with relatively high carbon content and moderate moisture levels. The presence of NORM in geological mineralisation has given rise to NORM industries, where coal mining and processing are included [7,8]. Further, the presence of inorganic elements in coal is due to the rocks which form the coal basin. This is increased due to the erosion and weathering process over time during the coalification process [9].
Research conducted in the United States of America has demonstrated that uranium is present in the majority of coal deposits [10], and a recent study in Zimbabwe has also shown the geological presence of uranium in the Hwange coal fields of Zimbabwe [6,10].
Naturally present radioactive elements such as thorium, uranium, radium, radon gas and their decay daughter series pose environmental risks during mining and mineral processing, including the combustion of fossil fuels. These activities can lead to land disturbance, atmospheric pollution and other environmental contaminants. Additionally, in coal mining, mine tailings, which are the residues left after mining operations and contain high levels of radionuclides and heavy metals, present ongoing waste management challenges [11,12].
This study focuses on two mines: Hwange Colliery Company, engaged in underground and open-cast mining operations and Zambezi Gas coal mine, specialising in open-cast mining. The research investigates coal and soil samples from these mines and the surrounding residential areas.
Coal mining and mineral processing and by-products involve the handling of NORM, potentially exposing mine workers, the public and the environment to elevated radiation levels.
Earlier studies on underground miners have shown that workplace exposure to radon (222Rn, thoron (220Rn) and their radioactive progeny poses a significant concern with an elevated risk of lung cancer [13,14]. Past studies on mine workers, including underground workers and nearby residents, have also reported radon exposure and high cancer incidences [15]. Additionally, mineral process activities such as thermal combustion and coking increase radiation exposure for workers, residents and the environment. The World Health Organisation (WHO) emphasises the need to develop protective measures to ensure radiation safety and occupational exposure control for NORM activities, including radon management [16,17].
Environmentally, the Hwange Mining area is located in the primary water body zone of the Zambezi River.
Knowledge of mining and mineral processing activities that can release pollutants such as radionuclides and heavy metals from coal, is essential for understanding and assessing potential effects of radiation exposure from naturally occurring radioactive materials. This knowledge is important for protecting miners, nearby residents, the general population and ecological systems from radiation hazards.
1.2. The Geology of the Hwange Coalfields
The Hwange coalfields were discovered in 1896, followed by exploration and mining starting in 1901 by the Wankie Colliery Company [18]. Studies carried out by the Geological Survey of Rhodesia then provided a status of the general geology and coal seam structure of the Hwange coalfields [19]. Coal deposits in Southern Africa, including Zimbabwe, are of the Permian age. The Hwange main seam, which is currently being mined, is reported to be of the Ecca age of the Karoos System of the Middle Zambezi Basin. The Hwange main seam is about 5-17 m thick, and rests on granite and gneiss rocks which contain sandy, micaceous shale [2,9]. The country has abundant coal deposits estimated at around 25 billion tonnes [5]. The structural geology of the country, called the Karoo System sediments and volcanics of Phanerozoic age, consists of three main basins, namely the Mid-Zambezi Basin, Lower-Zambezi and Save-Limpopo.
1.3. Stratigraphy of the Hwange Coalfields
The Hwange coal deposits are situated within the Lower Karoo system of the Mid-Zambezi basin, an area that has been explored and mined since 1902. These deposits are associated with sedimentary rocks and sandstone dating from the Carboniferous to Permian periods, collectively known as the Karoo deposits. Comprehensive geological investigations have been carried out in the Hwange area, revealing that the coal deposits were formed within a tectonically controlled basin shaped through a linear fault system [19].
The stratigraphy, palaeontology, palaeogeography and climatology of the area provide significant insight into the Hwange coal deposit formation. The deposits primarily comprise formations from the Dywaka Epoch and the Upper Wankie sandstones, both of which are of the Permian age [20]. This combination of geological features underscores the importance of the Hwange coalfield in understanding the Karoo system’s broader geological and environmental history. The sedimentary sequence consists of lithological units formed during glacial, fluvial and lacustrine events in the Carboniferous and Jurassic periods [6].
The coalification process occurred over a million years ago, with different climatic conditions where peat formation occurs. Coal is a heterogeneous mixture of organic material, mainly hydrocarbons, with small of inorganic materials, including natural elements. As postulated by the geological process, coalification of the Karoo system resulted in the basal seam known as the Hwange Main seam [21].
Past studies in mineralogy investigations around the Hwange Mining areas show the correlation of coal mineralogy with the stratigraphy of the Mid Zambezi Karoo basin and the influence of weathering and its impact on the mineral composition. Further, variations of clay mineral composition in the Mid Zambezi basin show the presence of anthracite, which is common in alkaline and marine sediments and forms bituminous coal [21].
1.4. Uranium Accumulation in Coalfields
Uranium accumulation in coal deposits is largely associated with geological conditions and processes that concentrate uranium in certain mining areas. During the coalification process, organic matter plays a big role, closely linked to uranium mineralisation [22]. The uranium mineralisation in coal deposits can be explained by three geological models which are: (i) syngenetic mineralisation, in which uranium occurs through plants and organic matter during coalification in swamps; [1] epigenetic mineralisation, in which uranium occurs after the formation process through groundwater in mudstones (iii) diagenetic mineralisation in which uranium was deposited through sediment deposition before coal was fully lithified [19]. Global studies conducted in the United States of America, China and South Africa have shown the presence of uranium in coalfields (10, 22, 23). In Zimbabwe, recent studies on the Hwange coal deposits indicate uranium levels at 18.8 ppm at the bottom, 17.9 ppm in the middle and 9.2 ppm at the top of the main seam [6]. This accumulation pattern shows how geological processes and environments dictate where and how much uranium is present in coal, impacting mining strategies and environmental considerations.
2. Materials and Methods
2.1. Study Area
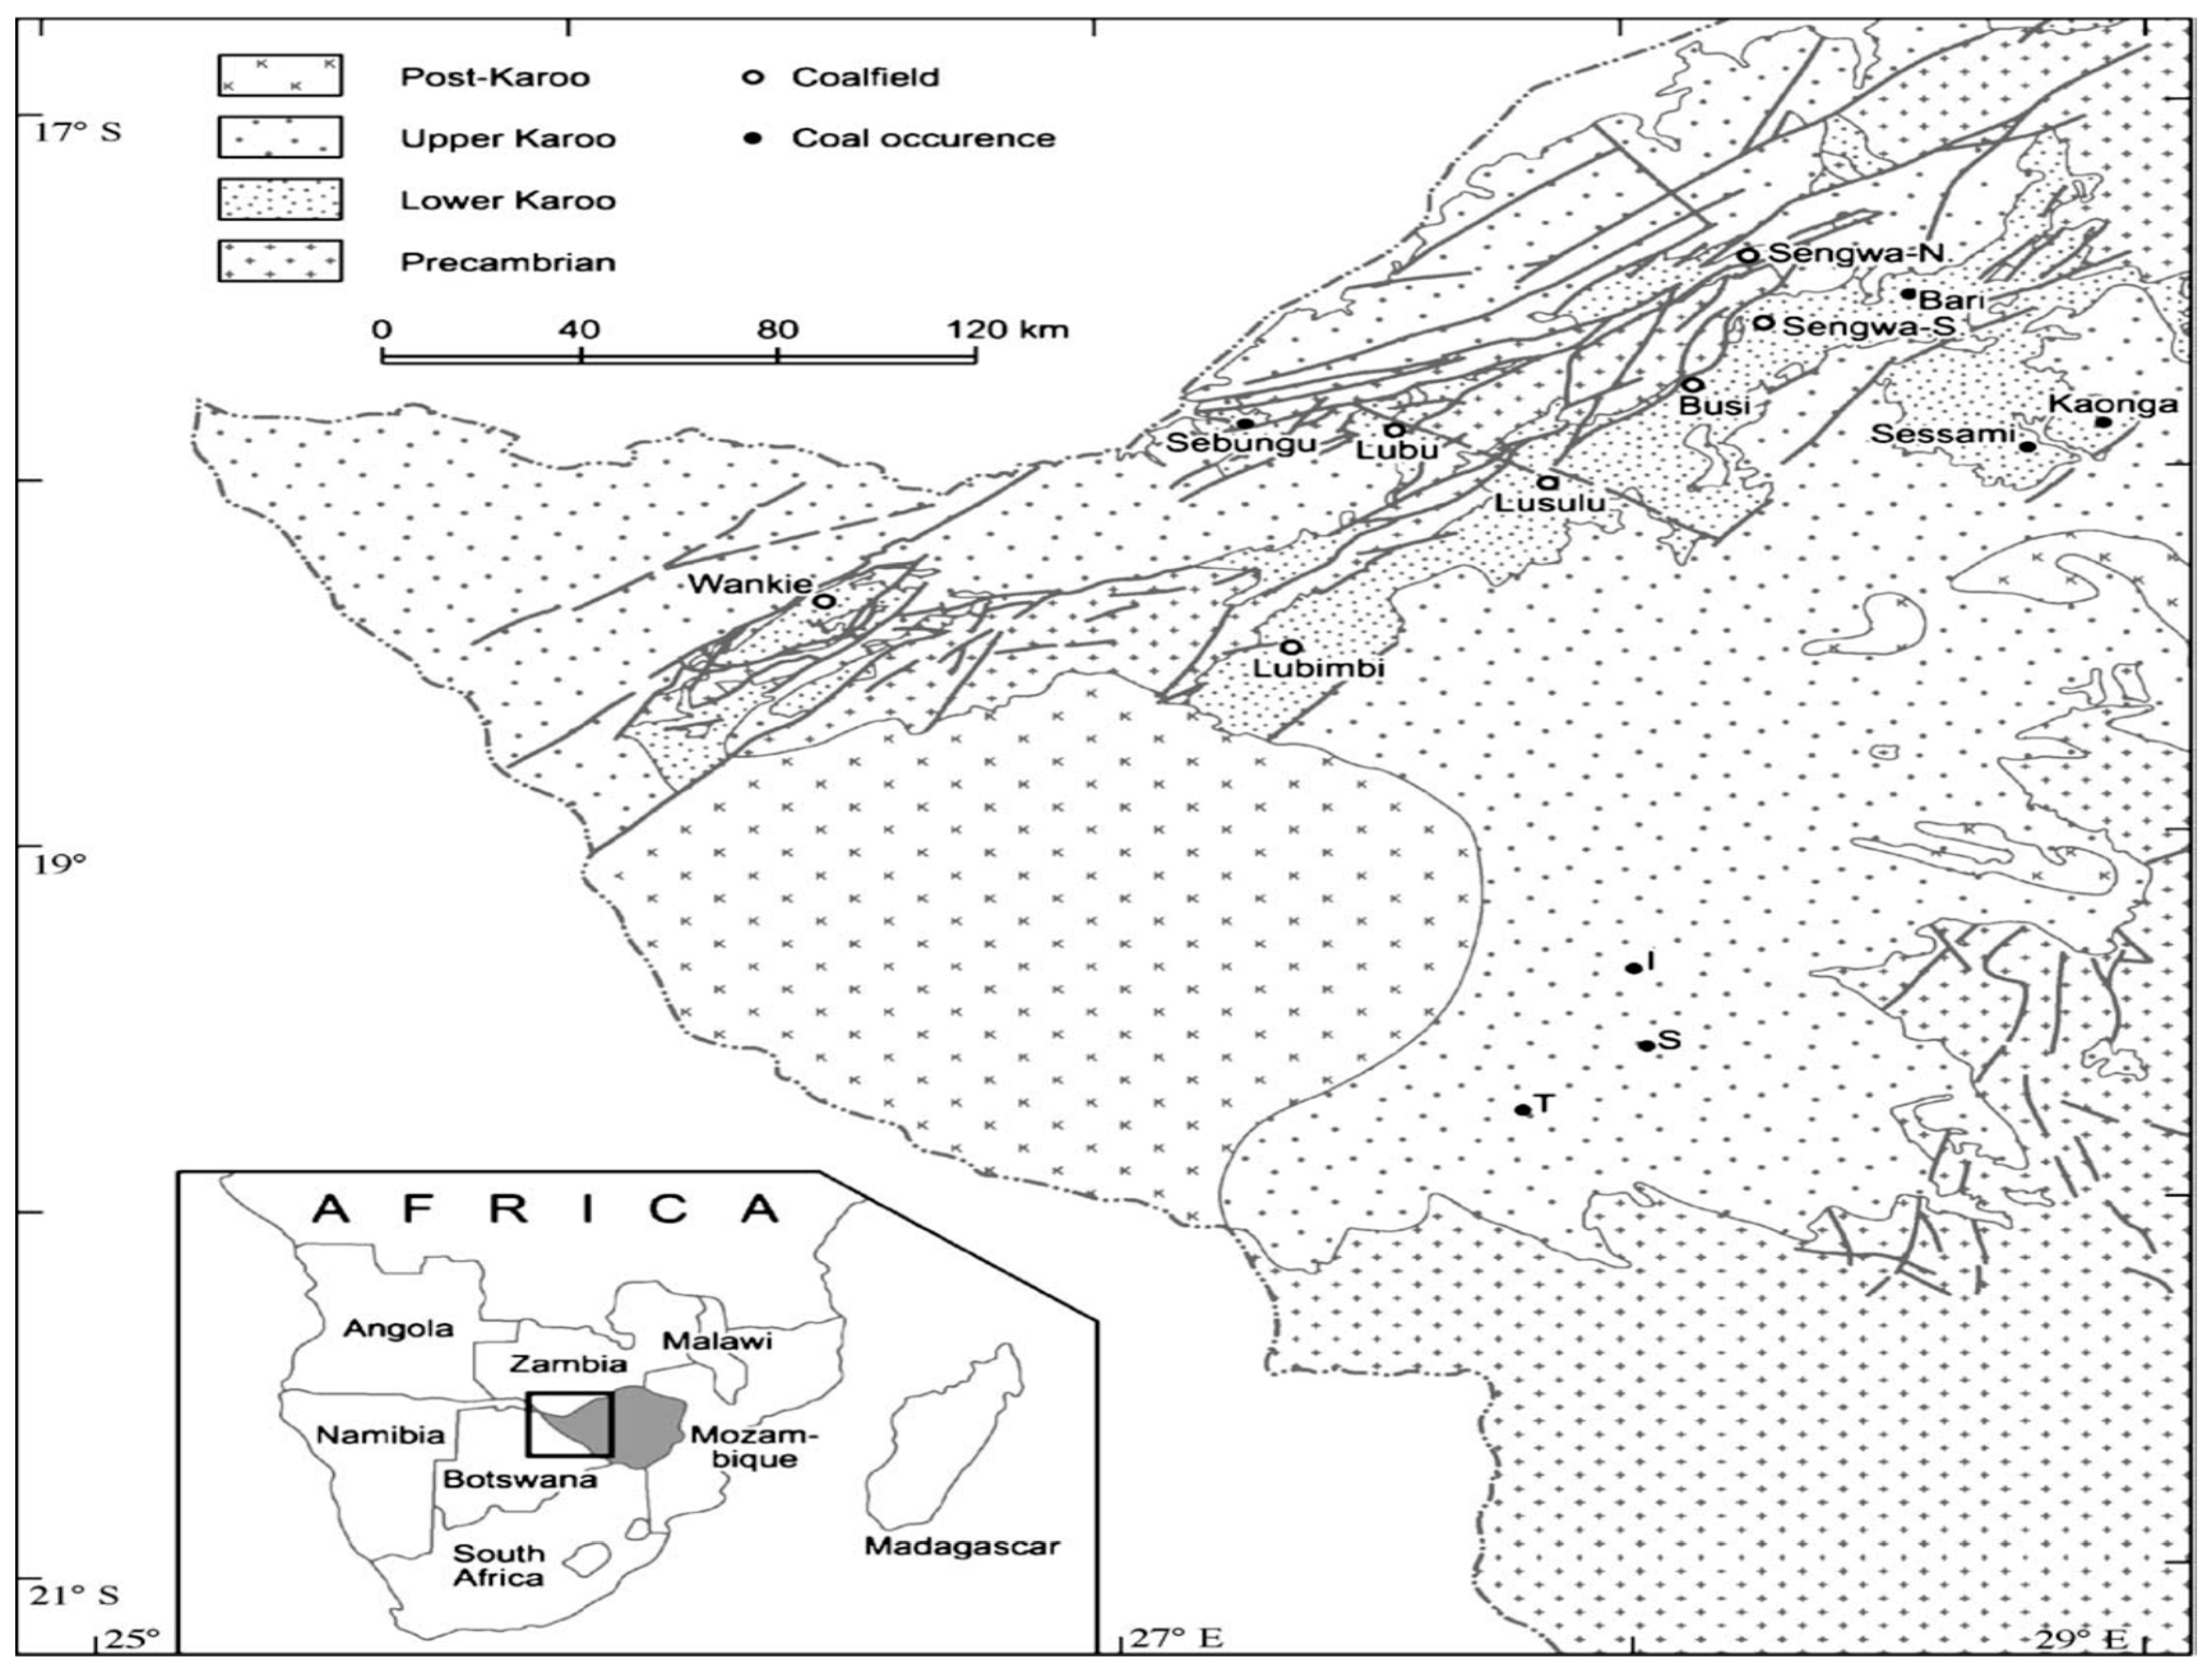
Hwange coal deposits are found in the northwestern region of Zimbabwe, as shown in Figure 1.0. The coal basin is bounded by a longitude of 26 °15’ and 26° 33’ east and a latitude of 18° 20’ and 18°30’ south. In and around the town of Hwange, bituminous coal has been mined and processed since 1903. The Deka river passes through the Hwange mining town areas and flows northeast into the Zambezi River. As it flows, the river passes through the community areas adjacent to the Hwange coal mines. The population of Hwange Urban is above forty thousand, and all the residents reside close to the mining and processing activities around the town and are at risk of radiation exposure from the operations [24].
Figure 1.
Occurrence of coal fields in the Hwange area [25].
Figure 1.
Occurrence of coal fields in the Hwange area [25].
2.2. Sample Collection
Twenty samples from the mining of coal ore residential areas and Zimbabwe power company were collected using a systematic sampling plan covering the study area in the Hwange Mining area. As a way to reduce the error on sampling bias, the exact point for collecting samples (mineral ore and soil samples) was done using the Epicollect 5 software program [26]. The program makes it easy to collect the GPS location, and the data can be analysed and exported into maps showing the sampling areas.
Samples were collected and placed into labelled polyethene bags, which were then sealed, with each site yielding approximately 2 kg of material. Each sample was assigned an identification number (ID), geological location and sampling date and systematically catalogued. Following field protocols, the samples were transported to the Radiation Protection Authority of Zimbabwe’s gamma spectrometry laboratory for processing and analytical evaluation.
The sampling methods adhered to the guidelines designed in accordance with international safety standards for soil analysis and contamination research, as specified by [27] and [28]. The sampling areas were categorised based on the origin of the samples into four distinct sections, namely. (i) Hwange Colliery, [1] Zambezi Gas, Residential areas, and iv) Zimbabwe Power company (see Table 1.1).
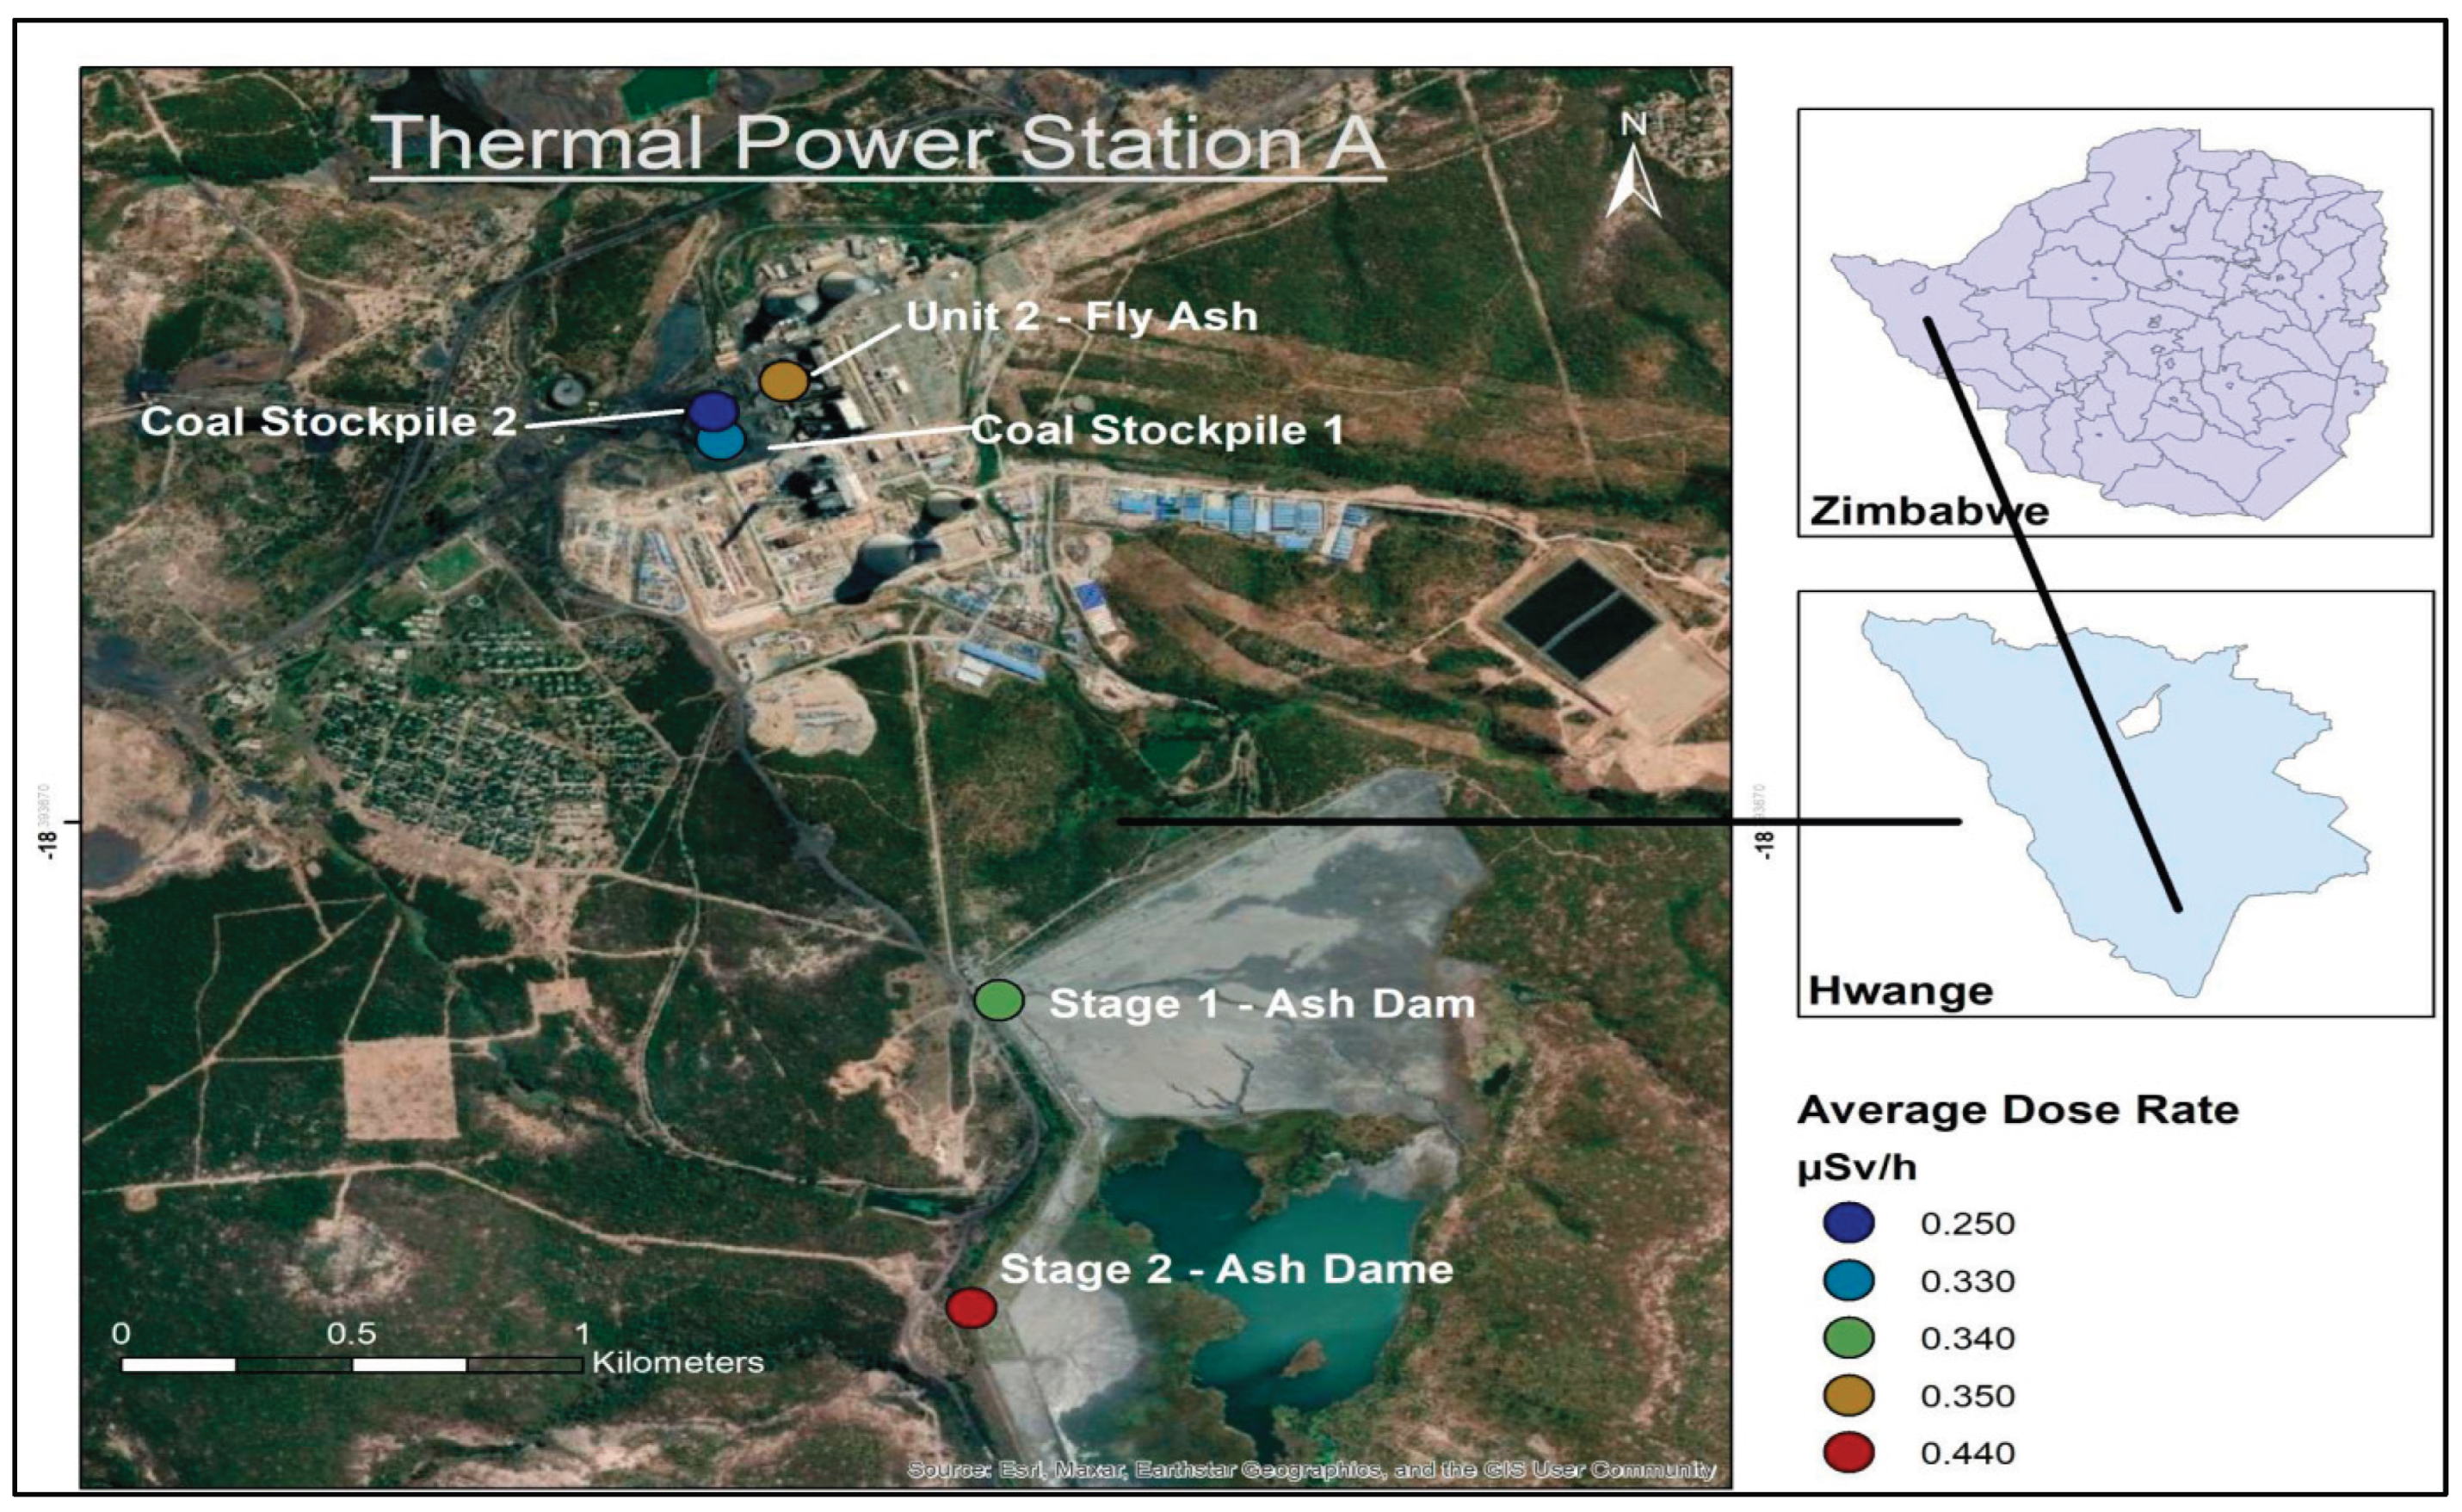
As shown in Table 1.1, a total of twenty [20] samples were collected from mining of coal ore, soil samples, and combustion (fly ash), using a systematic sampling plan covering the study area in the Hwange Mining area.
Figure 2.
Mining and residential areas sampling locations.
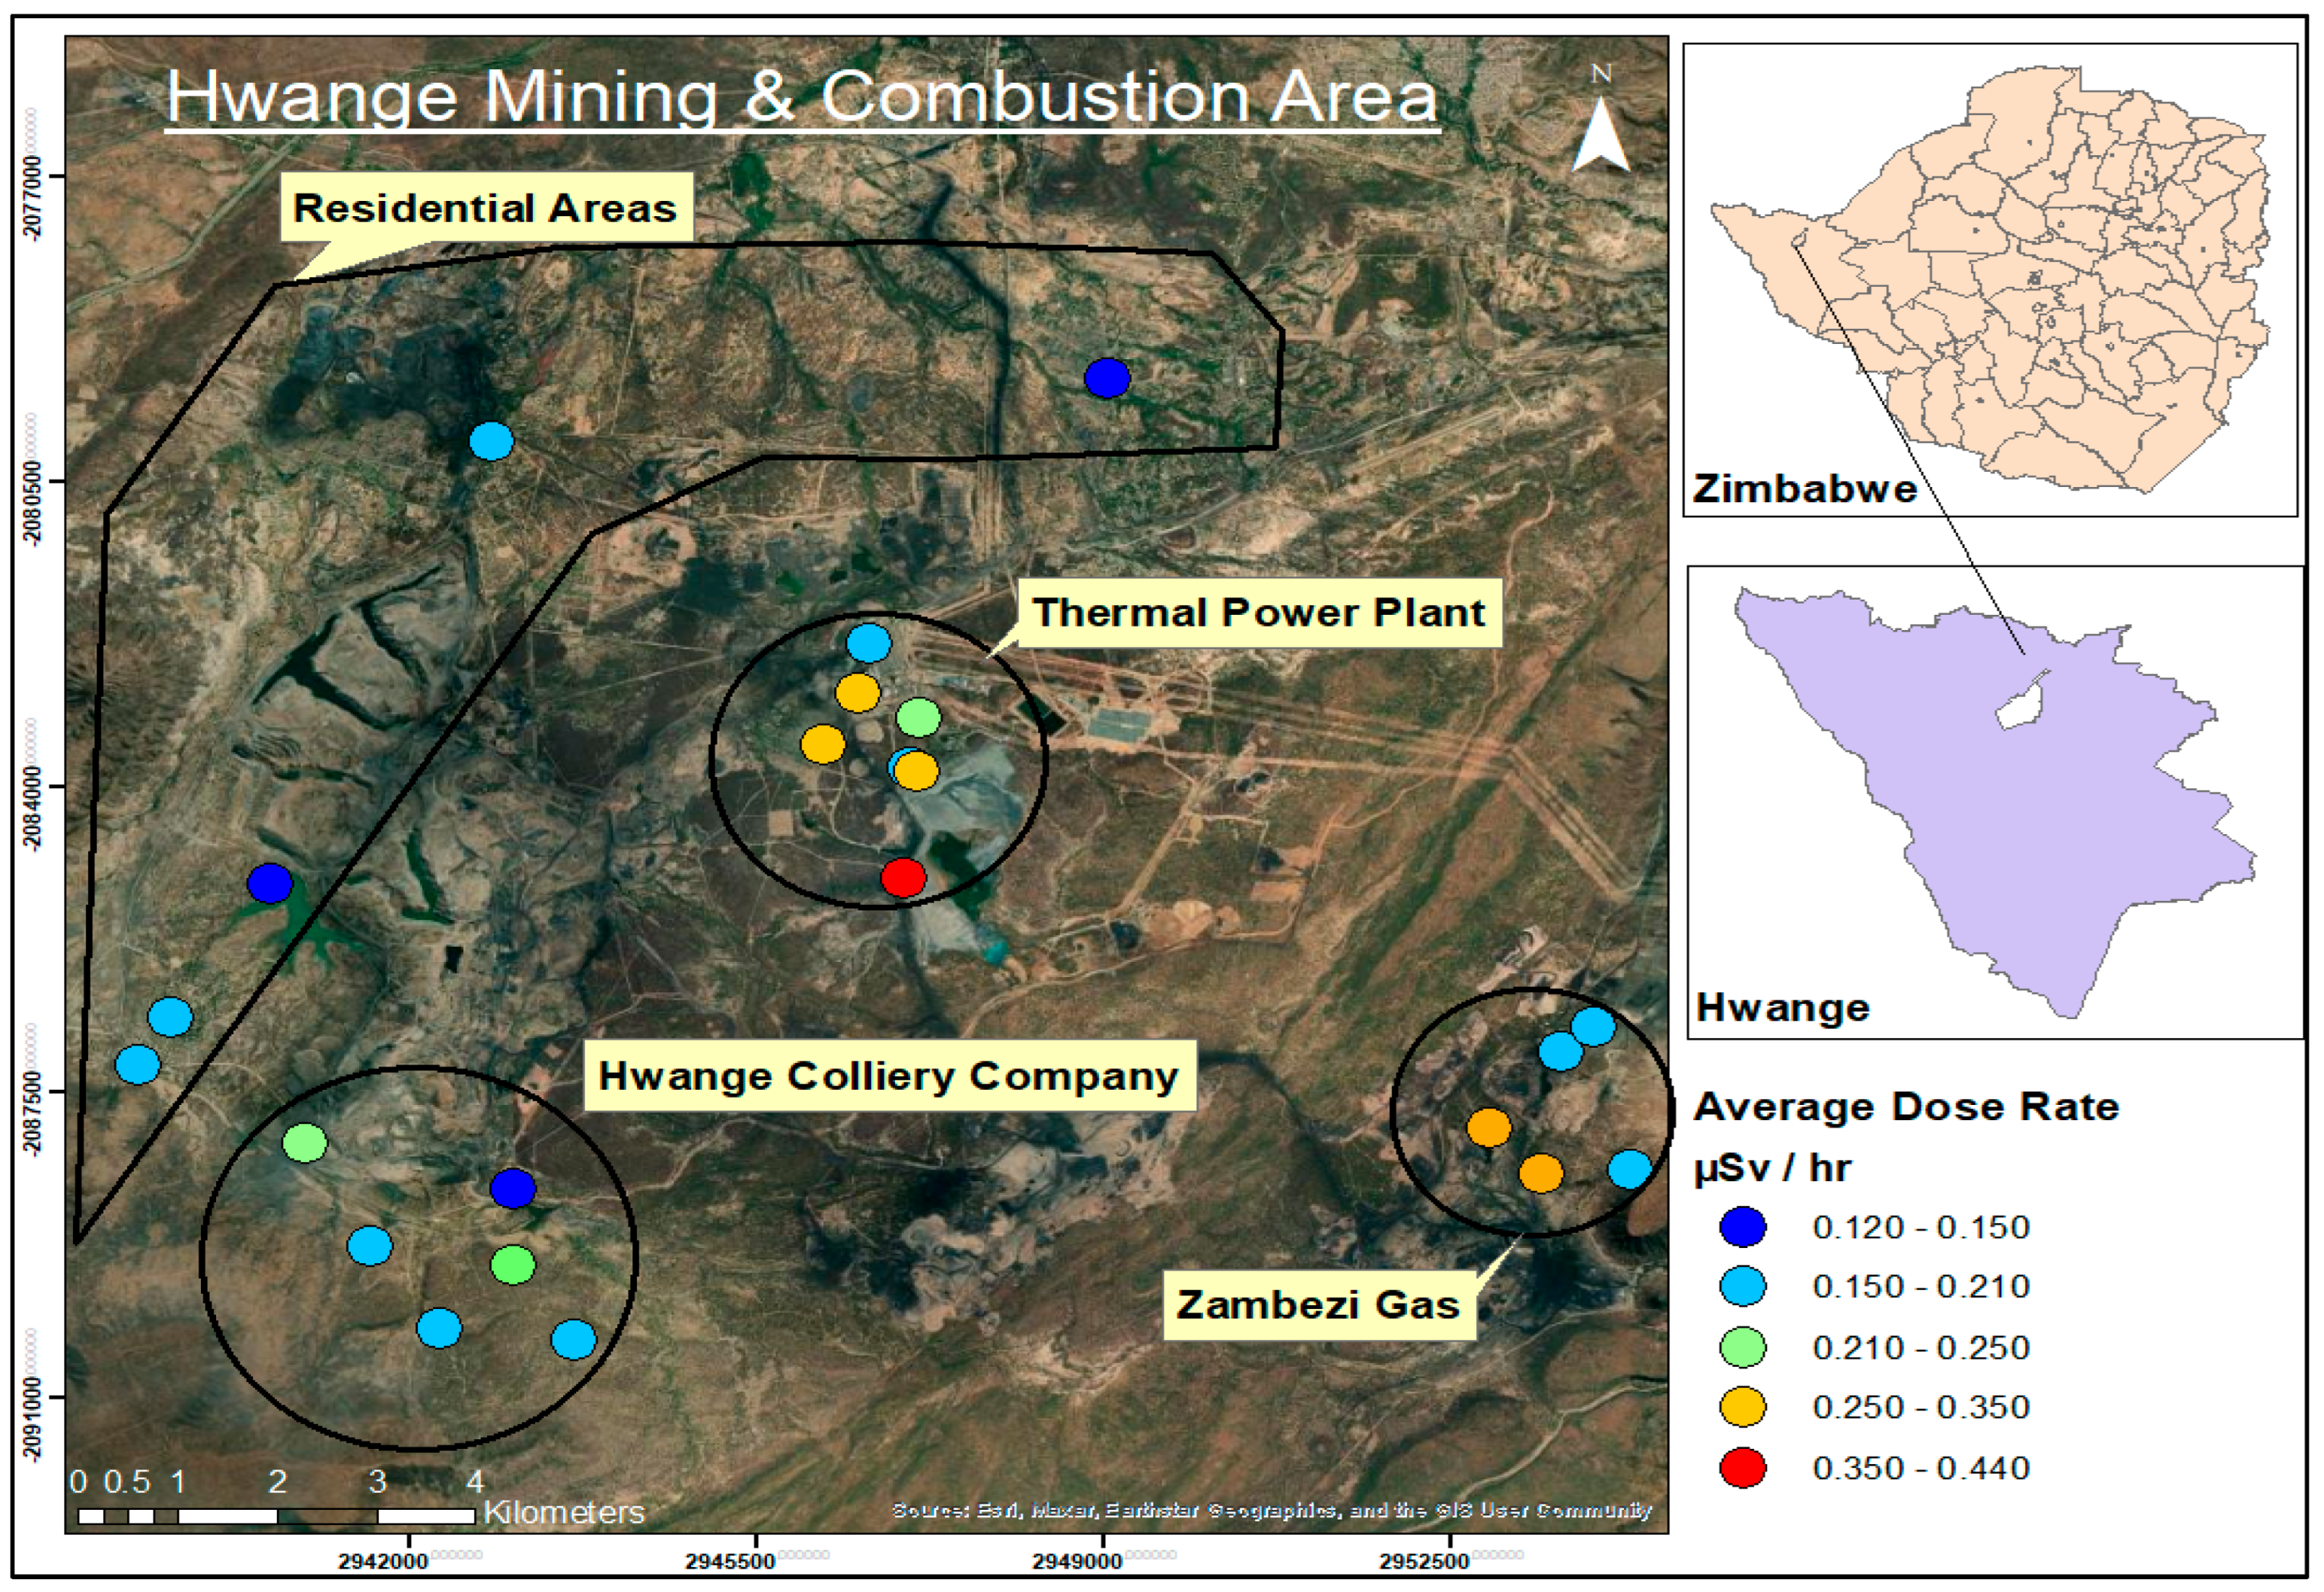
Figure 3.
Coal combustion sampling locations.
2.3. Sample Preparation
Following transportation to the Radiation Protection Authority’s laboratory in Harare, Zimbabwe, samples underwent gamma spectrometric preparation and subsequent analysis. After the field collection, the samples were processed by first sieving them with a 2 mm mesh to remove vegetation and foreign particles. The collected samples were subsequently dried in an oven to eliminate residual moisture. Afterwards, they were sealed into Marinelli beakers using Polyvinyl Chloride (PVC) tape for 28 days to ensure a balance between 222Rn with its progenitor isotope 226Ra in the 238U decay series [29,30].
2.4. Data Analysis
In this study, the coal and soil samples were examined using a Canberra-manufactured, hyper-pure germanium (HPGe) gamma spectrometry system with a coaxial detector configuration. The system integrates a passively shielded germanium crystal, a high-voltage power source, a signal input preamplifier, and a pulse height analyser (MCA). The electrically cooled HPGe detector achieved an energy resolution of 2.0 keV at 1.33 MeV, and 1.10 keV at 122 keV, both measured at full width at half maximum (FWHM), coupled with a relative efficiency of 40%.
The RPAZ gamma spectrometry laboratory employs a system where the detector is enclosed within a cylindrical 10 cm thick lead shield lined with 1.5 mm copper and 1 mm tin. The shield’s removable lid fixed base ensures easy access while attenuating background interference, ensuring precision of low activity environmental analytes.
A baseline measurement was established in the laboratory over 48 hours using a Marinelli beaker filled with non-radioactive deionised water to establish a baseline spectrum. This background signal, representing ambient environmental radiation, was systematically subtracted from sample measurements to isolate contributions from target radionuclides.
The gamma-ray spectrum was analysed using the Genie 2000 software, which identified and quantified the characteristic energy peaks of target radionuclides. By evaluating all spectra peaks, particularly those unique to specific isotopes, the software enabled accurate determination of the activity concentrations through peak area integration and efficiency-corrected calculations.
2.5. Activity Concentrations
The activity concentration from gamma peak measurements is calculated from the relationship that the measured count rate directly correlates with the sample’s radioactivity content. The radionuclide activity was calculated using equation 1, as follows:
Where represents the net’s peak counts, γ is the gamma emission probability (gamma yield) of the radionuclide at the specified energy, and Corresponds to the detectors’ calibrated photo peak efficiency at photon energy (Eγ).
The specific activity A in Bq. kg-1 of primordial radionuclides 226Ra, 232Th and 40K were calculated by simply dividing the assessed activity of the sample Ac by respective mass M (equation 2) and the uncertainties are as shown in equation 3 [28].
2.5.1. Radium Equivalent
The safety parameter radium hazard index (Raeq) serves as a metric for assessing the cumulative radiological impact of naturally occurring radioactive materials, specifically, 226Ra, 232Th and 40K measured in Bq/kg, assuming uniform radiation effects [31,32].
Here, ARa, ATh and AK denote activity levels of 226Ra, 232Th and 40K in Bq/kg, respectively.
Annual Effective Dose Equivalent (AEDE)
The UNSCEAR Report 2000 gives an estimate of the yearly effective dose rate in air, incurred by an adult. It assumes a moderate energy gamma-ray conversion coefficient of 0.7 Sv per Gy to translate to absorbed dose in air to an effective dose in humans, and it is calculated using the formula [33].
In this context, D represents the absorbed dose rate in air, quantified in nano Grays per hour (nGy/h). T are 8760 hours in a year, and OF is the occupancy factor, where the outdoor occupancy factor is 0.2 and the effective dose is 0.7 Sv.Gy-1
The global average annual effective dose equivalent (AEDE) attributable to terrestrial gamma radiation, whether outdoors or indoors, is reported as 0.460 mSv/year [34].
2.5.2. Absorbed Gamma Dose Rate (D)
The parameter D quantifies the level of gamma radiation absorbed by a material or tissue. In the context of the study area, potential exposure is expected for mine workers and the residents of Hwange town, which is determined using equation 6 [35]. The formula is expressed as:
Here, AU and ATh, and AK represent the specific activity in Bq/kg of uranium-238, thorium-232 and potassium-40.
2.5.3. Excess Lifetime Cancer Risk (ELCR)
The (ELCR) framework enables systematic evaluation of the probability of long-term radiation hazards to an individual. This is due to prolonged exposure to gamma radiation over their lifetime, assuming a human being survives up to 70 years. The calculation integrates three components as shown in equation 7, and the world average value for cancer risk factors is 0.29 x 10⁻³ [35].
AEDE is the annual Effective Dose Equivalent of the radiation dose (in mSv/year) received annually by an individual. DL (Duration of Life) is a lifetime exposure period, standardised to 70 years for global assessments.
RF (Risk Factor) is the cancer risk factor per unit dose, set as 0.05 per Sievert by the ICRP for stochastic effects.
3. Results
3.1. Activity Concentration
The identified radionuclides 226Ra, 232Th and 40K and their activity concentrations, with weighted mean values, were calculated for each specific mining location. The mining locations were categorised as Hwange Colliery, Zambezi Gas, residential areas and combustion areas (Thermal power plant). The findings are presented in Table 1.1.
3.1.1. NORMs in Coal – Hwange Colliery
Analysis of coal samples from Hwange Colliery revealed activity levels of 226Ra ranging from 10.72 ± 0.73 Bq/kg to 25.5 ± 1.25 Bq/kg, with an average of 15.91± 5.32 Bq/kg. For thorium (232Th) values, ranged from 9.10 ± 1.3 Bq/kg to 23.80 ± 2.3 Bq/kg and had an average of 14.34 ± 5.67 Bq/kg. In addition, the potassium 40K levels ranged from 41.10 ± 3.2 Bq/kg to 66.23 ± 6.40 Bq/kg, with an average of 50.69 ± 8.80 Bq/kg (Table 1.2). The mean concentrations are consistent with global averages of radionuclides in coal, as reported in the [34,36].
Coal samples were collected from open-cast mining operations at Zambezi Gas, located approximately 15 km from Hwange Colliery Company. Table 1.3 summarise the radioactivity from the Zambezi Gas mine. The key findings revealed that 226Ra concentrations ranged from 7.75 ± 1.03 Bq/kg to 13.07 ± 0.82 Bq/kg with a mean of 9.80 ± 2.29 Bq/kg. For 232Th, the activity spanned from 8.30 ± 1.3 Bq/kg to 15.00 ± 1.9 Bq/kg, averaging 11.03 ± 3.27 Bq/kg. 40K ranged from 4.65 ± 3.5 Bq/kg to 58.9 ± 4.3 Bq/kg and an average concentration of 42.56 ± 25.55 Bq/kg. These values characterise the radiological profile of coal extracted from Zambezi Gas, Hwange area in Zimbabwe.
3.1.2. Hwange Colliery and Zambezi Gas Comparing Mean for NORMs
The section below presents the weighted average of the NORMs concentration levels of measured radioactivity from this study, along with comparisons to other studies and world average values. The weighted averages from each section are determined and compared to other similar mining operations and world average values prescribed by the UNSCEAR Organisation [36].
Table 1.4 presents the concentration levels of coal samples from Hwange Colliery and Zambezi Gas, compared with previous studies from other countries and global averages [36,37,38].
For the two coal mines, the computed radioactivity levels of 226Ra were recorded as 15.91± 5.32 Bq/kg and 9.80 ± 2.29 Bq/kg, respectively, while 232Th levels were 11.03± 3.27 Bq/kg and 14.34 ±5.67Bq/kg, respectively, and 40K as 50.69±8.80 Bq/kg and 42.56 ± 25.55 Bq/kg, respectively. These findings align closely with findings from coal mining samples in Nigeria, where mean values were reported as 8.2 Bq/kg for (226Ra), 7.0 Bq/kg (232Th), and 27.4 Bq/kg for (40K) [37]. In contrast, they are significantly lower than measurements from Tanzania [38] as presented in Table 1.4 below.
Moreover, concentrations from both Hwange Colliery and Zambezi Gas are generally consistent with global averages for NORM in coal mining regions, which serve as key benchmarks for 226Ra, approximately 35 Bq/kg, 232Th is 30 Bq/kg and for 40K about 400 Bq/kg [36], suggesting that the levels observed are typically lower than average NORM levels in the studied sites. This indicated that the Hwange coal mining area exhibits relatively low radiological risk compared to global norms, though ongoing monitoring remains critical to ensure compliance with safety standards.
3.1.3. NORMs in Residential Areas
Sampling sites across the Hwange mining town included public places (e.g., Community Hall), areas along rivers and dams and residential suburbs. Measured radioactivity levels of 226Ra, 232Th and 40K in the soils are detailed in Table 1.5.
From Table 1.5 above, key findings include 226Ra, ranging from 15.96 ± 1.8 Bq/kg to 53.45 Bq/kg with a mean value of 36.08 ± 14.59 Bq/kg. 232Th varied between 23.58 ± 0.76 Bq/kg to 55.20 ± 5.3 Bq/kg, averaging 36.26 ± 11.80 Bq/kg. 40K ranged 127.00 ± 7.8 Bq/kg to 342 ± 1.2 Bq/kg, with a mean value of 223 ± 79.45 Bq/kg.
The activity concentration from residential soils is higher than the activity concentration from both Hwange Colliery and Zambezi Gas operations. Elevated levels of radioactivity in the residential soils are most probably coming from the coal burning (fly ash) in the nearby thermal power plant, where deposition is done along the suburbs and rivers in the mining town.

Table 1.6.
Mean levels of concentration activities in residential soil samples in the Hwange mining town in comparison with similar studies.
Table 1.6.
Mean levels of concentration activities in residential soil samples in the Hwange mining town in comparison with similar studies.
| Source (Location) | Activity Concentration (Bq/kg) | |||
|---|---|---|---|---|
| 226Ra | 232Th | 40K | ||
| This study (Residential areas, Hwange Zimbabwe) |
Range | 15.96 – 53.45 | 23.58 - 55.20 | 223.11 – 42.00 |
| Mean | 36.08 ± 14.59 | 36.26 ± 11.80 | 223.11 ± 79.45 | |
| Botswana | Mean | 19 | 14 | 196 |
| Tanzania | Mean | 378 | 331 | 2632 |
| India | Mean | 8.17 | 17.40 | 96.49 |
| Turkey | Mean | 24.63 | 36.25 | 267.92 |
| Brazil | Mean | 133 | 39 | 233 |
| World averages | Mean | 32 | 45 | 420 |
According to Table 1.5, in residential areas near the thermal station in Hwange, soil samples exhibit elevated activity levels of naturally occurring radioactive elements, with proximity to coal combustion facilities correlating to high values. Average activity values recorded were 36.08 ± 14.59 Bq/kg for 226Ra, 36.26 ± 11.80 Bq/kg for 232Th, and 223.11 ± 79.45 Bq/kg for 40K, respectively. These findings surpass the global averages for 226Ra (32 Bq/kg), fall slightly below the 232Th (45 Bq/kg) and are well lower than 40K (420 Bq/kg) reported in worldwide studies [36].
When benchmarked against international mean values, the concentrations observed in this study are comparable to those reported for Botswana and Turkey. [39,40]. By contrast, the values are lower than those documented for coal-related activities in Tanzania and Brazil [38,41]. The elevated radionuclide concentrations detected in residential areas are attributed to contamination arising from coal combustion at the nearby thermal power station. Factors such as the dispersion of fly ash and transport of radionuclides via rivers and air currents likely contribute to these elevated levels in residential areas. This contamination presents a potential radiological health risk to both the environment and the residents of Hwange town. Additionally, the atmospheric spread of radionuclides could extend over significant distances, potentially impacting neighbouring communities and rural villages surrounding the Hwange area.
3.1.4. NORMs in Zimbabwe Power Station
The findings demonstrate that coal combustion processes in the Hwange mining town amplify the release of radionuclides into the environment, elevating ambient radiation levels and increasing exposure risks for local communities. Additionally, presence of NORM radionuclides in coal mineral ore presents a hazard of radon gas inhalation for both workers and residents. Such exposures may exceed the recommended annual limit of 1 m Sv/yr [15,42], raising concerns about long-term health effects, such as increased, including elevated cancer incidence and respiratory ailments. These radiological hazards necessitate pressing for more effective monitoring strategies, mitigation strategies, and community-centred health initiatives to safeguard vulnerable populations in Hwange.
Average radioactivity levels of the NORMs isotopes in coal combustion samples, as presented in Table 1.7, exceed the levels in residential areas and two mining companies. Thus, from this study, radionuclide levels in coal mining areas are less than those from combustion processes, consistent with literature findings. Studies in other countries, including South Africa, Tanzania, Malaysia, and China, have found similar patterns to those observed in the current studies [43,44]. The present study results align closely with data from Botswana and South Africa, demonstrating lower levels compared to Malaysia and Tanzania. The Hwange coal combustion results are less than the world averages.
Table 1.8.
Average concentration levels in coal combustion samples in comparison with similar studies.
Table 1.8.
Average concentration levels in coal combustion samples in comparison with similar studies.
| Source (Location) | Activity Concentration (Bq/kg) | |||
|---|---|---|---|---|
| 226Ra | 232Th | 40K | ||
| This study (Zimbabwe Power Company) | Range | 29.35 - 53.45 | 26.90 - 55.20 | 125 - 342 |
| Mean | 39.17 ± 10.26 | 36.92 ±10.97 | 199.97 ±89.18 | |
| Botswana | Mean | 52.63 | 21.96 | 91.29 |
| Tanzania | Mean | 448 | 455 | 3069 |
| South Africa -Limpopo | Mean | 21.69 | 22.97 | 88.43 |
| South Africa Mpumalanga | Mean | 24.63 | 36.25 | 267.92 |
| Malaysia | Mean | 67.6 | 74.3 | 225.3 |
| China | Mean | 112.2 | 1475 | 385.6 |
| World averages | Mean | 240 | 70 | 265 |
3.1.5. Radiation Hazard Indices
3.1.5.1. Mean Radiation Hazards for Hwange Mining Areas
The measured radiation indices are shown in Table 1.9 below. Radiological hazard indices were calculated to evaluate potential risks to the exposed population. Radium equivalent (Raeq) was determined to 40.32 ± 2.68 Bq/kg for Hwange Colliery and 28.85 ± 6.67 Bq/kg for Zambezi Gas. In residential areas, Raeq values were considerably higher, averaging 105.11 ± 33 Bq/kg, while samples from combustion yielded 107.35 ± 0.13 Bq/kg. Similarly, the external hazard index (Hex) and internal hazard index (Hin) values were less than unity for all locations, indicating that the study area does not pose significant immediate radiological hazards. However, the absorbed dose rate and annual effective dose were higher in residential and combustion areas with values of 48 .73 ± 13.8 nGy/h and 119.52 ±33.9 μSv/year for ZPC and 47.87± 14.92 nGy/h and 117.42±36.59 μSv/year for residential areas.
The ELCR values are notably higher than the global average of 0.29 x 10⁻³ as defined by UNSCEAR. The study findings indicate that there is a slightly higher health risk associated with cancer incidence over a long period for the population.
4. Discussion
4.1. Key Findings
This study provides a comprehensive assessment of natural radionuclide concentrations and associated radiological risks in coal mining, residential and thermal power generation environments in Hwange, Zimbabwe. The findings reveal spatial variability in radionuclide distribution, with implications for both environmental quality and public health.
4.2. Activity Concentrations and Environmental Distribution
The activity concentrations of 226Ra, 232Th and 40K measured in coal samples from Hwange Colliery and Zambezi gas were considerably below global average limited reported by UNSCEAR. This suggests that coal itself is not a significant primary source of radiological contamination. Comparable findings have been reported in studies conducted in Botswana and Nigeria, where coal mining environments exhibited similarly low radionuclide concentrations. In contrast, coal from Tanzania has been reported to contain higher activity levels highlighting regional geological variability.
However, the situation differs in residential areas around Hwange town, where elevated concentration of radionuclides particularly, of 226Ra were observed. These higher levels can be attributed to secondary processes, notably coal combustion. During coal combustion, radionuclides present in coal become concentrated in by products such as fly ash which can disperse and accumulate in surrounding soils. The observed high levels in residential is therefore, likely a long-term deposition of combustion residues around the thermal power plant This pattern is consistent with findings from studies in Brazil, China and Tanzania. Where power plants have been identified as contributors to increased environmental radioactivity.
4.3. Radiological hazard INDICES
The calculated radium equivalent (Raeq) values for all sampling locations were below the global accepted limit of 370 Bq/kg, indicating the combined radiological effect of 226Ra, 232Th and 40K does not pose a significant hazard. Similarly, both internal and external hazard were less than unity across all sites. These indices are widely used indicators of radiation safety, and values below 1 suggest that exposure levels are withing safe limits for human populations. Notably, although residential areas and ZPC recorded higher Raeq and hazard indices compared to the mining sites, these values remained within safe thresholds. This indicates that, despite localised increases in radionuclide concentrations, the overall radiological remains low. Nevertheless, the relatively higher indices in populated and industrial areas warrant attention as they reflect cumulative exposure over a long period.
4.4. Dose Assessment and Exposure Implications
The absorbed gamma dose rates showed clear spatial variation, with significantly higher values recorded in residential areas and at the power plant compared to mining sites. This variation reinforces the influence of anthropogenic activities like coal combustion, on environmental radiation levels. While mining processes involves extraction and handling of raw coal ore with relatively low radionuclide content, combustion processes concentrate these radionuclides increasing their contribution to ambient radiation.
Despite these elevated dose rates, all estimated annual effective dose equivalents (AEDE) remained well below the international Commission on Radiological Protection (ICRP) recommended limit of 1 mSv/year for general public.
4.5. Long Term Health Risk Considerations
Although the measured dose levels are within acceptable safety limits, the estimated excess lifetime cancer risk (ELCR) values exceeded global reference values established by UNSCEAR. This finding is particularly significant, as ELCR reflects defines the cumulative probability of developing cancer over a lifetime due to radiation exposure. Populations living closer to the thermal power plant, therefore, faces a slightly increased risk of radiation – induced health effects, particularly if exposure persists without mitigation.
4.6. Public Health and Environmental Implications
The study indicates that while immediate radiological hazards are minimal, there is need for a continued radiation safety monitoring, environmental management programmes to protect workers and general public. Measures such improved ash handling, dust control and land remediation could help reduce the spread and accumulation of radioactive materials. Furthermore, the findings emphasize the importance of regular environmental monitoring to detect changes in radionuclide concentrations over time. Giving the expanding energy demands and continued reliance on coal in many regions including Zimbabwe, sustained monitoring programs are critical to ensuring that radiation exposure remains within safe limits.
4.7. Study Limits and Future Research
This study provides valuable insights selected sampling locations and radionuclides in Hwange, Zimbabwe. Future studies could expand the spatial coverage and include additional exposure pathways such as ingestion and inhalation, to provide a more comprehensive risk assessment. Radon measurements would also be beneficial for underground workers and residents and develop mitigation measures for public health control.
5. Conclusions
The study significantly advanced the characterisation of concentration levels of NORMs in coal and soil from the Hwange coal mining activities. Through the application of gamma-ray spectrometry a comprehensive new data set on NORMs from the Hwange mining area was generated for use by regulators, mining companies and environment management organisations.In summary, the study demonstrates that coal mining activities in Hwange contribute minimally to environmental radioactivity, while coal combustion at thermal power plant [45] plays a more significant role in elevating radionuclide concentrations in surrounding areas. Although radiological indices and dose assessments indicate low immediate risk and the elevated lifetime cancer risk highlights the need for proactive environmental management and continuous management to safeguard public health.
Author Contributions
Conceptualization: Innocent Mayida; Methodology: Innocent Mayida, Manny Mathuthu, Vera Uushona; Supervision: Manny Mathuthu, Vera Uushona; Investigation: Innocent Mayida, Vera Uushona Data curation: Innocent Mayida Mashingaidze Robin; Formal analysis: Innocent Mayida Mashingaidze Robin; Validation: Mashingaidze Robin; Writing—original draft preparation: Innocent Mayida Writing—review and editing: Innocent Mayida, Manny Mathuthu, Vera Uushona, Mashingaidze Robin. All authors have read and agreed to the published version of the manuscript.
Funding
The equipment used was provided by the Radiation Protection Authority of Zimbabwe Laboratory.
Institutional Review Board Statement
The research was approved by the North West University (NWU), South Africa Faculty of Natural and Agricultural Sciences Ethics Committee (FNASREC and the ethic number NWU-00504-A9 and as a low risk .
Data Availability Statement
The data was shared in the research article.
Acknowledgments
The authors would like to acknowledge Prof. H. P. Drummond (North-West University) for her assistance with the English language editing of this manuscript. The authors also express their gratitude to the Radiation Protection Authority of Zimbabwe for granting access to and use of their laboratory facilities. Appreciation is further extended to the mining companies and the thermal power plant for permitting sample collection for this research.
Conflicts of Interest
The authors declare no conflicts of interest.
Abbreviations
The following abbreviations are used in this manuscript:
| AEDE | Annual Effective Dose Equivalent |
| ELCR | Excess Lifetime Cancer Risk |
| GOZ | Government of Zimbabwe |
| HPGe | High Purity Germanium |
| HMA | Hwange Mining Area |
| IAEA | International Atomic Energy Agency |
| IEA | International Energy Agency |
| mSv | millisievert |
| NORM | Naturally Occurring Radioactive Materials |
| RPAZ | Radiation Protection Authority of Zimbabwe |
| UNSCEAR | United Nations Scientific Committee on the Effects of Atomic Radiation |
| WHO | World Health Organisation |
| ZPC | Zimbabwe Power Company |
References
- Olasehinde, A.; et al. Exploring Africa’s lithium wealth: Geological insights, mineralization processes, and sustainable development prospects. Dutse J. Pure Appl. Sci. 2024, 10(4a), 315–32. [Google Scholar]
- Watson, R. The geology and coal resources of the country around Wankie, Southern Rhodesia1960.
- Gwenzi, W.; et al. Development, properties and potential applications of high-energy fuel briquettes incorporating coal dust, biowastes and post-consumer plastics. SN Appl. Sci. 2020, 2, 1–14. [Google Scholar] [CrossRef]
- IEA. 2024. Available online: https://www.iea.org/countries/zimbabwe/coal.
- GOZ. 2023. Available online: https://www.mines.gov.zw/index.php/en/our-departments/geological-survey.
- Mapani, B. Notes on Heavy metals in soils and waters: their effects on health. In Supplement to Economic Geology Course Notes on Ore Deposits, University of Zimbabwe; Geology dept Publication, 2001. [Google Scholar]
- Caridi, F.; et al. Evaluation of radiological impacts from NORM: a case study. J. Instrum. 2018, 13[08], P08003–P. [Google Scholar] [CrossRef]
- IAEA. Extent of environmental contamination by naturally occurring radioactive material (NORM) and technological options for mitigation: International Atomic Energy Agency; 2004. [Google Scholar]
- Maponga, O.J. A geometallugical characterisation of the Hwange coalfield: how does coal formation affect coal exploitation? 2021. [Google Scholar] [PubMed]
- Denson, N.M. Uranium in coal in the western United States; US Government Printing Office, 1959. [Google Scholar]
- Agboola, O.; et al. A review on the impact of mining operation: Monitoring, assessment and management. Results Eng. 2020, 8, 100181. [Google Scholar] [CrossRef]
- ARPANSA. Management naturally occurring radioactive material (NORM) associated with mining; Australian Radiation Protection and Nuclear Safety Agency, 2008. [Google Scholar]
- ICRP. Lung cancer risk from radon and progeny and statement on radon. Ann. ICRP 2010, 40[1], 1–64. [Google Scholar] [CrossRef] [PubMed]
- Laurier, D.; et al. Miner studies and radiological protection against radon. Ann. ICRP 2020, 49((1_) suppl, 57–67. [Google Scholar] [CrossRef] [PubMed]
- Long, S.; et al. A survey of naturally occurring radioactive material associated with mining; Australian Radiation Protection and Nuclear Safety Agency, 2012. [Google Scholar]
- IAEA. Protection of Workers Against Exposure Due to Radon; INTERNATIONAL ATOMIC ENERGY AGENCY: Vienna, 2024. [Google Scholar]
- WHO. WHO handbook on indoor radon: a public health perspective; World Health Organization, 2009. [Google Scholar]
- Lightfoot, B. The geology of the north-western part of the Wankie coalfield; Argus Print. & Publishing Company, 1914. [Google Scholar]
- Drysdall, A.; Weller, R. Karoo sedimentation in northern Rhodesia. South Afr. J. Geol. 1966, 69[01], 39–69. [Google Scholar]
- Tavener-Smith, R. Karroo sedimentation in a part of the mid-Zambezi Valley. South Afr. J. Geol. 1962, 65[1], 43–74. [Google Scholar]
- Buhmann, D.; Leppe, J. Significant mineral variations in the Lower Karoo deposits of the Mid-Zambezi Basin, Zimbabwe, and their palaeoenvironmental implications. South Afr. J. Geol. 1990, 93[5], 744–53. [Google Scholar]
- Wei, Q.; et al. Uranium speciation in the Lincang Ge-rich coal deposit, Yunnan Province, China: Theoretical implication for uranyl fixation and U mineralization. Ore Geol. Rev. 2024, 106171. [Google Scholar] [CrossRef]
- Nxumalo, V.; et al. Micro-PIXE characterisation of uranium occurrence in the coal zones and the mudstones of the Springbok Flats Basin, South Africa. Nuclear Instruments and Methods in Physics Research Section B: Beam Interactions with Materials and Atoms 2017, 404, 114–20. [Google Scholar] [CrossRef]
- GOZ. Zimstart Population Report 2022. 2022. [Google Scholar] [CrossRef] [PubMed]
- Oesterlen, P.; Lepper, J. The Lower Karoo coal (k2–3) of the Mid-Zambezi basin, Zimbabwe: depositional analysis, coal genesis and palaeogeographic implications. Int. J. Coal Geol. 2005, 61(1-2), 97–118. [Google Scholar] [CrossRef]
- Centre for Advanced Spatial Analysis UCL. Epicollect5: mobile data gathering platform 2023. Available online: https://five.epicollect.net/.
- Amin, Y.M.; et al. Radionuclide emissions from a coal-fired power plant. Appl. Radiat. Isot. 2013, 80, 109–16. [Google Scholar] [CrossRef] [PubMed]
- IAEA. IAEA TECDOC 1401 [2004] Quantifying uncertainty in nuclear analytical measurements. IAEA, Vienna, 2004. [Google Scholar]
- Glavič-Cindro, D.; et al. Measurement uncertainty arising from sampling of environmental samples. Appl. Radiat. Isot. 2020, 156, 108978. [Google Scholar] [CrossRef] [PubMed]
- Knoll, G.F. Radiation detection and measurement, 4th ed.; John Wiley: Hoboken, N.J., 2010. [Google Scholar]
- UNSCEAR. Sources and effects of ionizing radiation; United Nations, 2000. [Google Scholar]
- Beretka, J.; Mathew, P.J. Natural Radioactivity of Australian Building Materials, Industrial Wastes and By-products. Health Phys. 1985, 48[1]. [Google Scholar] [PubMed]
- UNSCEAR. Report No.: 9210600029; Sources, effects and risks of ionizing radiation, united nations scientific committee on the effects of atomic radiation (UNSCEAR) 2016 report: report to the general assembly, with scientific annexes. United Nations, 2017.
- ICRP. ICRP Publication 147: Use of Dose Quantities in Radiological Protection. Ann. ICRP 2021, 50[1], 9–82. [Google Scholar] [CrossRef] [PubMed]
- UNSCEAR. UNSCEAR 2000 Report Vol I; United Nations Scientific Committee on the Effects of Atomic Radiation, 2000. [Google Scholar]
- UNSCEAR. Sources, Effects and Risks of Ionizing Radiation: UNSCEAR 2019 Report. In Report to the General Assembly, with Scientific Annexes A and B; United Nations: New York, 2019. [Google Scholar]
- Tikpangi, K.M. Radiological, Trace Elemental and Petrographic Characterzation of Maiganga Coal deposit of Northern Benue Trough; University of Malaya Kuala Lumpur Malaysia: Northy Eastern Nigeria, 2016. [Google Scholar]
- Makundi, I.; et al. Assessment of radioactivity levels in coal and coal ash in Kiwira coal mine using gamma-ray spectrometry. Tanzan. J. Sci. 2018, 44[3], 1–11. [Google Scholar]
- Celik, I.C.; Kosal, M. Assessment of environmental radioactivity and health hazard in soil, water, and stone samples in Siverek Town of Sanliurfa Province in Southeastern Turkey. Procedia Comput. Sci. 2019, 158, 125–34. [Google Scholar] [CrossRef]
- Mudiwa, J. Radioecological modelling of naturally occuring radiation at the Morupule-B Coal Thermal Power Station; Mafikeng South Africa North-West University (South Africa), 2020. [Google Scholar]
- Flues, M.; et al. Radioactivity of coal and ashes from Figueira coal power plant in Brazil. J. Radioanal. Nucl. Chem. 2006, 270[3], 597–602. [Google Scholar] [CrossRef]
- Akkurt, I.; et al. Natural radioactivity of coals and its risk assessment. Int. J. Phys. Sci. 2009, 4[7], 403–6. [Google Scholar]
- Ahmed, U.A.Q.; et al. Quantification of U, Th and specific radionuclides in coal from selected coal fired power plants in South Africa. PLoS ONE 2020, 15[5], e0229452. [Google Scholar] [PubMed]
- Lu, X.; et al. Radiological hazards of coal and ash samples collected from Xi’an coal-fired power plants of China. Environ. Earth Sci. 2012, 66[7], 1925–32. [Google Scholar]
- ZPC. Zimbabwe Power Company Annual Reports. 2024. Available online: https://www.zpc.co.zw/about-us/annual-reports.
Table 1.1.
Geographical distribution of sampling sites from the Hwange mining area.
| Location | Sample Number |
Laboratory reference | Surface Dose rate (μSv) | Description |
|---|---|---|---|---|
| Hwange Colliery | S1-1 | RS2304001 | 0.12 | Coal mining |
| Sl-2 | RS2304002 | 0.12 | ||
| Sl-3 | RS2304003 | 0.13 | ||
| S1-4 | RS2304004 | 0.12 | ||
| Sl -5 | RS2304005 | 0.21 | ||
| Sl -6 | RS2304006 | 0.21 | ||
| Residential area |
S3-1 | RS2304010 | 0.21 | Suburbs |
| S3-2 | RS2304011 | 0.20 | Area 3 river | |
| S3-3 | RS2304012 | 0.21 | Community Hall | |
| S3-4 | RS2304013 | 0.15 | water point | |
| S3-5 | RS230401014 | 0.15 | Bus station | |
| Zambezi Gas | S6-1 | RS2304015 | 0.19 | Coal mining |
| S6-2 | RS2304016 | 0.21 | ||
| S6-3 | RS2304017 | 0.21 | ||
| S6-4 | RS2304018 | 0.21 | ||
| Zimbabwe power company | ||||
| M-01 | RS2308001 | 0.33 | Fly ash | |
| M-02 | RS2308002 | 0.25 | ||
| M-03 | RS2308003 | 0.35 | ||
| M-04 | RS2308004 | 0.44 | ||
| M-05 | RS2308005 | 0.34 |
Table 1.2.
Radioactivity levels of coal samples from Hwange Colliery.
| Location | Sample Number | Activity Concentration (Bq/kg) | ||
|---|---|---|---|---|
| 226Ra | 232Th | 40K | ||
| Hwange Colliery | value ± unc | value ± unc | value ± unc | |
| Sl-1 | 11.17 ± 0.7 | 10.40 ± 1.50 | 44.20 ± 3.20 | |
| Sl-2 | 10.72 ±0.73 | 9.10 ± | 48.1± 3.40 | |
| S1-3 | 14.36 ± 0.64 | 17.21 ± 0.83 | 66.23 ± 6.40 | |
| Sl-4 | 17.97 ±0.74 | 10.02 ± 0.74 | 51.92 ± 5.83 | |
| Sl-5 | 25.15 ± 1.25 | 23.80 ± 2.30 | 41.10 ± 3.2 | |
| S6-1 | 16.10 ± 0.79 | 15.50 ± 1.50 | 52.60 ± 3.1 | |
| Max | 25.15 | 23.80 | 66.23 | |
| Min | 10.72 | 9.10 | 41.10 | |
| Mean | 15.91 | 14.34 | 50.69 | |
| SD | 5.32 | 5.67 | 8.80 | |
| Mean and SD | 15.91± 5.32 | 14.34± 5.67 | 50.69± 8.80 | |
Table 1.3.
Radioactivity levels of coal samples from Zambezi Gas.
| Location | Sample Number | Activity Concentration (Bq/kg) | ||
|---|---|---|---|---|
| 226Ra | 232Th | 40K | ||
| Zambezi Gas | value ± unc | value ± unc | value ± unc | |
| S6-1 | 9.46 ± 0.64 | 8.30 ± 1.3 | 50.10 ± 3.8 | |
| S6-2 | 13.07 ± 0.82 | 12.40 ± 1.7 | 58.90±4.3 | |
| S6-3 | 8.94 ± 0.56 | 8.40 ± 1.3 | 4.65±3.5 | |
| S6-4 | 7.75 ± 1.03 | 15.00 ± 1.9 | 56.60 ± 4.10 | |
| Max | 13.07 | 15.00 | 58.90 | |
| Min | 7.75 | 8.30 | 4.65 | |
| Mean | 9.80 | 11.03 | 42.56 | |
| SD | 2.29 | 3.27 | 25.55 | |
|
Mean+SD |
9.80± 2.29 | 11.03± 3.27 | 42.56± 25.55 | |
Table 1.4.
Average radioactivity levels of coal samples from the Hwange mining region compared to Global averages.
Table 1.4.
Average radioactivity levels of coal samples from the Hwange mining region compared to Global averages.
| Source (Location) | Activity Concentration (Bq/kg) | |||
|---|---|---|---|---|
| 226Ra | 232Th | 40K | ||
| This study (Hwange Colliery, Zimbabwe) |
Range | 10.72 - 25.15 | 9.10 – 23.80 | 41.10 - 66.23 |
| Mean | 15.91 ± 5.32 | 14.34 ± 5.67 | 50.69 ± 8.80 | |
| This study (Zambezi Gas Zimbabwe) |
Range | 7.75 - 13.07 | 8.3 - 15 | 4.65 - 58.90 |
| Mean | 9.80 ± 2.29 | 11.03 ± 3.27 | 42.56 ± 25.55 | |
| Nigeria | Range | 3.7 – 16.3 | 2.0 - 11.3 | 6.7 - 44.1 |
| Mean | 8.2 | 7.0 | 27.4 | |
| Tanzania | Range | 37.7 - 44.4 | ||
| Mean | 41.3 | 37 | 293 | |
| India | Range | - | - | - |
| Mean | 24 | 39 | 83 | |
| World averages | Mean | 35 | 30 | 400 |
Table 1.5.
Radioactivity levels of soil samples in residential areas.
| Location | Sample Number | Activity Concentration (Bq/kg) | ||
|---|---|---|---|---|
| 226Ra | 232Th | 40K | ||
| Residential areas | value ± unc | value ± unc | value ± unc | |
| S3-1 | 29.35 ± 0.88 | 37.00 ± 095 | 220.94 ± 9.7 | |
| S3-2 | 53.45 ± 2.9 | 55.20 ± 5.3 | 342.00 ± 20.0 | |
| S3-3 | 46.05 ± 1.8 | 30.30 ± 2.8 | 184.00 ±9.0 | |
| S3-4 | 35.60 ± 2.9 | 35.20 ± 3.3 | 127.00 ±7.80 | |
| S4-1 | 15.96 ± 1.8 | 23.58 ± 0.76 | 241.60 ± 10.69 | |
| Max | 53.45 | 55.20 | 342.00 | |
| Min | 15.96 | 23.58 | 127.00 | |
| Mean | 36.08 | 36.26 | 223.11 | |
| SD | 14.59 | 11.80 | 79.45 | |
|
Mean+SD |
36.08 ±14.59 | 36.26 ±11.80 | 223.11 ±79.45 | |
Table 1.7.
Radioactivity levels of fly ash at thermal power plant.
| Location | Sample Number | Activity Concentration (Bq/kg) | |||
|---|---|---|---|---|---|
| 226Ra | 232Th | 40K | |||
| Zimbabwe Power Company | value ± unc | value ± unc | value ± unc | ||
| M-01 | 31.40 ± 1.78 | 26.90 ± 3.7 | 125.00 ± 1.2 | ||
| M-02 | 29.35 ± 1.17 | 37.00 ± 3.0 | 220.94 ± 1.4 | ||
| M-03 | 53.45 ± 5.14 | 55.20 ± 7.5 | 342.00 ± 4.3 | ||
| M-04 | 46.05 ± 2.48 | 30.30 ± 5.6 | 184.00 ± 1.3 | ||
| M-05 | 35.60 ± 2.08 | 35.20 ± 3.30 | 127.00 ± 3.3 | ||
| Max | 53.45 | 55.20 | 342.00 | ||
| Min | 29.35 | 26.90 | 125.00 | ||
| Mean | 39.17 | 36.92 | 199.79 | ||
| SD | 10.26 | 10.97 | 89.18 | ||
| Mean+ SD | 39.17± 10.26 | 36.92± 10.97 | 199.79± 89.18 | ||
Table 1.9.
Mean values of the radiological risk by location.
| Sample Collection Area | Raeq Bq.kg-1 |
Hex | Hin | D (nGy/h | AEDE (μSv/y) | ELCR |
|---|---|---|---|---|---|---|
| Hwange Colliery | 40.32 ± 2.68 | 0.11± 0.04 | 0.09± 0.032 | 18.13± 5.54 | 44.46 ± 13.59 | 1.36 E-01 ± 0.042 |
| Zambezi Gas | 28.85± 6.67 | 0.08± 0.018 | 0.06± 0.001 | 12.96 ± 3.07 | 31.79± 7.56 | 9.72E-02± 0.023 |
| ZPC | 107.35 ± 0.13 | 0.29 ± 0.083 | 0.23 ±0 .06 | 48.73 ±13.8 | 119.52±33.9 | 3.65E-01±0.01 |
| Residential Area | 105.11± 33 | 0.28 ± 0.09 | 0.21±0.08 | 47.87± 14.92 | 117.42± 36.59 | 3.59E-01±0.0012 |
Disclaimer/Publisher’s Note: The statements, opinions and data contained in all publications are solely those of the individual author(s) and contributor(s) and not of MDPI and/or the editor(s). MDPI and/or the editor(s) disclaim responsibility for any injury to people or property resulting from any ideas, methods, instructions or products referred to in the content. |
© 2026 by the authors. Licensee MDPI, Basel, Switzerland. This article is an open access article distributed under the terms and conditions of the Creative Commons Attribution (CC BY) license (http://creativecommons.org/licenses/by/4.0/).
Copyright: This open access article is published under a Creative Commons CC BY 4.0 license, which permit the free download, distribution, and reuse, provided that the author and preprint are cited in any reuse.