

Submitted:
03 July 2026
Posted:
07 July 2026
You are already at the latest version
Abstract
Quartz purity is essential for reliable optically stimulated luminescence (OSL) dating, yet the mineralogical evolution of sediment samples during extraction is rarely documented at each preparation stage. This study uses scanning electron microscopy coupled with energy-dispersive X-ray spectroscopy (SEM-EDS) to characterize two loess samples from the Urluia section, Dobrogea, Romania, across sixteen successive stages of a standard OSL quartz extraction protocol. Four compositional indices - the Quartz Purity Index (QPI), Feldspar Contamination Index (FCI), Heavy Mineral Index (HMI), and Carbonate Index (CI) - are introduced to quantify purification efficiency. Each preparation stage contributed differently: HCl treatment primarily removed carbonates, grain-size separation and density fractionation reduced heavy minerals by ~99%, and feldspar removal resulted from the combined effects of density separation and HF etching. Despite identical protocols, two samples collected from stratigraphically adjacent positions showed markedly different HF etching efficiencies, reaching ~94% and ~66% quartz purity, respectively. However, luminescence measurements showed similarly weak feldspar signals in both samples, with intensities substantially lower than the quartz OSL signal. These results demonstrate that purification efficiency cannot be assumed to be uniform across samples and highlight SEM-EDS as a practical quality-control tool for OSL sample preparation.
Keywords:
quartz extraction
; optically stimulated luminescence dating
; scanning electron microscopy
; energy dispersive spectroscopy
; sample preparation
1. Introduction
Optically Stimulated Luminescence (OSL) dating is one of the main methods used to determine the depositional age of Quaternary sediments, providing a powerful tool for investigating Earth surface processes recorded during this period. A major application of OSL dating is the reconstruction of past climates, particularly through loess–paleosol alternations that reflect glacial and interglacial cycles [1,2,3,4,5,6,7]. OSL dating is also widely used in fluvial settings to study how rivers respond to changes in glaciation, sea level, and climate ([8] and references therein). In addition, the method provides valuable chronological information for cryospheric processes recorded in glacial sediments and landforms ([9] and references therein), as well as extreme events preserved in earthquake- [10,11], flood- [12,13,14,15], or tsunami-related deposits [16,17,18,19].
Beyond its geological applications, OSL dating plays an important role in archaeology [20,21,22]. By dating sedimentary deposits associated with archaeological artifacts, the OSL method contributes to the reconstruction of spatial and temporal patterns of Homo sapiens dispersal and settlement, providing valuable chronological constraints for anthropological studies of human adaptation during the Quaternary [23,24,25,26]. Quartz is the most commonly used mineral for OSL dating due to its widespread occurrence in sedimentary environments, resistance to weathering, and the absence of anomalous fading effects that affect feldspars. For OSL dating, various grain-size fractions can be employed. Fine-grained material (e.g. 4–11 µm) consists of particles for which uniform alpha irradiation can be assumed, whereas coarse-grained fractions (e.g. > 63 µm) require the removal of the outer alpha-irradiated layer during sample preparation to ensure accurate dose-rate evaluation. For coarse grains, this requirement is typically addressed through hydrofluoric acid (HF) etching.
The coarser fractions are separated from the medium and fine fractions by wet sieving through the 63 µm mesh.
The fine fraction (<11 µm) is separated by settling in a liquid column according to Stokes’ law and subsequently centrifuged in distilled water to remove particles smaller than 4 µm [27,28]. The resulting polymineral fine fraction (4–11 µm) is then treated with H₂SiF₆ (35%) for approximately 14 days to enrich the extract [29,30].
On the coarse polymineral fraction (63–90 µm), a density separation is typically performed by centrifugation in heavy liquid solutions (Na₆O₃₉W₁₂·H₂O) with densities of 2.62 and 2.75 g/cm³. The quartz-rich extract, with density between 2.62 and 2.75 g/cm³, is subsequently treated with concentrated HF (40%) to remove the outer alpha-irradiated portion of the grains and any remaining feldspars. This step is followed by a bath in 10% HCl to dissolve insoluble fluoride precipitates that may form during HF treatment.
Nevertheless, experimental studies have demonstrated that HF etching does not necessarily result in uniform or predictable material removal. Etching efficiency is controlled by both intrinsic sample characteristics and experimental conditions. In quartz, dissolution preferentially occurs along crystallographic defects such as dislocations [31] and is also influenced by crystallographic orientation, with enhanced etching parallel to the c-axis and greater resistance of prismatic crystal faces to HF attack [32]. The maturity of clastic sedimentary grains further influences the extent of mineral solubility in HF [33]. Process-related factors, including HF concentration, etching duration, agitation, and solution–surface interaction processes, also contribute to substantial variability in reported etching depths [34,35,36] . Furthermore, mineralogical immaturity may influence not only the extent of material removal during HF etching, but also the purity of the resulting quartz fraction. Feldspar contamination has been shown to persist after conventional heavy-liquid separation, particularly in sediments containing quartz–feldspar intergrowths, potentially introducing unrecognized luminescence contributions [37].
Although these preparation procedures are widely applied and form the backbone of OSL dating protocols, their efficiency is commonly inferred indirectly, for example through luminescence signal behaviour, IR depletion ratio [38], or bulk geochemical indicators. While such luminescence-based tests provide essential quality control, they are inherently insensitive to grain-scale mineralogical impurities, surface alteration features, and preparation-induced microstructural damage that may not manifest clearly in luminescence characteristics alone. This limitation has been explicitly acknowledged in recent state-of-the-art reviews of quartz OSL methodology, which emphasize that luminescence diagnostics alone cannot fully validate mineral purity or preparation efficiency at the grain scale [39]. As a result, assumptions regarding the complete removal of feldspar contamination or the effective and uniform elimination of the alpha-irradiated layer are often adopted without direct verification for decades in the luminescence community. Recent methodological studies have therefore highlighted the need for independent, mineral-specific validation of preparation protocols [33,35,37].
In this context, Scanning Electron Microscopy coupled with Energy-Dispersive X-ray Spectroscopy (SEM-EDS) represents an essential analytical tool for directly evaluating the effectiveness and limitations of individual sample preparation steps. By combining high-resolution imaging with in situ elemental analysis, SEM–EDS enables the unambiguous identification of residual feldspar grains, quartz–feldspar intergrowths, surface alteration features associated with HF etching, grain breakage, and chemical residues produced during successive physical and chemical treatments [33,37]. Crucially, SEM–EDS provides direct, grain-scale evidence that complements luminescence-based tests and allows preparation-induced effects to be disentangled from intrinsic luminescence behaviour. Despite substantial advances in SEM instrumentation, detector sensitivity, and spatial resolution over the past decade, this approach has not yet been systematically applied to assess standard quartz extraction protocols at the highest analytical level currently achievable.
The present study therefore aims to critically assess the efficiency of each individual step in conventional OSL sample preparation protocols by performing SEM–EDS analyses on material obtained after successive processing stages. By providing direct mineralogical, chemical, and microstructural evidence, this work addresses key methodological uncertainties identified in recent studies and contributes to a more robust evaluation of quartz purification procedures used in OSL dating.
2. Materials and Methods
2.1. Sample Description
Two loess samples are investigated in this study, coded URA 5.1 and URA 5.2 were collected from the Urluia Quarry loess-palaeosol section (Figure S1) located on the Dobrogea plateau in southeastern Romania, approximately 15 km south of the Danube River. The Urluia section, exposed along the eastern quarry wall, comprises a well-preserved succession of loess and paleosol units embedding a prominent Campanian Ignimbrite CI/Y5 tephra layer, a key regional chronostratigraphic marker [40,41]. The proximal deposits of the Campanian Ignimbrite eruption yield 40Ar/39Ar age of 39.9 ± 0.1 ka [42]. Sample URA 5.1 was collected from sediments above the Campanian Ignimbrite tephra layer, whereas sample URA 5.2 was collected from sediments below the tephra horizon (Figure S1).
2.2. Sample Preparation
Quartz extraction followed the standard preparation procedures applied for OSL dating [27,28,30]. The protocol included a three days treatment with 10% HCl to dissolve carbonate minerals, followed by a three days treatment with 30% H₂O₂ to remove organic matter. Wet sieving was subsequently performed to isolate the target 63–90 µm coarse fraction and the <63 µm fine fraction.
For the coarse fraction, density separation was carried out by centrifugation at 3000 rpm for 30 min using sodium metatungstate solutions Na6[H2W12O40]/H2O [43,44] at densities of 2.62 and 2.75 g/cm³. This procedure partitioned the material into light (ρ < 2.62 g/cm³), intermediate (ρ = 2.62–2.75 g/cm³), and heavy (ρ > 2.75 g/cm³) mineral separates. Quartz was expected to be concentrated within the intermediate density fraction, whereas heavy minerals, such as Fe-Ti oxides and ferromagnesian silicates, were preferentially partitioned into the heavy fraction. Feldspar-rich material was primarily concentrated within the lower-density fraction (2.52–2.58 g cm⁻³) [28]. The quartz-rich 2.62–2.75 g cm⁻³ fraction was subsequently etched with 40% HF for 40 min to remove the outer alpha-irradiated layer of quartz grains and dissolve residual feldspar, followed by a 10% HCl rinse for 1 h to remove fluoride precipitates formed during etching [33,35]. Finally, dry sieving was performed to remove particles smaller than 63 µm generated during HF treatment.
From the <63 µm fraction, the <11 µm separate was isolated by differential settling in a liquid column according to Stokes' law. The resulting polymineral fine fraction was treated with 35% H₂SiF₆ for 12 days to selectively dissolve feldspar and other aluminosilicate phases while leaving quartz largely unaffected. Centrifugation in distilled water at 1000 rpm for 1 min was subsequently performed to remove particles smaller than 4 µm [27].
To directly evaluate the effectiveness of individual preparation stages, a small amount of material was retained after each major processing step for subsequent SEM–EDS analysis (Table 1). The investigated subsamples corresponded to the untreated sediment, post-HCl treatment, post-H₂O₂ treatment, polymineral grain-size fractions (<63 μm, 63–90 μm, 11–63 μm and <11 μm), density fractions obtained through heavy-liquid separation (ρ < 2.62 g cm-3, ρ > 2.62 g cm-3, ρ < 2.75 g cm-3 and ρ > 2.75 g cm-3), as well as the final 63-90 μm quartz fraction obtained after HF etching and sieving and an 4-11 μm quartz fraction after H₂SiF₆ treatment and centrifugation. This approach allowed the mineralogical evolution of the material to be monitored throughout the complete quartz enrichment steps.
For microscopic and elemental analyses, the retained material from each preparation stage was mounted on 12.5 mm aluminium stubs using conductive silver paste. The grains were distributed as uniformly as possible across the stub surface to maximise the number of individual grains available for microscopic observation and elemental analysis, while minimising the exposure of the silver paste substrate between grains. The silver paste was applied using a fine brush, and excess material was removed prior to sample mounting to obtain a thin conductive layer. This procedure reduced the partial embedding of grains within the mounting medium, improved grain exposure, and minimised potential interference during elemental analysis. Silver paste was selected as the mounting medium in preference to the more commonly used carbon adhesive tape, in order to avoid introducing an extraneous carbon signal into the EDS measurements. However, as discussed in Section 2.3, the silver paste substrate introduced its own analytical complications which affected the quantification of certain elements in stages with low grain yield.
For luminescence measurements, the fine quartz fraction (4-11 μm) was mounted on aluminium discs, whereas the coarse quartz fraction (63–90 µm) was mounted on stainless-steel discs.
2.3. Scanning Electron Microscopy Coupled with Energy-Dispersive X-Ray Spectroscopy (SEM-EDS)
Samples were analysed using a ZEISS GeminiSEM 360 Field Emission Scanning Electron Microscope, equipped with an Integrated Pegasus EDS/EBSD system (Octane Elect Plus, Velocity Plus, PV 5600-EL-PL-Vel-PL) X-ray energy dispersive spectrometer (EDS). The Silicon Drift Detector (SDD) features a silicon nitride (Si₃N₄) window with an active area of 30 mm2 and an energy resolution of 127 eV at Mn Kα at 10k cps providing en-hanced sensitivity for light element detection. Elemental quantification was performed using the eZAF matrix correction routine implemented in EDAX APEX software. All sta-tistical analyses, data processing, and figure preparation were conducted using OriginPro 2025b and Python 3.13 (64-bit).
Scanning Electron Microscopy (SEM) was employed to investigate grain morphology, surface textures, and preparation-induced microstructural features throughout the quartz extraction procedure. Secondary electron (SE) images were acquired using an Everhart-Thornley detector, which provides detailed topographic information at high spatial resolution.
SEM imaging was performed under low accelerating voltages ranging between 2 and 4 kV, with a beam current of approximately 1.3 nA (measured in Faraday cup) and a working distance varying between 8.5 and 10 mm. Images were collected at a resolution of 1024 × 768 pixels. These operating conditions were selected to maximise surface detail while minimising charging effects and beam-induced artefacts on the analysed grains.
Elemental characterization was performed using Energy-Dispersive X-ray Spectroscopy (EDS) mapping. Elemental maps were acquired at and EHT of 15 kV, a beam current of 1.3 nA, a resolution of 512 × 400 pixels using a dwell time of 100 μs per pixel, a working distance of 8.5 mm, 16 frames and at the same magnification (70 X). For each preparation stage, five independent areas were analysed under identical operating conditions to ensure the reproducibility of the measurements and to capture the compositional variability of the material.
Elemental abundances were quantified and expressed as both atomic percentages (at%) and weight percentages (wt%). Atomic percentages provide information regarding the relative abundance of atoms within the analysed material, whereas weight percentages better reflect the mass contribution of individual elements and mineral phases. Because the primary objective of this study was to evaluate the efficiency of quartz purification and the progressive removal of contaminant mineral phases throughout the OSL preparation procedure, the discussion focuses primarily on wt% values. However, complete datasets including both wt% and at% results are provided in the Supplementary Material.
All elements reported were automatically identified by the EDS acquisition software during spectral analysis. For elements present at very low concentrations, below minimum detection limit (MDL), such as Ca, Na, Ti, and Fe, manual addition to the elemental list was required in selected analytical areas where automatic peak deconvolution failed to identify them due to their low signal intensity. This approach ensured that trace elemental contributions from individual grains were not overlooked, providing a more complete characterisation of the mineralogical assemblage at each preparation stage.
To evaluate potential contributions from the mounting substrate to the EDS signal, five analytical areas of unloaded silver paste were measured under identical conditions to those applied to the samples.
2.4. Quartz OSL Dating and Assessment of Feldspar Contribution
Luminescence measurements were carried out using a Risø TL/OSL DA-20 reader equipped with automated stimulation and detection unit [45]. Continuous-wave optical stimulation was provided by blue (470 nm, ~80 mW cm-2) and infrared (850 nm, ~300 mW cm-2) LEDs, while the resulting signals were detected using PDM 9107Q-AP-TTL-03 photomultiplier tubes (160–630 nm) [11] fitted with 7.5 mm Hoya U-340 filters centred at 340 nm. Laboratory irradiations were delivered using the built-in 90Sr/90Y beta source, calibrated using gamma-irradiated calibration quartz [46]. At the time of measurement, the beta dose rates were 0.0760 Gy s⁻¹ and 0.0864 Gy s-1 for the fine- and coarse-grained fractions, respectively.
Equivalent doses (De) were determined using the single-aliquot regenerative-dose (SAR) protocol for quartz [47,48]. OSL signals were measured during 40 s of blue-light stimulation at 125 °C, and sensitivity changes were corrected using a 17 Gy test dose. The net OSL signal was calculated from the first 0.308 s of the decay curve after subtraction of an early background integrated between 1.538 and 2.307 s [49]. Prior to stimulation, a preheat of 220 °C for 10 s and a cutheat of 180 °C were applied. A high-temperature bleach (blue-light stimulation at 280 °C for 40 s) was performed at the end of each SAR cycle to minimise charge transfer from light-insensitive traps to the main OSL trap during repeated irradiation and heating cycles. The reliability of the SAR protocol was monitored using the recycling and recuperation tests incorporated into each measurement sequence [48]. Potential feldspar contamination was assessed using an infrared depletion test [38], implemented by introducing an IR stimulation step immediately prior to blue light stimulation during the final two SAR cycles (32 and 128 Gy). The first test was performed by repeating the regenerative dose (32 Gy) applied in the second SAR cycle, following the standard SAR procedure. For the second test, a regenerative dose of 128 Gy was selected because it is close to the equivalent doses obtained for the investigated samples. Consequently, the IRSL and OSL responses could be compared under dose conditions representative of the natural luminescence signal. Aliquots were accepted when recycling and IR depletion ratios were within 10% of unity and recuperation remained below 2% of the natural sensitivity-corrected OSL signal.
Environmental dose rates required for age calculation were determined from radionuclide concentrations measured by high-resolution gamma spectrometry. Prior to measurement, samples were sealed and stored for one month to establish secular equilibrium between 226Ra and 222Rn. Activities of 232Th, 226Ra, and 40K were subsequently measured using a well-type HPGe detector. Conversion of radionuclide concentrations to dose rates was performed using the factors reported by [50]. For the fine-grained quartz fraction (4–11 μm), an alpha efficiency value of 0.04 ± 0.02 was adopted [51]. For the coarse-grained quartz fraction (63–90 μm), a beta attenuation and etching correction factor of 0.94 ± 0.05 was applied [52]. The cosmic-ray contribution was calculated following [53]. A long-term water content of 10 ± 2.5% was assumed for both samples based on previously published estimates from sedimentary units overlying and underlying the CI/Y5 tephra horizon [52]. An internal dose rate of 0.01 ± 0.002 Gy ka⁻¹ was assumed for the coarse quartz fraction [54].
3. Results and Discussion
3.1. Evolution of Mineralogical Composition During Quartz Extraction Protocol
To evaluate the mineralogical and geochemical evolution of the samples during quartz extraction, the elemental composition of each preparation stage was quantified by SEM–EDS, while representative SEM micrographs were used to document changes in grain morphology and particle assemblages.
Table 1 and Table 2 summarize the average elemental composition (wt%, mean ± standard error of the mean) of samples URA 5.1 and URA 5.2 throughout the successive stages of the OSL preparation workflow.
The blank spectra revealed C, Cl, and Ag as the dominant substrate signals, with a notable spectral overlap between the Ag L emission lines in the energy range of 2.98-3.15 keV, in close proximity to the K Kα peak at 3.31 keV (Figure S2). Given the energy resolution of the EDS detector (~130 eV), partial overlap between these emission lines cannot be excluded, as confirmed by the non-zero K signal detected in the unloaded silver paste blank (Table S1). This overlap can artificially inflate K concentrations in areas where the silver paste is visible between grains, particularly in preparation stages where few grains remained after extensive chemical treatment. To address this, a stoichiometric upper bound was applied to K concentrations across all preparation steps. In naturally occurring aluminosilicate minerals, K+ always requires a coupled Al3+ substitution to maintain charge balance, meaning K cannot exceed Al on a molar basis. In weight percentage terms this corresponds to a maximum K/Al ratio of 1.45, which is the value for pure K-feldspar KAlSi3O8 [55]. Any K/Al ratio exceeding this value is physically impossible in a natural mineral and must therefore reflect substrate exposure rather than a genuine mineralogical signal. A corrected potassium value (Kcorr) was thus calculated as:
The values reported in the Table 1 and Table 2 for K are the ones corrected using the formula (1) (Kcorr), calculated individually for each analytical area prior to averaging. The uncorrected values for K (noted as Kraw) are presented in the Supplementary material (Table S2-S5).
Both samples display comparable elemental compositions prior to any treatment, with relatively low Si concentrations (20.58 wt% in URA 5.1 and 21.56 wt% in URA 5.2) and elevated Al (8.40 and 8.06 wt%), Kcorr (4.76 and 7.56 wt%), Fe (3.92 and 4.82 wt%), and Ca (1.84 and 1.00 wt%), reflecting a heterogeneous mineral assemblage that includes aluminosilicate phases, Fe-bearing minerals, and carbonate components. Na is present in both samples at comparable low concentrations (0.40 wt%) prior to treatment.
HCl treatment produces the most notable changes in Ca and Fe concentrations. Ca decreases by 76% (from 1.84 to 0.44 wt%) in URA 5.1 and by 48% (from 1.00 to 0.52 wt%) in URA 5.2, confirming effective dissolution of carbonate phases. Fe is also substantially reduced, by 50% (from 3.92 to 1.94 wt%) in URA 5.1 and by 39% (from 4.82 to 2.96 wt%) in URA 5.2, likely reflecting partial dissolution of Fe-bearing carbonate phases. In contrast, Al, K, and Na show no significant change after HCl treatment in either sample, confirming that this step selectively targets carbonate phases without affecting the aluminosilicate mineral fraction. Si increases by approximately 25% in URA 5.1 (from 20.58 to 25.66 wt%) and 18% in URA 5.2 (from 21.56 to 25.40 wt%), consistent with the removal of carbonate phases and the resulting relative enrichment of the silicate fraction.
Subsequent H₂O₂ treatment produces only minor compositional changes overall, consistent with its primary role in oxidizing organic matter. Nevertheless, modest additional reductions in Ca (23% in URA 5.1, from 0.44 to 0.34 wt%; 35% in URA 5.2, from 0.52 to 0.34 wt%) and Fe (20% in URA 5.1, from 1.94 to 1.56 wt%; 32% in URA 5.2, from 2.96 to 2.00 wt%) are observed. While H2O2 does not directly target carbonate or silicate phases, these reductions may reflect the continued dissolution of residual carbonate phases and the oxidative breakdown of Fe2+ -bearing minerals such as siderite or pyrite, which are susceptible to H₂O₂ oxidation. Carbon concentrations are not discussed here as their interpretation is compromised by the background contribution of the silver paste substrate, as outlined above.
Density separation further refines the mineralogical composition of the 63–90 µm fraction. The target quartz-rich separate (ρ 2.62–2.75 g/cm³, step 8) shows the highest Si concentrations among all density fractions, reaching 32.64 wt% in URA 5.2 and representing a 14% increase relative to the sieved fraction, with correspondingly low Al (3.52 wt%), Fe (0.42 wt%), Ti, and Na. In URA 5.1, the Si value at this stage (25.98 wt%) is lower than expected and should be interpreted with caution as discussed above. The lighter fractions (ρ < 2.62 g/cm³, steps 5 and 6) also contain elevated Si (30–32 wt%), indicating that a proportion of quartz is inevitably lost to these separates. However, their persistently higher Al, Kcorr, and Na concentrations reflect a greater aluminosilicate burden compared to the target fraction, justifying their exclusion. The fraction retained after the first separation run at 2.62 g/cm³ (ρ > 2.62 g/cm³ II, step 7) shows intermediate characteristics, with Si comparable to the light fractions but elevated Fe and Ca, suggesting co-concentration of quartz with denser mineral phases in this density range. As expected, the heavy fraction (ρ > 2.75 g/cm³, step 9) concentrates the densest phases, with elevated Fe (2.54 wt% in URA 5.1, 2.16 wt% in URA 5.2), Al (5.32 wt% in URA 5.1, 8.46 wt% in URA 5.2), Ca, Ti, and Kcorr, consistent with the selective partitioning of Fe–Ti oxides, ferromagnesian silicates, and dense aluminosilicates.
As expected, the amount of material decreased progressively with each preparation stage. This reduction was particularly pronounced in the final purification stages (after HF and after HF and sieving), for the coarse fraction, where only a small amount of material remained. HF etching of the 63–90 µm, 2.62–2.75 g/cm³ fraction produces the most dramatic compositional change in the entire preparation sequence. In URA 5.2, Si increases by approximately 25% relative to the pre-HF fraction (from 32.64 to 40.86 wt%), while Al and Kcorr are reduced by 69% (from 3.52 to 1.08 wt%) and 57% (from 3.66 to 1.57 wt%) respectively, and Fe, Ti, Ca, and Na reach below MDL, confirming highly effective purification. For URA 5.1, reliable bulk EDS quantification at steps 10 and 11 was not possible due to the very low material obtained and subsequently the dominance of the silver paste substrate signal resulting from insufficient grain coverage, as evidenced by the anomalously low Si values (10.2 wt% at step 10 and 1.98 wt% at step 11) and unrealistically elevated Kraw values (35.70 and 65.60 wt% respectively) attributable to Ag/K spectral overlap. To assess mineralogical purity at the grain scale for step 10, a grain-by-grain evaluation of Si and Al elemental maps was performed across the five analytical areas. Grains displaying a dominant Si signal with no detectable Al were classified as quartz, while grains showing co-occurring Al and Si signals were classified as aluminosilicate phases. Based on this assessment, approximately 66% of the grains counted (250 out of 378) were identified as quartz, with the remaining 34% corresponding to residual aluminosilicate phases, suggesting less complete purification in URA 5.1 compared to URA 5.2. For step 11 of URA 5.1, the extremely low grain yield (6–25 grains per analytical area) precluded reliable quantitative assessment. However, visual inspection of Si and Al elemental maps indicated that the sparse grains present displayed predominantly Si-dominated signals with no detectable Al, consistent with essentially pure quartz, though the limited number of grains analysed does not allow a statistically robust conclusion to be drawn.
For URA 5.2, the post-HF sieving fraction (step 11) shows an 89 % increase in Al (from 1.08 to 2.04 wt%) and 68% in Kcorr (from 1.57 to 2.63 wt%) relative to the HF-treated fraction (step 10). One probable cause is the partial loss of HF-etched quartz grains through the sieve mesh due to grain size reduction during acid dissolution, which increases the relative contribution of residual aluminosilicate phases in the retained fraction. This interpretation is consistent with the grain size reduction effects of HF etching documented by [33,35], who demonstrated that material removal during HF treatment can be substantial and variable, depending on experimental conditions (HF concentration, etching duration, and degree of agitation) as well as on the nature and origin of the mineral grains, with preferential dissolution occurring along crystallographic directions, fissures, and grain boundaries. Furthermore, feldspar dissolution rates vary among feldspar species, with K-feldspars being generally more resistant to chemical attack than plagioclases, and resistance to dissolution decreasing with increasing Ca content in plagioclase [56,57]. This is consistent with the elemental data observed here: Na concentrations drop below minimum detection limit (MDL) after HF etching in both samples, indicating removal of Na-bearing plagioclase phases, while Kcorr values persist in the HF-treated fractions, suggesting that K-rich feldspar grains, particularly highly ordered phases such as microcline, may be more resistant to standard HF etching procedures [57].
Representative SEM micrographs illustrating selected stages of the quartz purification protocol are presented in Figure 1. The untreated sediment (Figure 1A) consists of a heterogeneous mixture of mineral grains displaying variable sizes, morphologies and surface textures, together with abundant fine-grained material. Following HCl and H₂O₂ treatment (Figure 1B), the overall particle assemblage remains heterogeneous, although a reduction in aggregated fine material can be observed. After density separation (Figure 1C), quartz grains become more prominent and the grain population appears compositionally more uniform. The HF-treated and sieved fraction (Figure 1D) is dominated by quartz grains characterized by relatively clean surfaces and well-defined grain boundaries.
3.2. Purification Efficiency Across Preparation Stages
To further characterize and facilitate quantitative comparison between successive preparation stages, a set of compositional indices was calculated from the SEM-EDS elemental data. These indices were designed to provide simplified proxies for quartz enrichment and the relative abundance of major contaminant mineral groups commonly targeted during OSL sample preparation.
The Quartz Purity Index (QPI) was calculated as:
where Si represents silicon and the denominator includes elements commonly associated with feldspars (Al, K, Na), heavy mineral phases (Fe, Ti), and carbonate phases (Ca, Mg), following established elemental associations of rock-forming minerals [55]. Higher QPI values indicate greater relative quartz enrichment.
The Feldspar Contamination Index (FCI) was calculated as:
where Al, K and Na are the principal cations in feldspar minerals, including K-feldspar (KAlSi3O8) and plagioclase (NaAlSi3O8–CaAl2Si2O8) [55]. Lower FCI values indicate more effective feldspar removal.
The Heavy Mineral Index (HMI) was calculated as:
where Fe and Ti are well-established proxies for Fe-Ti oxide phases such as ilmenite and magnetite commonly found in the heavy mineral fraction of loess sediments [55,58]. Lower HMI values indicate more efficient removal of heavy mineral contaminants
The Carbonate Index (CI) was calculated as:
and was used to monitor the relative abundance of carbonate-bearing minerals throughout the preparation sequence. Both Ca and Mg were included in the numerator as they are the principal cations in calcite (CaCO3) and dolomite (CaMg(CO3)2), the dominant carbonate phases commonly encountered in loess sediments of the lower Danube basin [58]. While Ca and Mg can also occur in non-carbonate phases such as plagioclase feldspars and ferromagnesian silicates, their combined signal provides a reliable proxy for carbonate abundance in the early preparation stages prior to density separation, where non-carbonate Mg- and Ca- bearing phases are still present in minor quantities. Lower CI values reflect increasingly effective removal of carbonate contaminants.
All indices were calculated using mean elemental concentrations obtained from five independent analytical areas for each preparation stage. The values of the indices calculated from wt% and at% for both samples are presented in the supplementary material (Table S6 and Table S7). The evolution of all four compositional indices across the successive preparation stages is illustrated in Figure 2 and Figure 3 for samples URA 5.1 and URA 5.2, respectively.
The progressive reduction in FCI, HMI, and CI throughout the preparation sequence provides quantitative support for the effectiveness of the standard OSL quartz extraction protocol in removing feldspar-related phases, heavy minerals, and carbonates.
Feldspar removal, monitored through FCI, represents the most gradual and multi-stage purification process in the entire workflow. In URA 5.2, FCI decreases from 0.75 in the untreated sediment to 0.25 following density separation, and further to 0.07 after HF etching, confirming that the combination of heavy-liquid density separation and HF etching constitutes the most critical purification stage in the entire workflow. In URA 5.1, FCI decreases from 0.66 in the untreated material to 0.35 after density separation.
Heavy mineral removal, reflected by HMI, is achieved progressively across multiple stages but is stronger in grain-size separation and density fractionation. In URA 5.1, HMI decreases by 87% (from 0.208 to 0.028) following isolation of the 63–90 µm fraction, and by a further 46% (from 0.028 to 0.015) after density separation at 2.62–2.75 g/cm³, representing an overall reduction of 93% from the untreated sediment. HMI values at steps 10 and 11 for URA 5.1 are affected by substrate interference and should be interpreted with caution, as discussed above. URA 5.2 follows a closely comparable trend, with HMI decreasing by 89% (from 0.241 to 0.027) after grain-size separation, and by a further 52% (from 0.027 to 0.013) after density separation, representing an overall reduction of 95% from the untreated sediment, with complete elimination of detectable Fe- and Ti-bearing phases in the final HF-treated fraction. The >2.75 g/cm³ heavy fraction shows the highest HMI values in both samples (0.149 in URA 5.1, 0.116 in URA 5.2), as expected given the selective concentration of dense mineral phases in this separate, further validating the index as a reliable proxy for heavy mineral abundance.
Carbonate removal, targeted by the initial HCl treatment, is highly effective in both samples. CI decreases by 74% (from 0.155 to 0.040) in URA 5.1 and by 53% (from 0.106 to 0.050) in URA 5.2 following HCl treatment alone, with only minor additional reductions of 15% (to 0.034) in URA 5.1 and 38% (to 0.031) in URA 5.2 observed after subsequent H₂O₂ treatment. This confirms that the HCl step efficiently dissolves carbonate phases early in the preparation sequence, and that H₂O₂ treatment has negligible influence on the carbonate-associated signal. The higher initial CI in URA 5.1 (0.155) compared to URA 5.2 (0.106) suggests a greater carbonate mineral content in the former sample prior to treatment, which may reflect differences in sedimentary environment or diagenetic history between the two samples.
The overall quartz enrichment process, captured by QPI, integrates the cumulative effect of all purification stages. QPI increases by 47% (from 0.495 to 0.729) in URA 5.1 and by 97% (from 0.478 to 0.939) in URA 5.2. In URA 5.2, the largest single increments occur at the grain-size separation and HF etching stages, which contribute almost equally to the overall quartz enrichment. For URA 5.1, the largest increment is observed at the grain-size separation stage, while the contribution of HF etching cannot be assessed from the index data due to substrate interference at steps 10 and 11, as discussed above. The substantially higher final QPI in URA 5.2 (0.939) compared to the last reliable QPI value in URA 5.1 (0.729 at step 8) is consistent with the more complete purification observed in URA 5.2, though a direct comparison at the HF stage is not possible for URA 5.1.
The index-based analysis demonstrates that the standard OSL quartz extraction protocol achieves progressive and effective purification across all major contaminant groups, as summarised in Table 3. For the coarse fraction of URA 5.2, near-complete purification is confirmed at the HF etching stage (~94% quartz) by converging evidence from both the elemental data and compositional indices, with a slight decrease after sieving (~89%). For URA 5.1, while index values at the HF-treated stages are unreliable due to substrate interference, grain-by-grain EDS map assessment indicates less complete purification compared to URA 5.2, with approximately 34% of grains retaining aluminosilicate characteristics at step 10. Comparison of the final coarse and fine fractions reveals contrasting purification outcomes between the two samples. In URA 5.2, the HF-treated coarse fraction achieves substantially higher purity (~94%) compared to the H₂SiF₆-purified fine fraction (~67%), confirming more complete feldspar removal in the coarse separate. In URA 5.1, however, the pattern is reversed - the fine fraction (~80%) appears cleaner than the coarse fraction at step 10 (66% based on grain-by-grain assessment). The difference in purification efficiency between coarse and fine fractions highlights the importance of fraction-specific purity verification, particularly for OSL measurements performed on fine-grained quartz extracts.
3.3. Grain Size Fractions and Mineralogical Partitioning
The grain-size separation following the H2O2 treatment introduces clear compositional differences between fractions, as reflected in the EDS data (Table 1 and Table 2). The coarse fraction (63–90 µm) displays higher Si concentrations (31 wt% in URA 5.1, 29 wt% in URA 5.2) and substantially reduced Al, Kcorr, Fe, and Ti relative to the H2O2 treated bulk material, reflecting the preferential concentration of quartz in the coarser size classes. In contrast, the <63 µm fraction retains elevated Al and Kcorr contents comparable to the H₂O₂ treated bulk material, indicating a higher proportion of aluminosilicate phases, including likely clay minerals, in the finer size classes. This compositional contrast between fine and coarse fractions is consistent across both samples.
Following H2SiF6 treatment, the <11 µm fraction shows a moderate increase in Si in both samples a 70% increase in URA 5.1 (from 23 to 39 wt%) and a 31% increase in URA 5.2 (from 22 to 29 wt%). The notably higher Si value reached in URA 5.1 compared to URA 5.2 after H2SiF6 treatment may reflect differences in the mineralogical composition or grain surface characteristics between the two samples. After the final centrifugation step to isolate the 4–11 µm quartz fraction, Kcorr increases to 4.6 wt% in URA 5.1 and 6.2 wt% in URA 5.2, which may indicate persistant residual feldspar presence in the fine quartz enriched fraction.
A notable increase in Ti is also observed following H2SiF6 treatment in both samples (by 89% in URA 5.1, from 0.56 to 1.06 wt%; and by 54% in URA 5.2, from 0.52 to 0.80 wt%), which persists in the final 4–11 µm fraction. This might reflect the selective dissolution of aluminosilicate phases by H2SiF6, which concentrates residual Ti-bearing mineral phases such as anatase and rutile in the treated fraction, consistent with the well-established resistance of crystalline TiO2 minerals to fluorosilicic acid treatment [59].
The targeted grain dimensions obtained by sieving and Stokes law settling have been investigated using SEM imaging. The measured grains generally confirm the expected grain sizes for each separated fraction (Figure S3). The coarse fractions are dominated by well-defined, discrete mineral grains with clearly visible grain boundaries, whereas the fine fractions contain a higher proportion of fine-grained aggregates and clay-sized particles, consistent with their elevated aluminosilicate burden observed in the EDS data.
In the 63–90 µm fraction, grains exceeding the upper sieve limit of 90 µm were occasionally observed, which is a known characteristic of dry sieving where passage through the sieve mesh is controlled by the maximum breadth and thickness of the particle rather than its length. As a result, elongated or platy grains with their two smallest dimensions within the 63–90 µm range but a longer axis exceeding 90 µm may be retained in this fraction. Similarly, the 4–11 µm fraction isolated by Stokes law settling and centrifugation may contain particles outside the nominal size range, as Stokes law assumes spherical particles whereas natural mineral grains are irregular in shape, causing non-spherical particles to settle at rates deviating from theoretical predictions. Both effects are inherent limitations of the respective separation methods and should be considered alongside the EDS compositional data when assessing the purity and size homogeneity of the separated fractions for OSL dating applications.
3.4. Quartz OSL Dating and Assessment of Feldspar Contribution
The luminescence analyses routinely carried out during dating allow a qualitative evaluation of the presence of feldspar signals in the quartz extracts with grain sizes of 4-11 µm and 63-90 µm, during the IR depletion test which is integrated in the SAR protocol [47]. IR stimulated signals decaying with stimulation time, attributed to feldspars are observed in all samples (insets of Figure S4). Their intensity is significantly lower than the post-IR blue light stimulated signals. The quartz TL emission around 150-180 °C, generally attributed to feldspar, relative to the 110 °C TL peak, was used to monitor the presence of minor feldspar signals (Figure S5). Coupled with the IRSL signals, the TL emission in the 150–180 °C region may indicate the presence of residual feldspar contamination, since feldspars exhibit characteristic TL peaks in this temperature interval [60], although quartz itself may also display intrinsic intermediate-temperature TL peaks near 150 °C [61].
The IR depletion test results vary within 10 % from unity (Table S8), which indicate a minimal feldspar signal contribution to the blue light stimulated luminescence. Interestingly, while the SEM-EDS results indicates a higher efficiency of quartz separation in the 60-90 µm fraction, the luminescence results indicate that both grain sizes exhibit similar IRSL signals intensities (Figure S4). Details regarding the obtained equivalent doses and OSL ages are given in the supplementary material (Table S8 and Table S9).
4. Conclusion
This study demonstrates that SEM–EDS provides a practical and quantitative framework for monitoring quartz purification throughout the standard OSL sample-preparation dating workflow. Each preparation stage contributes differently to the overall process: carbonate phases and Fe-bearing carbonate minerals are effectively removed by the initial HCl treatment, heavy minerals are progressively eliminated through grain-size separation and density fractionation, and feldspar removal results from the combined effects of density separation and HF etching. Grain-size separation raised the quartz proportion from approximately 61% to 73% in URA5.1 and from approximately 52% to 68% in URA5.2, corresponding to gains of about 12 and 16 percentage points, respectively. In URA5.2, HF etching produced a further improvement from approximately 79% to 94% quartz, whereas URA5.1 reached only approximately 66% quartz in the area-based measurements. Nevertheless, grain-targeted SEM-EDS maps analysis indicated that the few particles remaining after sieving were predominantly quartz. H₂O₂ treatment produced only minor changes in the elemental composition of the mineral fraction, consistent with its primary role in removing organic matter rather than mineral phases.
Despite undergoing identical preparation protocols, the two samples responded differently to HF etching, demonstrating that purification efficiency can vary substantially even between samples from the same stratigraphic section. However, luminescence measurements showed similarly weak feldspar signals in both samples, with intensities substantially lower than the quartz OSL signal.
The compositional indices introduced here - QPI, FCI, HMI, and CI - offer an internally consistent and reproducible means of tracking mineralogical evolution across preparation stages. Where grain yield is insufficient for reliable bulk EDS quantification, grain-by-grain elemental map assessment provides a robust complementary approach, as demonstrated here for the HF-treated fraction of URA 5.1.
Supplementary Materials
The following supporting information can be downloaded at the website of this paper posted on Preprints.org.
Author Contributions
Conceptualization, B.L.M., S.C.G. and A.T.; methodology, B.L.M., S.C.G, D.B. and D.C.; software, B.L.M. and S.C.G. and D.B.; validation, A.T., and D.C.; formal analysis, , B.L.M. and S.C.G. and D.B.; investigation, B.L.M. and S.C.G. and D.B.; resources, A.T.; data curation, B.L.M. and S.C.G. and D.B.; writing—original draft preparation, B.L.M. and S.C.G., D.C., D.B. and A.T.; writing—review and editing, X.X.; visualization, B.L.M. and S.C.G. and D.B.; supervision, D.C. and A.T.; project administration, A.T.; funding acquisition, A.T. All authors have read and agreed to the published version of the manuscript.
Funding
This research is funded by the European Research Council Consolidator Grant - PROGRESS, (ERC CoG-101043356) to A.T. The views and opinions expressed are, however, those of the authors only and do not necessarily reflect those of the European Union or the European Research Council. Neither the European Union nor the granting authority can be held responsible for them.
Data Availability Statement
The original data presented in the study are openly available in Zenodo at https://doi.org/10.5281/zenodo.21071540.
Acknowledgments
We gratefully acknowledge Dr. Daniel Veres for his expert guidance and help during the sampling campaign.
Conflicts of Interest
The authors declare no conflicts of interest. The funders had no role in the design of the study; in the collection, analyses, or interpretation of data; in the writing of the manuscript; or in the decision to publish the results.
References
- Timar, A.; Vandenberghe, D.; Panaiotu, E.C.; Panaiotu, C.G.; Necula, C.; Cosma, C.; Van Den Haute, P. Optical Dating of Romanian Loess Using Fine-Grained Quartz. Quat. Geochronol. 2010, 5, 143–148. [Google Scholar] [CrossRef]
- Murray, A.S.; Schmidt, E.D.; Stevens, T.; Buylaert, J.-P.; Marković, S.B.; Tsukamoto, S.; Frechen, M. Dating Middle Pleistocene Loess from Stari Slankamen (Vojvodina, Serbia) — Limitations Imposed by the Saturation Behaviour of an Elevated Temperature IRSL Signal. CATENA 2014, 117, 34–42. [Google Scholar] [CrossRef]
- Veres, D.; Tecsa, V.; Gerasimenko, N.; Zeeden, C.; Hambach, U.; Timar-Gabor, A. Short-Term Soil Formation Events in Last Glacial East European Loess, Evidence from Multi-Method Luminescence Dating. Quat. Sci. Rev. 2018, 200, 34–51. [Google Scholar] [CrossRef]
- Perić, Z.; Lagerbäck Adolphi, E.; Stevens, T.; Újvári, G.; Zeeden, C.; Buylaert, J.-P.; Marković, S.B.; Hambach, U.; Fischer, P.; Schmidt, C.; et al. Quartz OSL Dating of Late Quaternary Chinese and Serbian Loess: A Cross Eurasian Comparison of Dust Mass Accumulation Rates. Quat. Int. 2019, 502, 30–44. [Google Scholar] [CrossRef]
- Brezeanu, D.; Avram, A.; Micallef, A.; Cinta Pinzaru, S.; Timar-Gabor, A. Investigations on the Luminescence Properties of Quartz and Feldspars Extracted from Loess in the Canterbury Plains, New Zealand South Island. Geochronometria 2021, 48, 46–60. [Google Scholar] [CrossRef]
- Constantin, D.; Mason, J.A.; Veres, D.; Hambach, U.; Panaiotu, C.; Zeeden, C.; Zhou, L.; Marković, S.B.; Gerasimenko, N.; Avram, A.; et al. OSL-Dating of the Pleistocene-Holocene Climatic Transition in Loess from China, Europe and North America, and Evidence for Accretionary Pedogenesis. Earth-Sci. Rev. 2021, 221, 103769. [Google Scholar] [CrossRef]
- Avram, A.; Mason, J.A.; Del Valle Villalonga, L.; Constantin, D.; Grecu, S.; Veres, D.; Marković, S.; Timar-Gabor, A. Revisiting the Chronology of a Key Loess Section in North America Using Multiple Luminescence Dating Methods. Geol. Soc. Am. Bull. 2025, 137, 3207–3220. [Google Scholar] [CrossRef]
- Rittenour, T.M. Luminescence Dating of Fluvial Deposits: Applications to Geomorphic, Palaeoseismic and Archaeological Research. Boreas 2008, 37, 613–635. [Google Scholar] [CrossRef]
- Fuchs, M.; Owen, L.A. Luminescence Dating of Glacial and Associated Sediments: Review, Recommendations and Future Directions. Boreas 2008, 37, 636–659. [Google Scholar] [CrossRef]
- Fattahi, M.; Walker, R.T. Luminescence Dating of the Last Earthquake of the Sabzevar Thrust Fault, NE Iran. Quat. Geochronol. 2007, 2, 284–289. [Google Scholar] [CrossRef]
- Thomsen, K.J.; Bøtter-Jensen, L.; Denby, P.M.; Moska, P.; Murray, A.S. Developments in Luminescence Measurement Techniques. Radiat. Meas. 2006, 41, 768–773. [Google Scholar] [CrossRef]
- Murray, A.S. Developments in Optically Stimulated Luminescence and Photo-Transferred Thermoluminescence Dating of Young Sediments: Application to a 2000-Year Sequence of Flood Deposits. Geochim. Cosmochim. Acta 1996, 60, 565–576. [Google Scholar] [CrossRef]
- Cunha, P.P.; Buylaert, J.P.; Murray, A.S.; Andrade, C.; Freitas, M.C.; Fatela, F.; Munhá, J.M.; Martins, A.A.; Sugisaki, S. Optical Dating of Clastic Deposits Generated by an Extreme Marine Coastal Flood: The 1755 Tsunami Deposits in the Algarve (Portugal). Quat. Geochronol. 2010, 5, 329–335. [Google Scholar] [CrossRef]
- Shen, H.; Yu, L.; Zhang, H.; Zhao, M.; Lai, Z. OSL and Radiocarbon Dating of Flood Deposits and Its Paleoclimatic and Archaeological Implications in the Yihe River Basin, East China. Quat. Geochronol. 2015, 30, 398–404. [Google Scholar] [CrossRef]
- Yang, H.; Zhao, H.; Wang, X.; Wang, K.; Niu, Q.; Zhang, J.; Liu, B. Optical Dating of Yardang Sediments and Its Implications for Past Flood Events on the Border of the Badain Jaran Desert, Northern China. CATENA 2021, 207, 105614. [Google Scholar] [CrossRef]
- Murari, M.K.; Achyuthan, H.; Singhvi, A.K. Luminescence Studies on the Sediments Laid down by the December 2004 Tsunami Event: Prospects for the Dating of Palaeo Tsunamis and for the Estimation of Sediment Fluxes. Curr. Sci. 2007, 92, 367–371. [Google Scholar]
- Spiske, M.; Weiss, R.; Bahlburg, H.; Roskosch, J.; Amijaya, H. The TsuSedMod Inversion Model Applied to the Deposits of the 2004 Sumatra and 2006 Java Tsunami and Implications for Estimating Flow Parameters of Palaeo-Tsunami. Sediment. Geol. 2010, 224, 29–37. [Google Scholar] [CrossRef]
- Spiske, M.; Piepenbreier, J.; Benavente, C.; Kunz, A.; Bahlburg, H.; Steffahn, J. Historical Tsunami Deposits in Peru: Sedimentology, Inverse Modeling and Optically Stimulated Luminescence Dating. Quat. Int. 2013, 305, 31–44. [Google Scholar] [CrossRef]
- Brill, D.; Klasen, N.; Brückner, H.; Jankaew, K.; Scheffers, A.; Kelletat, D.; Scheffers, S. OSL Dating of Tsunami Deposits from Phra Thong Island, Thailand. Quat. Geochronol. 2012, 10, 224–229. [Google Scholar] [CrossRef]
- Bluszcz, A. OSL Dating in Archaeology. In Impact of the Environment on Human Migration in Eurasia; Marian Scott, E., Alekseev, A.Yu., Zaitseva,, G., Eds.; NATO Science Series: IV: Earth and Environmental Sciences; Kluwer Academic Publishers: Dordrecht, 2005; Vol. 42, pp. 137–149. ISBN 978-1-4020-2655-3. [Google Scholar]
- Davidovich, U.; Porat, N.; Gadot, Y.; Avni, Y.; Lipschits, O. Archaeological Investigations and OSL Dating of Terraces at Ramat Rahel, Israel. J. Field Archaeol. 2012, 37, 192–208. [Google Scholar] [CrossRef]
- Roberts, R.G.; Jacobs, Z.; Li, B.; Jankowski, N.R.; Cunningham, A.C.; Rosenfeld, A.B. Optical Dating in Archaeology: Thirty Years in Retrospect and Grand Challenges for the Future. J. Archaeol. Sci. 2015, 56, 41–60. [Google Scholar] [CrossRef]
- Roberts, R.; Jones, R.; Smith, M.A. Optical Dating At Deaf Adder Gorge, Northern Territory, Indicates Human Occupation Between 53,000 and 60,000 Years Ago. Aust. Archaeol. 1993, 37, 58–59. [Google Scholar] [CrossRef]
- Bowler, J.M.; Johnston, H.; Olley, J.M.; Prescott, J.R.; Roberts, R.G.; Shawcross, W.; Spooner, N.A. New Ages for Human Occupation and Climatic Change at Lake Mungo, Australia. Nature 2003, 421, 837–840. [Google Scholar] [CrossRef] [PubMed]
- Sun, X.; Lu, H.; Wang, S.; Yi, S.; Shen, C.; Zhang, W. TT-OSL Dating of Longyadong Middle Paleolithic Site and Paleoenvironmental Implications for Hominin Occupation in Luonan Basin (Central China). Quat. Res. 2013, 79, 168–174. [Google Scholar] [CrossRef]
- Ge, J.; Xing, S.; Grün, R.; Deng, C.; Jiang, Y.; Jiang, T.; Yang, S.; Zhao, K.; Gao, X.; Yang, H.; et al. New Late Pleistocene Age for the Homo Sapiens Skeleton from Liujiang Southern China. Nat. Commun. 2024, 15, 3611. [Google Scholar] [CrossRef] [PubMed]
- Frechen, M.; Schweitzer, U.; Zander, A. Improvements in Sample Preparation for the Fine Grain Technique. Anc. TL 1996, 14, 15–17. [Google Scholar] [CrossRef]
- Lang, A.; Lindauer, S.; Kuhn, R.; Wagner, G.A. Procedures Used for Optically and Infrared Stimulated Luminescence Dating of Sediments in Heidelberg. Anc. TL 1996, 14, 7–11. [Google Scholar] [CrossRef]
- Berger, G.W.; Mulhern, P.J.; Huntley, D.J. Isolation of Silt-Sized Quartz from Sediments. Anc. TL 1980, 4, 8–9. [Google Scholar] [CrossRef]
- Aitken, M.J. An Introduction to Optical Dating: The Dating of Quaternary Sediments by the Use of Photon-Stimulated Luminescence; Oxford University Press: Oxford ; New York, 1998; ISBN 978-0-19-854092-2. [Google Scholar]
- Lang, A.R.; Miuscov, V.F. Dislocations and Fault Surfaces in Synthetic Quartz. J. Appl. Phys. 1967, 38, 2477–2483. [Google Scholar] [CrossRef]
- Goedicke, C. Microscopic Investigations of the Quartz Etching Technique for TL Dating. Nucl. Tracks Radiat. Meas. 1982 1984, 9, 87–93. [Google Scholar] [CrossRef]
- Porat, N.; Faerstein, G.; Medialdea, A.; Murray, A.S. Re-Examination of Common Extraction and Purification Methods of Quartz and Feldspar for Luminescence Dating. Anc. TL 2015, 33, 22–30. [Google Scholar] [CrossRef]
- Bell, W.T.; Zimmerman, D.W. THE EFFECT OF HF ACID ETCHING ON THE MORPHOLOGY OF QUARTZ INCLUSIONS FOR THERMOLUMINESCENCE DATING. Archaeometry 1978, 20, 63–65. [Google Scholar] [CrossRef]
- Duval, M.; Guilarte, V.; Campaña, I.; Arnold, L.J.; Miguens, L.; Iglesias, J.; González-Sierra, S. Quantifying Hydrofluoric Acid Etching of Quartz and Feldspar Coarse Grains Based on Weight Loss Estimates: Implication for ESR and Luminescence Dating Studies. Anc. TL 2018, 36, 1–14. [Google Scholar] [CrossRef]
- Dong, Y.; Zhou, Y.; Huang, H.; Zhang, B.; Li, X.; Chen, K.; Sun, L.; Dou, G. Etching of Quartz Crystals in Liquid Phase Environment: A Review. Nanotechnol. Precis. Eng. 2024, 7, 025001. [Google Scholar] [CrossRef]
- Singh, A.K.; Manna, I.; Kumar, P.; Dawar, A.; Kumar, P.; Murari, M.K. A New and Effective Method for Quartz-Feldspar Separation for OSL and CRN Dating. Quat. Geochronol. 2022, 72, 101315. [Google Scholar] [CrossRef]
- Duller, G.A.T. Distinguishing Quartz and Feldspar in Single Grain Luminescence Measurements. Radiat. Meas. 2003, 37, 161–165. [Google Scholar] [CrossRef]
- Murray, A.; Arnold, L.J.; Buylaert, J.-P.; Guérin, G.; Qin, J.; Singhvi, A.K.; Smedley, R.; Thomsen, K.J. Optically Stimulated Luminescence Dating Using Quartz. Nat. Rev. Methods Primer 2021, 1, 72. [Google Scholar] [CrossRef]
- Fitzsimmons, K.E.; Hambach, U. Loess Accumulation during the Last Glacial Maximum: Evidence from Urluia, Southeastern Romania. Quat. Int. 2014, 334–335, 74–85. [Google Scholar] [CrossRef]
- Obreht, I.; Hambach, U.; Veres, D.; Zeeden, C.; Bösken, J.; Stevens, T.; Marković, S.B.; Klasen, N.; Brill, D.; Burow, C.; et al. Shift of Large-Scale Atmospheric Systems over Europe during Late MIS 3 and Implications for Modern Human Dispersal. Sci. Rep. 2017, 7, 5848. [Google Scholar] [CrossRef] [PubMed]
- Giaccio, B.; Hajdas, I.; Isaia, R.; Deino, A.; Nomade, S. High-Precision 14C and 40Ar/39Ar Dating of the Campanian Ignimbrite (Y-5) Reconciles the Time-Scales of Climatic-Cultural Processes at 40 Ka. Sci. Rep. 2017, 7, 45940. [Google Scholar] [CrossRef] [PubMed]
- Plewinsky, B.; Kamps, R. Sodium Metatungstate, a New Medium for Binary and Ternary Density Gradient Centrifugation. Makromol. Chem. 1984, 185, 1429–1439. [Google Scholar] [CrossRef]
- Callahan, J. A Nontoxic Heavy Liquid and Inexpensive Filters for Separation of Mineral Grains. J. Sediment. Res. 1987, 57, 765–766. [Google Scholar] [CrossRef]
- Lapp, T.; Kook, M.; Murray, A.S.; Thomsen, K.J.; Buylaert, J.-P.; Jain, M. A New Luminescence Detection and Stimulation Head for the Risø TL/OSL Reader. Radiat. Meas. 2015, 81, 178–184. [Google Scholar] [CrossRef]
- Hansen, V.; Murray, A.; Buylaert, J.-P.; Yeo, E.-Y.; Thomsen, K. A New Irradiated Quartz for Beta Source Calibration. Radiat. Meas. 2015, 81, 123–127. [Google Scholar] [CrossRef]
- Murray, A.S.; Wintle, A.G. Luminescence Dating of Quartz Using an Improved Single-Aliquot Regenerative-Dose Protocol. Radiat. Meas. 2000, 32, 57–73. [Google Scholar] [CrossRef]
- Murray, A.S.; Wintle, A.G. The Single Aliquot Regenerative Dose Protocol: Potential for Improvements in Reliability. Radiat. Meas. 2003, 37, 377–381. [Google Scholar] [CrossRef]
- Cunningham, A.C.; Wallinga, J. Selection of Integration Time Intervals for Quartz OSL Decay Curves. Quat. Geochronol. 2010, 5, 657–666. [Google Scholar] [CrossRef]
- Guérin, G.; Mercier, N.; Adamiec, G. Dose-Rate Conversion Factors: Update. Anc. TL 2011, 29, 5–8. [Google Scholar] [CrossRef]
- Rees-Jones, J. Optical Dating of Young Sediments Using Fine-Grain Quartz. Anc. TL 1995, 13, 9–14. [Google Scholar] [CrossRef]
- Mejdahl, V. THERMOLUMINESCENCE DATING: BETA-DOSE ATTENUATION IN QUARTZ GRAINS. Archaeometry 1979, 21, 61–72. [Google Scholar] [CrossRef]
- Prescott, J.R.; Hutton, J.T. Cosmic Ray Contributions to Dose Rates for Luminescence and ESR Dating: Large Depths and Long-Term Time Variations. Radiat. Meas. 1994, 23, 497–500. [Google Scholar] [CrossRef]
- Vandenberghe, D.; De Corte, F.; Buylaert, J.-P.; Kučera, J.; Van Den Haute, P. On the Internal Radioactivity in Quartz. Radiat. Meas. 2008, 43, 771–775. [Google Scholar] [CrossRef]
- Deer, W.A.; Howie, R.A.; Zussman, J. An Introduction to the Rock-Forming Minerals; Mineralogical Society of Great Britain and Ireland, 2013; ISBN 978-0-903056-43-4. [Google Scholar]
- Goldich, S.S. A Study in Rock-Weathering. J. Geol. 1938, 46, 17–58. [Google Scholar] [CrossRef]
- Bartz, M.; Peña, J.; Grand, S.; King, G.E. Potential Impacts of Chemical Weathering on Feldspar Luminescence Dating Properties. Geochronology 2023, 5, 51–64. [Google Scholar] [CrossRef]
- Buggle, B.; Glaser, B.; Zöller, L.; Hambach, U.; Marković, S.; Glaser, I.; Gerasimenko, N. Geochemical Characterization and Origin of Southeastern and Eastern European Loesses (Serbia, Romania, Ukraine). Quat. Sci. Rev. 2008, 27, 1058–1075. [Google Scholar] [CrossRef]
- Sayin, M.; Jackson, M.L. Anatase and Rutile Determination in Kaolinite Deposits. Clays Clay Miner. 1975, 23, 437–443. [Google Scholar] [CrossRef]
- Krbetschek, M.R.; Götze, J.; Dietrich, A.; Trautmann, T. Spectral Information from Minerals Relevant for Luminescence Dating. Radiat. Meas. 1997, 27, 695–748. [Google Scholar] [CrossRef]
- Monti, A.M.; Fasoli, M.; Panzeri, L.; Martini, M. Investigation of the Spectrally Resolved TL Peaks of Quartz in the 70°C–220°C Temperature Region. Radiat. Meas. 2019, 127, 106141. [Google Scholar] [CrossRef]
Figure 1.
Representative SEM micrographs of URA 5.2 sample at key stages of the quartz purification procedure: (A) bulk sample before any treatment, (B) after HCl and H₂O₂ treatment, (C) after density separation (2.62–2.75 g cm-3 fraction), and (D) after HF treatment and sieving.
Figure 1.
Representative SEM micrographs of URA 5.2 sample at key stages of the quartz purification procedure: (A) bulk sample before any treatment, (B) after HCl and H₂O₂ treatment, (C) after density separation (2.62–2.75 g cm-3 fraction), and (D) after HF treatment and sieving.
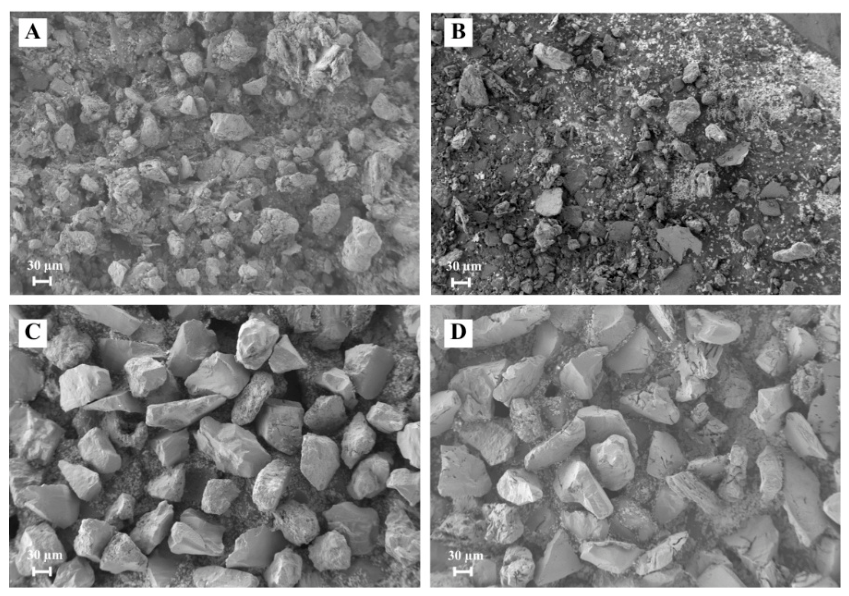
Figure 2.
Evolution of compositional indices during successive preparation steps for sample URA 5.1. (A) Quartz Purity Index (QPI); (B) Feldspar Contamination Index (FCI); (C) Heavy Mineral Index (HMI); and (D) Carbonate Index (CI). Error bars represent mean ± standard error of the mean (n = 5). Numbers on the x-axis correspond to the sequential preparation stages listed in Table 1.
Figure 2.
Evolution of compositional indices during successive preparation steps for sample URA 5.1. (A) Quartz Purity Index (QPI); (B) Feldspar Contamination Index (FCI); (C) Heavy Mineral Index (HMI); and (D) Carbonate Index (CI). Error bars represent mean ± standard error of the mean (n = 5). Numbers on the x-axis correspond to the sequential preparation stages listed in Table 1.
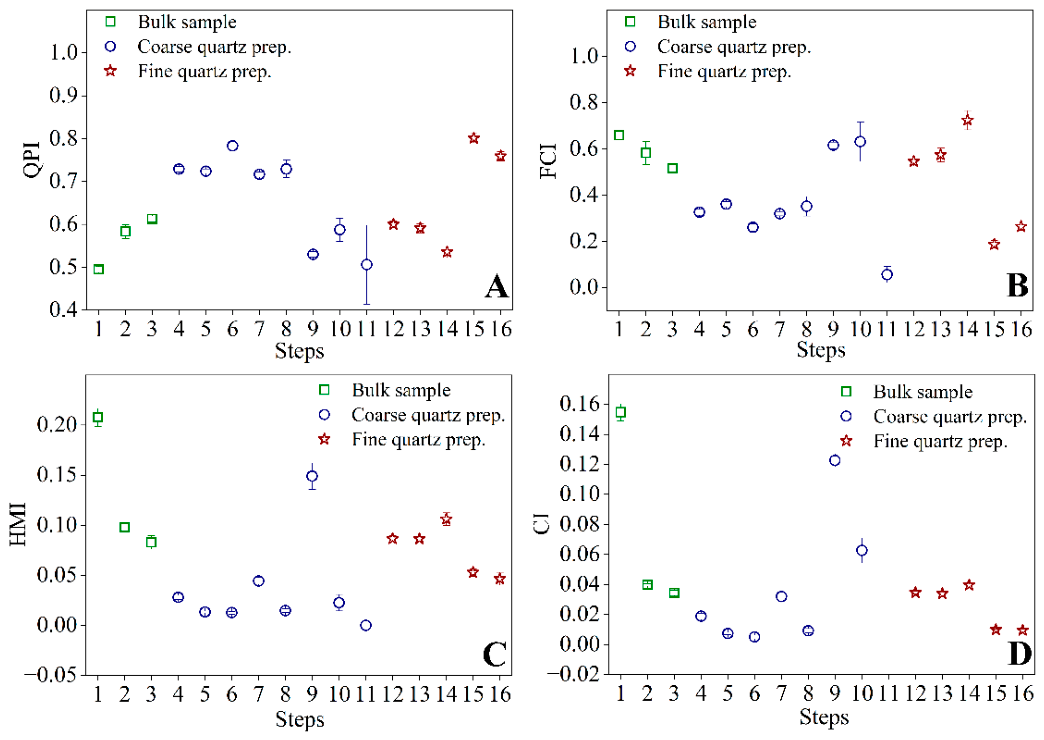
Figure 3.
Evolution of compositional indices during successive preparation steps for sample URA 5.2. (A) Quartz Purity Index (QPI); (B) Feldspar Contamination Index (FCI); (C) Heavy Mineral Index (HMI); and (D) Carbonate Index (CI). Error bars represent mean ± standard error of the mean (n = 5). Numbers on the x-axis correspond to the sequential preparation stages listed in Table 2.
Figure 3.
Evolution of compositional indices during successive preparation steps for sample URA 5.2. (A) Quartz Purity Index (QPI); (B) Feldspar Contamination Index (FCI); (C) Heavy Mineral Index (HMI); and (D) Carbonate Index (CI). Error bars represent mean ± standard error of the mean (n = 5). Numbers on the x-axis correspond to the sequential preparation stages listed in Table 2.
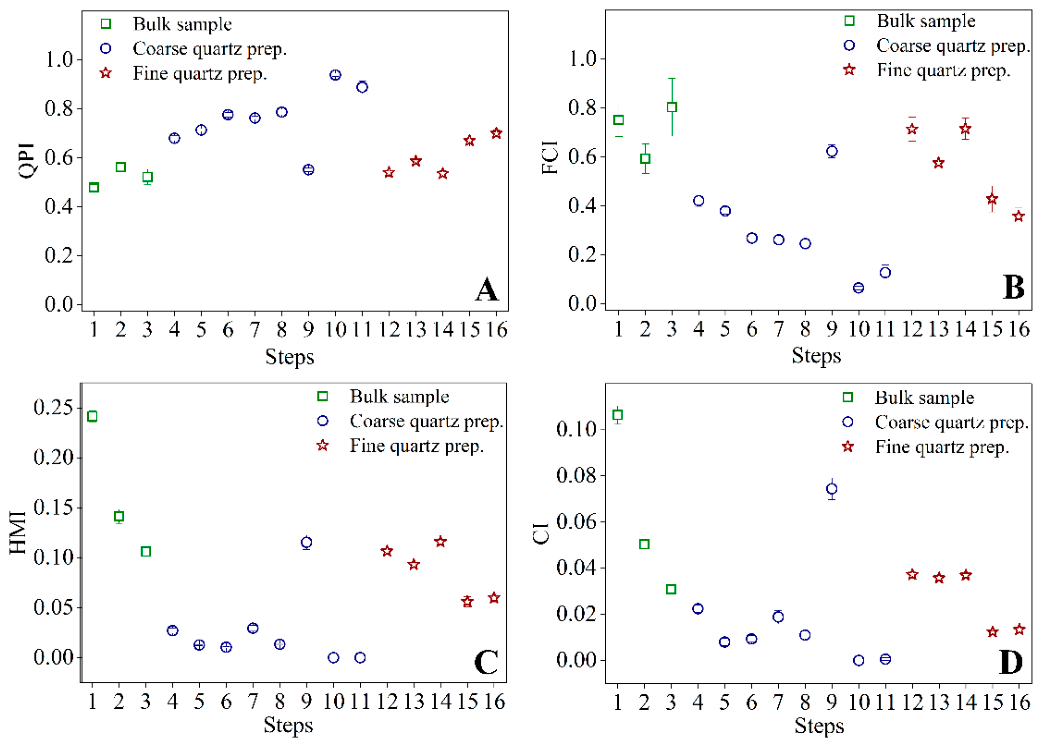

Table 1.
Mean elemental composition (wt%) of sample URA 5.1 throughout the sequential OSL preparation workflow. Values represent mean ± standard error of the mean calculated from five independent SEM-EDS analytical areas.
Table 1.
Mean elemental composition (wt%) of sample URA 5.1 throughout the sequential OSL preparation workflow. Values represent mean ± standard error of the mean calculated from five independent SEM-EDS analytical areas.
| No. | Step name | Si | Al | Kcorr | Na | Ca | Fe | Ti |
|---|---|---|---|---|---|---|---|---|
| 1 | Before treat-ment | 20.58 ± 0.24 | 8.40 ± 0.03 | 4.76 ± 0.51 | 0.40 ± 0.00 | 1.84 ± 0.08 | 3.92 ± 0.22 | 0.36 ± 0.02 |
| 2 | After HCL | 25.66 ± 0.87 | 7.90 ± 0.16 | 6.44 ± 1.00 | 0.44 ± 0.05 | 0.44 ± 0.02 | 1.94 ± 0.12 | 0.58 ± 0.05 |
| 3 | After H2O2 | 24.44 ± 0.81 | 7.08 ± 0.12 | 4.98 ± 0.60 | 0.54 ± 0.05 | 0.34 ± 0.04 | 1.56 ± 0.15 | 0.48 ± 0.07 |
| 4 | 63-90 μm | 30.74 ± 0.37 | 4.54 ± 0.21 | 4.40 ± 0.35 | 1.06 ± 0.10 | 0.34 ± 0.04 | 0.84 ± 0.05 | 0.02 ± 0.02 |
| 5 | ρ < 2.62 g/cm3 I | 29.80 ± 0.41 | 4.14 ± 0.12 | 5.15 ± 0.30 | 1.44 ± 0.09 | 0.14 ± 0.02 | 0.40 ± 0.03 | 0.00 ± 0.00 |
| 6 | ρ < 2.62 g/cm3 II | 31.70 ± 0.48 | 3.16 ± 0.13 | 4.12 ± 0.25 | 0.94 ± 0.07 | 0.12 ± 0.02 | 0.40 ± 0.04 | 0.00 ± 0.00 |
| 7 | ρ > 2.62 g/cm3 II | 28.80 ± 0.30 | 3.58 ± 0.19 | 4.93 ± 0.15 | 0.70 ± 0.07 | 0.60 ± 0.06 | 1.02 ± 0.10 | 0.26 ± 0.05 |
| 8 | ρ 2.62-2.75 g/cm3 I | 25.98 ± 0.79 | 3.72 ± 0.64 | 5.03 ± 0.62 | 0.48 ± 0.10 | 0.22 ± 0.04 | 0.38 ± 0.04 | 0.00 ± 0.00 |
| 9 | ρ > 2.75 g/cm3 I | 22.20 ± 0.41 | 5.32 ± 0.15 | 7.71 ± 0.21 | 0.62 ± 0.06 | 1.88 ± 0.05 | 2.54 ± 0.16 | 0.76 ± 0.12 |
| 10* | ρ 2.62-2.75 g/cm3, after HF | 10.16 ± 0.54 | 2.68 ± 0.47 | 3.88 ± 0.68 | 0.00 ± 0.00 | 0.62 ± 0.05 | 0.22 ± 0.07 | 0.00 ± 0.00 |
| 11* | ρ 2.62-2.75 g/cm3, after HF and sieving | 1.98 ± 0.65 | 0.06 ± 0.04 | 0.09 ± 0.06 | 0.00 ± 0.00 | 1.50 ± 0.28 | 0.00 ± 0.00 | 0.00 ± 0.00 |
| 12 | < 63 μm | 25.42 ± 0.24 | 7.10 ± 0.06 | 6.22 ± 0.47 | 0.56 ± 0.02 | 0.40 ± 0.00 | 1.80 ± 0.08 | 0.40 ± 0.00 |
| 13 | 11-63 μm | 25.88 ± 0.45 | 7.04 ± 0.08 | 7.18 ± 0.63 | 0.58 ± 0.04 | 0.42 ± 0.02 | 1.86 ± 0.07 | 0.38 ± 0.04 |
| 14 | < 11 μm | 22.72 ± 1.26 | 7.26 ± 0.44 | 8.82 ± 0.68 | 0.18 ± 0.04 | 0.50 ± 0.00 | 1.84 ± 0.10 | 0.56 ± 0.05 |
| 15 | < 11 μm, after H2SiF6 | 38.74 ± 0.49 | 4.26 ± 0.31 | 2.90 ± 0.26 | 0.04 ± 0.02 | 0.28 ± 0.02 | 0.98 ± 0.10 | 1.06 ± 0.04 |
| 16 | 4-11 μm, after H2SiF6 + dis-tilled water centrif. | 29.60 ± 0.90 | 3.16 ± 0.09 | 4.58 ± 0.13 | 0.00 ± 0.00 | 0.28 ± 0.02 | 0.78 ± 0.12 | 0.58 ± 0.05 |
Notes: *Step 10 and 11 were considered unreliable for quantitative interpretation because the very low number of residual grains resulted in substantial exposure of the silver-paste substrate within the analysed areas.
Table 2.
Mean elemental composition (wt%) of sample URA 5.2 throughout the sequential OSL preparation workflow. Values represent mean ± standard error of the mean calculated from five independent SEM-EDS analytical areas.
Table 2.
Mean elemental composition (wt%) of sample URA 5.2 throughout the sequential OSL preparation workflow. Values represent mean ± standard error of the mean calculated from five independent SEM-EDS analytical areas.
| No. | Step name | Si | Al | Kcorr | Na | Ca | Fe | Ti |
|---|---|---|---|---|---|---|---|---|
| 1 | Before treat-ment | 21.56 ± 0.68 | 8.06 ± 0.33 | 7.56 ± 1.27 | 0.40 ± 0.06 | 1.00 ± 0.03 | 4.82 ± 0.24 | 0.40 ± 0.04 |
| 2 | After HCL | 25.40 ± 0.67 | 8.64 ± 0.26 | 5.84 ± 1.30 | 0.44 ± 0.07 | 0.52 ± 0.02 | 2.96 ± 0.20 | 0.64 ± 0.05 |
| 3 | After H2O2 | 22.64 ± 0.78 | 9.04 ± 1.47 | 8.50 ± 1.02 | 0.34 ± 0.04 | 0.34 ± 0.02 | 2.00 ± 0.10 | 0.40 ± 0.03 |
| 4 | 63-90 μm | 28.56 ± 0.49 | 5.30 ± 0.08 | 5.70 ± 0.40 | 1.00 ± 0.06 | 0.36 ± 0.05 | 0.70 ± 0.08 | 0.08 ± 0.04 |
| 5 | ρ < 2.62 g/cm3 I | 29.82 ± 0.35 | 5.12 ± 0.31 | 4.52 ± 0.37 | 1.68 ± 0.10 | 0.12 ± 0.04 | 0.38 ± 0.02 | 0.00 ± 0.00 |
| 6 | ρ < 2.62 g/cm3 II | 32.22 ± 0.41 | 4.06 ± 0.24 | 3.40 ± 0.30 | 1.18 ± 0.07 | 0.16 ± 0.02 | 0.34 ± 0.02 | 0.00 ± 0.00 |
| 7 | ρ > 2.62 g/cm3 II | 31.76 ± 0.35 | 3.70 ± 0.29 | 3.68 ± 0.26 | 0.92 ± 0.07 | 0.42 ± 0.06 | 0.78 ± 0.07 | 0.16 ± 0.04 |
| 8 | ρ 2.62-2.75 g/cm3 I | 32.64 ± 0.41 | 3.52 ± 0.33 | 3.66 ± 0.24 | 0.84 ± 0.07 | 0.22 ± 0.04 | 0.42 ± 0.02 | 0.02 ± 0.02 |
| 9 | ρ > 2.75 g/cm3 I | 24.42 ± 0.42 | 8.46 ± 0.10 | 6.06 ± 0.36 | 0.66 ± 0.04 | 1.12 ± 0.08 | 2.16 ± 0.09 | 0.66 ± 0.13 |
| 10* | ρ 2.62-2.75 g/cm3, after HF | 40.86 ± 0.62 | 1.08 ± 0.12 | 1.57 ± 0.17 | 0.00 ± 0.00 | 0.00 ± 0.00 | 0.00 ± 0.00 | 0.00 ± 0.00 |
| 11* | ρ 2.62-2.75 g/cm3, after HF and sieving | 36.48 ± 0.59 | 2.04 ± 0.52 | 2.63 ± 0.64 | 0.00 ± 0.00 | 0.00 ± 0.00 | 0.00 ± 0.00 | 0.00 ± 0.00 |
| 12 | < 63 μm | 23.60 ± 1.04 | 8.86 ± 0.76 | 7.56 ± 1.24 | 0.26 ± 0.04 | 0.40 ± 0.03 | 2.04 ± 0.13 | 0.48 ± 0.04 |
| 13 | 11-63 μm | 25.76 ± 0.17 | 7.16 ± 0.06 | 7.06 ± 0.28 | 0.60 ± 0.03 | 0.44 ± 0.02 | 2.00 ± 0.04 | 0.40 ± 0.03 |
| 14 | < 11 μm | 22.22 ± 1.13 | 7.28 ± 0.38 | 8.26 ± 0.71 | 0.20 ± 0.04 | 0.44 ± 0.02 | 2.06 ± 0.11 | 0.52 ± 0.05 |
| 15 | < 11 μm, after H2SiF6 | 29.16 ± 1.78 | 5.26 ± 0.55 | 7.10 ± 0.89 | 0.02 ± 0.02 | 0.30 ± 0.00 | 0.84 ± 0.12 | 0.80 ± 0.09 |
| 16 | 4-11 μm, after H2SiF6 + dis-tilled water centrif. | 32.92 ± 1.00 | 5.40 ± 0.35 | 6.20 ± 0.69 | 0.06 ± 0.02 | 0.32 ± 0.02 | 1.02 ± 0.12 | 0.96 ± 0.08 |
Notes: *Step 10 and 11 were considered unreliable for quantitative interpretation because the very low number of residual grains resulted in substantial exposure of the silver-paste substrate within the analysed areas.
Table 3.
Quartz purity values derived from the QPI at selected key stages of the extraction procedure for samples URA5.1 and URA5.2.
Table 3.
Quartz purity values derived from the QPI at selected key stages of the extraction procedure for samples URA5.1 and URA5.2.
| No. | Step name | URA 5.1 quartz proportion (%) | URA 5.2 quartz proportion (%) |
|---|---|---|---|
| 1 | Before treatment | 49.5 ± 0.7 | 47.8 ± 1.3 |
| 2 | After HCL | 58.3 ± 1.6 | 56.2 ± 1.6 |
| 3 | After H2O2 | 61.3 ± 0.7 | 52.3 ± 3.1 |
| 4 | 63-90 μm | 72.9 ± 0.7 | 68.0 ± 1.0 |
| 8 | ρ 2.62-2.75 g/cm3 I | 72.9 ± 2.1 | 78.7 ± 1.1 |
| 10 | ρ 2.62-2.75 g/cm3, after HF | 66* | 93.9 ± 0.7 |
| 11 | ρ 2.62-2.75 g/cm3, after HF and sieving | pure quartz (qualitative)** | 88.9 ± 2.5 |
| 15 | < 11 μm, after H2SiF6 | 80.1 ± 1.1 | 67.1 ± 2.3 |
| 16 | 4-11 μm, after H2SiF6 + distilled water centrif. | 75.9 ± 1.1 | 70.0 ± 1.5 |
*From grain-by-grain EDS map assessment (n = 378 grains); bulk EDS unreliable due to substrate interference. **Based on visual inspection of Si and Al elemental maps only; grain count insufficient for quantitative assessment.
Disclaimer/Publisher’s Note: The statements, opinions and data contained in all publications are solely those of the individual author(s) and contributor(s) and not of MDPI and/or the editor(s). MDPI and/or the editor(s) disclaim responsibility for any injury to people or property resulting from any ideas, methods, instructions or products referred to in the content. |
© 2026 by the authors. Licensee MDPI, Basel, Switzerland. This article is an open access article distributed under the terms and conditions of the Creative Commons Attribution (CC BY) license (http://creativecommons.org/licenses/by/4.0/).
Copyright: This open access article is published under a Creative Commons CC BY 4.0 license, which permit the free download, distribution, and reuse, provided that the author and preprint are cited in any reuse.


