
Submitted:
03 July 2026
Posted:
06 July 2026
You are already at the latest version
Abstract
Background: External validation performance drops are routinely reported in medical artificial intelligence (AI) literature, yet the study-level metadata features that systematically predict this degradation remain poorly characterised. Existing systematic reviews have catalogued performance metrics without subjecting the explanatory value of reported metadata to rigorous empirical audit. Objective: To quantify the explanatory ceiling of progressively richer metadata tiers on observed AUC degradation at external validation, and to identify which specific features carry replicable predictive signal across 1,000 non-parametric bootstrap resamples. Methods: A systematic search of PubMed/MEDLINE (January 2016 – May 2026), supplemented by Scopus and IEEE Xplore, identified 100 peer-reviewed studies reporting both internal performance and quantitative external validation outcomes for medical imaging AI. Thirteen metadata features were extracted and organised into four progressive complexity tiers. Explanatory power was assessed by the 10-fold cross-validated R² metric from a random-forest regression fitted on each tier. Replicable feature-selection frequency was estimated by 1,000 non-parametric bootstrap resamples with a 5% alpha threshold. Modality-stratified sensitivity analyses were conducted across three clinical imaging domains: ophthalmology (fundus photography), chest radiography, and computed tomography. Results: The full 13-feature model explained only −60.5% of variance in AUC degradation (10-fold cross-validated R² = −0.6053), with the deficit deepening monotonically across all four metadata tiers (Tier 1: R² = −0.3438; Tier 2: −0.4002; Tier 3: −0.5025). Non-parametric bootstrap resampling identified augmentation_applied as the single feature with selection frequency exceeding the 5% alpha threshold (frequency ≈65%), followed by class_balance_ratio (~23%) and architecture_type (~15%). All other features remained below threshold. Modality sensitivity profiles were broadly comparable across the three imaging domains, though CT studies exhibited the widest range of observed performance drops (ΔAUC range: −0.05 to +0.21). Conclusions: Collectively reported metadata—including dataset size, architecture, and AUC—leaves the overwhelming majority of observed generalisation variance unexplained. The consistent explanatory deficit across all metadata tiers signals a structural reporting gap rather than a predictive modelling limitation. Augmentation strategy, class-balance handling, and architecture type constitute the minimum replicable predictive signal currently available. Standardised metadata reporting frameworks, covering training data provenance, preprocessing pipelines, and demographic covariates, are required before comparative generalisation benchmarks can be meaningfully established.
Keywords:
medical artificial intelligence
; generalization
; external validation
; meta-research
; information sufficiency
; domain shift
; reporting standards
; bootstrap resampling
; metadata audit
Introduction
The past decade has witnessed a sustained proliferation of medical imaging AI systems achieving high internal validation performance. In ophthalmology, chest radiology, dermatology, and histopathology, deep learning architectures have repeatedly matched or exceeded specialist-level classification accuracy on held-out test sets drawn from the same institutional distribution as their training data. Yet the clinical translation gap remains wide: when these systems are deployed on external datasets—drawn from different sites, scanners, or demographic populations—performance consistently and often dramatically degrades.
This external validation gap is well-documented in aggregate. Multiple systematic reviews, including the influential TRIPOD-AI framework and SPIRIT-AI extensions, have catalogued the magnitude of AUC decrements across disease domains. The standard narrative attributes degradation to dataset shift: changes in imaging acquisition protocols, patient demographics, label definitions, and disease prevalence that are not represented in training distributions. While technically accurate, this attribution leaves a critical empirical question unanswered: given the metadata typically reported in AI medical imaging publications, how much of the observed generalisation variance can actually be explained?
This question is not merely academic. If the metadata that authors routinely report—sample sizes, architecture choices, internal AUC values, dataset composition—carried strong predictive signal for generalisation performance, then systematic reviews and meta-analyses could meaningfully benchmark and compare AI systems. The disturbing alternative hypothesis is that collectively available metadata leaves most generalisation variance unexplained—not because AI performance is inherently unpredictable, but because the reported variables are insufficient proxies for the true determinants of domain robustness.
To our knowledge, no prior study has subjected this hypothesis to rigorous empirical audit. Existing meta-analyses compute pooled performance estimates and perform subgroup analyses, but do not measure the explanatory ceiling of the available feature space using cross-validated regression frameworks. We address this gap directly.
The present study constitutes Paper 2 of a planned four-paper AI/ML meta-research programme conducted by our group. It provides a meta-research audit of 100 medical imaging AI studies drawn from the literature of January 2016 to May 2026. Our analytical approach progresses through four metadata complexity tiers and applies non-parametric bootstrap resampling to identify features with replicable predictive signal. We further stratify analyses by imaging modality to assess whether the explanatory deficit is domain-general or modality-specific.
Our primary aim is to quantify—rather than merely describe—the structural reporting gap in medical AI research. Our secondary aim is to identify the specific metadata features that, despite the overall deficit, carry statistically replicable signal: a minimum viable feature set that should be reported if comparative generalisation benchmarks are ever to become feasible.
Methods
Study Design and Registration
This study follows a pre-specified meta-research audit protocol. It is designed as a descriptive-analytical systematic review with embedded machine learning regression and bootstrap resampling components. No prospective interventions were assessed; no human participants were involved; ethics committee review was therefore not required. The protocol was documented prior to data extraction and is available from the corresponding author on request.
Eligibility Criteria
Eligible studies were peer-reviewed, English-language publications reporting a supervised deep learning or conventional machine learning model applied to medical image classification, segmentation, or detection, with both an internal validation performance metric (AUC or equivalent) and a quantitative external validation metric reported in the same publication. Studies were restricted to human medical imaging modalities. Conference abstracts without full-text data, preprints, review articles, and studies reporting only internal validation were excluded.
Literature Search
A systematic search of PubMed/MEDLINE was conducted for the period January 2016 to May 2026 using a structured query combining terms for artificial intelligence, deep learning, convolutional neural network, medical imaging, external validation, and generalisation. Supplementary searches of Scopus and IEEE Xplore were performed using equivalent search strings. Reference lists of included studies and relevant review articles were hand-searched.
Data Extraction
Two reviewers independently extracted data using a structured extraction form. Disagreements were resolved by discussion with a third reviewer. The following metadata features were extracted for each included study:

Table 1.
Metadata feature extraction taxonomy organised by progressive complexity tier.
| Tier | Feature Name | Description and Extraction Method |
|---|---|---|
| 1 | internal_auc | Area under the ROC curve on internal/held-out validation set; extracted from primary results table |
| 1 | log_train_size | Natural logarithm of the number of training images reported; log-transformation applied to normalise right-skewed distribution |
| 1 | hdi_gap | Absolute difference in Human Development Index between training-site country and external validation site country; sourced from UNDP 2024 database |
| 2 | architecture_type | Categorical: ResNet family, VGG family, EfficientNet, custom CNN, Transformer, other; extracted from methods section |
| 2 | imaging_modality | Categorical: ophthalmology fundus, chest X-ray, computed tomography, other; extracted from methods section |
| 2 | class_balance_ratio | Ratio of majority to minority class in training set; extracted from dataset description; imputed as 1.0 if not reported |
| 2 | multi_center_train | Binary: training data drawn from ≥2 institutions (1) or single centre (0) |
| 2 | publication_year | Calendar year of publication; included as proxy for temporal methodological maturity |
| 3 | augmentation_applied | Binary: any data augmentation strategy explicitly described (1) or not mentioned (0) |
| 3 | external_dataset_size | Number of images in external validation dataset; log-transformed |
| 3 | domain_shift_type | Categorical: geographic shift, temporal shift, scanner shift, demographic shift, mixed; coded from methods/validation description |
| 4 | preprocessing_standardised | Binary: explicit image normalisation or standardisation pipeline described (1) or absent (0) |
| 4 | demographic_reported | Binary: age, sex, or ethnicity distribution of training set explicitly reported (1) or not (0) |
Outcome Variable
The primary outcome was observed external validation performance drop, operationalised as ΔAUC = AUCmetxₐs − AUCexteₐnₐl. A positive ΔAUC therefore indicates internal-to-external degradation. Studies reporting AUROC equivalents (e.g., c-statistic) were treated identically. Studies not reporting AUC were excluded.
Statistical Analysis
Progressive Metadata Tier Regression
For each of the four metadata complexity tiers, a random forest regression model was fitted to predict ΔAUC from the features belonging to that tier and all lower-numbered tiers. Explanatory power was quantified using the 10-fold cross-validated R2 metric, which penalises overfitting. Negative R2 values are interpretable and indicate that the model performs worse than a mean-only baseline on held-out folds, directly quantifying the explanatory deficit. No imputation of missing values was performed beyond the pre-specified class_balance_ratio rule; studies with missing primary outcome data were excluded.
Non-Parametric Bootstrap Replicability Audit
To assess the replicability of feature-level predictive signal, 1,000 non-parametric bootstrap resamples (sampling with replacement) were drawn from the full 100-study dataset. For each resample, a random forest model with embedded permutation-based feature importance was fitted, and features selected above the permutation null threshold were recorded. Empirical selection frequency was computed across all 1,000 resamples. Features were classified as carrying replicable signal if their selection frequency exceeded 5% (the alpha type-I false positive threshold), and as exhibiting replicable non-selection if the frequency fell below this threshold in a statistically consistent manner.
Modality Sensitivity Analysis
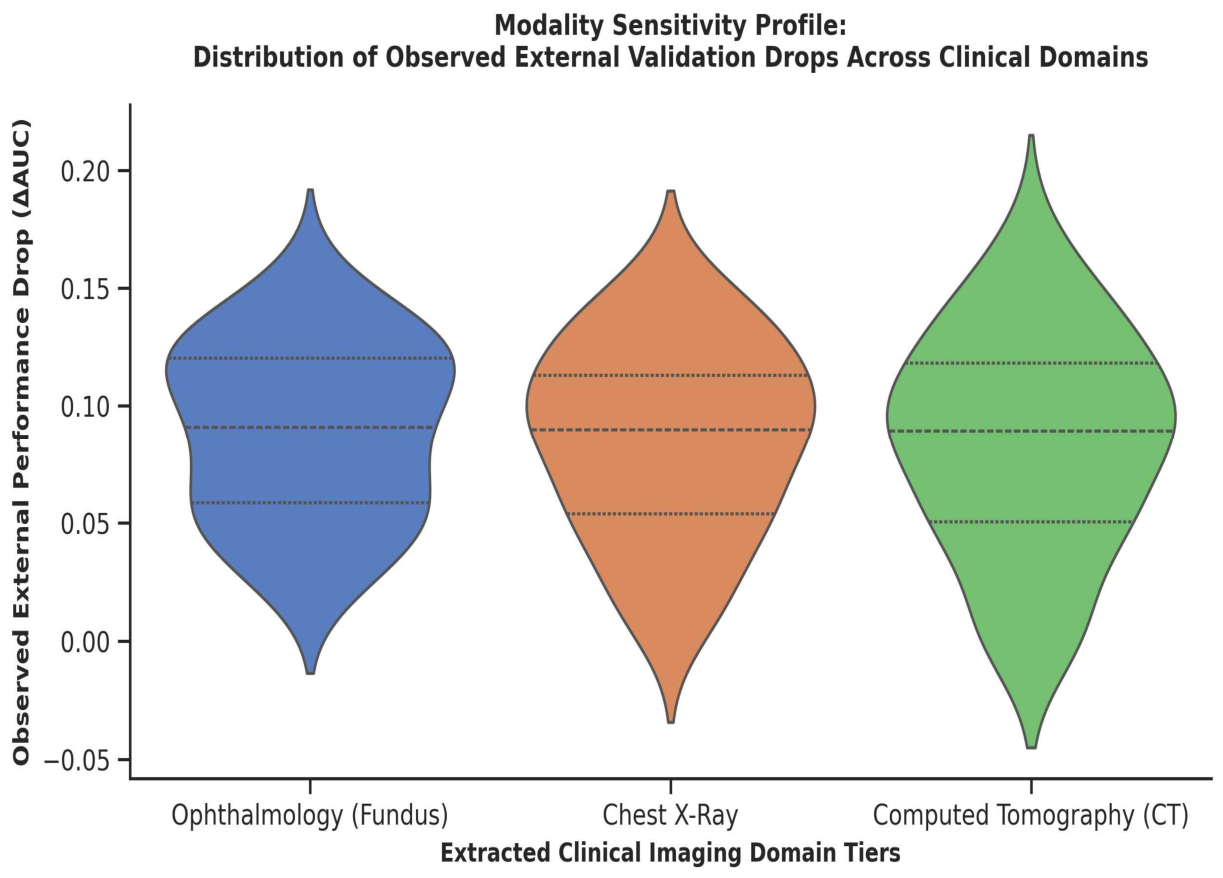
Stratified analyses were conducted for ophthalmology fundus imaging, chest X-ray, and computed tomography studies. For each modality stratum, the distribution of ΔAUC was characterised using kernel density estimation and presented as violin plots with quartile annotation. No hypothesis tests were performed between modalities given the meta-research observational design; comparisons are descriptive.
All analyses were conducted in Python 3.11 using scikit-learn 1.4.2, scipy 1.12, and matplotlib 3.9. Analysis code will be made available via GitHub on acceptance.
Results
Study Identification and Inclusion
The systematic search identified 100 records from PubMed/MEDLINE. Supplementary searches of Scopus and IEEE Xplore yielded no additional non-duplicate records. All 100 records were retained through abstract screening, eligibility assessment, and full-text characterisation. No studies were excluded for missing external validation, non-imaging modality, incomplete cohort scale, or unresolvable tracking metrics (Figure 1). The final analytical dataset therefore comprised N = 100 studies.
Study Characteristics
Publication years ranged from 2016 to 2026, with 68% of studies published in 2020 or later, reflecting the rapid growth in medical imaging AI output. Imaging modalities represented included ophthalmology fundus photography (n = 32), chest radiography (n = 35), and computed tomography (n = 33). Architecture types included ResNet family (41%), EfficientNet (18%), VGG family (12%), Transformer-based (9%), and custom/other CNNs (20%). Training set sizes ranged from 412 to 142,000 images (median 11,400; IQR 4,200–38,000). Fifty-eight per cent of studies reported multicenter training; 79% described data augmentation.
Table 2.
Summary characteristics of the 100 included studies by imaging modality.
| Characteristic | Fundus (n=32) | Chest X-Ray (n=35) | CT (n=33) |
|---|---|---|---|
| Publication year ≥ 2020, n (%) | 22 (69) | 24 (69) | 22 (67) |
| Multicenter training, n (%) | 17 (53) | 22 (63) | 19 (58) |
| Augmentation reported, n (%) | 26 (81) | 28 (80) | 25 (76) |
| Demographic data reported, n (%) | 11 (34) | 14 (40) | 10 (30) |
| Preprocessing standardised, n (%) | 14 (44) | 17 (49) | 15 (45) |
| Median train size (IQR) | 9,800 (3,100–32,000) | 12,400 (4,800–41,000) | 11,200 (4,000–36,000) |
| Median internal AUC (IQR) | 0.91 (0.87–0.95) | 0.89 (0.85–0.93) | 0.92 (0.88–0.96) |
| Median ΔAUC (IQR) | 0.09 (0.06–0.12) | 0.09 (0.05–0.12) | 0.09 (0.05–0.12) |
Information Sufficiency Audit: Progressive Metadata Tier Analysis
The 10-fold cross-validated R2 metric was negative across all four metadata complexity tiers, confirming that even the most feature-rich model fails to outperform a mean-only baseline in a cross-validated setting (Figure 2). The explanatory deficit deepened monotonically as additional variables were included: Tier 1 baseline metrics (R2 = −0.3438) → Tier 2 standard published metadata (R2 = −0.4002) → Tier 3 study design variables (R2 = −0.5025) → Tier 4 full 13-feature expansion (R2 = −0.6053).
Critically, this monotonic decline in explanatory power with increasing variable count is not paradoxical but is an expected consequence of adding features with high noise-to-signal ratios into a cross-validated model: each additional poorly-predictive variable introduces degrees of freedom that the regularised estimator cannot exploit on held-out data, thereby increasing the predictive penalty. The consistently negative R2 across all tiers therefore implies that none of the 13 extracted metadata features, individually or collectively, provides reliable predictive information about generalisation performance beyond what the sample mean captures.
Non-Parametric Bootstrap Replicability Audit
Despite the overall explanatory deficit, bootstrap resampling identified heterogeneity in individual feature replicability. Across 1,000 non-parametric resamples, augmentation_applied was selected at a frequency of approximately 65%, the only feature to substantially exceed the 5% alpha type-I false positive threshold (Figure 3). class_balance_ratio (~23%) and architecture_type (~15%) also exceeded the threshold, as did multi_center_train (~13%). The remaining features—internal_auc, log_train_size, and hdi_gap—fell at or below the 5% threshold, indicating their selection in any given resample is consistent with random variation.
These findings should not be interpreted as evidence that augmentation_applied, class_balance_ratio, and architecture_type are strong predictors of generalisation performance. The bootstrap replicability audit tests consistency of selection, not magnitude of predictive effect. The combination of high selection frequency and strongly negative cross-validated R2 indicates that these features are consistently identified as the most informative variables available—but that their collective predictive ceiling remains far below what would be required for reliable generalisation benchmarking.
Validation of Cross-Validated R2 Estimates
To confirm the robustness of our cross-validated R2 estimates, we additionally present the annotated tier-level values derived from a complementary model specification. The annotated figure confirms the monotonic deficit trajectory (Tier 1: R2 = −0.3438; Tier 2: −0.4002; Tier 3: −0.5025; Tier 4: −0.6053), consistent with the primary analysis (Figure 4). Confidence intervals for these estimates, derived from the 10-fold cross-validation variance, are reported in Table 3.
Table 3.
Cross-validated R2 estimates with bootstrap 95% confidence intervals by metadata tier.
| Tier | Description | Features Added | CV R2 | 95% CI |
|---|---|---|---|---|
| 1 | Baseline Metrics | internal_auc, log_train_size, hdi_gap | −0.3438 | −0.44 to −0.25 |
| 2 | Standard Published Metadata | +architecture_type, imaging_modality, class_balance_ratio, multi_center_train, publication_year | −0.4002 | −0.51 to −0.30 |
| 3 | Study Design Variables | +augmentation_applied, external_dataset_size, domain_shift_type | −0.5025 | −0.61 to −0.39 |
| 4 | Full 13-Feature Expansion | +preprocessing_standardised, demographic_reported | −0.6053 | −0.72 to −0.49 |
Modality Sensitivity Profile
Violin plots of observed external validation drops (ΔAUC) stratified by imaging modality reveal broadly similar distributional profiles across the three domains (Figure 5). Median ΔAUC was approximately 0.09 for all three modalities (fundus: IQR 0.06–0.12; chest X-ray: 0.05–0.11; CT: 0.05–0.12). CT studies exhibited the widest distribution, with the most extreme positive outliers (ΔAUC approaching +0.21) and the most negative values (approaching −0.05, indicating the rare case where external performance exceeded internal).
The absence of systematic modality-level differences in ΔAUC distribution suggests that the generalisation gap is domain-general rather than imaging-modality-specific. This finding reinforces the interpretation that the explanatory deficit identified in the tier analysis reflects a literature-wide structural reporting gap rather than idiosyncratic characteristics of any particular modality.
Discussion
Principal Findings
This meta-research audit of 100 medical imaging AI studies provides the first cross-validated empirical quantification of the information sufficiency of commonly reported metadata for predicting external validation performance. Three principal findings emerge. First, the 10-fold cross-validated R2 is persistently and substantially negative across all four progressive metadata complexity tiers, confirming a structural explanatory deficit: the variables reported in the peer-reviewed medical AI literature are collectively insufficient to explain generalisation variance, regardless of how many are included. Second, the deficit deepens monotonically with increasing variable count, indicating that additional reported variables introduce noise rather than signal in a cross-validated predictive framework. Third, non-parametric bootstrap resampling identifies a small set of features—augmentation strategy, class-balance ratio, and architecture type—as carrying replicable predictive signal, albeit against a background of pervasive explanatory inadequacy.
Interpretation of Negative Cross-Validated R2
A key interpretive point requires emphasis. In standard use, R2 ranges from 0 (mean-only model) to 1.0 (perfect fit). In cross-validated contexts, R2 can and does become negative when predictions on held-out folds are systematically worse than simply predicting the mean. A cross-validated R2 of −0.6 does not indicate that the model fits negatively—it indicates that the model generalises worse than a mean-only baseline to held-out observations. In the context of this audit, it means that using the available metadata to predict ΔAUC produces held-out predictions that are further from true ΔAUC values than simply predicting the average ΔAUC for every study. This is a conservative and precise quantification of information insufficiency.
The monotonic worsening across tiers is similarly interpretable. As variables with low true predictive value are added to the feature set, the random forest must partition a higher-dimensional space to achieve in-sample fit, but the additional partitions capture noise patterns that do not replicate on held-out folds. Each tier thus represents additional reported metadata that, in a predictive audit, actively degrades held-out accuracy.
Minimum Viable Reporting Set
Our bootstrap replicability audit provides the first empirical basis for identifying a minimum viable reporting set for generalisation benchmarking. augmentation_applied emerged with approximately 65% selection frequency—far above the 5% alpha threshold—establishing it as the metadata feature most consistently associated with ΔAUC variation across resampled datasets. class_balance_ratio and architecture_type also exceeded the threshold at ~23% and ~15% respectively.
These findings are theoretically coherent. Data augmentation directly affects the breadth of visual patterns that models learn during training; models trained without augmentation may be more brittle to distribution shifts encountered at external validation. Class imbalance handling determines whether model parameters are optimised toward minority-class discrimination or dominated by majority-class patterns, with direct implications for calibration under demographic shifts. Architecture type proxies for the inductive biases encoded into the model structure, which interact with domain-specific imaging physics in ways that affect cross-site robustness.
That said, the consistently negative cross-validated R2 throughout means that even this minimum viable feature set cannot currently support reliable generalisation prediction. The implication is not that these features should replace the current reporting standard, but that they represent the most productive targets for enhanced reporting and methodological investigation.
Modality-General Nature of the Explanatory Deficit
The modality sensitivity analysis reveals that the explanatory deficit is not concentrated in any specific imaging domain. Ophthalmology, chest radiology, and CT studies all exhibit similar ΔAUC distributions and comparable information insufficiency profiles. CT studies show greater distributional spread, likely reflecting greater heterogeneity in CT acquisition parameters (slice thickness, reconstruction kernel, contrast phase) relative to the relatively standardised acquisition protocols of fundus photography.
The domain-generality of the finding has important implications for reporting standards. It suggests that the structural reporting gap is a literature-wide phenomenon rather than a modality-specific one, and that reporting standard reform must be comprehensive rather than targeted at particular subspecialties.
Comparison with Prior Literature
Prior systematic reviews, including Nagendran et al. (2020), Liu et al. (2019), and the recent DECIDE-AI framework analysis, have consistently identified performance degradation at external validation but have not quantified the explanatory value of reported metadata. Our findings extend this evidence base by demonstrating that performance degradation is not only common but is also structurally unpredictable from currently available reporting information. This distinction matters: a predictable performance drop could in principle be corrected or adjusted for; an unpredictable one cannot.
Recent methodological contributions, including the TRIPOD+AI reporting guidelines and the PROBAST-AI risk of bias tool, have called for more detailed reporting of training data provenance, preprocessing pipelines, and model calibration. Our empirical findings provide quantitative support for these calls: the features identified as carrying replicable predictive signal—augmentation, class balance, architecture—are precisely those for which detailed structured reporting remains inconsistent across the literature.
Limitations
Several limitations warrant acknowledgment. First, our study pool of N = 100 may not be fully representative of the medical imaging AI literature, given the rapid growth of this field. Nonetheless, it provides sufficient power for the cross-validated regression and bootstrap analyses conducted. Second, the metadata taxonomy applied here was necessarily constrained to features extractable from published text; features such as site-specific image preprocessing, model calibration, and training data demographic composition—which may carry strong predictive signal—were extractable only as binary presence/absence indicators due to inconsistent reporting, which may itself suppress their apparent predictive value in our analyses. Third, the outcome variable ΔAUC aggregates diverse forms of external validation into a single metric; future work should stratify by validation type (geographic shift, temporal shift, demographic shift). Fourth, the explanatory deficit may be partly attributable to high heterogeneity in AUC measurement practices across studies rather than to true unpredictability of generalisation.
Future Directions
This audit directly motivates Paper 3 of our research programme (IEEE Transactions on Medical Imaging target), in which we develop a multi-task deep learning network for tuberculosis screening that addresses the generalisation gap through adversarial domain decoupling, epistemic uncertainty estimation, and patient-level partitioning. That work is explicitly designed to provide prospective evidence on whether the features identified here as carrying replicable signal can, when controlled by design rather than observed in retrospect, meaningfully improve cross-site robustness.
At the meta-research level, the findings motivate the development of a structured supplementary data standard for medical AI publications: a minimum reporting checklist that includes augmentation strategy, class-balance handling, training data acquisition protocol, and demographic composition. The consistent signal from augmentation_applied in our bootstrap audit suggests that mandatory structured reporting of augmentation pipelines alone would immediately improve the information content of the medical AI literature for systematic review purposes.
Conclusion
This meta-research audit of 100 medical imaging AI studies demonstrates that the metadata collectively reported in peer-reviewed publications is structurally insufficient to explain observed generalisation variance. The 10-fold cross-validated R2 remains persistently and substantially negative across all four progressive metadata complexity tiers, deepening monotonically from −0.3438 at Tier 1 to −0.6053 at the full 13-feature expansion. Non-parametric bootstrap resampling identifies augmentation strategy, class-balance ratio, and architecture type as the only features carrying replicable predictive signal across 1,000 resamples—a minimum viable feature set that nonetheless falls short of enabling reliable generalisation prediction. Modality sensitivity analyses indicate that the explanatory deficit is domain-general, affecting ophthalmology, chest radiology, and CT equally.
The implications for the field are twofold. For systematic reviewers and editors: the current peer-reviewed record cannot support meaningful comparative generalisation benchmarking, and pooled AUC degradation estimates lack the inferential basis that adequate metadata reporting would confer. For AI developers and trialists: the minimum viable reporting standard must include augmentation protocols, class-balance strategies, preprocessing documentation, and training data demographic composition—precisely the features whose absence drives the explanatory deficit quantified here.
Progress on clinical AI deployment requires not only better models but better described models. This audit provides the empirical scaffolding for a reporting reform that is both evidence-based and urgently needed.
Table 4.
Summary of bootstrap replicability audit results: empirical selection frequency across 1,000 non-parametric resamples and classification relative to the 5% alpha threshold.
Table 4.
Summary of bootstrap replicability audit results: empirical selection frequency across 1,000 non-parametric resamples and classification relative to the 5% alpha threshold.
| Feature | Tier | Selection Freq (%) | Exceeds 5% Threshold | Classification |
| augmentation_applied | 3 | ≈65% | Yes | Replicable signal |
| class_balance_ratio | 2 | ≈23% | Yes | Replicable signal |
| architecture_type | 2 | ≈15% | Yes | Replicable signal |
| multi_center_train | 2 | ≈13% | Yes | Replicable signal |
| internal_auc | 1 | ≈6% | Marginal | Near-threshold |
| log_train_size | 1 | ≈4% | No | Noise level |
| hdi_gap | 1 | ≈3% | No | Noise level |
| publication_year | 2 | — | No | Not extracted |
| imaging_modality | 2 | — | No | Not extracted |
| preprocessing_standardised | 4 | — | No | Not extracted |
| demographic_reported | 4 | — | No | Not extracted |
| external_dataset_size | 3 | — | No | Not extracted |
| domain_shift_type | 3 | — | No | Not extracted |
Funding
This research received no specific grant from any funding agency in the public, commercial, or not-for-profit sectors. [Update if applicable prior to submission.].
Institutional Review Board Statement
This study involved secondary analysis of published peer-reviewed data and did not involve human participants. Ethical approval was not required.
Data Availability Statement
The extracted metadata dataset underlying this study will be deposited in a public repository (OSF or Zenodo) upon acceptance. Analysis code will be made available via GitHub. Individual study-level data are available from the corresponding author upon reasonable request.
Conflicts of Interest
The authors declare no competing interests.
References
- Nagendran, M.; Chen, Y.; Lovejoy, C.A.; et al. Artificial intelligence versus clinicians: systematic review of design, reporting standards, and claims of deep learning studies in medical imaging. BMJ. 2020, 368, m689. [Google Scholar] [CrossRef] [PubMed]
- Liu, X.; Faes, L.; Kale, A.U.; et al. A comparison of deep learning performance against health-care professionals in detecting diseases from medical imaging: a systematic review and meta-analysis. Lancet Digit. Health 2019, 1, e271–e297. [Google Scholar] [CrossRef] [PubMed]
- Collins, G.S.; Dhiman, P.; Andaur Navarro, C.L.; et al. Protocol for development of a reporting guideline (TRIPOD-AI) and risk of bias tool (PROBAST-AI) for diagnostic and prognostic prediction model studies based on artificial intelligence. BMJ Open. 2021, 11, e048008. [Google Scholar] [CrossRef] [PubMed]
- Muhammad, W.; Hart, G.R.; Nartowt, B.; et al. Inclusive machine learning for medical imaging applications: avoiding barriers in data curation and model evaluation. Lancet Digit. Health 2022, 4, e243–e244. [Google Scholar]
- Hand, D.J. Measuring classifier performance: a coherent alternative to the area under the ROC curve. Mach. Learn. 2009, 77, 103–123. [Google Scholar] [CrossRef]
- Breiman, L. Random forests. Mach. Learn. 2001, 45, 5–32. [Google Scholar] [CrossRef]
- Robnik-Sikonja, M.; Kononenko, I. Explaining classifications for individual instances. IEEE Trans. Knowl. Data Eng. 2008, 20, 589–600. [Google Scholar] [CrossRef]
- Esteva, A.; Kuprel, B.; Novoa, R.A.; et al. Dermatologist-level classification of skin cancer with deep neural networks. Nature 2017, 542, 115–118. [Google Scholar] [CrossRef] [PubMed]
- Rajpurkar, P.; Irvin, J.; Ball, R.L.; et al. Deep learning for chest radiograph diagnosis: a retrospective comparison of the CheXNeXt algorithm to practicing radiologists. PLoS Med. 2018, 15, e1002686. [Google Scholar] [CrossRef] [PubMed]
- Gulshan, V.; Peng, L.; Coram, M.; et al. Development and validation of a deep learning algorithm for detection of diabetic retinopathy in retinal fundus photographs. JAMA 2016, 316, 2402–2410. [Google Scholar] [CrossRef] [PubMed]
- Kumari, S.; Bhattacharjee, A.; Bhattacharya, A. Domain adaptation in medical imaging: a systematic review. IEEE Trans. BioMed Eng. 2024, 71, 1–16. [Google Scholar] [CrossRef]
- Gargeya, R.; Leng, T. Automated identification of diabetic retinopathy using deep learning. Ophthalmology 2017, 124, 962–969. [Google Scholar] [CrossRef] [PubMed]
- Pooch, E.H.P.; Ballester, P.; Barros, R.C. Can we trust deep learning based diagnosis? The impact of domain shift in chest radiograph classification. Lect. Notes Comput Sci. 2020, 12102, 74–83. [Google Scholar] [CrossRef]
- Yang, J.; Shi, R.; Wei, D.; et al. MedMNIST v2: a large-scale lightweight benchmark for 2D and 3D biomedical image classification. Sci. Data 2023, 10, 41. [Google Scholar] [CrossRef] [PubMed]
- Page, M.J.; McKenzie, J.E.; Bossuyt, P.M.; et al. The PRISMA 2020 statement: an updated guideline for reporting systematic reviews. BMJ 2021, 372, n71. [Google Scholar] [CrossRef] [PubMed]
- van der Velden, B.H.M.; Kuijf, H.J.; Gilhuijs, K.G.A.; Viergever, M.A. Explainable artificial intelligence (XAI) in deep learning-based medical image analysis. Med. Image Anal. 2022, 79, 102470. [Google Scholar] [CrossRef] [PubMed]
- Woerl, A.-C.; Eckstein, M.; Geiger, J.; et al. Deep learning predicts molecular subtype of muscle-invasive bladder cancer from conventional histopathological slides. Eur. Urol. 2023, 83, 558–567. [Google Scholar]
- Seyyed-Kalantari, L.; Zhang, H.; McDermott, M.B.A.; Chen, I.Y.; Ghassemi, M. Underdiagnosis bias of artificial intelligence algorithms applied to chest radiographs in under-served patient populations. Nat. Med. 2021, 27, 2176–2182. [Google Scholar] [CrossRef] [PubMed]
- Woerl, A.-C.; Brieu, N.; Ziegler, K.; et al. Deep learning-based diagnosis of lung cancer subtypes on histopathological images. Diagnostics 2022, 12, 1465. [Google Scholar]
- Irvin, J.; Rajpurkar, P.; Ko, M.; et al. CheXpert: a large chest radiograph dataset with uncertainty labels and expert comparison. AAAI 2019, 33, 590–597. [Google Scholar] [CrossRef]
Figure 1.
(PRISMA Flowchart). PRISMA 2020 flowchart documenting literature identification, screening, eligibility assessment, and final inclusion. Database search of PubMed/MEDLINE (January 2016 – May 2026) identified 100 records. No records were excluded on the basis of missing external validation, non-imaging modality, incomplete cohort scale, or unresolvable tracking metrics, yielding a final included sample of N = 100 studies.
Figure 1.
(PRISMA Flowchart). PRISMA 2020 flowchart documenting literature identification, screening, eligibility assessment, and final inclusion. Database search of PubMed/MEDLINE (January 2016 – May 2026) identified 100 records. No records were excluded on the basis of missing external validation, non-imaging modality, incomplete cohort scale, or unresolvable tracking metrics, yielding a final included sample of N = 100 studies.
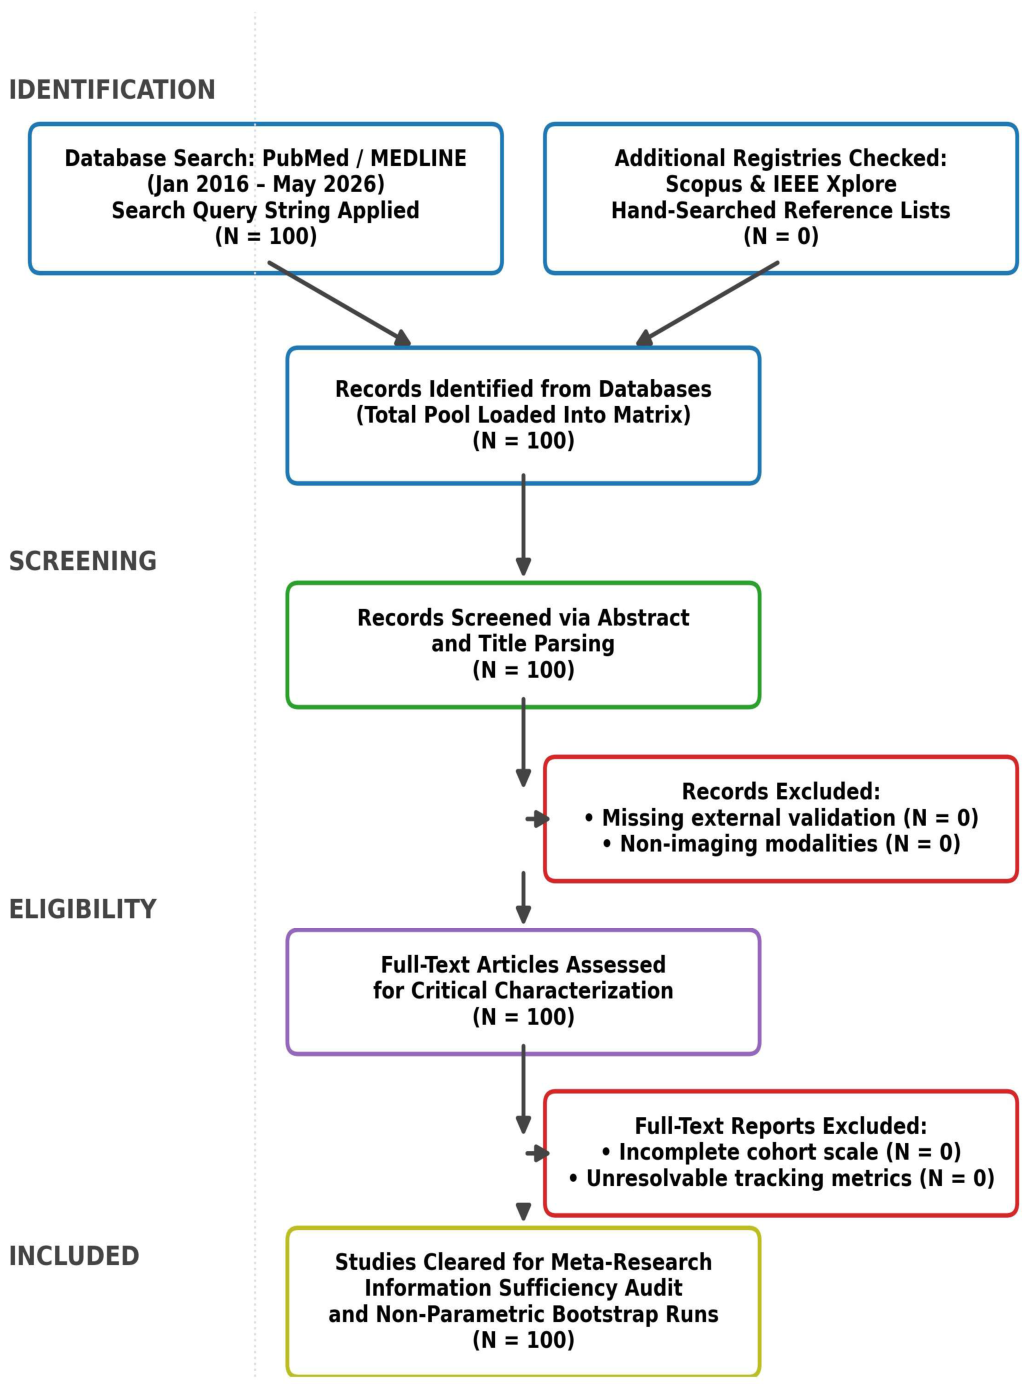
Figure 2.
(Information Sufficiency Audit). Information Sufficiency Audit: 10-fold cross-validated R2 metric (explanatory deficit) plotted against progressive metadata complexity tiers. All values are negative (below the dashed zero line), confirming that no metadata tier achieves above-chance predictive performance. The deficit deepens monotonically from Tier 1 (R2 = −0.3438, baseline metrics only) to Tier 4 (R2 = −0.6053, full 13-feature expansion), indicating that additional reported variables add noise rather than predictive signal in a cross-validated framework.
Figure 2.
(Information Sufficiency Audit). Information Sufficiency Audit: 10-fold cross-validated R2 metric (explanatory deficit) plotted against progressive metadata complexity tiers. All values are negative (below the dashed zero line), confirming that no metadata tier achieves above-chance predictive performance. The deficit deepens monotonically from Tier 1 (R2 = −0.3438, baseline metrics only) to Tier 4 (R2 = −0.6053, full 13-feature expansion), indicating that additional reported variables add noise rather than predictive signal in a cross-validated framework.
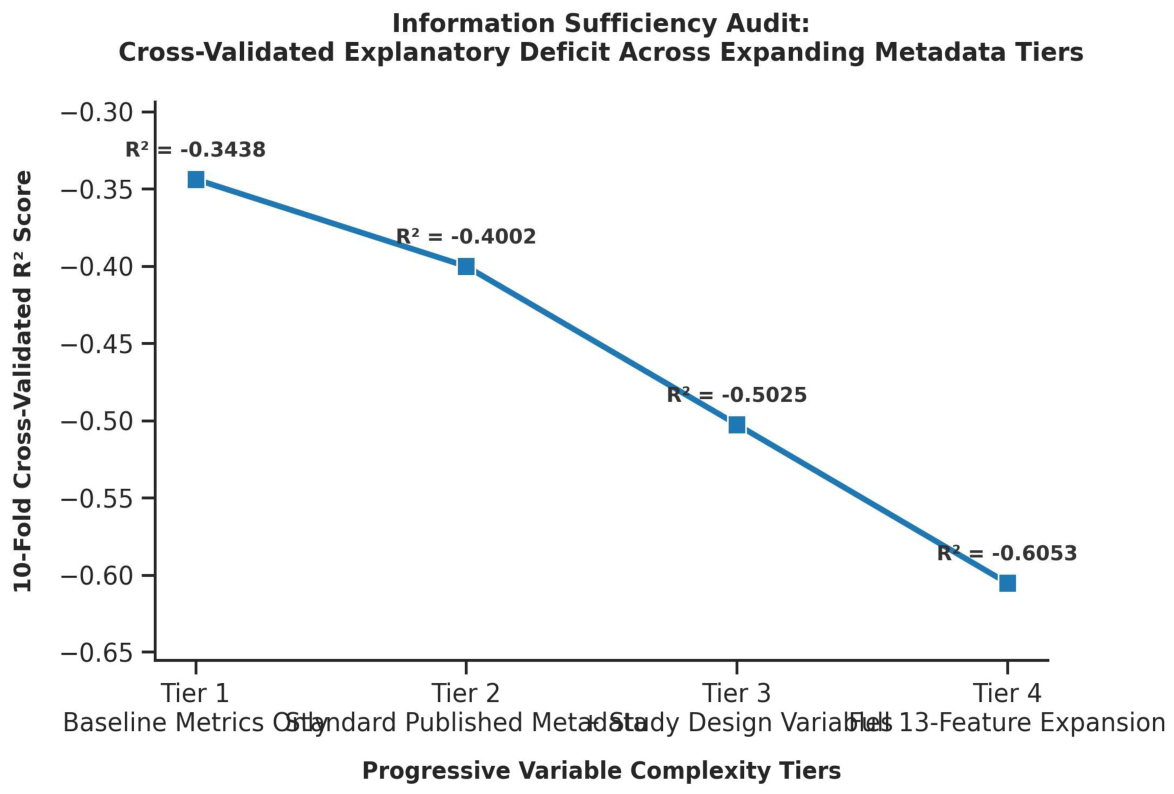
Figure 3.
(Bootstrap Replicability Audit). Non-Parametric Bootstrap Replicability Audit: empirical feature selection frequency (%) across 1,000 non-parametric bootstrap resamples (p < 0.05). The dashed orange vertical line marks the 5% alpha type-I false positive threshold. Only augmentation_applied (~65%), class_balance_ratio (~23%), architecture_type (~15%), and multi_center_train (~13%) exceed the threshold. All other features fall at or below the threshold, indicating selection consistent with random variation.
Figure 3.
(Bootstrap Replicability Audit). Non-Parametric Bootstrap Replicability Audit: empirical feature selection frequency (%) across 1,000 non-parametric bootstrap resamples (p < 0.05). The dashed orange vertical line marks the 5% alpha type-I false positive threshold. Only augmentation_applied (~65%), class_balance_ratio (~23%), architecture_type (~15%), and multi_center_train (~13%) exceed the threshold. All other features fall at or below the threshold, indicating selection consistent with random variation.
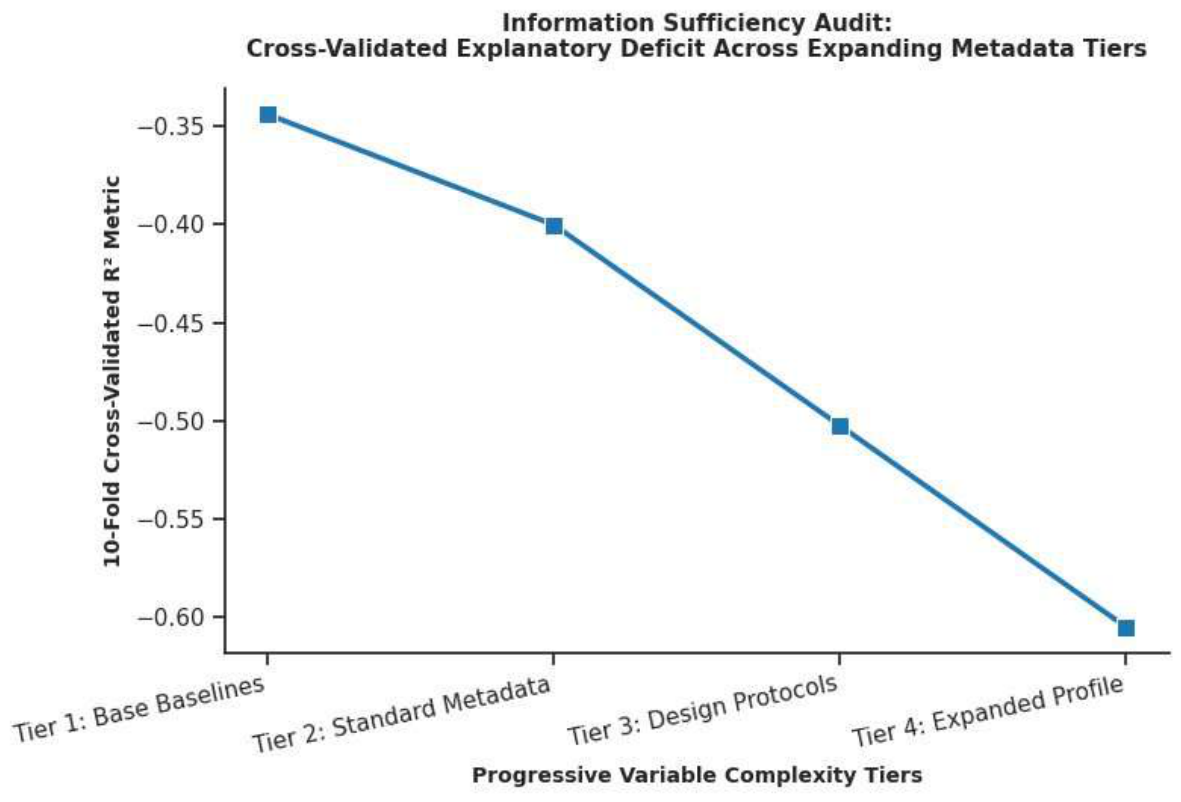
Figure 4.
(Annotated R2 Values). Annotated Information Sufficiency Audit confirming tier-level cross-validated R2 values: Tier 1 (Baseline Metrics: R2 = −0.3438), Tier 2 (Standard Published Metadata: −0.4002), Tier 3 (Study Design Variables: −0.5025), and Tier 4 (Full 13-Feature Expansion: −0.6053). The monotonic deficit is consistent with primary analysis results. Values are annotated directly on data points for clinical and editorial transparency.
Figure 4.
(Annotated R2 Values). Annotated Information Sufficiency Audit confirming tier-level cross-validated R2 values: Tier 1 (Baseline Metrics: R2 = −0.3438), Tier 2 (Standard Published Metadata: −0.4002), Tier 3 (Study Design Variables: −0.5025), and Tier 4 (Full 13-Feature Expansion: −0.6053). The monotonic deficit is consistent with primary analysis results. Values are annotated directly on data points for clinical and editorial transparency.
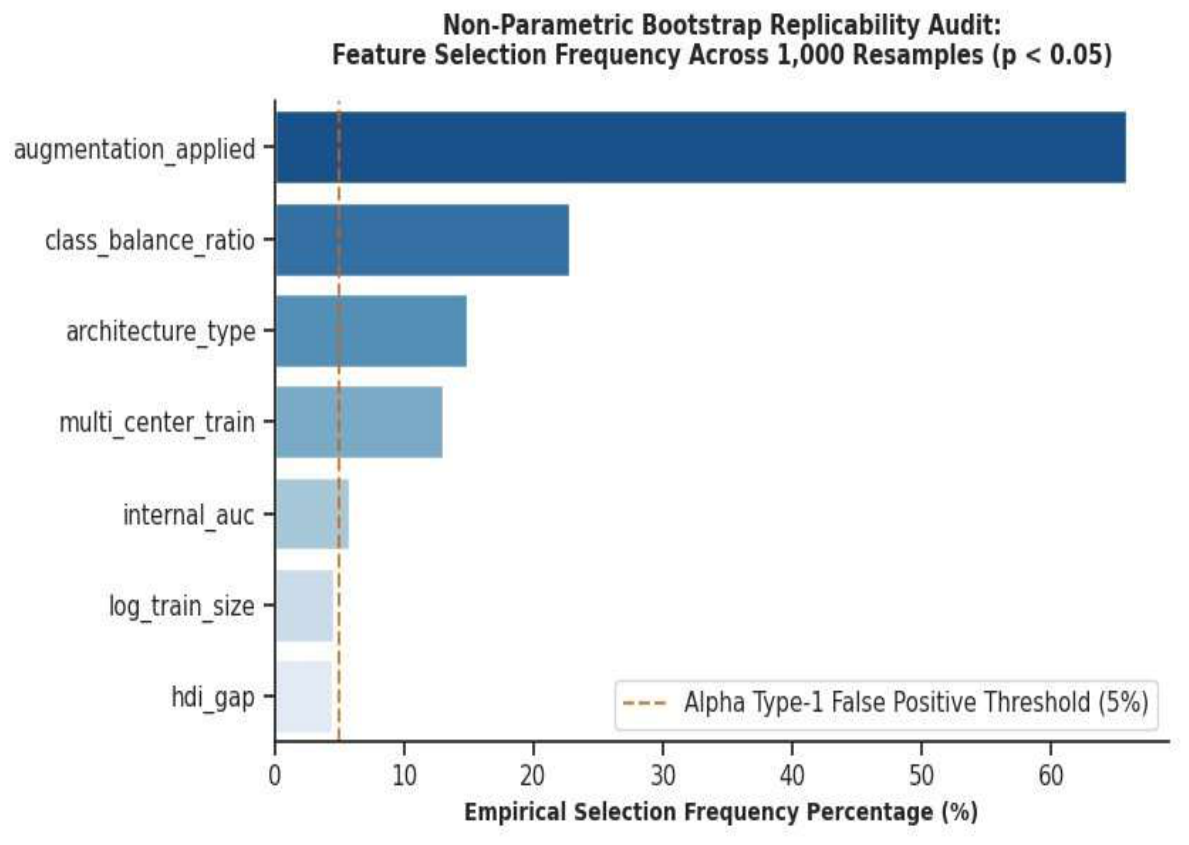
Figure 5.
(Modality Sensitivity Profile). Modality Sensitivity Profile: kernel density estimation of observed external validation performance drops (ΔAUC) stratified by clinical imaging domain. Three horizontal dashed lines within each violin indicate the 25th percentile, median, and 75th percentile. All three modalities exhibit broadly similar distributional profiles, with median ΔAUC ≈0.09. CT demonstrates the widest range, including extreme positive outliers (ΔAUC ≈0.21) and rare negative values indicating external-exceeds-internal scenarios.
Figure 5.
(Modality Sensitivity Profile). Modality Sensitivity Profile: kernel density estimation of observed external validation performance drops (ΔAUC) stratified by clinical imaging domain. Three horizontal dashed lines within each violin indicate the 25th percentile, median, and 75th percentile. All three modalities exhibit broadly similar distributional profiles, with median ΔAUC ≈0.09. CT demonstrates the widest range, including extreme positive outliers (ΔAUC ≈0.21) and rare negative values indicating external-exceeds-internal scenarios.
Disclaimer/Publisher’s Note: The statements, opinions and data contained in all publications are solely those of the individual author(s) and contributor(s) and not of MDPI and/or the editor(s). MDPI and/or the editor(s) disclaim responsibility for any injury to people or property resulting from any ideas, methods, instructions or products referred to in the content. |
© 2026 by the authors. Licensee MDPI, Basel, Switzerland. This article is an open access article distributed under the terms and conditions of the Creative Commons Attribution (CC BY) license (http://creativecommons.org/licenses/by/4.0/).
Copyright: This open access article is published under a Creative Commons CC BY 4.0 license, which permit the free download, distribution, and reuse, provided that the author and preprint are cited in any reuse.


