

Submitted:
01 July 2026
Posted:
02 July 2026
You are already at the latest version
Abstract
The miombo woodlands of southeastern Democratic Republic of the Congo (DR Congo) are increasingly threatened by mining expansion and associated land-use changes. Unlike previous studies focusing separately on mining impacts or land-cover change, this study explicitly quantified the combined influence of mining roads and settlements on forest degradation gradients in an emerging mining frontier. The study was conducted in the Mutshatsha Territory, a rapidly transforming landscape within the Katangese Copperbelt. Land-cover dynamics between 1998 and 2023 were reconstructed from six Landsat image series using Random Forest classification implemented in Google Earth Engine. Landscape transformation was assessed through landscape ecology metrics, while accessibility effects were quantified using spatial gradients around a mining exploration road and four villages representing contrasting accessibility contexts. Forest cover declined from 39.9% in 1998 to 12.5% in 2023, corresponding to an annual deforestation rate of 2.75%, substantially exceeding the national average for DR Congo. Simultaneously, agricultural land, built-up areas, and open vegetation expanded, while landscape disturbance increased and forest patch cromplexity decreased. Forest cover consistently increased with distance from both villages and the mining road, demonstrating strong accessibility gradients. Distance from villages explained up to 80% of the variation in forest cover, whereas road-distance gradients accounted for 71–94% of the observed variation. Forest loss along the mining road extended up to approximately 5 km from the corridor and intensified over time. Villages located along the RN39 transportation corridor exhibited substantially greater forest depletion than the more isolated village of Mpwita. These findings demonstrate that mining roads and settlements operate synergistically to structure forest degradation patterns through accessibility-driven processes. Integrating accessibility considerations into land-use planning and conservation strategies is therefore essential for mitigating forest degradation in rapidly expanding mining frontiers.
Keywords:
Miombo woodlands
; mining infrastructure
; forest degradation
; landscape fragmentation
; accessibility gradients
; remote sensing
; Democratic Republic of the Congo
1. Introduction
Miombo woodlands constitute the largest tropical dry forest formation in Africa, covering approximately 2.7 million km2 across the Zambezian region [1,2]. In southeastern Democratic Republic of the Congo (DR Congo), they represent nearly 70% of the regional forest cover [3], and provide essential ecosystem services, including biodiversity conservation, carbon storage, hydrological regulation, timber and non-timber forest products, and energy resources for millions of rural and urban households [4,5]. Beyond their ecological importance, miombo woodlands play a central role in sustaining local livelihoods throughout the Copperbelt region [6,7].
Despite their importance, miombo ecosystems are increasingly threatened by anthropogenic disturbances [3]. Agricultural expansion, charcoal production, timber harvesting, urban growth, recurrent fires, and mining activities have accelerated forest degradation and habitat fragmentation across the region [8,9,10,11,12]. In DR Congo, deforestation rates remain among the highest in the Congo Basin, with substantial forest losses occurring in areas experiencing rapid demographic growth and natural resource exploitation [13].
Particular concern surrounds the rapid expansion of artisanal and small-scale mining (ASM) in Lualaba Province, driven by the liberalization of the Congolese mining sector initiated in 2002 and its subsequent reforms [14,15,16,17,18].This policy shift led to a substantial increase in mineral exploration and mining operations throughout southeastern DR Congo [9,19,20]. « Mining development requires extensive transportation infrastructure, particularly exploration and access roads that facilitate the movement of personnel, equipment and extracted resources [21,22,23,24]. Numerous studies conducted in tropical regions have demonstrated that roads often act as catalysts for deforestation by increasing accessibility to previously remote forest areas and stimulating agricultural expansion, settlement establishment and resource extraction [25,26,27,28,29,30]. Consequently, road networks frequently generate spatially organized deforestation fronts that extend far beyond the direct footprint of the infrastructure itself, notably through the proliferation of secondary roads branching off initial access routes [28,31].
At the same time, mining development attracts migrants and stimulates demographic growth around mining centres and transportation corridors [11,32,33,34]. Newly established or rapidly expanding villages increase local demand for agricultural land, construction materials and fuelwood, thereby intensifying pressure on surrounding forests [35,36,37,38]. Previous studies in the Katangese Copperbelt have documented substantial forest degradation around urban and peri-urban settlements [11,32]. However, the interaction between mining roads and associated villages remains insufficiently understood, despite their potentially synergistic role in shaping forest degradation patterns.
Previous studies conducted in the Katangese Copperbelt and, more recently, in Lualaba Province have documented substantial forest-cover decline, increasing landscape fragmentation, and profound changes in the spatial organization of miombo ecosystems under growing anthropogenic pressure [39,40]. These studies have highlighted the respective roles of mining expansion, agricultural activities, demographic growth, and governance challenges in shaping landscape transformation [39,40,41]. However, they have primarily focused on land-cover dynamics and landscape structure at regional and territorial scales [11,39,40,41]. Consequently, the spatial mechanisms through which mining-related infrastructure and settlements organize forest degradation within the landscape remain poorly understood. In particular, the extent to which mining roads and associated villages generate accessibility gradients that influence forest-cover loss, landscape disturbance, and forest fragmentation has not yet been quantified in the miombo woodlands of southeastern DR Congo. While these studies have substantially improved our understanding of forest loss processes, little attention has been paid to the spatial interaction between mining access roads and rural settlements, and how this interaction influences landscape fragmentation and forest degradation gradients in miombo ecosystems. Furthermore, quantitative assessments integrating landscape ecology metrics with spatial analyses of accessibility remain scarce in the Congolese miombo region.
Addressing this gap requires moving beyond the quantification of forest loss and fragmentation towards an explicit assessment of the spatial processes that drive these changes [42]. Accessibility is widely recognized as a key determinant of land-use conversion in tropical frontiers [43,44], yet its role remains largely unexplored in the Congolese miombo region.
Integrating remote sensing, landscape ecology metrics, and spatial gradient analyses offers a robust framework for quantifying how roads and settlements influence the distribution and intensity of forest degradation across mining landscapes [40,45].
The Mutshatsha Territory provides a particularly suitable case study for investigating these processes. Located within the mining frontier of Lualaba Province, the area has experienced rapid mining expansion over the last two decades, accompanied by the construction of exploration roads and the growth of rural settlements [40,46].
Unlike previous studies that quantified landscape change at regional scales [3,39,40], the present study explicitly examines how mining roads and villages interact to structure forest degradation patterns through accessibility gradients. This approach provides a mechanistic understanding of landscape transformation and complements previous regional assessments of forest loss and fragmentation in southeastern DR Congo [11,39–41.
The present study aims to assess the role of mining roads and associated villages in shaping forest degradation patterns within the miombo landscape of southeastern DR Congo. We hypothesize that forest degradation in the miombo woodlands of southeastern DR Congo is not randomly distributed but spatially organized around mining access corridors and associated settlements, generating gradients of fragmentation and forest loss that intensify with increasing accessibility.
2. Materials and Methods
2.1. Subsection
The study was conducted in the Mutshatsha Territory, located in Lualaba Province, southeastern DR Congo (Figure 1).
The territory lies within the Zambezian phytogeographical region and is largely covered by miombo woodlands dominated by species of the genera Brachystegia, Julbernardia and Isoberlinia [2].The climate is tropical sub-humid, characterized by a rainy season extending from November to March and a dry season from May to September, with April and October being considered as transitional months. Mean annual rainfall generally exceeds 1,000 mm [2,40]. The landscape is generally flat to gently undulating and belongs to the Upper Lualaba watershed [47,48]. Agriculture, charcoal production, timber extraction and mining-related activities currently constitute the main drivers of land cover change and forest degradation in the area [49]. Unlike urban and peri-urban landscapes that have been extensively studied in the Katanga Copperbelt, Mutshatsha remains predominantly rural while experiencing rapid mining expansion. The analysis focused on the forested landscape surrounding a mining exploration road and associated villages (Table 1), where forest degradation processes are expected to be strongly influenced by accessibility gradients.
2.2. Data Acquisition and Processing
2.2.1. Satellite Data Sources
The study area was delineated using Landsat imagery available through the Google Earth Engine (GEE) cloud-computing platform. Three Landsat TM (Thematic Mapper) scenes (1998, 2002, and 2007) and three Landsat OLI-TIRS (Operational Land Imager–Thermal Infrared Sensor) scenes (2013, 2017, and 2023) were selected, all with a spatial resolution of 30 m. Landsat imagery was chosen because it provides one of the longest continuous Earth observation archives, making it particularly suitable for reconstructing long-term land-cover trajectories and assessing landscape transformations over several decades [50]. To ensure temporal consistency among observations, all images were acquired during the dry season (June–July), when vegetation phenology is relatively stable and cloud contamination is minimal [51]. All datasets corresponded to Landsat Collection 2 Tier 1 Level-2 Surface Reflectance products, which provide atmospherically corrected observations suitable for quantitative change detection analyses [52]. The selected years correspond to key phases in the recent history of southeastern DR Congo. The year 1998 was used as a reference condition prior to the liberalization of the Congolese mining sector in July 2002. The years 2002 and 2007 captured the initial phase of mining expansion, which was accompanied by rapid demographic growth and accelerated spatial development in the Copperbelt region [32] (Useni et al., 2018). The year 2013 was selected to assess landscape conditions following the opening of the mining exploration road, whereas 2017 and 2023 represent subsequent stages of landscape transformation associated with continued mining development and regional administrative restructuring.
2.2.2. Satellite Data Sources
Only images with less than 10% cloud cover were retained for analysis in order to minimize classification uncertainty and improve the reliability of land-cover discrimination [53]. All scenes were reprojected into the WGS 84 / UTM Zone 35S coordinate system to ensure spatial consistency among datasets and facilitate integration with field observations and GIS analyses [51]. Atmospheric correction had already been applied to the Level-2 products using the Landsat Ecosystem Disturbance Adaptive Processing System for Landsat TM images and the Land Surface Reflectance Code for Landsat OLI-TIRS imagery [52]. The use of surface reflectance data reduces atmospheric effects and improves the comparability of spectral signatures across acquisition dates, which is essential for long-term land-cover change analysis [54].
2.2.3. Satellite Data Sources
False-colour composites were generated using the near-infrared (NIR), red (R), and green (G) spectral bands. The NIR and red bands provide strong discrimination of vegetation structure and condition, while the green band improves the identification of water bodies and non-vegetated surfaces [55]. These composites facilitated visual interpretation and the delineation of training samples. Based on in situ observations and the dominant ecological characteristics of the landscape, six land cover classes were identified. The forest class comprised miombo woodlands together with patches of dry dense forest (Muhulu) and gallery forest (Mushitu). Wooded savannas represented transitional formations between miombo woodland and open grasslands or seasonally flooded (dembo), including secondary formations resulting from forest degradation [2]. Grassland and wetland areas included herbaceous savannas and periodically flooded dambo characterized by low tree density and dominant herbaceous cover [2]. Agricultural land encompassed active cropland, post-harvest fields, fallows, abandoned agricultural plots, and off-season cultivation areas. Built-up and bare soil included settlements, roads, exposed soils, and other anthropogenic surfaces. Water bodies comprised rivers, ponds, and permanent aquatic environments.
Training data were derived from 185 GPS points collected during a field survey conducted in September 2023 using a Garmin GPSMAP 64st receiver with an average positional accuracy of approximately 3 m. For each land-cover class and image date, Regions of Interest (ROIs) were delineated around field observations. Training polygons were deliberately located within homogeneous areas while avoiding transition zones to minimize mixed-pixel effects, which can significantly reduce classification accuracy in heterogeneous tropical landscapes [56].
Because field observations were collected in 2023, special attention was given to the temporal transferability of training data. Training samples were restricted to land-cover categories characterized by stable spectral and ecological properties through time, including permanent water bodies, mature miombo woodland, wetlands, and long-established settlements [40,57]. Historical consistency of training areas was verified through visual interpretation of multi-temporal Landsat imagery, high-resolution Google Earth archives, historical topographic information, and expert knowledge of landscape evolution acquired during repeated field surveys in the region [57,58]. For areas showing evidence of land-cover transitions during the study period, additional date-specific training polygons were delineated through retrospective image interpretation to avoid temporal classification bias [41,57]. This approach has been widely adopted in long-term land-cover reconstruction studies where historical field observations are unavailable [57,59].
All ROIs were merged into a single training dataset and used to perform supervised classification based on the Random Forest algorithm. Random Forest was selected because it constructs multiple decision trees and assigns each pixel to the most probable land-cover class, thereby reducing overfitting and improving classification robustness [60]. Numerous studies have demonstrated that Random Forest generally outperforms conventional classifiers in terms of classification accuracy and stability, particularly when applied to multispectral satellite imagery in complex environments [60,61,62]. Furthermore, its capacity to model non-linear relationships among spectral variables makes it particularly suitable for mapping heterogeneous tropical landscapes [40,62,63]. The model was constructed using 500 decision trees (ntree = 500), while the number of variables randomly selected at each split (mtry) was set to the square root of the total number of predictor variables, following standard Random Forest recommendations. Predictor variables included the spectral bands of Landsat imagery and derived vegetation information. The relatively large number of trees ensured model stability and minimized variance associated with individual decision trees [63,65,66,67]. Classification accuracy was assessed independently using 120 validation points that were not included in the training dataset (Table S1). Confusion matrices were generated for each classified image, and Overall Accuracy, Kappa, user accuracy and producer accuracy were calculated [68]. Following commonly accepted standards, classifications were considered reliable when Kappa values exceeded 0.60 [69,70].
2.3. Quantifying Landscape Dynamics
Changes in landscape composition were assessed using the Percentage of Landscape (PLAND) metric, which quantifies the proportional contribution of each land-cover class to the total landscape area [71]. PLAND was calculated for all land-cover classes and dates to characterize long-term shifts in landscape composition and identify dominant trajectories of land-cover transformation [40,41]. Particular attention was given to changes in forest cover because forest decline represents the most direct indicator of woodland degradation in the study area [40,72]. The magnitude of forest loss was further quantified through annual deforestation rates calculated following the approach proposed by Puyravaud [73,74]. Unlike alternative formulations (e.g., the FAO formula), the Puyravaud method explicitly incorporates the time interval between observations [73], thereby providing a standardized estimate of annual forest-cover change [73,74]. According to Catalán [75], annual deforestation rates can be classified into low, moderate, high, and very high categories, facilitating comparisons across study periods and regions [3] (Muteya et al., 2025).
Landscape anthropization was quantified using the disturbance index (U) proposed by O’Neill et al. [76], as applied in recent studies of landscape dynamics in southeastern D.R. Congo [11,40]. This index expresses the ratio between the cumulative surface area of anthropized land-cover classes—including agricultural land, built-up areas, and bare soils, which are characterized by direct human impact and significant land transformation—and that of natural land-cover classes, such as forests, wooded savannas, grasslands, wetlands, and water bodies, which maintain more autonomous ecological dynamics and resilience. A high value for this index reflects the growing dominance of human-modified land uses at the expense of natural ecosystems, thus providing an integrated measure of anthropogenic pressure on the landscape [11,77]. Changes in patch shape complexity were assessed using fractal dimension (Df), a metric commonly employed to characterize the geometric complexity of landscape patches [78]. Fractal dimension was estimated using the perimeter–area relationship. Values approaching 1 indicate simple and regular patch shapes that are typically associated with human-modified landscapes, whereas values approaching 2 reflect complex and irregular boundaries characteristic of natural ecosystems. Consequently, temporal declines in fractal dimension were interpreted as evidence of increasing anthropogenic modification and simplification of forest patch geometry [71,79].
2.4. Quantifying Landscape Dynamics
To quantify village influence on surrounding forests, PLAND of forest land cover was calculated within concentric buffer zones located at 1, 2, and 3 km from the center of each village (Figure S1). A maximum radius of 3 km was selected to avoid overlap between neighboring villages, particularly Mulomba and Mpwita, thereby ensuring the independence of spatial observations [11,40,80]. The influence of the mining exploration road was assessed using a similar buffer-based approach. PLAND of forest land cover was calculated within successive distance bands extending from 0–1 km, 1–2 km, 2–3 km, 3–4 km, 4–5 km, 5–6 km, and 6–7 km on both sides of the road corridor (Figure S2). This design enabled the identification of accessibility gradients and the estimation of the spatial extent of road-related forest degradation [29,81,82].
For the first nine kilometers of the road, only four buffer bands could be delineated on the eastern side because the Lufupa River forms a natural barrier that limits the spatial influence of the road on adjacent forest areas [29,82,83,84]. The road was partitioned into 17 contiguous segments of 1.01 km to capture fine-scale spatial heterogeneity in road-related forest dynamics (Figure S3). Kilometer-scale segmentation is recommended for linear-infrastructure analyses because it maximizes spatial resolution while maintaining statistical independence among segments, and has recently been shown to enhance the detection of localized degradation patterns along road corridors [85]. Forest proportions were then calculated within a 7 km buffer on both sides of each segment. This segmentation approach allowed the identification of localized hotspots of forest degradation and facilitated the comparison of forest dynamics among different portions of the road corridor [85,86]. The maximum buffer distance of 7 km was selected because it exceeds the distance within which approximately 95% of tropical deforestation is generally concentrated around roads (approximately 5.5 km), thereby ensuring that the full spatial extent of road influence was captured [26,29,87]. Temporal changes in forest cover were analyzed for each village buffer, road-distance band, and road segment. Before statistical analyses, the normality of residuals was assessed using the Shapiro–Wilk test, while homogeneity of variances was evaluated using Bartlett’s test, both of which are recommended for relatively small sample sizes (n < 50). When assumptions of normality and homoscedasticity were satisfied, differences in forest proportion among years, buffer distances, villages, and road segments were tested using analysis of variance (ANOVA), followed by Tukey’s honestly significant difference (HSD) test for post hoc pairwise comparisons.
When data did not meet parametric assumptions, the non-parametric Kruskal–Wallis test was used as an alternative to ANOVA, followed by Dunn’s multiple-comparison test when significant differences were detected. Finally, linear regression analyses were performed to evaluate the relationship between forest proportion and distance from villages and the mining exploration road, as well as among road segments. Statistical significance was assessed using p-values, whereas the coefficient of determination (R2) was used to quantify the proportion of variation in forest cover explained by accessibility gradients over time.
3. Results
3.1. Landscape Composition Dynamics
Six land-cover maps were produced from the supervised classification of Landsat imagery spanning the period 1998–2023 (Figure 2). Visual interpretation revealed that the six land-cover classes identified in 1998 remained present in 2023. However, substantial changes occurred in landscape composition over the 25-year study period, reflecting a profound reorganization of the miombo woodland ecosystem (Figure 2). Forest cover declined continuously over time, while anthropogenic land-use classes, namely grasslands and wetlands, agricultural land, and built-up/bare areas, expanded. Consequently, grasslands and wetlands emerged as the dominant land-cover type, replacing forest as the primary landscape matrix (Figure 2).
The most striking change was the marked decline in forest cover, which decreased from 39.92% of the landscape in 1998 to only 12.50% in 2023, representing a loss of nearly two-thirds of the original forest extent. Wooded savannah also exhibited an overall declining trend, with a net reduction of 2.79% over the study period, although slight increases were observed during the 2002–2007 and 2017–2023 intervals. In contrast, grasslands and wetlands expanded continuously and progressively became the dominant land-cover class in the landscape (Table 2). Anthropogenic land-cover classes displayed the most pronounced increases. Agricultural land expanded more than sevenfold between 1998 and 2023, while built-up and bare land increased approximately tenfold during the same period (Table 2). The rapid growth of these land cover classes reflects the intensification of human activities, including agricultural expansion, settlement development, and infrastructure growth associated with demographic and mining-related transformations. The observed land-cover trajectories indicate a progressive replacement of natural forest ecosystems by open vegetation and anthropogenic land uses, resulting in a fundamental shift in landscape structure and composition over the last two decades.
Annual deforestation rates shifted markedly over the study period (Figure 3). The 1998–2002 period recorded a negative rate (–3.17% yr−1), indicating net forest gain, likely reflecting reduced anthropogenic pressure or active regeneration. From 2002 onwards, rates turned consistently positive and escalated across successive periods (2.27, 3.20, 4.59, and 8.89% yr−1), pointing to an accelerating and sustained deforestation trend. The mean annual deforestation rate over the entire study period (2.75% yr−1) highlight the intensity of forest loss concentrated in this territory.
Between 1998 and 2023, the landscape disturbance index (U) increased overall from 1.49 to 5.12, reflecting a progressive intensification of anthropogenic pressures. Concurrently, the fractal dimension (Df) of the forest land cover declined from 1.36 to 1.29, indicating a gradual simplification of forest patch geometry and a loss of structural complexity. The steepest decline in Df occurred between 2013 and 2017, preceding the most dramatic escalation in U recorded between 2017 and 2023 (ΔU = +2.42). The overall inverse relationship between U and Df provides evidence of growing anthropogenic transformation and progressive degradation of forest ecosystem structure (Figure 4).
3.2. Villages Generate Localized Fronts of Forest Degradation
Village-driven forest-cover decline was examined along three complementary dimensions: spatial (variation with distance from the settlement core), temporal (rate and timing of decline), and inter-village (overall differences among sites). Three successive figures address each dimension in turn: Figure 5 tests whether a spatial gradient exists around each village and how it evolves over time; Figure 6 isolates each village’s temporal trajectory independent of buffer distance; and Figure 7 provides the formal pooled comparison among villages.
Forest cover declined substantially at all four villages between 1998 and 2023 across every buffer distance, confirming a sustained net loss over the 25-year study period (Figure 5). A visual gradient — lower cover near the village core and higher cover at greater distance — was apparent for Mulomba and Mpwita in later survey years, yet the buffer-distance effect was not statistically significant, either across villages pooled (Kruskal–Wallis: H = 2.10, p = 0.350) or within any individual village (all p > 0.10; Table S3-A). The apparent spatial gradient therefore reflects the dominant temporal decline modulated by each village’s distinct trajectory, rather than a true distance effect. By 2023, at the outermost buffer assessed (3 km), forest cover had virtually disappeared around Kamoa (0.55%) and Kanzenze (0.12%), whereas substantial cover persisted around Mulomba (27%) and Mpwita (52%). At Mpwita, this loss was spatially uneven: cover at 1 km had collapsed to 2.7% while outer buffers (2–3 km) retained 43–52%, indicating that degradation was most acute immediately adjacent to the settlement core. Mpwita consistently retained the highest forest cover of all four villages throughout the study period.
Temporal dynamics were the dominant driver of forest-cover change at every village (Figure 6; Table S3-B). Kamoa and Kanzenze lost virtually all forest cover before the end of the study period, falling below 1% at all buffer distances by 2017. Mulomba followed a more gradual but equally severe trajectory, declining from ~85% in 1998 to ~10% by 2023 (mean across buffer distances; range: 0.1–27%), with residual cover concentrated almost entirely at the 3 km buffer. Mpwita exhibited a distinct two-phase pattern: cover declined modestly from ~96% in 1998 to ~82% in 2017, then fell sharply to ~33% by 2023 — a late but abrupt acceleration with no equivalent at the other three villages, driven in large part by near-total loss at 1 km while outer buffers retained 43–52% cover.
Inter-village differences in overall forest cover were highly significant (Kruskal–Wallis: H = 48.10, p < 0.001; Figure 7; Table S3-C). Mpwita retained significantly more forest than Mulomba, which in turn retained significantly more than Kamoa and Kanzenze; the latter two did not differ significantly from one another, having converged toward a near-zero baseline despite their distinct historical trajectories. The significant village × year interaction (two-way ANOVA: F = 15.5, df = 15, p < 0.001) confirms that degradation pathways are village-specific rather than the expression of a shared regional trend. Collectively, these results indicate that forest-cover dynamics in this landscape are governed primarily by a strong temporal decline whose timing and severity vary markedly among villages, rather than by a distance gradient from the settlement core.
3.3. Mining Roads Create an Accessibility-Driven Degradation Corridor
Beyond the localized fronts radiating from village settlements, the mining exploration road emerged as a second, structurally distinct driver of forest-cover loss. Unlike a village, which exerts a point-centered influence, a road generates degradation along an extended linear corridor through two non-redundant mechanisms: a lateral gradient extending perpendicularly from the roadside, and a longitudinal front advancing along the corridor from accessible toward more remote stretches. Forest-cover change was therefore examined from both spatial perspectives — as a function of perpendicular buffer distance from the road and as a function of position along the 17 mapped road segments — to determine whether accessibility-driven degradation is structured by distance, by location along the corridor, or by both simultaneously.
3.3.1. The Road Exerts a Lateral, Distance-Dependent Influence on Forest Cover
When tested in isolation across all survey years, buffer distance from the road was not a significant predictor of forest cover (Kruskal–Wallis: H = 2.48, p = 0.871; Figure 8a). Once survey year was included as a co-factor, however, distance became highly significant (two-way ANOVA, additive model: buffer F = 14.89, p < 0.001; year F = 315.86, p < 0.001; Table S3-Da), revealing that the lateral accessibility gradient is only detectable after accounting for the dominant area-wide temporal decline. Mean forest cover increased monotonically with distance from the road across the full surveyed range — from 59% at 1 km to 69% at 7 km — with no evidence of a plateau, suggesting that road influence extends at least to the outermost buffer assessed. At 3 km, for instance, cover fell from ~80% in 2007 to ~40% by 2023, a loss of nearly half within 16 years (Figure 8a).
Temporally, forest cover followed a two-phase pattern across all buffer distances (Figure 8b; Table S3-Db). Cover remained at a comparably high level between 1998 and 2007 (72–80%), before declining sharply and progressively from 2013 onward to reach ~41% by 2023. This inflection coincides with the reported intensification of mining activity and suggests that accessibility-driven pressures accumulated before triggering accelerated forest loss. Crucially, the rate of decline was not spatially uniform: whereas annualized loss rates were broadly similar across buffer distances during 2007–2013 (−3.5 to −5.0% yr−1), they diverged markedly between 2017 and 2023, accelerating to −7.8% yr−1 at 1 km from the road while remaining comparatively moderate at −1.1% yr−1 at 5 km. The mining road thus functions as a linear driver of forest degradation whose lateral footprint has intensified and contracted toward the roadside over the most recent survey period.
3.3.2. Degradation Propagates Unevenly Along the Road Corridor
Spatial position along the road corridor was a highly significant driver of forest-cover variation (Kruskal–Wallis: H = 40.22, p < 0.001; Table S3-E), an effect that persisted when survey year was included as a co-factor (two-way ANOVA, additive model: segment F = 11.08, p < 0.001; year F = 39.71, p < 0.001). No individual segment pair differed significantly after correction for multiple comparisons (Dunn–Benjamini–Hochberg), indicating that degradation does not concentrate at discrete hotspots but forms a continuous spatial gradient along the corridor (Figure 9a). This gradient advanced directionally over time: forest was already near-absent from proximal segments A and B by 2007 (1.1% and 3.7%, respectively), depletion had extended to segments C and D by 2017 (3.2% and 1.8%), and by 2023 had reached as far as segment G (3.5%), leaving segments A–G effectively deforested. The more distal segments (H–Q) retained cover at or above 35% throughout the study period yet were not spared: segment Q alone declined from ~94% in 2007 to ~40% by 2023, a loss of more than half within 16 years.
Averaged across all 17 segments, temporal dynamics followed a two-phase pattern (Figure 9b; Appendix A9b). Mean forest cover declined gradually from ~90% in 1998 to ~72% in 2013, then accelerated markedly, falling to ~57% in 2017 and ~28% by 2023. Spatial variance among segments widened from ±7% in 1998 to a maximum of ±35% in 2017, before narrowing slightly to ±24% in 2023 as the distal segments (H–Q) also began declining substantially — reflecting the progressive displacement of the deforestation front toward more remote stretches of the corridor rather than a spatial contraction of the effect. These results confirm that the mining road structures forest loss in a directional and cumulative manner: the spatial footprint of deforestation advances segment by segment from the access point while its intensity deepens over time, including in areas that had remained largely intact during the earlier part of the study period.
4. Discussion
4.1. Mining Expansion Accelerates Forest Loss in Miombo Ecosystems
Our results revealed a substantial decline in forest cover between 1998 and 2023, accompanied by the expansion of agricultural land, grasslands and wetlands, and built-up/bare soil. The acceleration of forest loss observed after 2002 coincides with a period of rapid mining expansion in southeastern DR Congo [14,88]. Although the present study does not directly quantify mining activity, this temporal correspondence is consistent with the frontier expansion framework, whereby new economic opportunities stimulate infrastructure development, population influx, agricultural expansion, and increasing pressure on surrounding natural ecosystems [9,19,20]. Forest decline in Mutshatsha therefore likely reflects a broader process of frontier development rather than the direct footprint of mining operations alone [89,90].
The effects of mining expansion extend beyond the direct footprint of extraction sites. Mining activities increase demand for agricultural products, construction materials and energy resources, while attracting workers and stimulating population growth corridors [11,32,34]. These indirect effects contribute to the conversion of forest into agricultural and anthropogenic land-cover classes, a pattern widely reported across tropical mining frontiers [91,92]. The expansion of grasslands and degraded open formations observed in this study further suggests recurrent disturbances associated with forest clearing, charcoal production and shifting cultivation, which are recognized as major drivers of miombo degradation [4,10,72].
The annual deforestation rate recorded in Mutshatsha (2.75%) is substantially higher than national estimates for the DR Congo [93], highlighting the existence of localized deforestation hotspots associated with resource extraction frontiers. Similar patterns have been reported in mining regions of the Katanga Copperbelt and elsewhere in the miombo ecoregion [2,9,11]. Beyond forest-cover loss, the landscape underwent a profound structural transformation. By 2023, grasslands and wetlands had become the dominant matrix, replacing forest as the principal landscape component. According to landscape ecology theory, such a shift may alter ecological processes by reducing habitat availability, modifying species movement and changing ecosystem functioning [42,79,94]. Overall, our findings indicate that mining expansion has acted as a catalyst of broader land-use changes, accelerating forest loss and reshaping the ecological structure of the miombo landscape.
Although mining expansion provides a plausible explanation for the observed landscape changes, alternative factors may also have contributed to forest decline. Population growth, increasing demand for agricultural land, charcoal production, and regional market integration have all been identified as important drivers of forest conversion in the miombo region [2,41,72]. The patterns observed in Mutshatsha likely result from the interaction of these multiple processes rather than from a single driver, echoing the conclusion of Cabala et al. [39], who demonstrated that forest ecosystem degradation in the Katangese Copperbelt reflects the cumulative effect of interacting anthropogenic pressures operating simultaneously at multiple scales.
4.2. Mining Roads Create Accessibility-Driven Deforestation Fronts
One of the most important findings of this study is the strong influence of the mining exploration road on forest-cover dynamics. Forest cover consistently increased with distance from the road, whereas the most severe forest losses occurred in areas directly accessible from the infrastructure [43,44,72]. This pattern confirms that accessibility is a major determinant of forest degradation in the Mutshatsha landscape.
Roads are widely recognized as key drivers of tropical deforestation because they reduce transportation costs and facilitate access to previously remote ecosystems [25,44]. In Mutshatsha, the mining road appears to have acted not only as an access route but also as a spatial organizer of human activities, concentrating agricultural expansion, wood extraction and settlement development within its sphere of influence [26,95]. The observed accessibility gradient is consistent with theories predicting that land-use conversion decreases as travel costs increase with distance from transportation networks [43,81,96].
Road impacts, however, were not spatially uniform. Forest loss was greatest along road segments located near villages and major transportation corridors, whereas more isolated sections experienced comparatively lower degradation. This finding suggests that the ecological effects of roads depend not only on their presence but also on their integration within broader transportation and settlement networks [31]. Similar observations have been reported in tropical frontier regions where infrastructure interacts with human occupation to accelerate land-cover change [91,92]. Our results indicate that mining roads constitute the spatial backbone of emerging deforestation fronts in Mutshatsha. Their ecological footprint extends far beyond the physical road corridor by increasing accessibility, promoting forest fragmentation and facilitating the outward expansion of anthropogenic activities across the landscape [31].
The strong forest-cover gradients observed around the mining exploration road are consistent with accessibility theory, which predicts that land-use conversion is concentrated in areas where transportation costs are lowest. Roads reduce physical isolation and increase access to land, markets, and forest resources, thereby facilitating the expansion of agriculture, settlement, and resource extraction activities. Under this framework, roads act less as direct drivers of deforestation than as spatial enablers that reorganize human activities across the landscape.
4.3. Villages Amplify Localized Forest Degradation
The strong relationship observed between forest cover and distance from villages indicates that settlements constitute major centers of landscape transformation in the Mutshatsha territory. Across all observation periods, forest cover increased with increasing distance from villages, whereas the most severe forest depletion occurred in their immediate surroundings [10,72].This pattern suggests that villages act as localized sources of anthropogenic disturbance from which degradation progressively expands into adjacent forest landscapes [10,72,97]. These findings are consistent with studies conducted in tropical forest regions, where settlements concentrate agricultural expansion, fuelwood collection, timber harvesting and infrastructure development [10,72,96,97]. In rural miombo landscapes, where local livelihoods remain strongly dependent on forest resources, human pressure is typically highest near settlements and declines with increasing distance due to rising extraction and transportation costs [2,6,72].
The marked differences observed among villages further highlight the role of accessibility in shaping forest degradation patterns. Villages located closer to the national road network and regional economic centres exhibited substantially greater forest loss than more isolated settlements. This suggests that village impacts are not solely determined by population presence but also by their integration into broader transportation and market networks [72,96,97]. Similar patterns have been reported in other tropical frontier regions, where accessibility increases the profitability of land-use conversion and resource extraction [96,97].
The temporal strengthening of village effects indicates that forest degradation expanded progressively beyond settlement boundaries over the study period. This trend likely reflects the combined effects of population growth, increasing demand for agricultural land, charcoal production and the growing influence of mining-related markets [2,40,41].Villages therefore function not only as centres of resource consumption but also as key nodes linking forest resources to regional economic systems [6,72,97]. Villages are active agents of landscape transformation whose influence extends well beyond their physical boundaries [42,97]. Together with mining roads, they form interconnected accessibility networks that govern the spatial distribution and intensity of forest degradation across the Mutshatsha landscape [31,86,99]. The observed village gradients can be interpreted through the concept of distance-decay relationships in human-environment systems [44,96,100]. Resource extraction, agricultural cultivation, and daily mobility are generally concentrated near settlements because labor and transportation costs increase with distance [2,72,96]. Consequently, forest degradation tends to be spatially clustered around villages and progressively decreases towards more remote areas [10,72,100]. Similar patterns have been reported across tropical forest frontiers where settlements function as focal points of landscape transformation [97,98,101].
4.4. Landscape Fragmentation and Ecological Implications
The observed increase in landscape disturbance and decline in forest patch complexity indicate that forest degradation in the Mutshatsha mining frontier extends beyond simple habitat loss and involves a profound reorganization of landscape structure [40,41,74]. Over the study period, forest cover was progressively replaced by anthropogenic land-cover classes, while the spatial configuration of the remaining forest became increasingly simplified (Figure 2). This transition reflects a shift from a relatively continuous forest matrix towards a fragmented anthropogenic mosaic, a process widely recognized as one of the principal pathways of biodiversity decline and ecosystem degradation in tropical landscapes [42,94,100]. Conservation strategies focused exclusively on protecting isolated forest patches are unlikely to succeed if the spatial processes driving degradation remain active [40,74,96]. The accessibility gradients identified in this study indicate that roads and settlements function as organizing structures of landscape transformation, concentrating human activities and facilitating the progressive expansion of disturbance into previously less accessible areas [31,44,86]. Consequently, management interventions should adopt a landscape-scale perspective that simultaneously addresses habitat conservation, connectivity maintenance, and accessibility planning [102,103,104]. Priority should be given to protecting remaining forest cores located beyond the most disturbed accessibility corridors [31,83,84,105], while maintaining or restoring ecological corridors that sustain ecological flows across the landscape [104]. Such interventions are particularly important because increasing fragmentation not only reduces habitat availability but may also weaken the capacity of miombo ecosystems to recover from disturbance [2,4,83,84,102,106]. As forest patches become smaller and more isolated, regeneration processes increasingly depend on dispersal pathways, seed sources, and disturbance regimes operating at broader spatial scales [83,84]. In this context, recurrent anthropogenic fires represent a major challenge to ecosystem recovery [107,108]. Previous studies in the Katangese Copperbelt have shown that roads and settlements often act as focal points for fire ignition and propagation, thereby reinforcing the effects of fragmentation [107]. Accessibility and fire may therefore interact synergistically, creating self-reinforcing degradation cycles in which forest loss increases landscape flammability, while recurrent fires further suppress tree recruitment and forest regeneration [107,109,110,111]. This interaction helps explain why restoring vegetation cover alone may not guarantee long-term ecosystem recovery. Even where forest clearing has ceased, repeated burning can maintain degraded vegetation states dominated by grasses and shrubs, preventing the re-establishment of woody species [106,108,112,113,114]. Consequently, restoration initiatives should move beyond conventional reforestation approaches and incorporate fire management as a central component of landscape restoration [115,116]. Assisted natural regeneration and enrichment planting using native miombo species are unlikely to succeed where recurrent fires remain uncontrolled [106,108,117,118,119]. Community-based fire management, early dry-season prescribed burning, firebreak maintenance, and the protection of regenerating forest patches should therefore be integrated into restoration programs [116,118,119]. Recent advances in tropical restoration ecology further indicate that successful restoration should not be evaluated solely through increases in tree cover [120,121,122,123,124]. In ecosystems characterized by natural forest–savanna mosaics, ecological integrity depends on the maintenance of ecosystem functionality, resilience, and connectivity rather than on maximizing forest extent [125,126,127,128,129]. Restoration efforts in the miombo region should therefore prioritize the recovery of ecological processes and landscape structure [2], while recognizing the ecological importance of non-forest vegetation components [125]. Because forest degradation was most pronounced around villages and accessibility corridors, agroforestry systems may provide an effective mechanism for simultaneously addressing restoration and livelihood objectives [130,131]. By integrating native tree species into agricultural landscapes, agroforestry can enhance soil fertility, diversify household incomes, increase local supplies of fuelwood and timber, and reduce pressure on remaining forests [131,132,133]. At the landscape scale, agroforestry may also improve matrix permeability, strengthen connectivity between forest remnants, and reduce fuel continuity across agricultural areas, thereby contributing to both biodiversity conservation and fire-risk reduction [134,135,136].
5. Conclusions
This study demonstrates that forest degradation in the miombo woodlands of southeastern D.R. Congo is strongly structured by accessibility networks associated with mining development. Between 1998 and 2023, forest cover declined substantially and was progressively replaced by agricultural land, grasslands and wetlands, and built-up/bare areas. These compositional changes were accompanied by increasing landscape disturbance, declining forest patch complexity, and the progressive fragmentation of the forest matrix. The analyses revealed clear accessibility gradients, with forest cover increasing with distance from both villages and the mining exploration road. Forest loss was most severe in highly accessible areas and expanded progressively over time, indicating that roads and settlements jointly organize the spatial distribution of degradation across the landscape. These findings suggest that mining-related landscape transformation extends far beyond the direct footprint of mining activities and operates through broader accessibility-driven processes. From a management perspective, mitigating forest degradation will require interventions that address both forest loss and landscape connectivity. Priority actions should include the establishment of forest conservation zones around remaining forest cores, the maintenance of ecological corridors between forest patches, the regulation of road expansion in mining frontiers, and the restoration of degraded areas surrounding villages and transportation corridors. Integrating these measures into land-use planning frameworks would contribute to reducing fragmentation and maintaining the ecological functioning of miombo ecosystems. Overall, this study highlights the importance of considering accessibility networks as key drivers of landscape transformation and provides a spatially explicit framework for supporting sustainable land management in rapidly expanding mining regions.
Supplementary Materials
The following supporting information can be downloaded at the website of this paper posted on Preprints.org, Figure S1: Villages buffer zones (1-3 km); Figure S2: Road buffer zones; Figure S3: Contiguous segments of the road; Table S1: Ground-truth data; Table S2: Confusion Matrices and Accuracy Metrics; Table S3: Statistical Summary.
Author Contributions
Conceptualization, M.K.B. and J.K.T.; methodology, M.K.B., J.K.T. and Y.U.S.; software, M.K.B. and J.K.T.; validation, E.K.L.M., F.M., H.K.M, Y.U.S. and J.-F.B. and J.B.; formal analysis, M.K.B. and J.K.T.; investigation, M.K.B. and J.K.T; resources, Y.U.S. and J.B.; data curation, M.K.B., M.M.M., D.-d.N.N., F.M., J.-F.B. and J.K.T; writing—original draft preparation, M.K.B. and J.K.T.; writing—review and editing, E.K.L.M., M.M.M., D.-d.N.N., H.K.M., F.M., J.-F.B., Y.U.S and J.B.; visualization, M.K.B., J.K.T., M.M.M., D.-d.N.N. and H.K.M.; supervision, Y.U.S and J.B.; project administration, Y.U.S and J.B.; funding acquisition, Y.U.S and J.B. All authors have read and agreed to the published version of the manuscript.
Funding
This research was funded by VLIR-UOS (IUC-UNILU, grant number CD2021IUC04A104).
Data Availability Statement
Data are available upon request addressed to the corresponding authors.
Acknowledgments
Authors thank the VLIR-UOS (Belgium) for granting a doctoral scholarship to Franco Muamba Kalenda Bwandamuka through the Institutional University Cooperation and ARES-CCD (Belgium) for the scolarship provided to John Kikuni Tchowa and Médard Mpanda Mukenza through the ARBOREKOL Amorce & Valorization Project. The authors have reviewed and edited the output and take full responsibility for the content of this publication.
Conflicts of Interest
The authors declare no conflicts of interest.
References
- Jew, E.K.K.; Dougill, A.J.; Sallu, S.M.; O’Connell, J.; Benton, T.G. Miombo woodland under threat: consequences for tree diversity and carbon storage. For. Ecol. Manag. 2016, 361, 144–153. [Google Scholar] [CrossRef]
- Ribeiro, N.S.; Katerere, Y.; Chirwa, P.W.; Grundy, I.M. Miombo Woodlands in a Changing Environment: Securing the Resilience and Sustainability of People and Woodlands; Springer International Publishing: Cham, Switzerland, 2020; p. 269. [Google Scholar] [CrossRef]
- Muteya, H.K.; N’tambwe, D.-D.N.; Malaisse, F.; Bogaert, J.; Useni, Y. Mapping and quantifying deforestation in the Zambezi ecoregion of Central-Southern Africa: Extent and spatial structure. Front. Remote Sens. 2025, 6, 1590591. [Google Scholar] [CrossRef]
- Ryan, C.M.; Pritchard, R.; McNicol, I.; Owen, M.; Fisher, J.A.; Lehmann, C. Ecosystem services from southern African woodlands and their future under global change. Philos. Trans. R. Soc. Lond. B Biol. Sci. 2016, 371, 20150312. [Google Scholar] [CrossRef] [PubMed]
- Useni, S.Y.; Malaisse, F.; Cabala, K.S.; Munyemba, K.F.; Bogaert, J. Le rayon de déforestation autour de la ville de Lubumbashi (Haut-Katanga, R.D. Congo): synthèse. Tropicultura 2017, 35, 215–221. [Google Scholar]
- N’tambwe, D.-D.N.; Muteya, H.K.; Biloso, A.M.; Malaisse, F.; Useni, S.Y.; Kalenga, W.; Bogaert, J. Socio-economic value and availability of plant-based non-timber forest products (NTFPs) within the charcoal production basin of the city of Lubumbashi (DR Congo). Sustainability 2023, 15, 14943. [Google Scholar] [CrossRef]
- Kikuni, T.J.; Mukenza, M.M.; N’Tambwe, G.D.-D.; Malaisse, F.; Bastin, J.-F.; Useni, S.Y.; Sambieni, K.R.; Tshibangu, K.A.; Biloso, M.A.; Bogaert, J. Urban trade of non-timber forest products (NTFPs) in Kolwezi, DR Congo: Diversity, livelihoods, and sustainability changes. Conservation 2026, 6, 48. [Google Scholar] [CrossRef]
- Gillet, P.; Vermeulen, C.; Feintrenie, L.; Dessard, H.; Garcia, C. Quelles sont les causes de la déforestation dans le bassin du Congo? Synthèse bibliographique et études de cas. Base 2016, 20, 183–194. [Google Scholar] [CrossRef]
- Cabala, K.S.; Useni, S.Y.; Sambieni, K.R.; Bogaert, J.; Munyemba, K.F. Dynamique des écosystèmes forestiers de l’Arc Cuprifère Katangais en République démocratique du Congo. I. Causes, transformations spatiales et ampleur. Tropicultura 2017, 35(3), 192–202. [Google Scholar]
- Mukenza, M.M.; Muteya, H.K.; N’Tambwe, G.D.-D.; Sambiéni, K.R.; Malaisse, F.; Kaleba, S.C.; Bogaert, J.; Useni, S.Y. Uncontrolled Exploitation of Pterocarpus tinctorius Welw. and Associated Landscape Dynamics in the Kasenga Territory: Case of the Rural Area of Kasomeno (DR Congo). Land 2022, 11, 1541. [Google Scholar] [CrossRef]
- Muteya, H.K.; N’tambwe, D.-D.N.; Malaisse, F.; Waselin, S.; Sambiéni, K.R.; Kaleba, S.C.; Kankumbi, F.M.; Bastin, J.F.; Bogaert, J.; Useni, S.Y. Quantification and Simulation of Landscape Anthropization around the Mining Agglomerations of Southeastern Katanga (DR Congo) between 1979 and 2090. Land 2022, 11, 1–17. [Google Scholar] [CrossRef]
- Useni, S.Y.; Mukenza, M.M.; Muteya, H.K.; Cirezi, N.; Malaisse, F.; Bogaert, J. Vegetation fires in the Lubumbashi charcoal production basin (The Democratic Republic of the Congo): Drivers, extent and spatiotemporal dynamics. Land 2023a, 12, 2171. [Google Scholar] [CrossRef]
- Eba’a Atyi, R.; Hiol Hiol, F.; Lescuyer, G.; Mayaux, P.; Defourny, P.; Bayol, N.; Saracco, F.; Pokem, D.; Sufo Kankeu, R.; Nasi, R. Les Forêts du Bassin du Congo: État des Forêts 2021; CIFOR: Bogor, Indonésie, 2022; p. 446. ISBN 978-602-387-178-0. [Google Scholar] [CrossRef]
- Sovacool, B.K. The precarious political economy of cobalt: Balancing prosperity, poverty, and brutality in artisanal and industrial mining in the Democratic Republic of the Congo. Extr. Ind. Soc. 2019, 6, 915–939. [Google Scholar] [CrossRef]
- Sovacool, Benjamin K. When Subterranean Slavery Supports Sustainability Transitions? Power, Patriarchy, and Child Labor in Artisanal Congolese Cobalt Mining. Extract. Ind. Soc. 2020, 7(4), 1316–29. [Google Scholar]
- Rubbers, B. Mining Boom, Labour Market Segmentation and Social Inequality in the Congolese Copperbelt. Dev. Change 2019, 50, 984–1005. [Google Scholar]
- Wakenge, C.I.; Nyenyezi, B.M.-R.; Bergh, S.I.; Cuvelier, J. From ‘Conflict Minerals’ to Peace? Reviewing Mining Reforms, Gender, and State Performance in Eastern Democratic Republic of Congo. Extr. Ind. Soc. 2021, 8, 100–119. [Google Scholar] [CrossRef]
- Gulley, A.L. China, the Democratic Republic of the Congo, and Artisanal Cobalt Mining from 2000 through 2020. PNAS 2023, 120, e2300841120. [Google Scholar] [CrossRef]
- Amisi, M.Y.; Vranken, I.; Nkulu, J.; Lubaba, T.R.F.; Kyanika, D.; Tshibang, N.S.; Mastaki, U.F.; Bulambo, J.-P.; Bogaert, J. L’activité minière au Katanga et la perception de ses impacts à Lubumbashi. In Anthropisation des Paysages Katangais; Bogaert, J., Colinet, G., Mahy, G., Eds.; Presses Universitaires de Liège: Liège, Belgium, 2018; pp. 267–279. [Google Scholar]
- Cabala, S.K.; Useni, Y.S.; Amisi, M.Y.; Bogaert, J.; Kankumbi, F.M. Analyse structurale de la dynamique forestière dans la région de l’Arc Cuprifère Katangais en République démocratique du Congo. II. Analyse complémentaire de la fragmentation forestière. Tropicultura 2018a, 36, 621–630. [Google Scholar]
- Bebbington, A.J.; Bebbington, D.H.; Sauls, L.A.; Rogan, J.; Agrawal, S.; Gamboa, C.; Imhof, A.; Johnson, K.; Rosa, H.; Royo, A.; Toumbourou, T.; Verdum, R. Resource extraction and infrastructure threaten forest cover and community rights. PNAS 2018, 115, 13164–13173. [Google Scholar] [CrossRef] [PubMed]
- Siqueira-Gay, J.; Sonter, L.J.; Sánchez, L.E. Exploring potential impacts of mining on forest loss and fragmentation within a biodiverse region of Brazil’s northeastern Amazon. Resour. Policy 2020, 66, 101622. [Google Scholar]
- Laurent, B.; Merlin, J. L’ingénierie de la promesse: le renouveau minier français et la « mine responsable ». Nat. Sc. Soc. 2021, 5, 55–68. [Google Scholar]
- Dabros, A.; Antwi, E.K.; Waldron, C.; Darko, A.N.; Higgins, K.L. Risk assessment of potential impact of mining development (linear infrastructure) on peatland ecosystems in the Ring of Fire region, Northern Ontario. Front. Environ. Sc. 2025, 13, 1676633. [Google Scholar] [CrossRef]
- Engert, J.E.; Liang, J.; Huerta, A.; Bryan, B.A.; Murali, R. Ghost roads and the destruction of Asia-Pacific tropical forests. Nature 2024, 629, 370–375. [Google Scholar] [CrossRef]
- Kleinschroth, F.; Laporte, N.; Laurance, W.F.; Goetz, S.J.; Ghazoul, J. Road expansion and persistence in forests of the Congo Basin. Nat. Sustain. 2019, 2, 628–634. [Google Scholar] [CrossRef]
- López-Carr, D. A review of small farmer land use and deforestation in tropical forest frontiers: Implications for conservation and sustainable livelihoods. Land 2021, 10, 1113. [Google Scholar] [CrossRef]
- Zheng, X.; Chen, J.; Zou, Z.; Zhen, S.; Liu, S.; Li, J.; Zuo, X.; Lin, S.; Wu, Z.; Zhang, L.; Lin, Q.; Yan, G.; Hong, T.; Qiu, R.; Li, J.; Wu, C.; Hu, X. Sprawling roads enhanced tropical forest loss during the period 2001–2020. Commun. Earth Environ. 2025, 6, 218. [Google Scholar] [CrossRef]
- Barber, C.P.; Cochrane, M.A.; Souza, C.M.; Laurance, W.F. Roads, deforestation, and the Mitigating Effect of Protected Areas in the Amazon. Biol. Conserv. 2014, 177, 203–209. [Google Scholar] [CrossRef]
- Karsenty, A. Géopolitique des forêts du monde. Quelles stratégies de lutte contre la déforestation ? In Études de l’Ifri. Ifri, 2021. Available online: https://www.researchgate.net/publication/352878286_Geopolitique_des_forets_du_monde_ (accessed on 10 June 2026).
- Engert, J.E.; Souza, C.M., Jr.; Kleinschroth, F.; Bignoli, D.J.; Costa, S.C.P.; Botelho, J., Jr.; Ishida, F.Y.; Nursamsi, I.; Laurance, W.F. Explosive growth of secondary roads is linked to widespread tropical deforestation. Curr. Biol. 2025a, 35, 1641–1648.e4. [Google Scholar] [CrossRef] [PubMed]
- Useni, S.Y.; Cabala, K.S.; Halleux, J.M.; Bogaert, J.; Munyemba, K.F. Caractérisation de la croissance spatiale urbaine de la ville de Lubumbashi (Haut-Katanga, R.D. Congo) entre 1989 et 2014. Tropicultura 2018, 36, 99–108. [Google Scholar]
- Bryceson, D.; Gough, K.; Jønsson, J.B.; Kinabo, C.; Shand, M.; Rodrigues, C.; Yankson, P. Mineralized urbanization in Africa in the twenty-first century: Becoming urban through mining extraction. Int. J. Urban Reg. Res. 2022, 46, 401–423. [Google Scholar]
- Useni, S.Y.; Malaisse, F.; Dibwe, D.-M.D.; Bogaert, J. Lubumbashi (DR Congo): Navigating the socio-ecological complexities of a vital mining hub. Cities 2024a, 154, 105341. [Google Scholar] [CrossRef]
- Hunde, F.M.; Benti, A.A.; Kapula, T.J. Impact of population pressure on forest resources depletion in Yayo coffee forest Biosphere Reserve, Southwest Ethiopia. PLoS ONE accessed on. 2026. (accessed on 18 May 2026). [Google Scholar] [CrossRef] [PubMed]
- Teweldebrihan, M.D.; Gebrehiwota, T.; Teklewold, H.; Dinka, M.; Abera, W.; Tamene, L. Understanding the role of push and pull factors on agricultural land expansion: A case study of Adaba and Adiyo district, Ethiopia. Environ. Chall. 2023, 11, 100762. [Google Scholar] [CrossRef]
- Ababu, T.; Eyasu, A.; Abebe, M.; Negasa, A.; Girma, G.; Furo, G. Analysis of land use change from forest to agriculture and its determinants: The case of East Shewa, Oromia, Ethiopia. Indones. J. Soc. Environ. Issues 2024, 5, 19–32. [Google Scholar] [CrossRef]
- Phiri, D.; Mwitwa, J.; Ng’andwe, P.; Kanja, K.; Munyaka, J.; Chileshe, F.; Hamazakaza, P.; Kapembwa, S.; Kwenye, J. Agricultural expansion into forest reserves in Zambia: A remote sensing approach. Geocarto Int. 2023, 38, 460–480. [Google Scholar] [CrossRef]
- Cabala, K.S.; Useni, S.Y.; Mwana Yamba, A.; Munyemba, K.F.; Bogaert, J. Activités anthropiques et dynamique des écosystèmes forestiers dans les zones territoriales de l’Arc Cuprifère Katangais (RD Congo). Tropicultura 2022, 40, 1–27. [Google Scholar] [CrossRef]
- Useni, S.Y.; Mukenza, M.M.; Kikuni, T.J.; Kabamb, K.D.; Malaisse, F.; Bogaert, J. Hierarchical analysis of Miombo woodland spatial dynamics in Lualaba Province (Democratic Republic of the Congo), 1990–2024: Integrating remote sensing and landscape ecology techniques. Remote Sens. 2024b, 16, 3903. [Google Scholar] [CrossRef]
- Muteya, H.K.; N’Tambwe, D.-D.N.; Mwamba, K.F.; Strammer, H.; Munyemba, F.K.; Malaisse, F.; Bastin, J.-F.; Useni, S.Y.; Bogaert, J. Mapping and quantification of Miombo deforestation in the Lubumbashi charcoal production basin (DR Congo): Spatial extent and changes between 1990 and 2022. Land 2023, 12, 1852. [Google Scholar] [CrossRef]
- Useni, S.Y.; Bogaert, J. The evolution of landscape ecology in the Democratic Republic of the Congo (2005–2025): Scientific advances, methodological challenges, and future directions. Earth 2025, 6, 97. [Google Scholar] [CrossRef]
- Xu, J.; Zhao, Y.; Zhong, K.; Zhang, F.; Liu, X. Sprawling roads enhanced tropical forest loss during the period 2001–2020. Commun. Earth Environ. 2025, 6, 183. [Google Scholar] [CrossRef]
- Zhou, D.; Xiao, J.; Liu, S.; Huang, L.; Zhang, L.; Fan, J.; Zhao, S. Global impacts of transportation infrastructure on forest degradation and loss. Nat. Commun. 2026, 17, 2339. [Google Scholar] [CrossRef] [PubMed]
- Useni, S.Y.; Boisson, S.; Cabala, K.S.; Nkuku, K.C.; Malaisse, F.; Halleux, J.-M.; Bogaert, J.; Munyemba, K.F. Dynamique de l’occupation du sol autour des sites miniers le long du gradient urbain-rural de la ville de Lubumbashi, RD Congo. Base 2020, 24, 14–27. [Google Scholar] [CrossRef]
- Global Forest Watch. Deforestation statistics for Mutshatsha Territory, Lualaba Province, Democratic Republic of the Congo . World Resources Institute. 2023. Available online: https://www.globalforestwatch.org (accessed on 14 June 2026).
- NASA JPL. NASADEM merged DEM global 1 arc second V001 [Ensemble de données]. NASA EOSDIS Land Processes Distributed Active Archive Center (LP DAAC). accessed on. 2020. (accessed on 25 May 2026). [CrossRef]
- Lualaba Investment holding. Territoire de Mutshatsha . Province du Lualaba, République démocratique du Congo. 2019. Available online: https://lualaba-investment.com/mutshatsha/ (accessed on 13 June 2026).
- Sedano, F.; Mizu-Siampale, A.; Duncanson, L.; Liang, M. Influence of charcoal production on forest degradation in Zambia: A remote sensing perspective. Remote Sens. 2022, 14, 3352. [Google Scholar] [CrossRef]
- Zhang, X.; Zhao, T.; Xu, H.; Liu, W.; Wang, J.; Chen, X.; Liu, L. GLC_FCS30D: The first global 30 m land-cover dynamics monitoring product with a fine classification system for the period from 1985 to 2022 generated using dense-time-series Landsat imagery and the continuous change-detection method. Earth Syst. Sci. Data 2024, 16, 1353–1381. [Google Scholar] [CrossRef]
- Wulder, M.A.; Loveland, T.R.; Roy, D.P.; Crawford, C.J.; Masek, J.G.; Woodcock, C.E.; Allen, R.G.; Anderson, M.C.; Belward, A.S.; Cohen, W.B.; Dwyer, J.; Erb, A.; Gao, F.; Griffiths, P.; Helder, D.; Hermosilla, T.; Hipple, J.; Hostert, P.; Hughes, M.J.; Huntington, J.; Johnson, D.M.; Kennedy, R.; Kilic, A.; Li, Z.; Lymburner, L.; McCorkel, J.; Pahlevan, N.; Scambos, T.A.; Schaaf, C.; Schott, J.R.; Sheng, Y.; Storey, J.; Vermote, E.; Vogelmann, J.; White, J.C.; Wynne, R.H.; Zhu, Z. Current status of Landsat program, science, and applications. Remote Sens. Environ. 2019, 225, 127–147. [Google Scholar] [CrossRef]
- Foga, S.; Scaramuzza, P.L.; Guo, S.; Zhu, Z.; Dilley, R.D.; Beckmann, T.; Schmidt, G.L.; Dwyer, J.L.; Hughes, M.J.; Laue, B. Cloud Detection Algorithm Comparison and Validation for Operational Landsat Data Products. Remote Sens. Environ. 2017, 194, 379–390. [Google Scholar] [CrossRef]
- Zhao, Y.; An, R.; Xiong, N.; Ou, D.; Jiang, C. Spatio-Temporal Land-Use/Land-Cover Change Dynamics in Coastal Plains in Hangzhou Bay Area, China from 2009 to 2020 Using Google Earth Engine. Land 2021, 10, 1149. [Google Scholar] [CrossRef]
- Vermote, E.; Justice, C.; Claverie, M.; Franch, B. Preliminary analysis of the performance of the Landsat 8/OLI land surface reflectance product. Remote Sens. Environ. 2016, 185, 46–56. [Google Scholar] [CrossRef]
- Imam, E. Remote Sensing and GIS Module: Colour Composite Images and Visual Image Interpretation.; University Grand Commission (UGC), MHRD, Government of India: New Delhi, India, 2019; p. 20. [Google Scholar]
- Imorou, I.T.; Arouna, O.; Zakari, S.; Djaouga, M.; Thomas, O.; Kinmadon, G. Des images satellites pour la gestion durable des territoires en Afrique. In Proceedings of the Actuellement au Bénin la Conférence OSFACO, Cotonou, Bénin, 2019; pp. 1–2. [Google Scholar]
- Mullissa, A.G.; Remelgado, R.; Körner, M.; Herold, M. Training data in satellite image classification for land cover mapping: A review. Int. J. Remote Sens. 2024, 45, 3training. [Google Scholar] [CrossRef]
- Useni, S.Y.; Kipili, M.I.; Muteya, H.K.; Malaisse, F.; Bogaert, J. Anthropogenic pressures and spatio-temporal dynamics of forest ecosystems in the rural and border municipality of Kasenga (DRC). Landsc. Ecol. Eng. 2024c, 20, 195–212. [Google Scholar] [CrossRef]
- Stanimirova, R.; Tarrio, K.; Turlej, K.; McAvoy, K.; Stonebrook, S.; Hu, K.-T.; Arévalo, P.; Bullock, E.L.; Zhang, Y.; Woodcock, C.E.; Olofsson, P.; Zhu, Z.; Barber, C.P.; Souza, C.; Chen, S.; Wang, J.A.; Mensah, F.; Calderón-Loor, M.; Hadjikakou, M.; Bryan, B.A.; Graesser, J.; Beyene, D.L.; Mutasha, B.; Siame, S.; Siampale, A.; Friedl, M.A. A global land cover training dataset from 1984 to 2020. Sci. Data. 2023, 10, 879. [Google Scholar] [CrossRef] [PubMed]
- Phan, T.N.; Kuch, V.; Lehnert, L.W. Land Cover Classification Using Google Earth Engine and Random Forest Classifier—The Role of Image Composition. Remote Sens. 2020, 12, 2411. [Google Scholar] [CrossRef]
- Mahdianpari, M.; Salehi, B.; Mohammadimanesh, F.; Motagh, M. Random Forest Wetland Classification Using ALOS-2 L-Band, RADARSAT-2 C-Band, and TerraSAR-X Imagery. ISPRS J. Photogramm. Remote Sens. 2017, 130, 13–31. [Google Scholar] [CrossRef]
- Mi, J.; Yang, Y.; Zhang, S.; An, S.; Hou, H.; Hua, Y.; Chen, F. Tracking the land use/land cover change in an area with underground mining and reforestation via continuous Landsat classification. Remote Sens. 2019, 11, 1–22. [Google Scholar] [CrossRef]
- Belgiu, M.; Drăguț, L. Random forest in remote sensing: A review of applications and future directions. ISPRS J. Photogramm. Remote Sens. 2016, 114, 24–31. [Google Scholar] [CrossRef]
- Sovann, C.; Olin, S.; Mansourian, A.; Sakhoeun, S.; Prey, S.; Kok, S.; Tagesson, T. Importance of spectral information, seasonality, and topography on land cover classification of tropical land cover mapping. Remote Sens. 2025, 17, 1551. [Google Scholar] [CrossRef]
- Breiman, L. Random forests. Mach. Learn. 2001, 45, 5–32. [Google Scholar] [CrossRef]
- Probst, P.; Wright, M.N.; Boulesteix, A.-L. Hyperparameters and tuning strategies for random forest. WIREs Data Min. Knowl. Discov. 2019, 9, e1301. [Google Scholar] [CrossRef]
- Sun, J.; Ongsomwang, S. Optimal parameters of random forest for land cover classification with suitable data type and dataset on Google Earth Engine. Front. Earth Sci. 2023, 11, 1188093. [Google Scholar] [CrossRef]
- Congalton, R.G.; Green, K. Assessing the accuracy of remotely sensed data: Principles and practices, 3rd ed.; CRC Press/Taylor & Francis, 2019; p. 346. [Google Scholar] [CrossRef]
- Landis, J.R.; Koch, G.G. The measurement of observer agreement for categorical data. Biometrics 1997, 33, 159–174. [Google Scholar] [CrossRef]
- Foody, G.M. Explaining the unsuitability of the kappa coefficient in the assessment and comparison of the accuracy of thematic maps obtained by image classification. Remote Sens. Environ. 2020, 239, 111630. [Google Scholar] [CrossRef]
- McGarigal, K.; Cushman, S.A.; Ene, E. FRAGSTATS v4: Spatial pattern analysis program for categorical maps [Logiciel]; University of Massachusetts Amherst, 2023; Available online: https://www.fragstats.org.
- Muteya, H.K.; N’tambwe, D.-D.N.; Mleci, J.Y.; Malaisse, F.; Bogaert, J.; Useni, S.Y. Drivers and biodiversity indicators of Miombo degradation in the Lubumbashi charcoal production basin (Upper Katanga, DR Congo). Discov. For. 2026, 2, 4. [Google Scholar] [CrossRef]
- Puyravaud, J.-P. Standardizing the calculation of the annual rate of deforestation. For. Ecol. Manag. 2003, 177, 593–596. [Google Scholar] [CrossRef]
- Muteya, H.; Mukenza, M.M.; Kipili, I.M.; Malaisse, F.; N’tambwe, D.-D.N.; Kasanda, M.N.; Bastin, J.-F.; Bogaert, J.; Useni, S.Y. Protected area creation and its limited effect on deforestation: Insights from the Kiziba-Baluba hunting domain (DR Congo). Trees For. People 2024, 18, 100654. [Google Scholar] [CrossRef]
- Catalán, A. El proceso de deforestación en Venezuela entre 1975-1988. Rev. Ambiente 1992, 49, 1–12. [Google Scholar]
- O’Neill, R.V.; Krummel, J.R.; Gardner, R.H.; Sugihara, G.; Jackson, B.; DeAngelis, D. L.; Milne, B.T.; Turner, M.G.; Zygmunt, B.; Christensen, S.W.; Dale, V.H.; Graham, R.L. Indices of landscape pattern. Landsc. Ecol. 1988, 1, 153–162. [Google Scholar] [CrossRef]
- Useni, S.Y.; Kipili, M.I.; Muteya, H.K.; Malaisse, F.; Bogaert, J. Thirty-three years of land cover change analysis on Idjwi Island (DRC) using remote sensing and landscape metrics. Landsc. Res. 2025. [Google Scholar] [CrossRef]
- De Haulleville, T.; Bogaert, J. Fourteen Years of Anthropization Dynamics in the Uapaca bojeri Baill forest of Madagascar. Landsc. Ecol. Eng. 2018, 14, 35–146. [Google Scholar] [CrossRef]
- Lausch, A.; Baade, J.; Bumberger, J.; Heurich, M.; Krzystek, P. Linking landscape structure and ecological processes: Landscape metrics as indicators of ecosystem integrity. Ecol. Indic. 2019, 101, 102–112. [Google Scholar]
- Negret, P.J.; Sonter, L.; Watson, J.E.M.; Possingham, H.P.; Jones, K.R.; Crouzeilles, R.; Aguilar, R.; Brancalion, P.H.S. Empirical evidence for a diminishing trend in forest cover in Colombian protected areas and its relationship to surrounding deforestation. Conserv. Biol. 2020, 34, 1452–1462. [Google Scholar] [CrossRef] [PubMed]
- Hansen, M.C.; Potapov, P.V.; Moore, R.; Hancher, M.; Turubanova, S. Monitoring global forest change: A decade of Landsat-based forest disturbance mapping. Remote Sens. Environ. 2020, 248, 111986. [Google Scholar] [CrossRef]
- Laurance, W.F.; Clements, G.R.; Sloan, S.; O’Connell, C.S.; Mueller, N.D.; Goosem, M.; Arrea, I.B. The impacts of roads and infrastructure on tropical forests. Trends Ecol. Evol. 2018, 33, 441–453. [Google Scholar] [CrossRef] [PubMed]
- Haddad, N.M.; Brudvig, L.A.; Clobert, J.; Davies, K.F.; Gonzalez, A.; Holt, R.D.; Lovejoy, T.E.; Sexton, J.O.; Austin, M.P.; Collins, C.D.; Cook, W.M.; Damschen, E.I.; Ewers, R.M.; Foster, B.L.; Jenkins, C.N.; King, A.J.; Laurance, W.F.; Levey, D.J.; Margules, C.R.; Melbourne, B.A.; Nicholls, A.O.; Orrock, J.L.; Song, D.-X.; Townshend, J.R. Habitat fragmentation and its lasting impact on Earth’s ecosystems. Sci. Adv. 2015, 1, e1500052. [Google Scholar] [CrossRef] [PubMed]
- Fletcher, R.J., Jr.; Betts, M.G.; Damschen, E.I.; Hefley, T.J.; Hightower, J.; Smith, T.A.H.; Fortin, M.-J.; Haddad, N.M. Addressing the problem of scale that emerges with habitat fragmentation. Glob. Ecol. Biogeogr. 2023, 32, 828–841. [Google Scholar] [CrossRef]
- Lisboa, C.S.N.; Grinand, C.; Betbeder, J.; Montfort, F.; Blanc, L. Disentangling the drivers of deforestation and forest degradation in the Miombo landscape: A case study from Mozambique. Int. J. Appl. Earth Obs. Geoinf. 2024, 130, 103904. [Google Scholar] [CrossRef]
- Slagter, B.; Fesenmyer, K.; Hethcoat, M.; Belair, E.; Ellis, P.; Kleinschroth, F.; Peña-Claros, M.; Herold, M.; Reiche, J. Monitoring road development in Congo Basin forests with multi-sensor satellite imagery and deep learning. Remote Sens. Environ. 2024, 315, 114380. [Google Scholar] [CrossRef]
- Engert, J.E.; Kleinschroth, F.; Ishida, F.Y.; Costa, S.P.; Botelho, J.; Laurance, W.F. Explosive growth of secondary roads is linked to widespread tropical deforestation. Curr. Biol. 2025b, 35, 1446–1458. [Google Scholar] [CrossRef] [PubMed]
- Otamonga, J.-P.; Poté, J.W. Abandoned mines and artisanal and small-scale mining in the Democratic Republic of the Congo (DRC): Survey and agenda for future research. J. Geochem. Explor. 2020, 208, 106394. [Google Scholar] [CrossRef]
- Giljum, S.; Maus, V.; Kuschnig, N.; Luckeneder, S.; Tost, M.; Sonter, L.J.; Bebbington, A.J. A pantropical assessment of deforestation caused by industrial mining. Proc. Natl. Acad. Sci. 2022, 119, e2118273119. [Google Scholar] [CrossRef] [PubMed]
- Giljum, S.; Maus, V.; Kuschnig, N.; Luckeneder, S.; Tost, M.; Sonter, L.J.; Bebbington, A.J. Mining causes direct and indirect loss of tropical forests (FINEPRINT Brief No. 17). In Vienna University of Economics and Business; 2023; Available online: https://www.fineprint.global/publications/briefs/mining-deforestation/.
- Ladewig, J.; Ordway, E.M.; Kaczan, D.; Naughton-Treves, L. Artisanal mining drives extensive indirect deforestation in eastern Democratic Republic of Congo. Nature 2024, 2024(628), 123–130. [Google Scholar] [CrossRef]
- Sonter, L.J.; Herrera, D.; Barrett, D.J.; Galford, G.L.; Moran, C.J.; Soares-Filho, B.S. Mining drives extensive deforestation in the Brazilian Amazon. Nat. Commun. 2017, 8, 1013. [Google Scholar] [CrossRef] [PubMed]
- Potapov, P.; Turubanova, S.; Tyukavina, A.; Hansen, M.C.; Pickens, A.; Hernandez-Serna, A.; Zutta, B. Global maps of forest extent and change for 2000–2020 . Nature 2022, 608, 720–727. [Google Scholar] [CrossRef]
- Fahrig, L.; Arroyo-Rodríguez, V.; Bennett, J.R.; Boucher-Lalonde, V.; Cazetta, E.; Currie, D.J.; Eigenbrod, F.; Ford, A.T.; Harrison, S.P.; Jaeger, J.A.G.; Koper, N.; Martin, A. E.; Martin, J.-L.; Metzger, J.P.; Morrison, P.; Rhodes, J.R.; Saunders, D.A.; Slatyer, R.; Smith, A.C.; Watling, J.I. Is habitat fragmentation bad for biodiversity? Biol. Conserv. 2022, 269, 109495. [Google Scholar]
- Engert, J.E.; Souza, C.M., Jr.; Kleinschroth, F.; Bignoli, D.J.; Costa, S.C.P.; Botelho, J., Jr.; Ishida, F.Y.; Nursamsi, I.; Laurance, W.F. Explosive growth of secondary roads is linked to widespread tropical deforestation. Curr. Biol. 2025a, 35, 1641–1648.e4. [Google Scholar] [CrossRef] [PubMed]
- Busch, J.; Ferretti-Gallon, K. What drives and stops deforestation, reforestation, and forest degradation? An updated meta-analysis. Rev. Environ. Econ. Policy 2023, 17, 217–250. [Google Scholar] [CrossRef] [PubMed]
- Shapiro, A.C.; Grantham, H.S.; Elmore, A.C.; Goldman, E.D. Small-scale agriculture continues to drive deforestation and degradation in fragmented forests in the Congo Basin (2015–2020). Land Use Policy 2023, 134, 106922. [Google Scholar] [CrossRef]
- Meyfroidt, P.; Abeygunawardane, D.; Baumann, M.; Bey, A.; Buchadas, A.; Chiarella, C.; Junquera, V.; Kronenburg García, A.; Kuemmerle, T.; le Polain de Waroux, Y.; Oliveira, E.; Picoli, M.; Qin, S.; Rodriguez García, V.; Rufin, P. Explaining the emergence of land-use frontiers. R. Soc. Open Sci. 2024, 11, 240295. [Google Scholar] [CrossRef] [PubMed]
- Forest Declaration Assessment. Forests and climate: Stepping up action. Regional assessment: Congo Basin . Forest Declaration Assessment. 2022. Available online: https://forestdeclaration.org/wp-content/uploads/2022/11/2022RegionalAssessment_ENG.pdf.
- Bourgoin, C.; Ceccherini, G.; Girardello, M.; Vancutsem, C.; Avitabile, V.; Beck, P.S.A.; Beuchle, R.; Blanc, L.; Duveiller, G.; Migliavacca, M.; Vieilledent, G.; Cescatti, A.; Achard, F. Human degradation of tropical moist forests is greater than previously estimated. Nature 2024, 631, 570–576. [Google Scholar] [CrossRef] [PubMed]
- Biswas, S.; Hansen, M.C.; Potapov, P.; Turubanova, S.; Stehman, S.V.; Tyukavina, A. Increasing forest disturbance in the Congo Basin is driven by an emerging frontier in Cameroon. Earth’s Future 2025, 13, e2024EF005613. [Google Scholar] [CrossRef]
- Hordijk, I.; Poorter, L.; Meave, J.A.; Bongers, F.; van der Sande, M.T.; Mendoza, R.D.L.; Romero; de Jong, P.J.; Matinez-Ramos, J.M. Land use history and landscape forest cover determine tropical forest recovery. J. Appl. Ecol. 2024, 2024(61), 2365–2381. [Google Scholar] [CrossRef]
- Naidoo, R.; Aylward, C.; Elliott, W.; Keeley, A.; Kinnaird, M.; Knight, M.; Papp, C.; Thapa, K.; Antelo, R. From science to impact: Conserving ecological connectivity in large conservation landscapes. PNAS 2025, 122, e2410937122. [Google Scholar] [CrossRef] [PubMed]
- Keeley, A.T.H.; Beier, P.; Keeley, B.W.; Fagan, M.E. Thirty years of connectivity conservation planning: An assessment of progress and priorities. Biol. Conserv. 2023, 283, 110–118. [Google Scholar] [CrossRef]
- Laurance, W.F.; Campbell, M.J.; Alamgir, M.; Mahmoud, M.I. Road Expansion and the Fate of Africa’s Tropical Forests. Front. Ecol. Evol. 2017, 5. [Google Scholar] [CrossRef]
- Sitoe, A.; Ribeiro, N.; Guedes, B.; Matavel, N. Regeneration and restoration status of Miombo woodland following land use land cover changes at the buffer zone of Gile National Park, Central Mozambique. Trees For. People 2022, 9, 100290. [Google Scholar] [CrossRef]
- Useni, S.Y.; Mukenza, M.M.; Malaisse, F.; Kaseya, P.K.; Bogaert, J. The Spatiotemporal Changing Dynamics of Miombo Deforestation and Illegal Human Activities for Forest Fire in Kundelungu National Park, Democratic Republic of the Congo. Fire 2023b, 6, 174. [Google Scholar] [CrossRef]
- Meneses, O.M.; Ribeiro, N.S.; Shirvani, Z.; Andrew, S.M. Resilience of the Miombo Woodland to Different Fire Frequencies in the LevasFlor Forest Concession, Central Mozambique. Forests 2025, 16, 10. [Google Scholar] [CrossRef]
- Brando, P.M.; Soares-Filho, B.; Rodrigues, L.; Assunção, A.; Morton, D.; Tuchschneider, D.; Coe, M.T.; Silvério, D.V.; Oliveira, U.; Alencar, A.A.C. The gathering firestorm in southern Amazonia. Sc. Adv. 2020, 6(2), eaay1632. [Google Scholar] [CrossRef] [PubMed]
- Zhang, A.; Wang, Y.; Zou, Y. Positive feedback to regional climate enhances African wildfires. Science 2023, 26, 108533. [Google Scholar] [CrossRef] [PubMed]
- Werner, P.A.; Peacock, S.J. Fire return intervals and recruitment affect population growth rate of canopy trees in tall open forest in humid savanna. For. Ecol. Manag. 2024, 571, 122058. [Google Scholar] [CrossRef]
- Morin, A.; Verhegghen, A.; Hansen, M.C.; Potapov, P.; Stibig, H.-J.; Achard, F.; Ernst, C. Rate of forest recovery after fire exclusion on anthropogenic savannas in the Democratic Republic of Congo. Biol. Conserv. 2019, 233, 118–130. [Google Scholar] [CrossRef]
- Veenendaal, E.M.; Torello-Raventos, M.; Miranda, H.S.; Sato, N.M.; Janssen, T.A.J.; van Langevelde, F.; Lloyd, J. Fire regimes, fire experiments and alternative stable states in mesic savannas. New Phytol. 2021, 232, 1–5. [Google Scholar] [CrossRef] [PubMed]
- Beckett, H.; Cromsigt, J.P.G.M.; Maponga, T.S.; Muvengwi, J.; te Beest, M. Pathways of savannization in a mesic African savanna–forest mosaic following an extreme fire. J. Ecol. 2022, 110, 1346–1358. [Google Scholar] [CrossRef]
- Johansson, M.U.; Abebe, F.B.; Nemomissa, S.; Bekele, T.; Hylander, K. Ecosystem restoration in fire-managed savanna woodlands: Effects on biodiversity, local livelihoods and fire intensity. Ambio 2020, 50, 1040–1052. [Google Scholar] [CrossRef] [PubMed]
- Russell-Smith, J.; Yates, C.; Vernooij, R.; Eames, T.; Lucas, D.; Mbindo, K.; Banda, S.; Mukoma, K.; Kaluka, A.; Liseli, A.; Mafoko, J.; Lekoko, O.; Beatty, R.; Kaestli, M.; van der Werf, G.; Ribeiro, N. Framework for a savanna burning emissions abatement methodology applicable to fire-prone miombo woodlands in southern Africa. Int. J. Wildland Fire 2024, 33, WF23193. [Google Scholar] [CrossRef]
- Fujita, T. Fire suppression and seed dispersal play critical roles in the establishment of tropical forest tree species in southeastern Africa. Sci. Rep. 2021, 11, 16523. [Google Scholar] [CrossRef] [PubMed]
- Ssekuubwa, E.; van Goor, W.; Snoep, M.; Riemer, K.; Wanyama, F.; Waiswa, D.; Yikii, F.; Tweheyo, M. Tree functional composition, functional diversity, and aboveground biomass show dissimilar trajectories in a tropical secondary forest restored through assisted natural regeneration. Ecol. Evol. 2023, 13, e9870. [Google Scholar] [CrossRef] [PubMed]
- Syampungani, S.; Moyo, B.H.Z.; Sichingabula, H.M.; Syampungani, D. Pathways towards Miombo restoration: A lesson from fire and grazing exclusion plots at Kitulangalo Miombo Woodlands, Morogoro Tanzania. Open J. Ecol. 2025, 15, 1–15. [Google Scholar] [CrossRef]
- Crouzeilles, R.; Ferreira, M.S.; Chazdon, R.L.; Lindenmayer, D.B.; Sansevero, J.B.B.; Monteiro, L.; Iribarrem, A.; Latawiec, A.E.; Strassburg, B.B.N. Ecological restoration success is higher for natural regeneration than for active restoration in tropical forests. Sc. Adv. 2017, 3, e1701345. [Google Scholar] [CrossRef] [PubMed]
- Shimamoto, C.Y.; Padial, A.A.; da Rosa, C.M.; Marques, M.C.M. Restoration of ecosystem services in tropical forests: A global meta-analysis. PLoS ONE 2018, 13, e0208523. [Google Scholar] [CrossRef] [PubMed]
- Derhê, M.A.; Murphy, H.; Monteith, G.; Menéndez, R. Measuring the success of reforestation for restoring biodiversity and ecosystem functioning. J. Appl. Ecol. 2016, 53, 1714–1724. [Google Scholar] [CrossRef]
- Banin, L.; Raine, E.H.; Rowland, L.; Chazdon, R.L.; Smith, S.W.; Rahman, N.E.B.; Butler, A.; Philipson, C.D.; Applegate, G.; Axelsson, E.P.; Budiharta, S.; Chua, S.C.; Cutler, M.E.J.; Elliott, S.; Gemita, E.; Godoong, E.; Graham, L.L.B.; Hayward, R.; Hector, A.; Burslem, D.F.R.P. The road to recovery: a synthesis of outcomes from ecosystem restoration in tropical and sub-tropical Asian forests. Philos. Trans. R. Soc. B. 2022, 377, 20210055. [Google Scholar]
- Bastin, J.-F.; Latte, N.; Bogaert, J.; Garcia, C.A.; Berzaghi, F.; Maestre, F.T.; Svenning, J.-C.; Assede, E.; Barima, S.; Besisa, T.; Bouchoms, S.; Crowther, T.W.; de Haulleville, T.; de Lame, H.; Depoortere, P.; Dufrêne, M.; Hoek Van Dijke, A.J.; Lhoest, S.; Mahy, G.; Messier, C.; Mollicone, D.; Ramalason, F.N.; Peaucelle, M.; Plumacker, A.; Quétier, F.; Rakotondrasoa, O.; Sambieni, K.R.; Sparrow, B.; Tarelkin, Y.; Useni, S.Y.; Vander Linden, A.; Lejeune, P. Global alternatives of natural vegetation cover. Nat. Commun. 2025, 16, 6484. [Google Scholar] [CrossRef] [PubMed]
- Williamson, C.A.; Beckett, H.; Bond, W.J. How forests survive alongside flammable open ecosystems: Conservation implications for Africa. Front. Conserv. Sc. 2023, 4, 1150516. [Google Scholar] [CrossRef]
- Pashanejad, E.; Kharrazi, A.; Araujo-Gutierrez, Z.M.F.; Robinson, B.E.; Fath, B.D.; Parrott, L. A functional connectivity approach for exploring interactions of multiple ecosystem services in the context of agricultural landscapes in the Canadian prairies. Ecosyst. Serv. 2024, 68, 101639. [Google Scholar] [CrossRef]
- Pletcher, E.; Staver, C.; Schwartz, N.B. The environmental drivers of tree cover and forest–savanna mosaics in Southeast Asia. Ecography 2022, 45, 1–12. [Google Scholar] [CrossRef]
- Pletcher, E.; Smith-Tripp, S.; Evans, D.; Schwartz, N.B. Evaluating global vegetation products for application in heterogeneous forest–savanna landscapes. Int. J. Remote Sens. 2024, 45, 492–507. [Google Scholar] [CrossRef]
- Armenteras-Pascual, D.; Garcia-Suabita, W.; Garcia-Samaca, A.S.; Reyes-Palacios, A. Tree functional traits’ responses to forest edges and fire in the savanna landscapes of northern South America. Forests 2025, 16, 208. [Google Scholar] [CrossRef]
- Murniati; Suharti, S.; Minarningsih; Nuroniah, H.S.; Rahayu, S.; Dewi, S. What Makes Agroforestry a Potential Restoration Measure in a Degraded Conservation Forest? Forests 2022, 13, 267. [Google Scholar] [CrossRef]
- Sileshi, G.; Akinnifesi, F.K.; Ajayi, O.C.; Chakeredza, S.; Kaonga, M.; Matakala, P. Contribution of Agroforestry to Ecosystem Services in the Miombo Eco-region of Eastern and Southern Africa. Afr. J. Environ. Sci. Technol. 2007, 1, 68–80. [Google Scholar]
- Singh, V.; Johar, V.; Kumar, R.; Chaudhary, M. Socio-economic and Environmental Assets Sustainability by Agroforestry Systems: A Review. Int. J. Agric. Environ. Biotechnol. 2021, 14, 521–533. [Google Scholar] [CrossRef]
- Salve, A.; Tiwari, C.; Baghele, L. Impact of Agroforestry Systems: A Review. Asian J. Microbiol. Biotechnol. Environ. 2022, 24, 214–223. [Google Scholar] [CrossRef]
- Vagge, I.; Sgalippa, N.; Chiaffarelli, G. Agricultural Landscapes: A Pattern-Process-Design Approach to Enhance Their Ecological Quality and Ecosystem Services through Agroforestry. Diversity 2024, 16, 431. [Google Scholar] [CrossRef]
- Von Thaden Ugalde, J.J.; Fuente, M.E.; Lithgow, D.; Martínez-Villanueva, M.; Alfonso-Corrado, C.; Aguirre-Hidalgo, V. Recovering landscape connectivity after long-term historical land cover changes in the mountain region of Oaxaca, Mexico. Reg. Environ. Change 2023, 23, 53. [Google Scholar] [CrossRef]
- Haggar, J.; Pons, D.; Saenz, L.; Vides, M. Contribution of agroforestry systems to sustaining biodiversity in fragmented forest landscapes. Agric. Ecosyst. Environ. 2019, 283, 106567. [Google Scholar] [CrossRef]
Figure 1.
Location of the study area in the Mutshatsha mining frontier (Lualaba Province, southeastern DR Congo), showing the spatial distribution of villages, the mining exploration road, and the RN39 transportation corridor within the miombo woodland landscape.
Figure 1.
Location of the study area in the Mutshatsha mining frontier (Lualaba Province, southeastern DR Congo), showing the spatial distribution of villages, the mining exploration road, and the RN39 transportation corridor within the miombo woodland landscape.
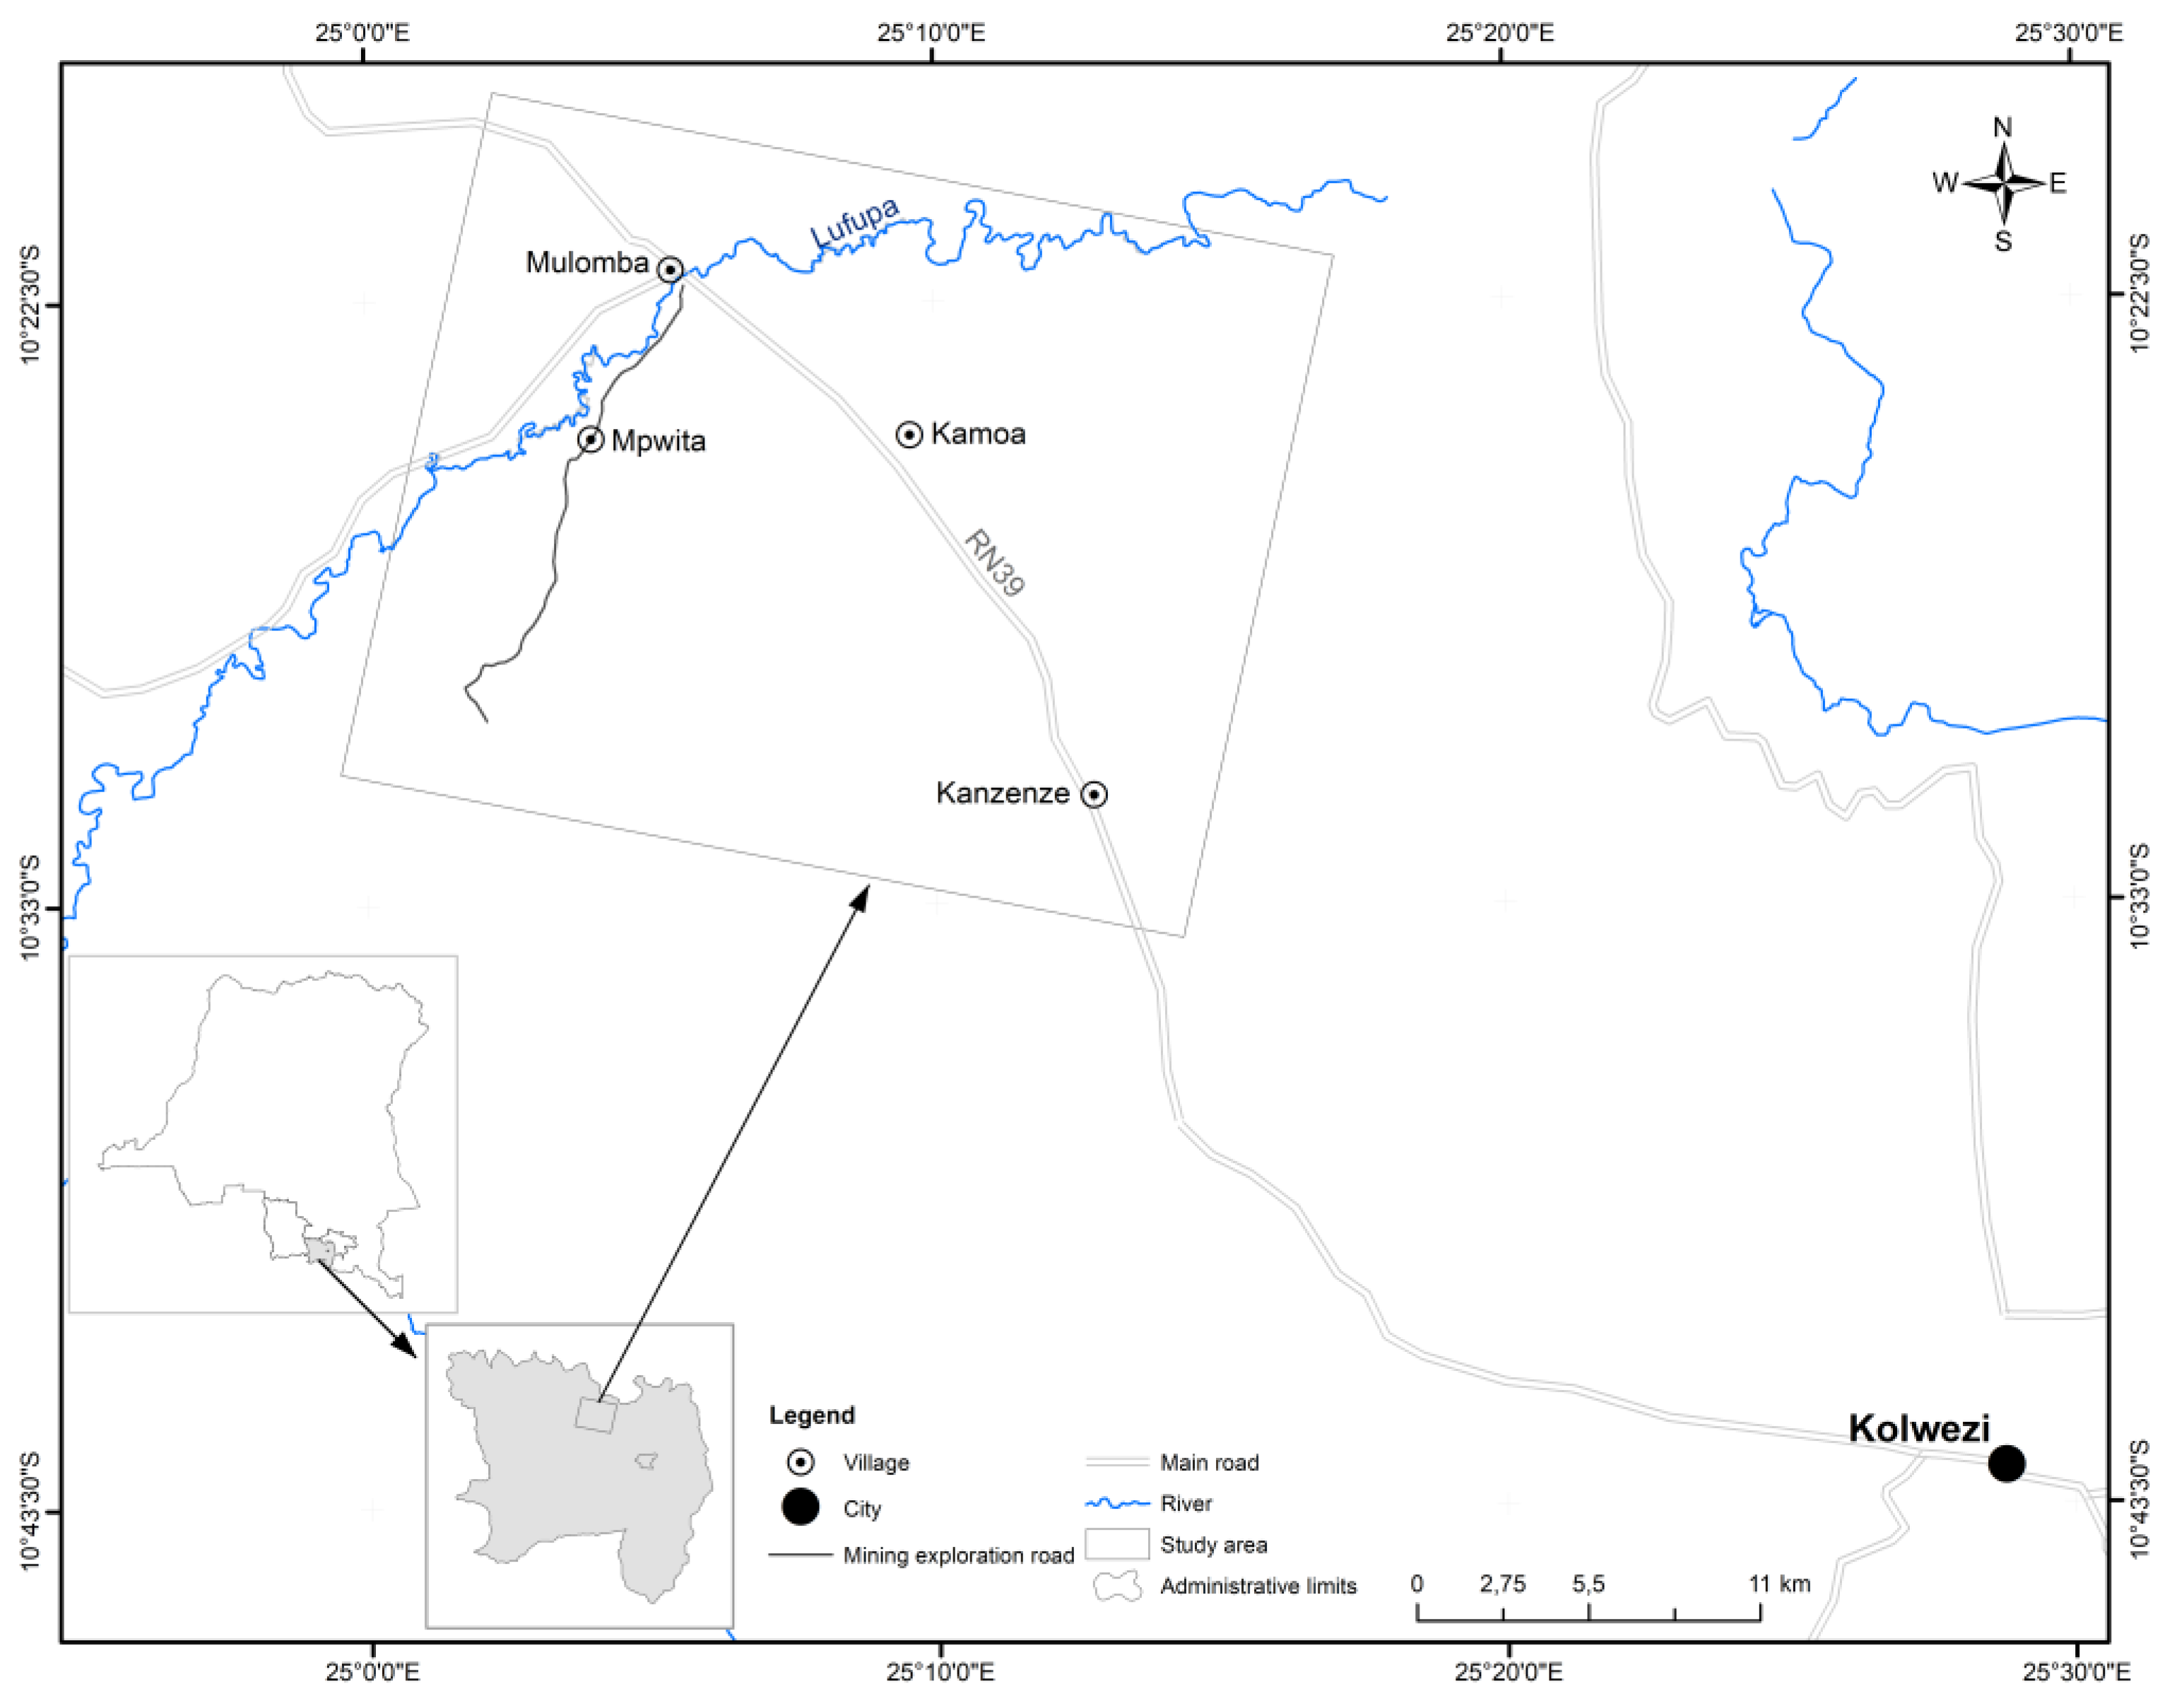
Figure 2.
Spatiotemporal dynamics of land use and land cover in the Mutshatsha Territory (1998–2023) derived from Random Forest classification of Landsat imagery. The landscape shifted from a forest-dominated matrix to one dominated by grasslands, wetlands, and anthropogenic land-cover classes.
Figure 2.
Spatiotemporal dynamics of land use and land cover in the Mutshatsha Territory (1998–2023) derived from Random Forest classification of Landsat imagery. The landscape shifted from a forest-dominated matrix to one dominated by grasslands, wetlands, and anthropogenic land-cover classes.
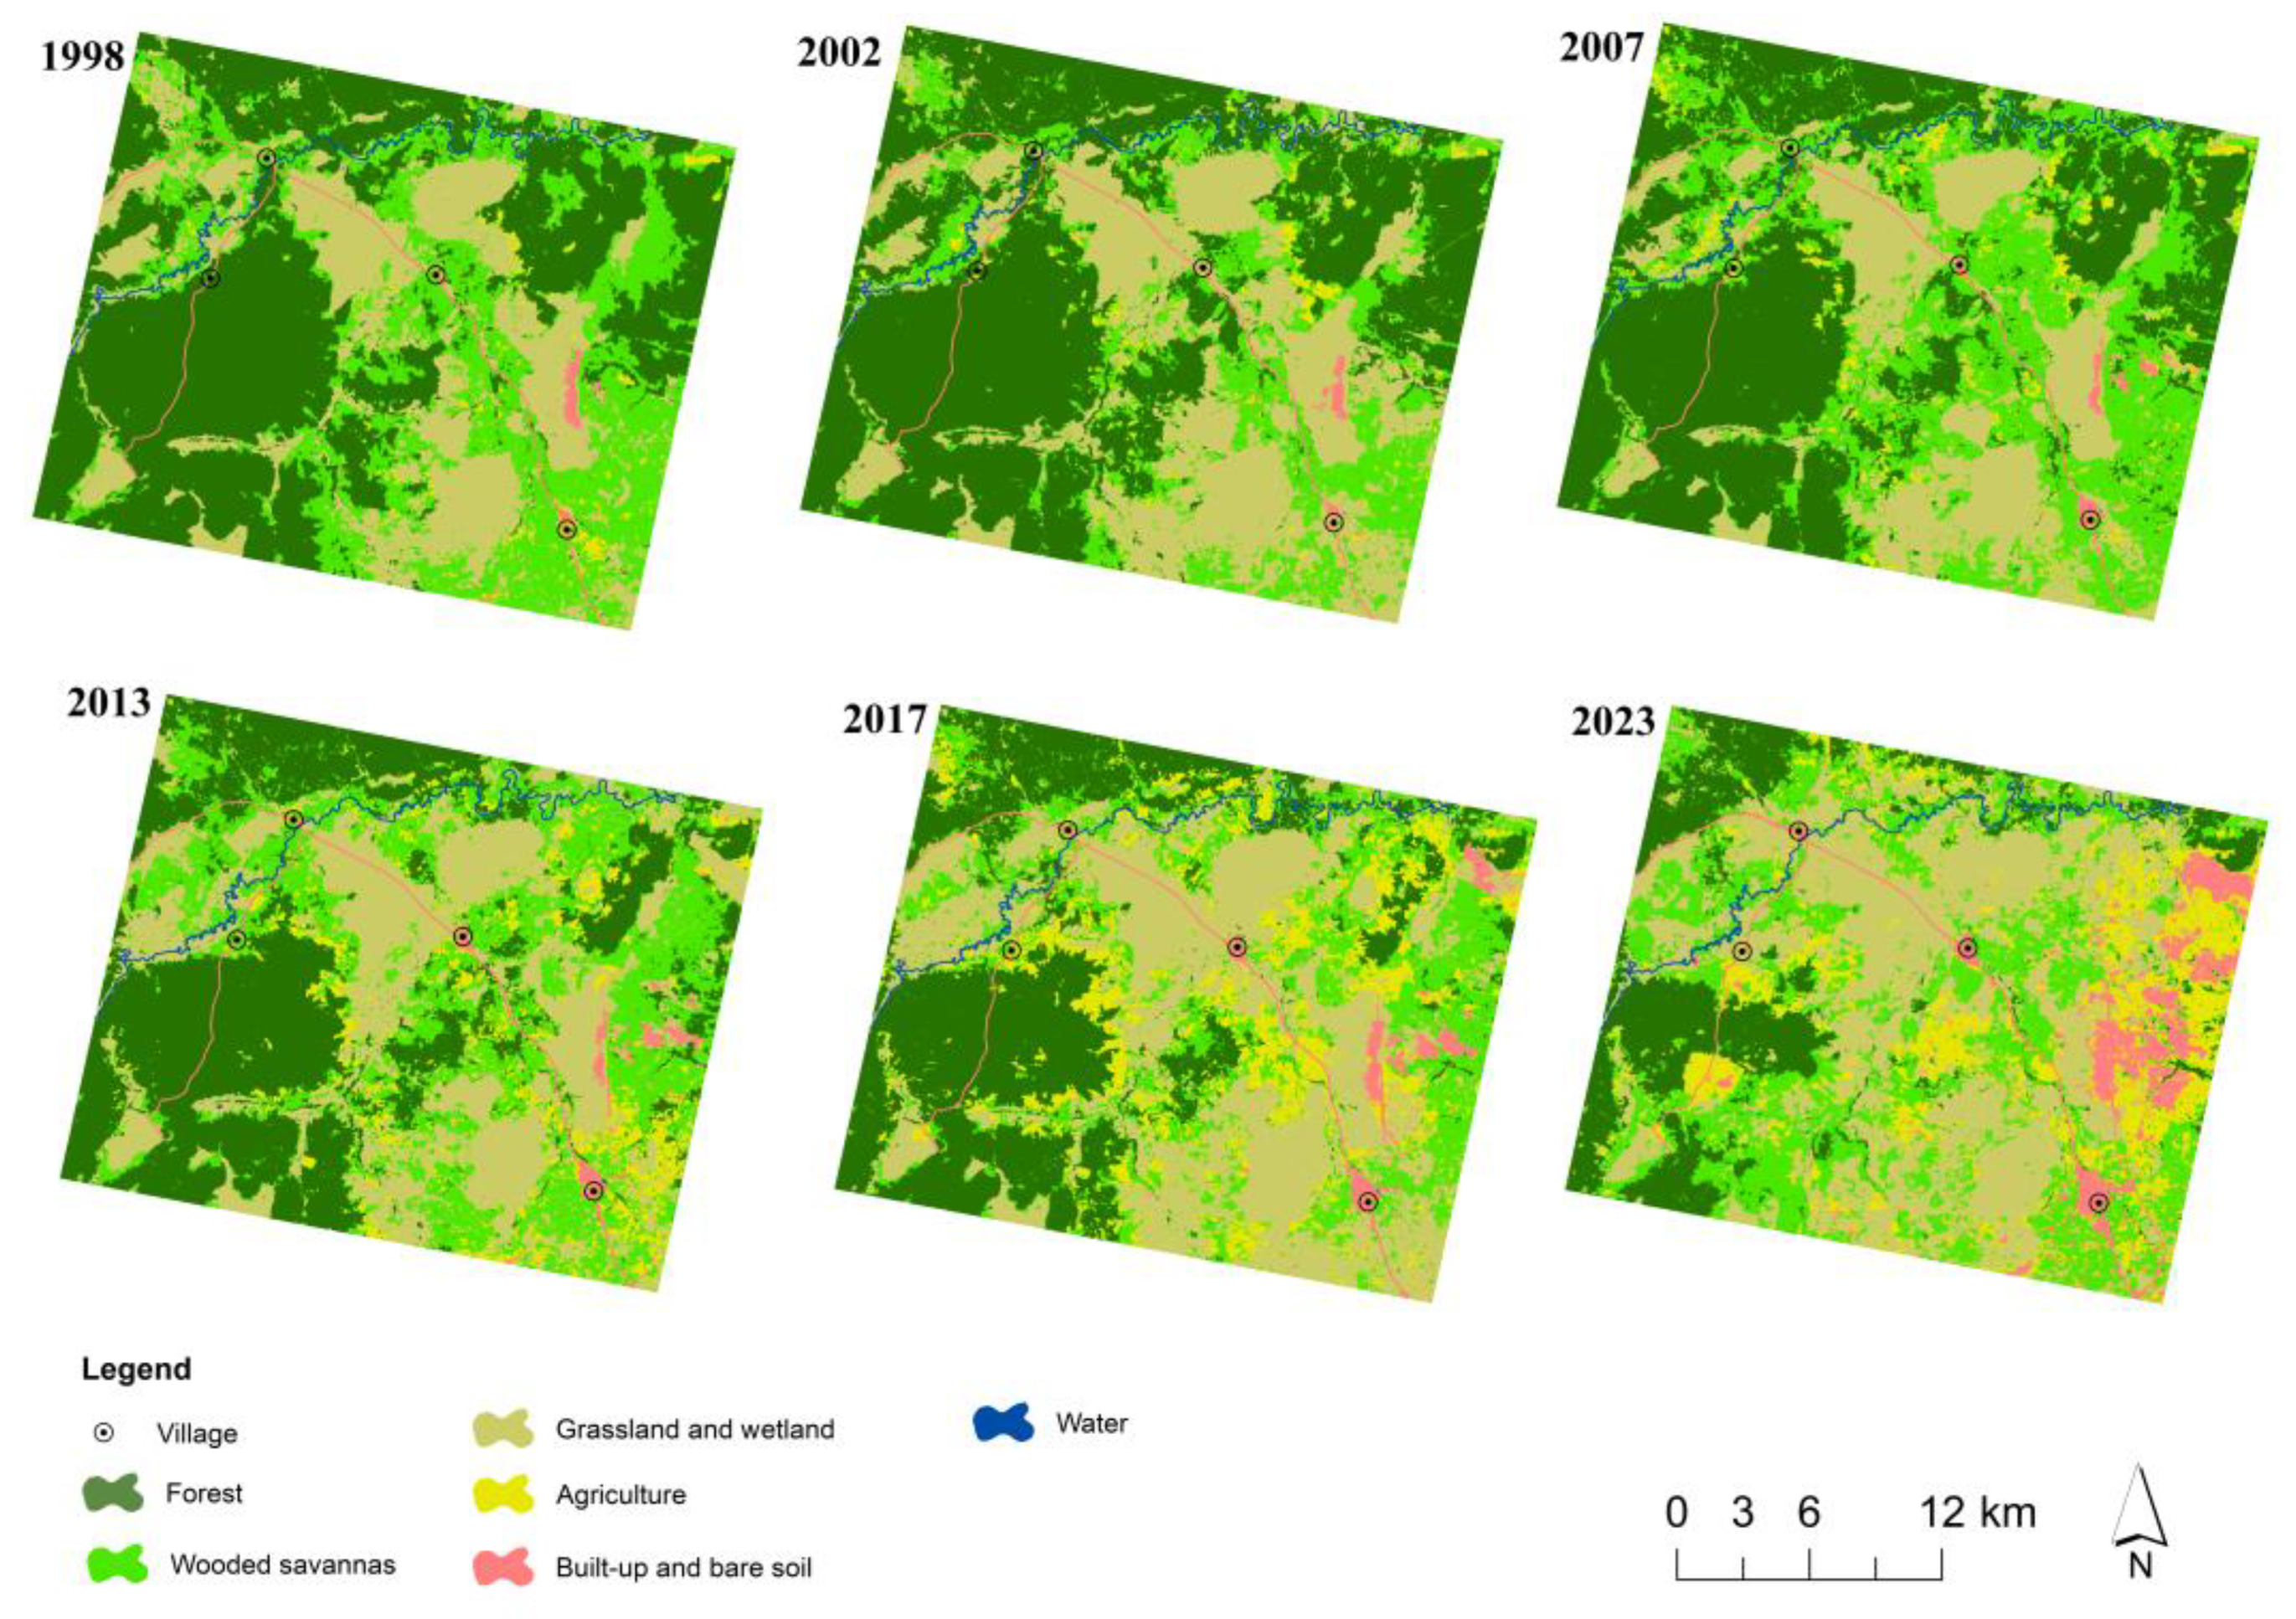
Figure 3.
Annual deforestation rates (% yr−1) of miombo woodlands in the Mutshatsha Territory for each inter-census period from 1998 to 2023. The horizontal line at zero distinguishes net forest gain (negative values) from net forest loss (positive values).
Figure 3.
Annual deforestation rates (% yr−1) of miombo woodlands in the Mutshatsha Territory for each inter-census period from 1998 to 2023. The horizontal line at zero distinguishes net forest gain (negative values) from net forest loss (positive values).
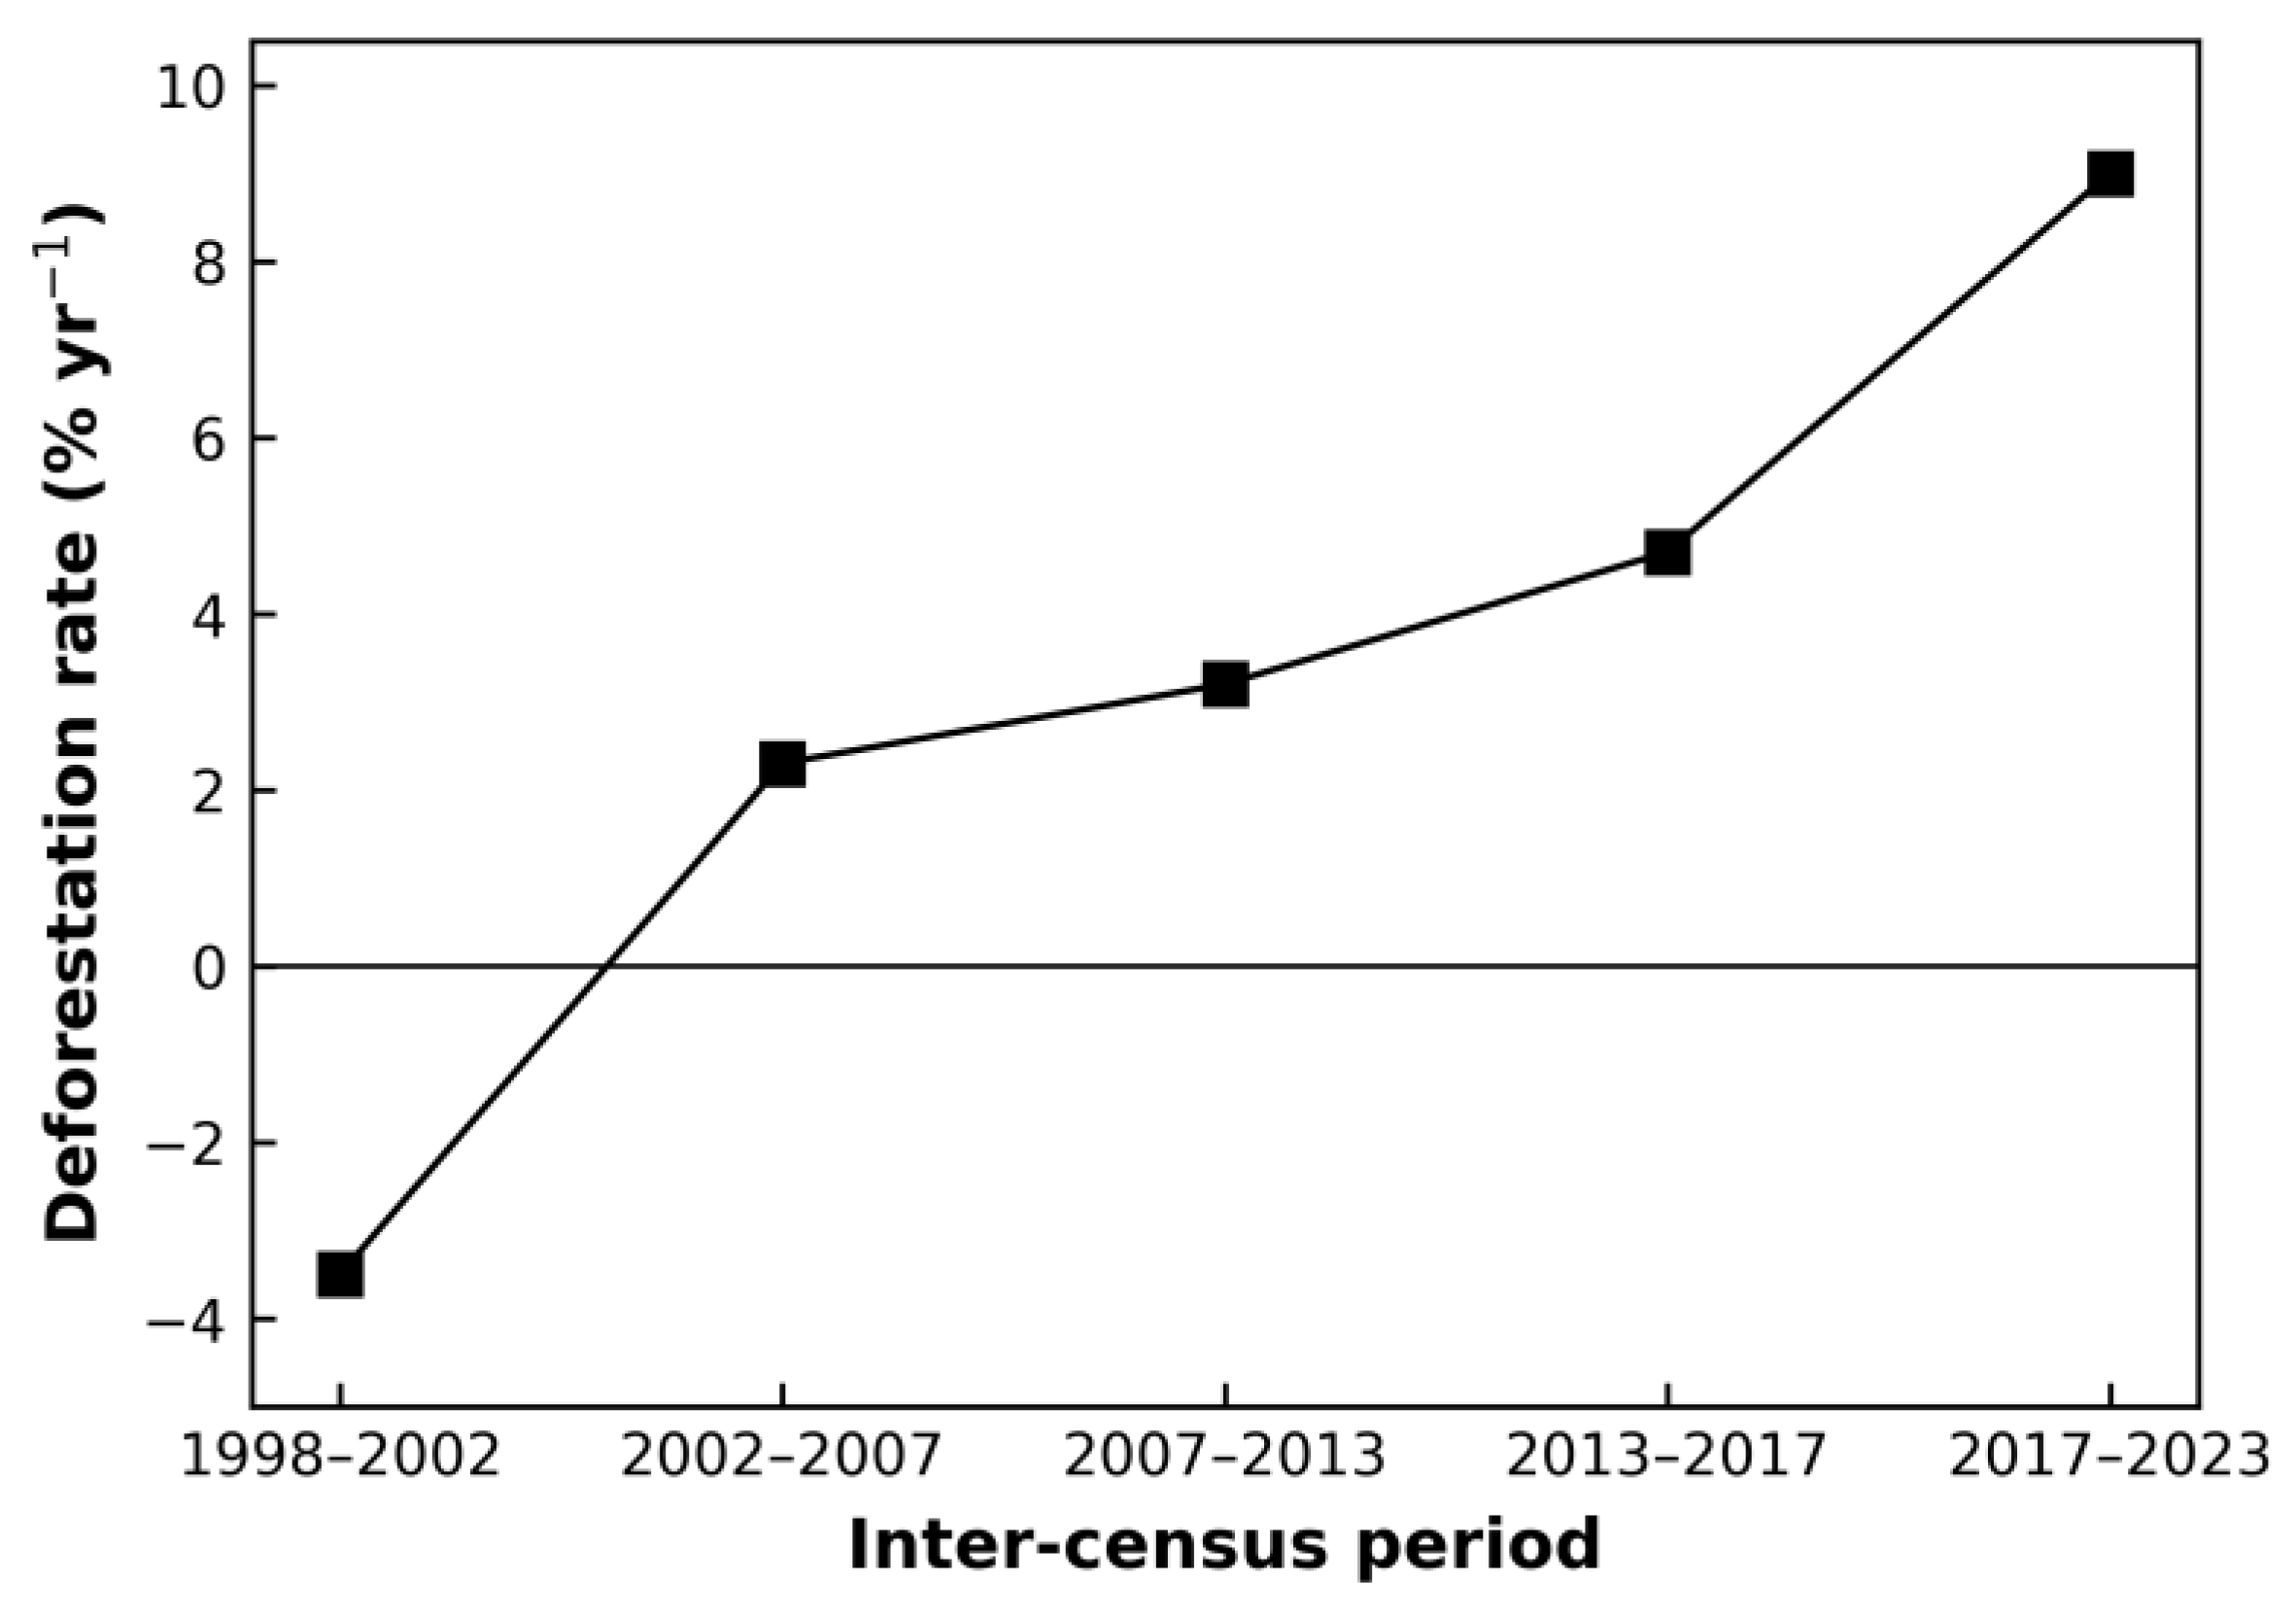
Figure 4.
Relationship between landscape disturbance index (U) and fractal dimension (Df) of forest patches in the miombo woodlands of the Mutshatsha Territory from 1998 to 2023.
Figure 4.
Relationship between landscape disturbance index (U) and fractal dimension (Df) of forest patches in the miombo woodlands of the Mutshatsha Territory from 1998 to 2023.
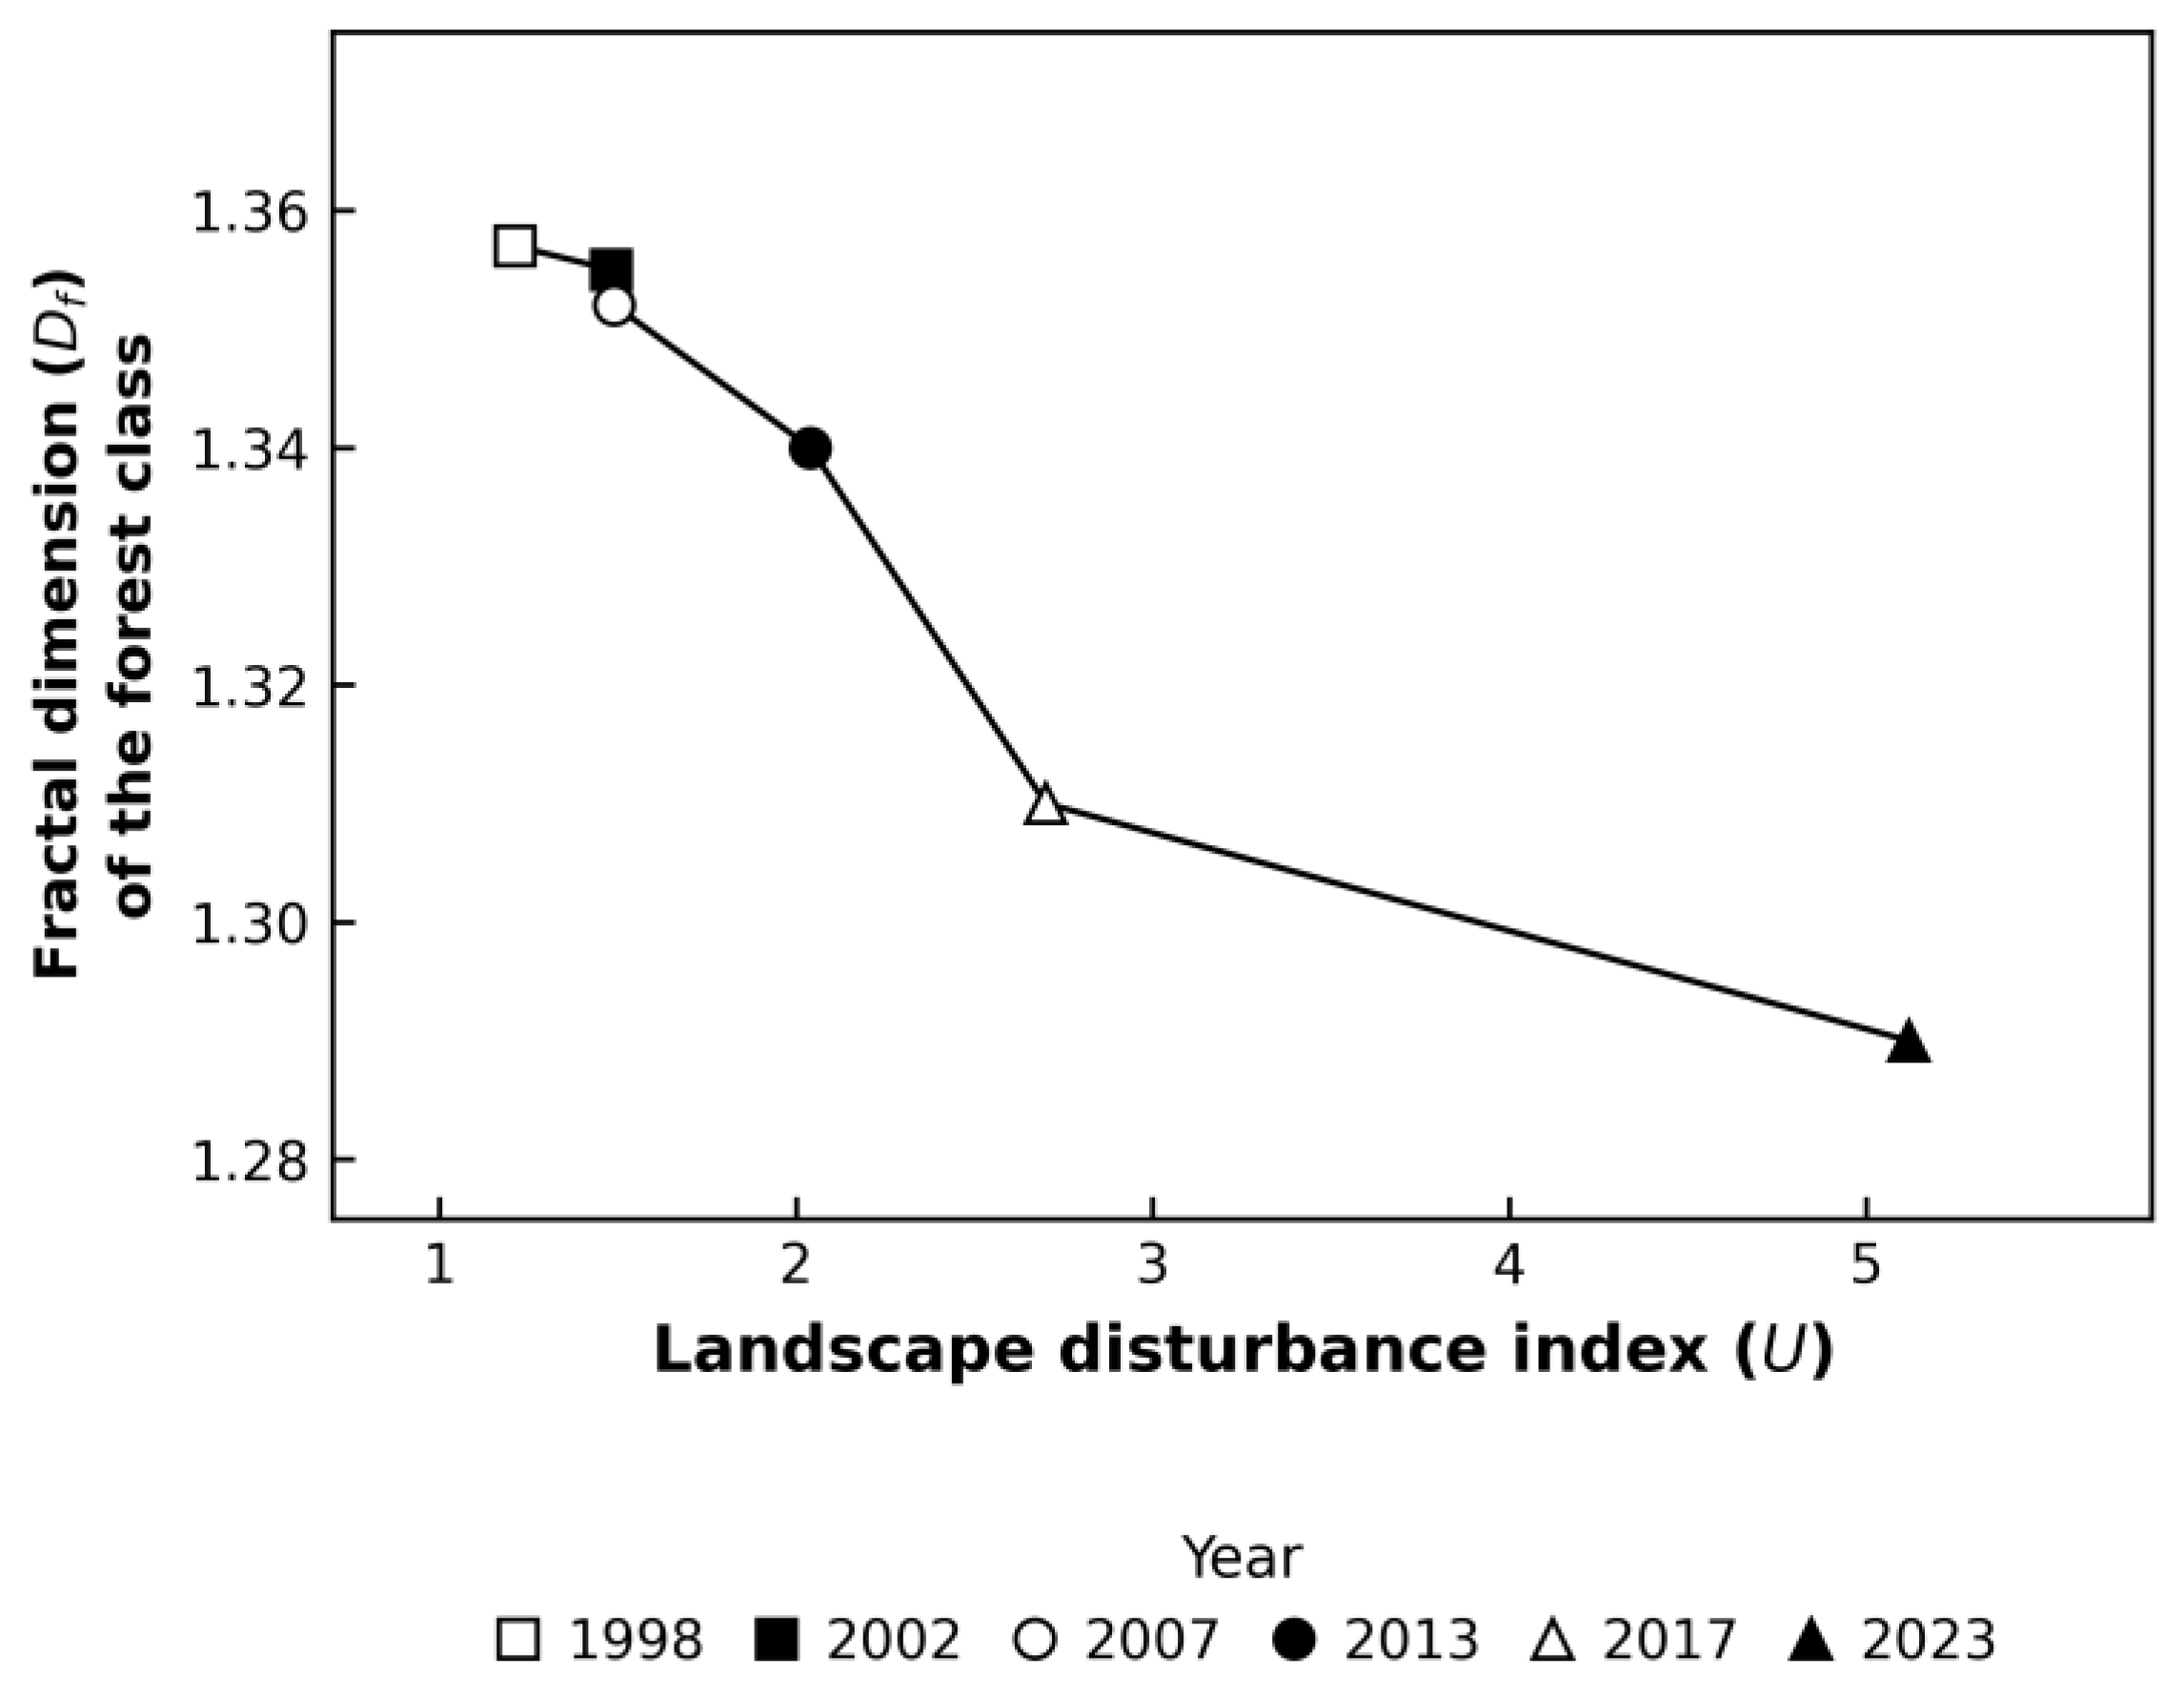
Figure 5.
Forest cover (PLAND, %) as a function of buffer distance from village settlements (1–3 km) for each survey year (1998–2023), Mutshatsha Territory. Each line represents one survey year; panels (a) Kamoa, (b) Kanzenze, and (c) Mulomba are situated along National Road No. 39 (RN39); panel (d) Mpwita is situated along the mining exploration road.
Figure 5.
Forest cover (PLAND, %) as a function of buffer distance from village settlements (1–3 km) for each survey year (1998–2023), Mutshatsha Territory. Each line represents one survey year; panels (a) Kamoa, (b) Kanzenze, and (c) Mulomba are situated along National Road No. 39 (RN39); panel (d) Mpwita is situated along the mining exploration road.
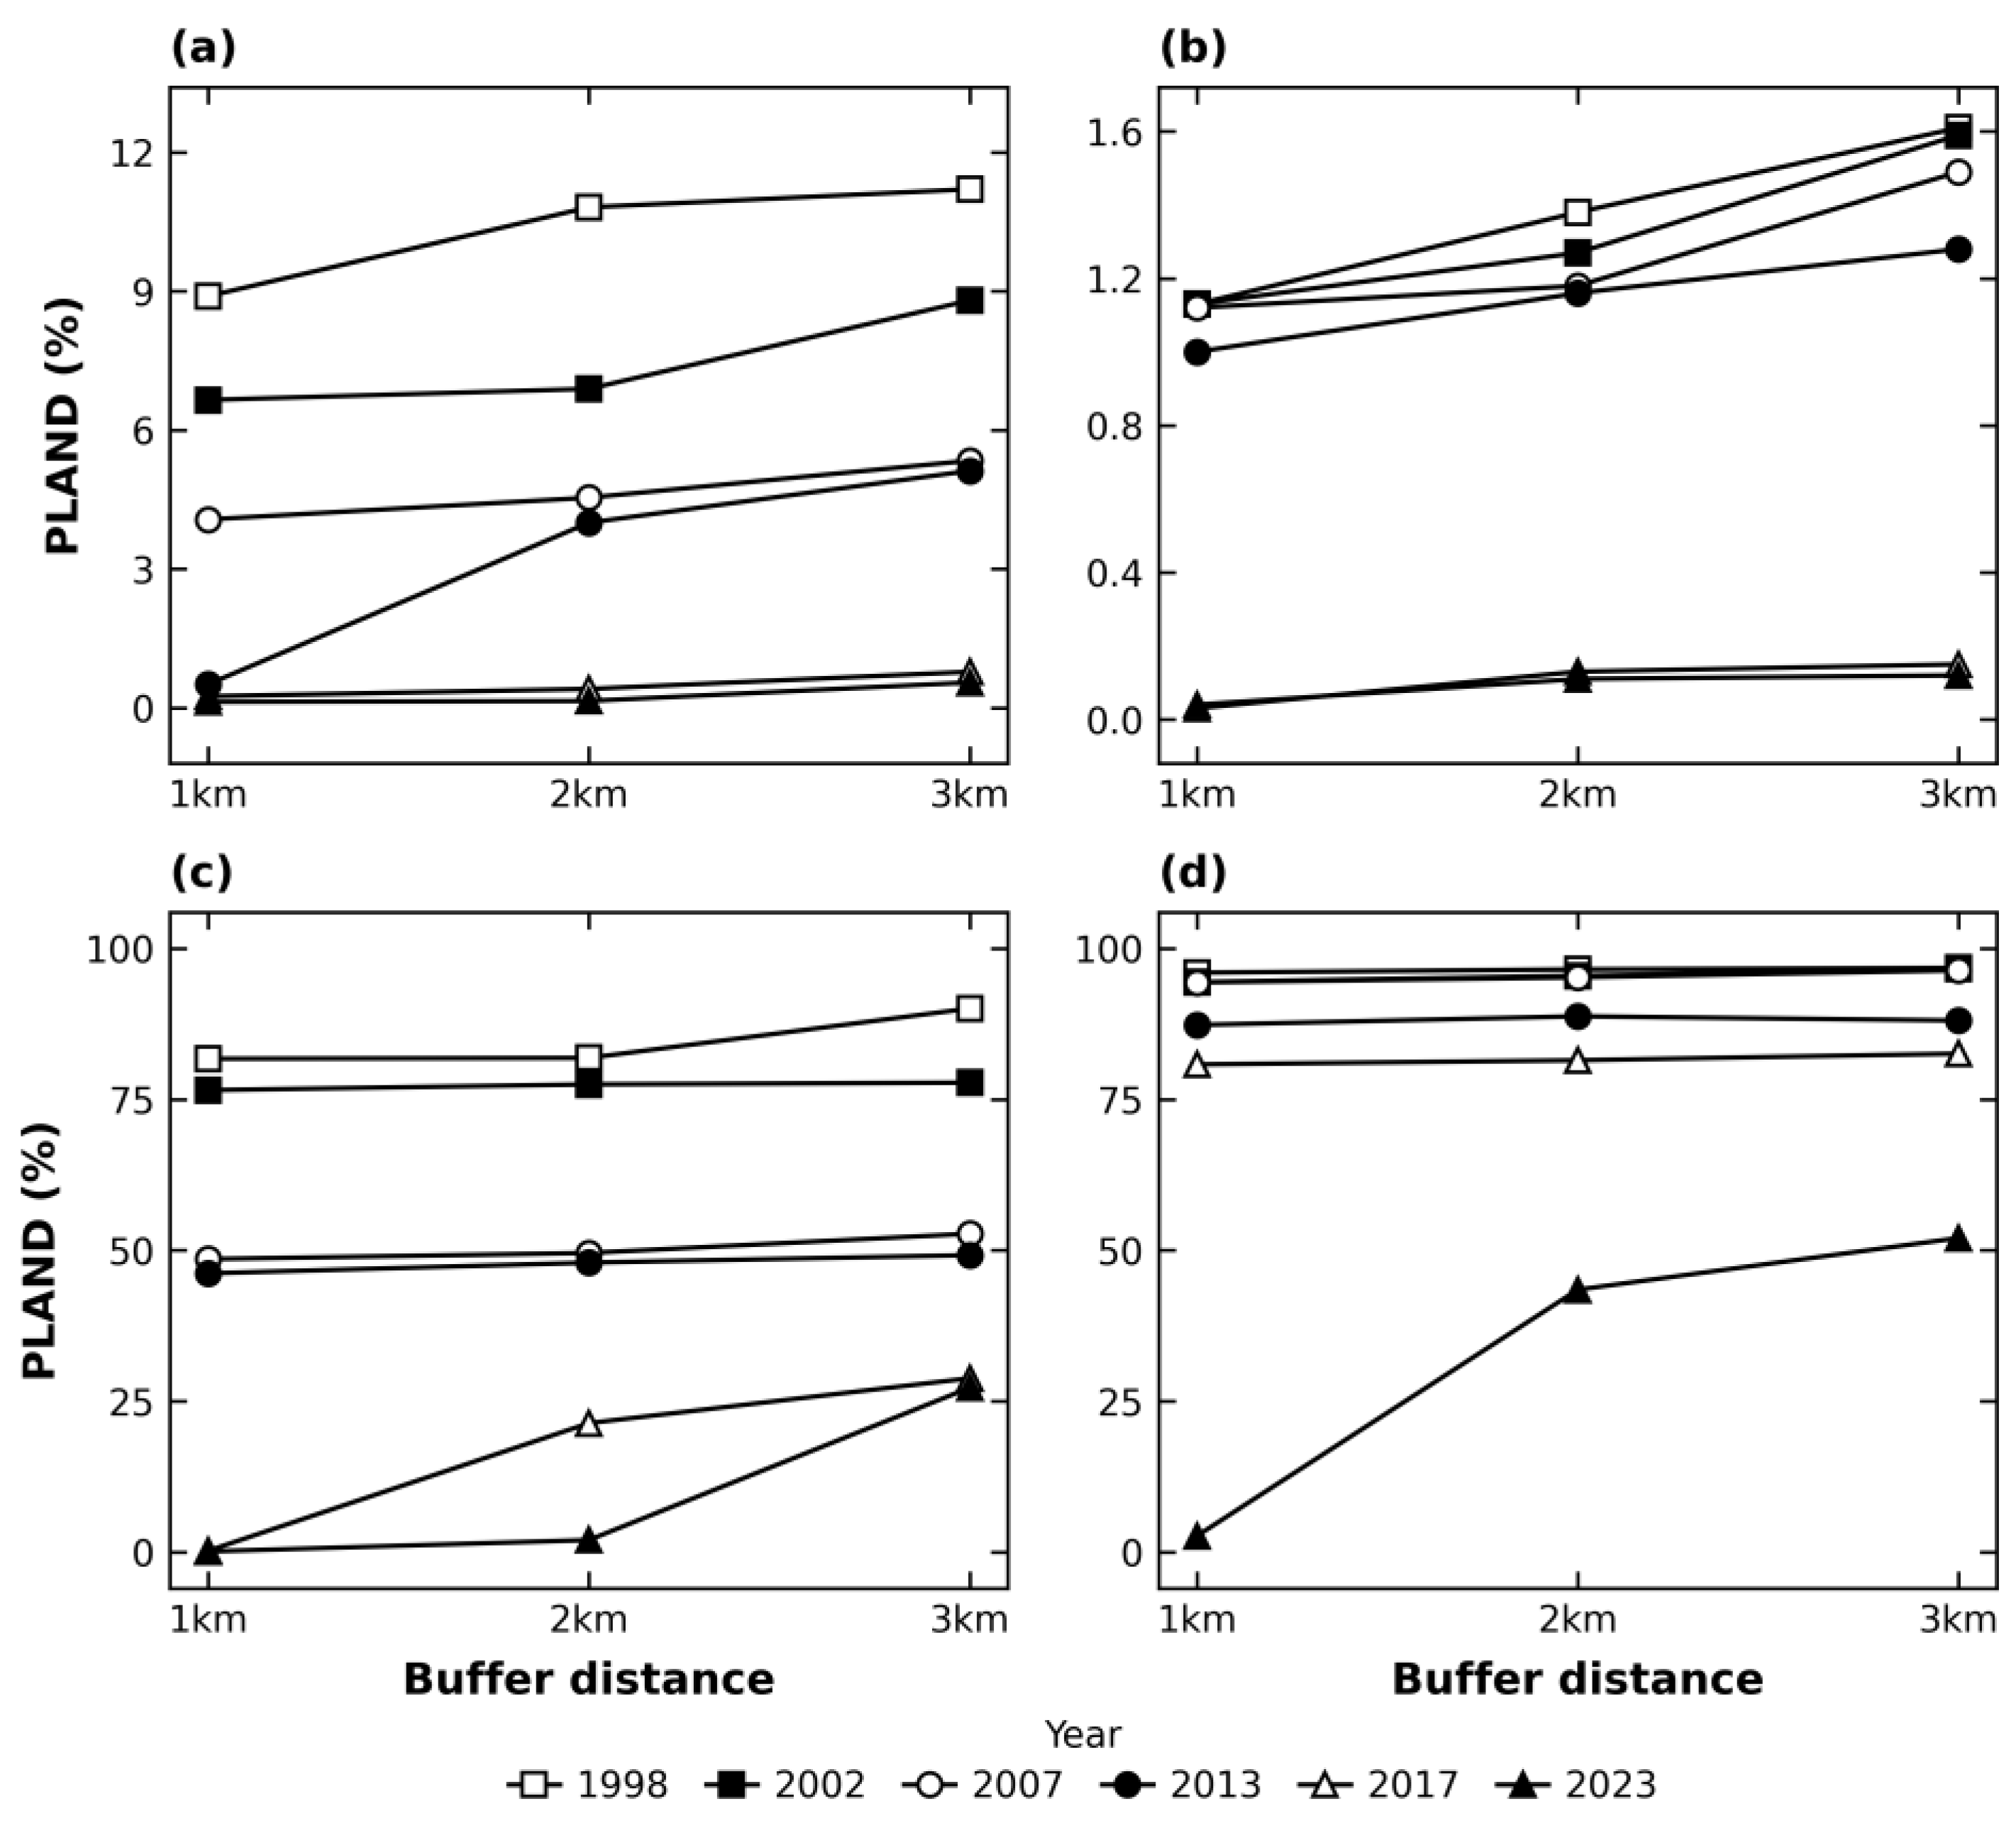
Figure 6.
Forest cover (PLAND, %) around village settlements across six survey years (1998–2023), Mutshatsha Territory. Panels: (a) Kamoa, (b) Kanzenze, and (c) Mulomba (National Road No. 39, RN39); (d) Mpwita (mining exploration road). Box plots show the distribution of PLAND across the three buffer distances (1–3 km); overlaid points represent individual buffer distances.
Figure 6.
Forest cover (PLAND, %) around village settlements across six survey years (1998–2023), Mutshatsha Territory. Panels: (a) Kamoa, (b) Kanzenze, and (c) Mulomba (National Road No. 39, RN39); (d) Mpwita (mining exploration road). Box plots show the distribution of PLAND across the three buffer distances (1–3 km); overlaid points represent individual buffer distances.
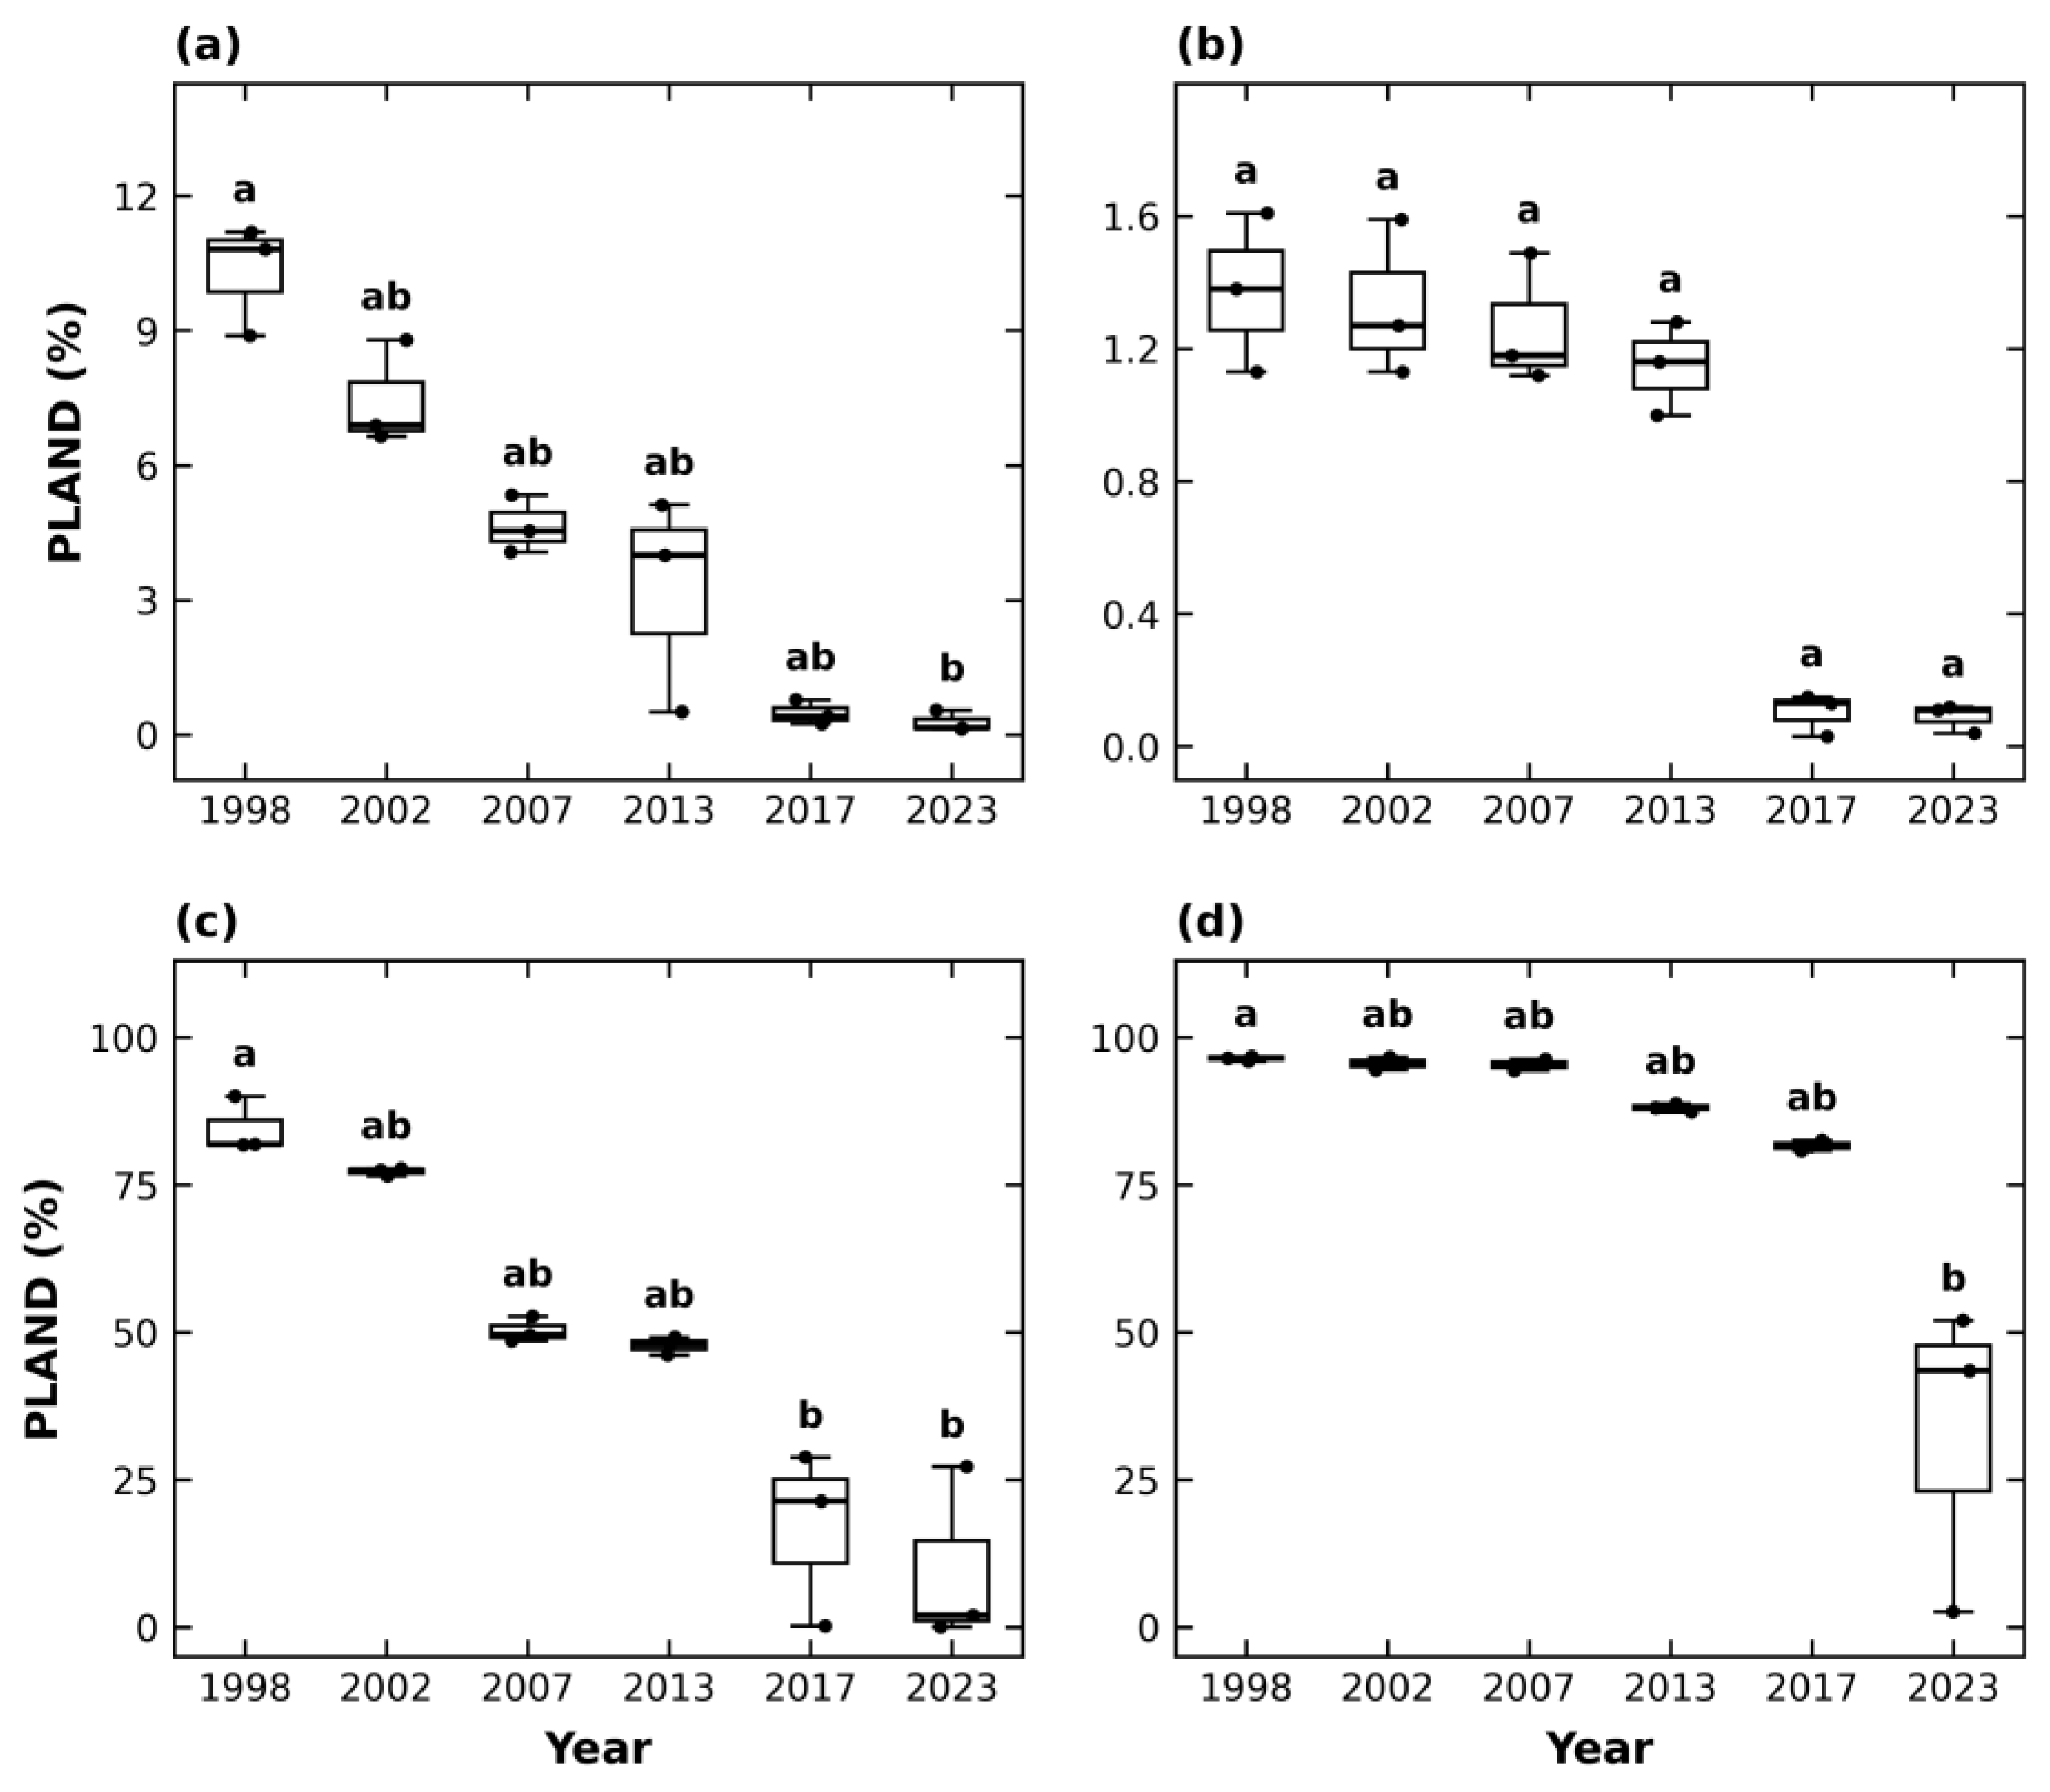
Figure 7.
Overall forest cover (PLAND, %) among village settlements in the Mutshatsha Territory, pooled across six survey years (1998–2023) and three buffer distances (1–3 km; n = 18 per village). Box plots show the distribution of PLAND across all year–buffer combinations; overlaid points represent individual year–buffer observations.
Figure 7.
Overall forest cover (PLAND, %) among village settlements in the Mutshatsha Territory, pooled across six survey years (1998–2023) and three buffer distances (1–3 km; n = 18 per village). Box plots show the distribution of PLAND across all year–buffer combinations; overlaid points represent individual year–buffer observations.
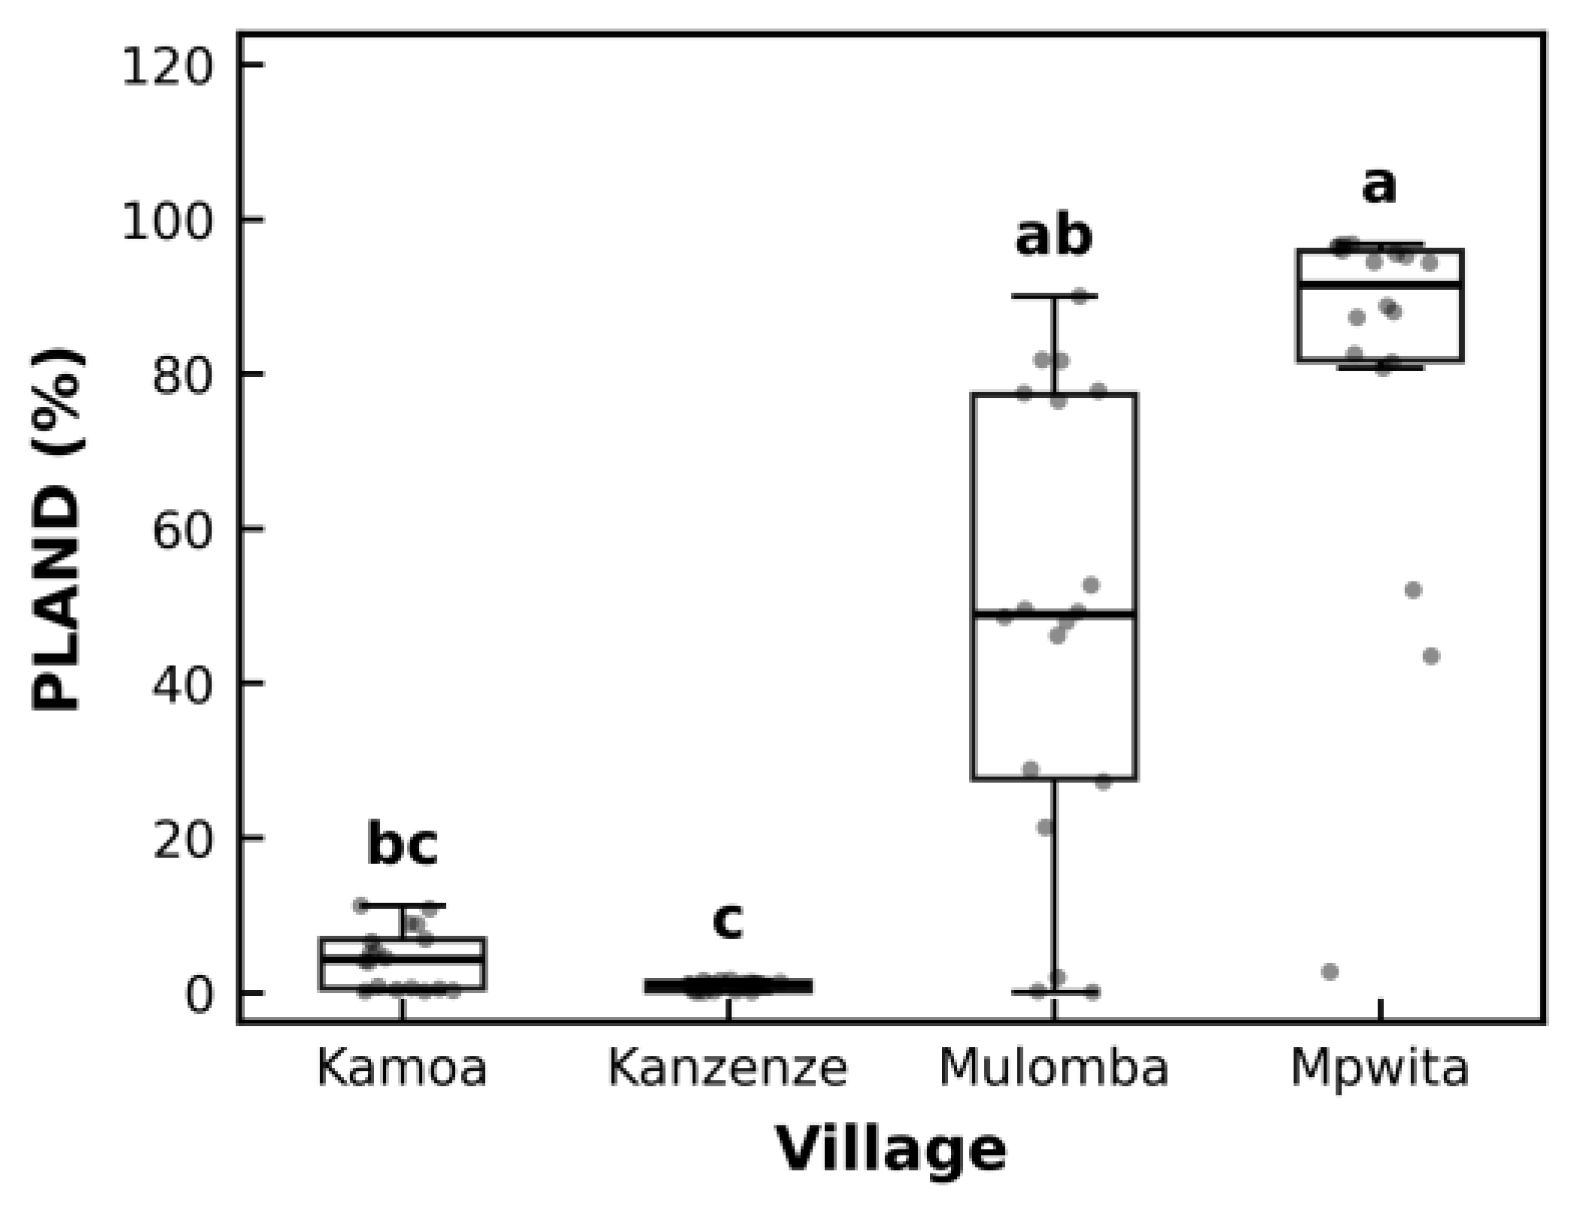
Figure 8.
Forest cover (PLAND, %) as a function of buffer distance from the mining exploration road (1–7 km) and survey year (1998–2023), Mutshatsha Territory. (a) Forest cover shown jointly by buffer distance and survey year. (b) Temporal trend in PLAND pooled across buffer distances (n = 7 per boxplot); overlaid points represent individual buffer distances.
Figure 8.
Forest cover (PLAND, %) as a function of buffer distance from the mining exploration road (1–7 km) and survey year (1998–2023), Mutshatsha Territory. (a) Forest cover shown jointly by buffer distance and survey year. (b) Temporal trend in PLAND pooled across buffer distances (n = 7 per boxplot); overlaid points represent individual buffer distances.
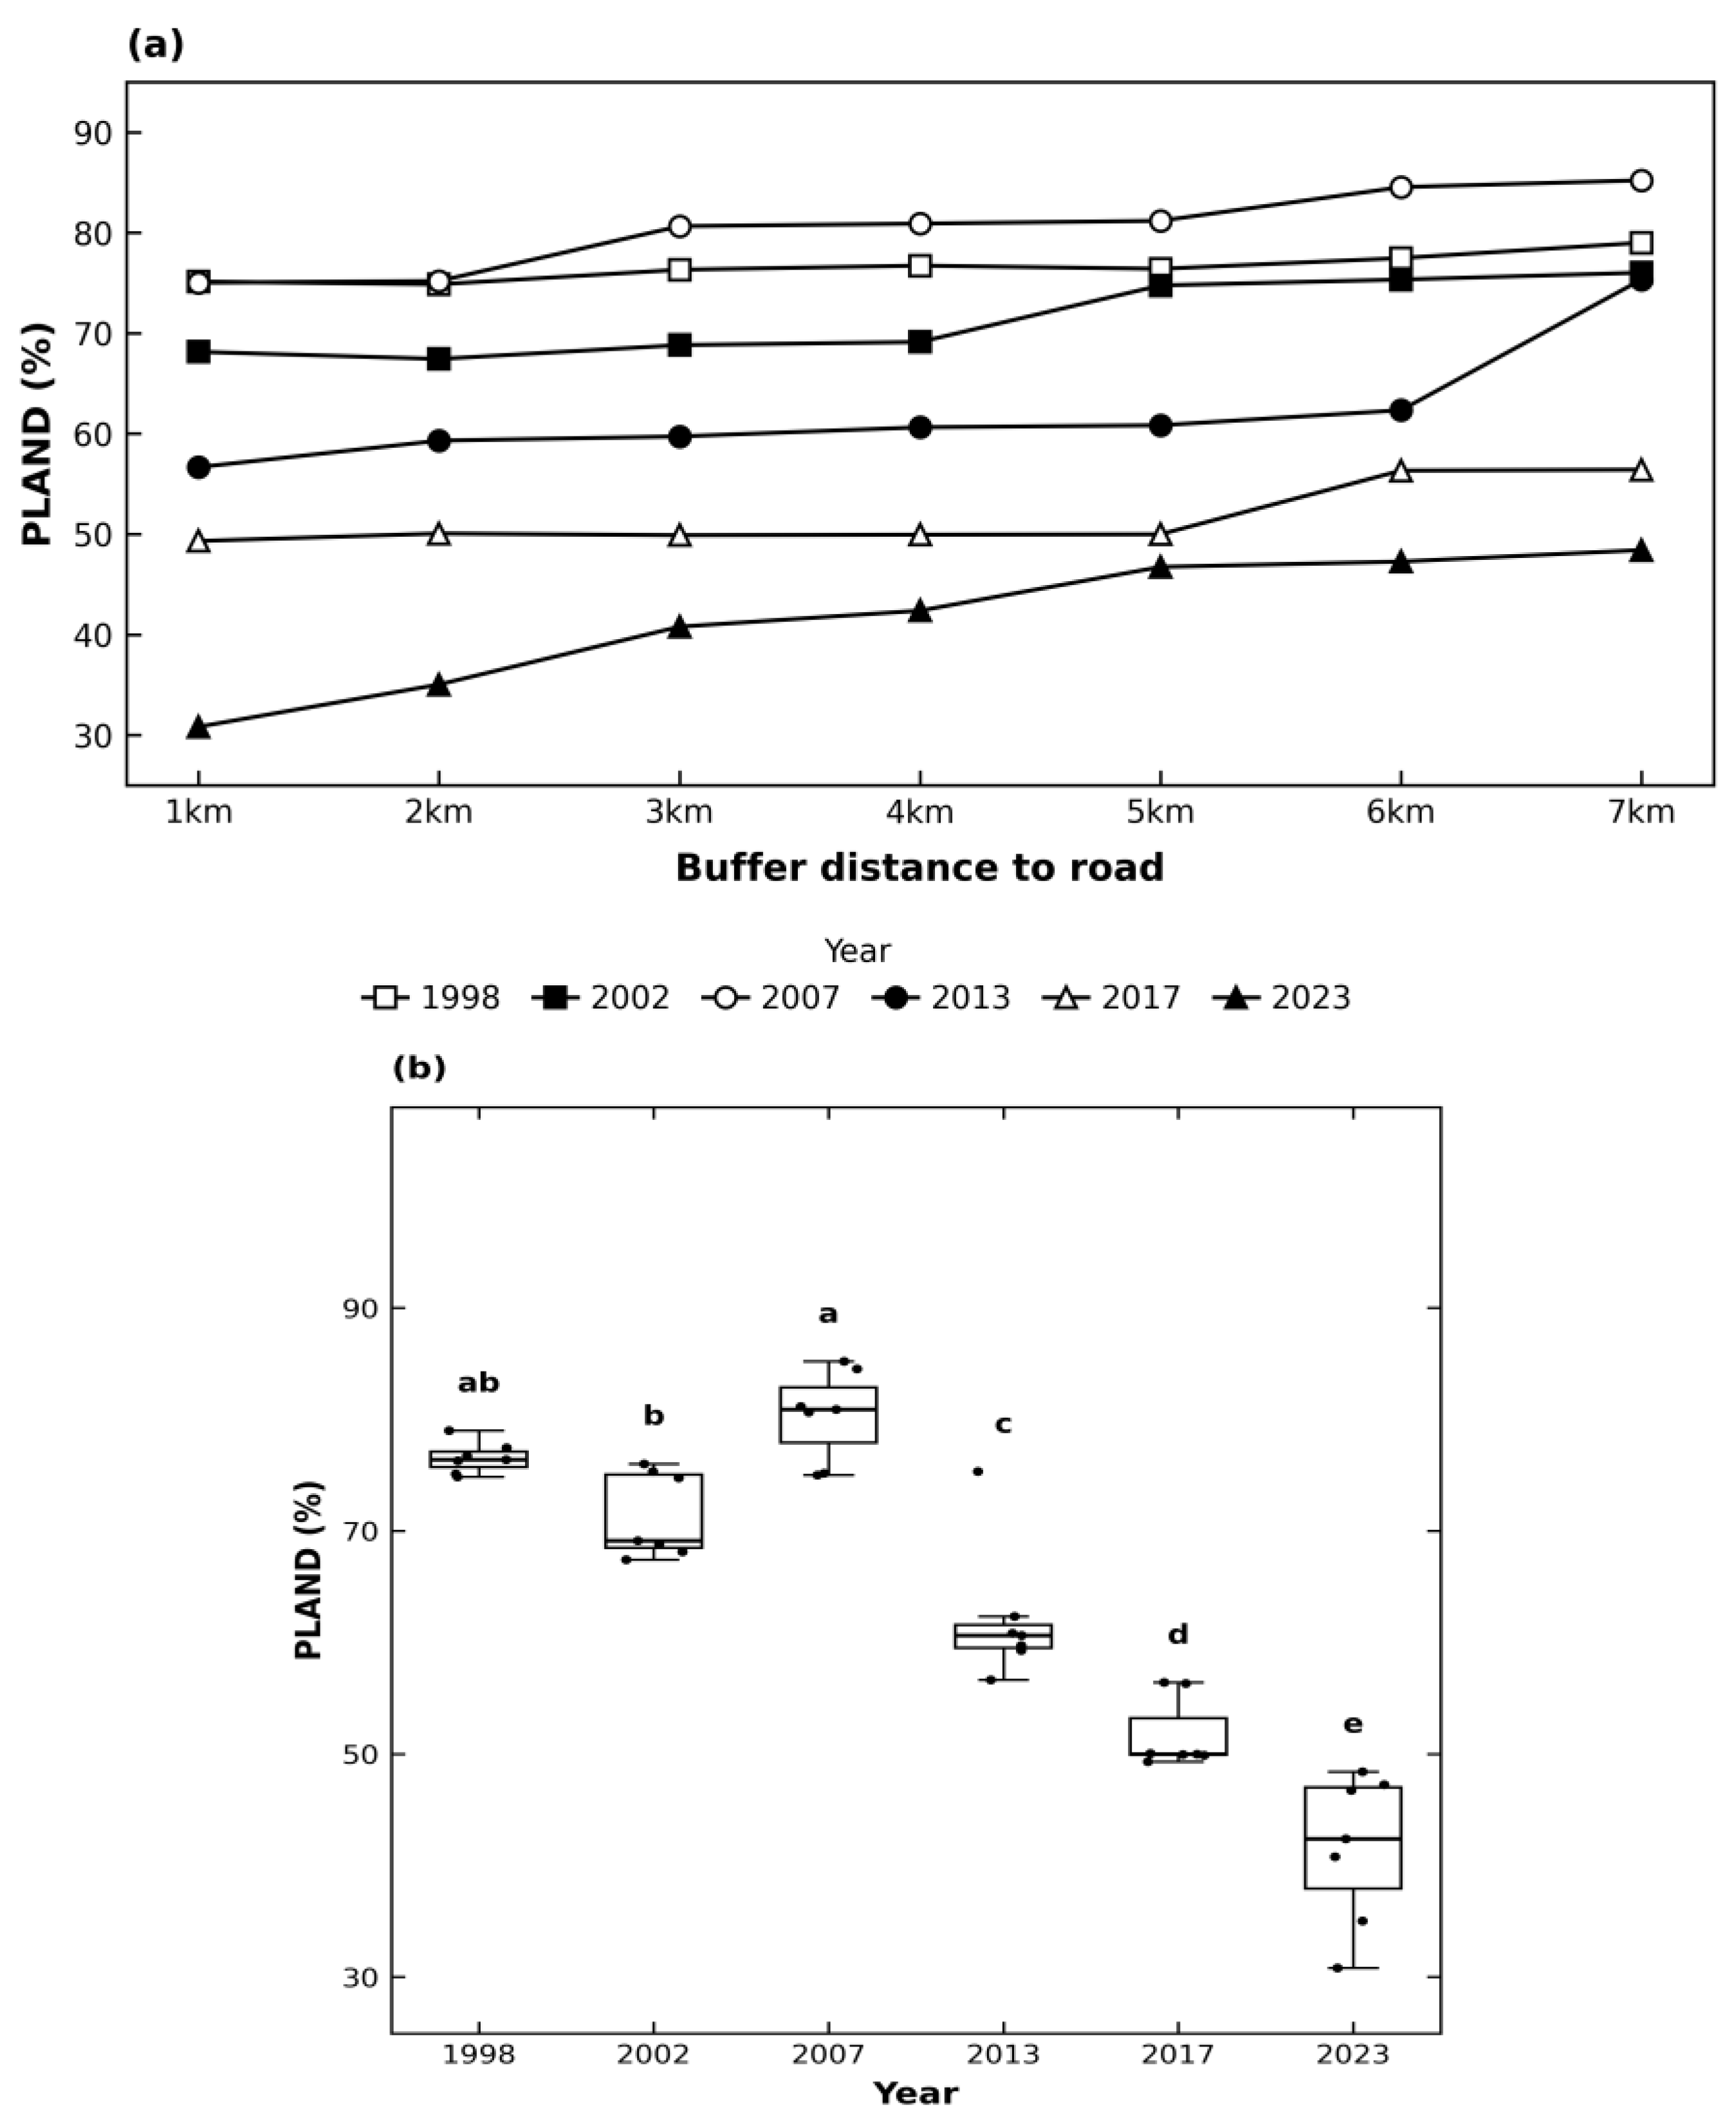
Figure 9.
Forest cover (PLAND, %) along the mining exploration road by segment and survey year (1998–2023), Mutshatsha Territory. (a) PLAND jointly by road segment and survey year. (b) Temporal trend pooled across all 17 segments (n = 17 per boxplot); overlaid points represent individual road segments.
Figure 9.
Forest cover (PLAND, %) along the mining exploration road by segment and survey year (1998–2023), Mutshatsha Territory. (a) PLAND jointly by road segment and survey year. (b) Temporal trend pooled across all 17 segments (n = 17 per boxplot); overlaid points represent individual road segments.
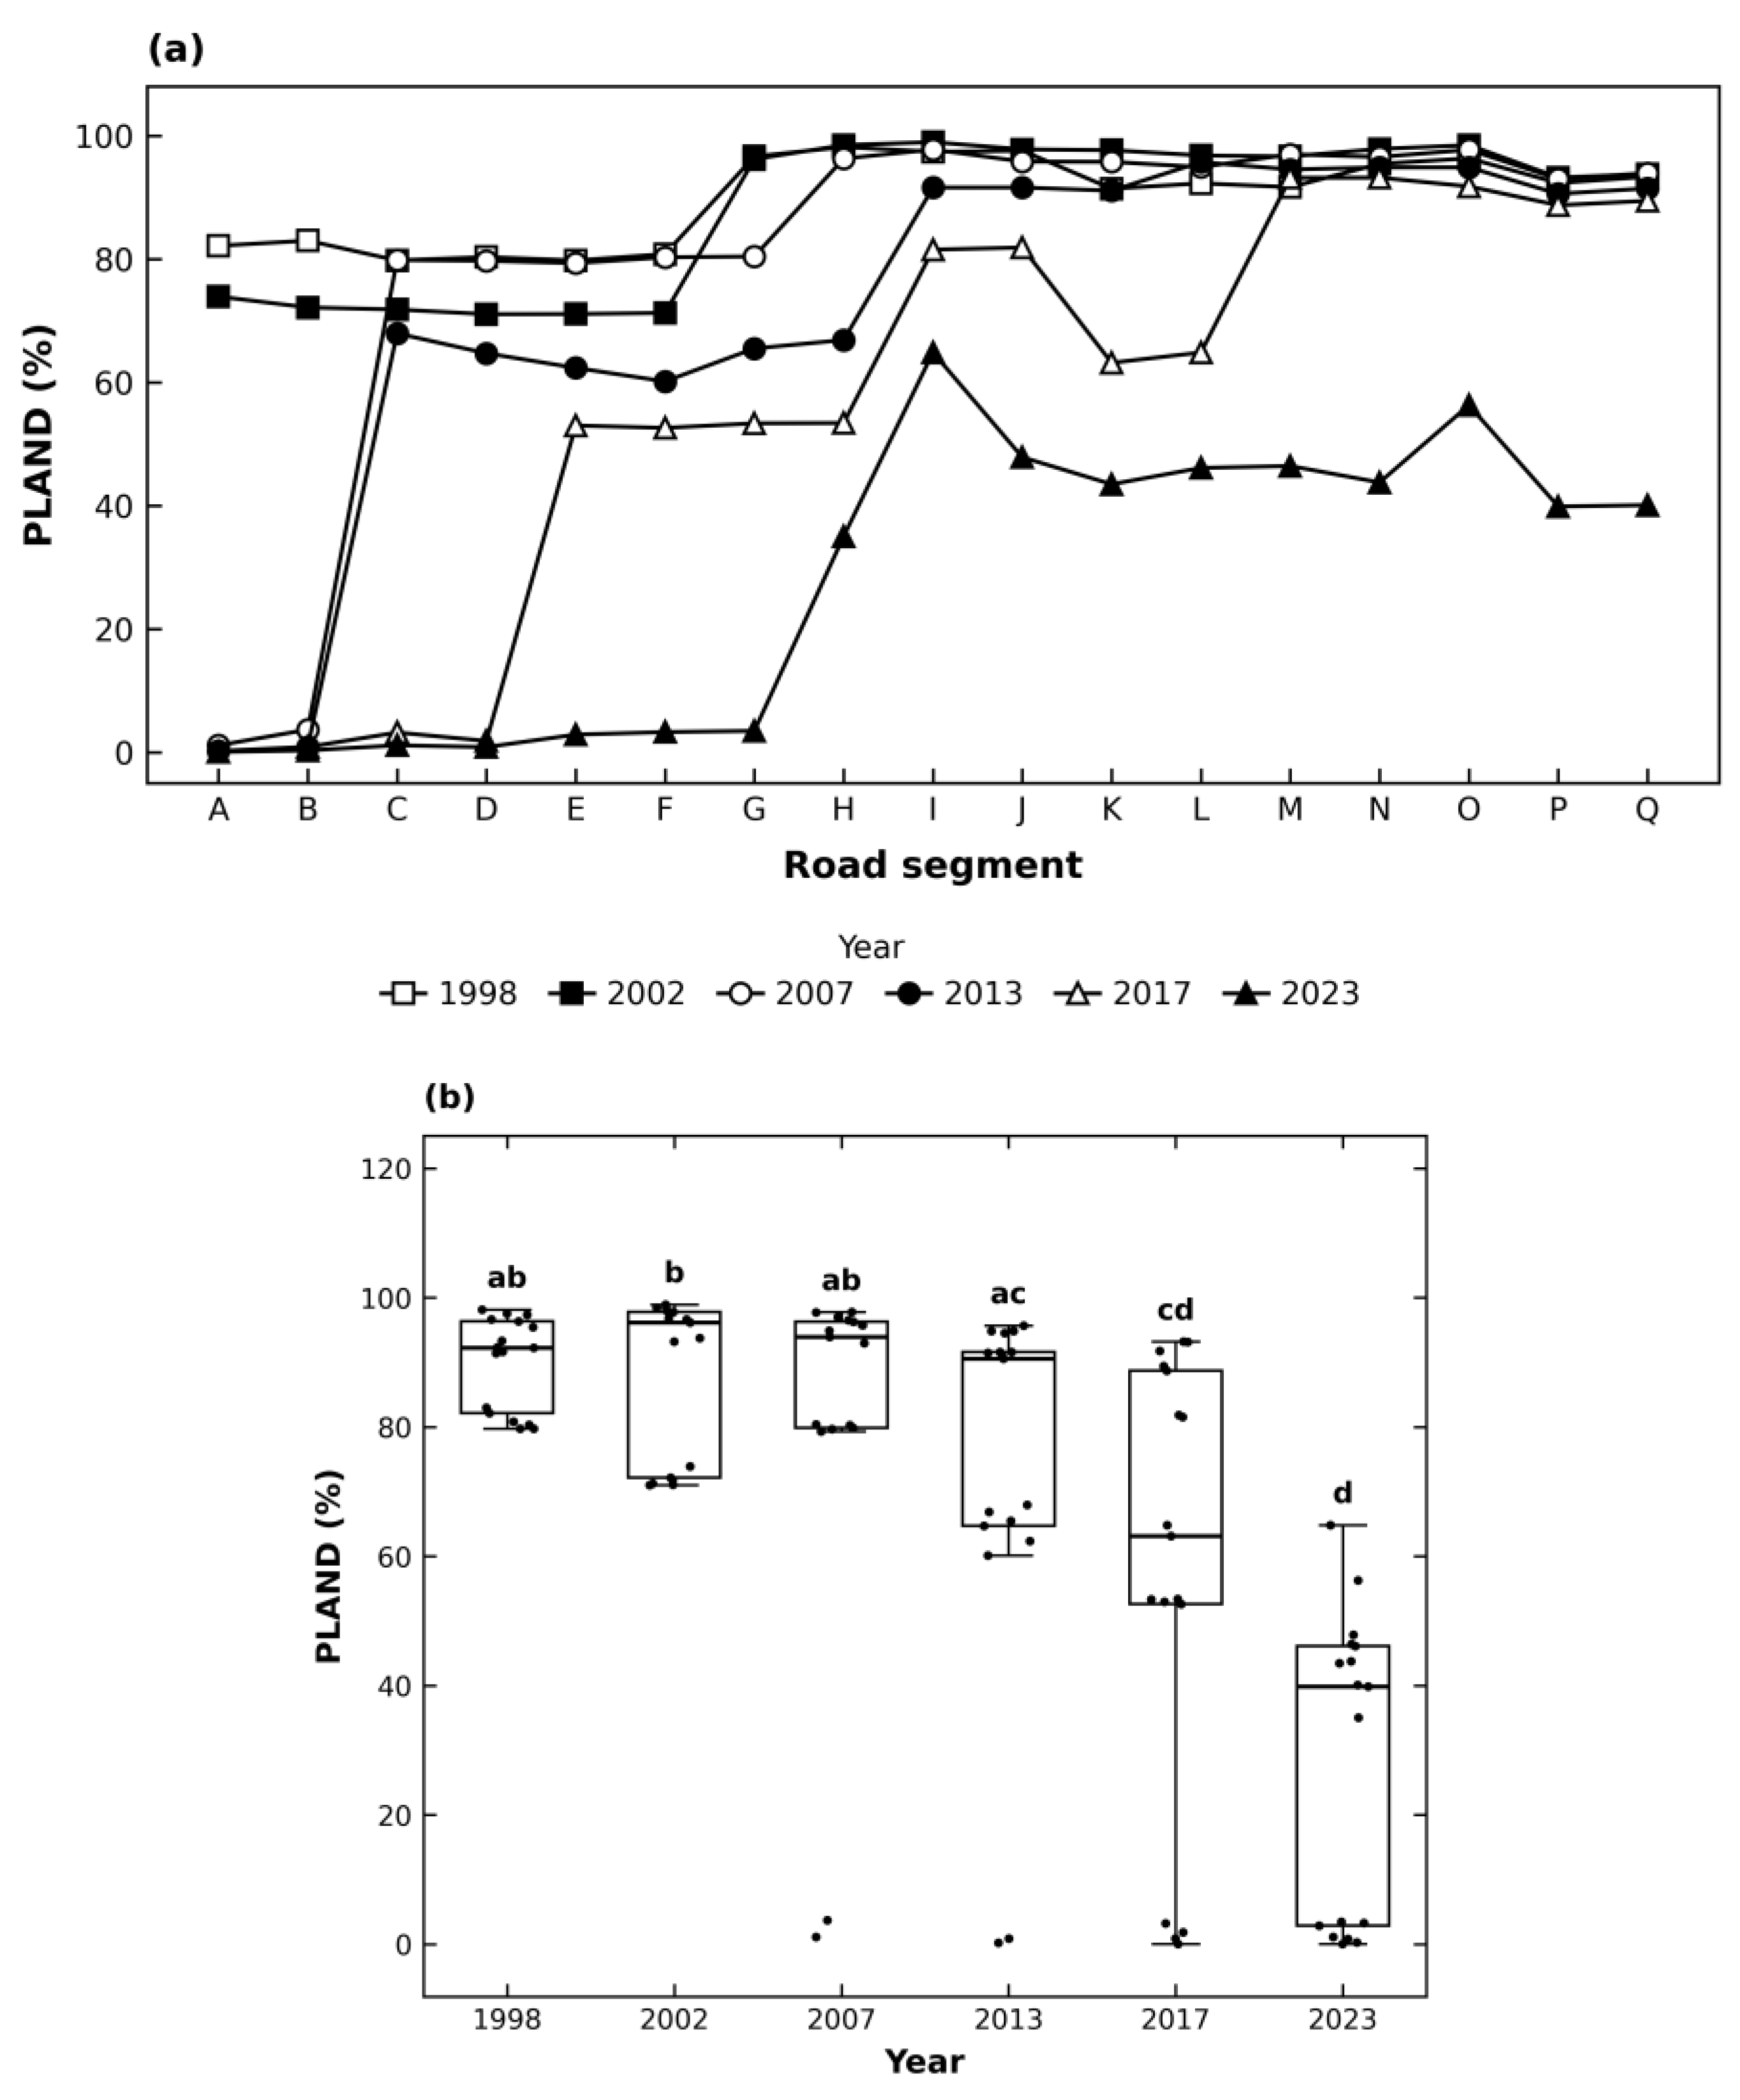

Table 1.
Characteristics of the villages included in the analysis of forest degradation gradients in the Mutshatsha Territory, southeastern DR Congo.
Table 1.
Characteristics of the villages included in the analysis of forest degradation gradients in the Mutshatsha Territory, southeastern DR Congo.
| Village | Geographic coordinates and setting | Distance from Kolwezi (km) | Approximate period of establishment | Accessibility level | Main livelihood activities | ||||
| Kanzenze | Along RN39 25°12’43.95’’E 10°30’54.34’’S |
56 | Before 2000 | High | Agriculture, charcoal production, trade | ||||
| Kamoa | Along RN39 25°09’35.40’’E 10°24’52.03’’S |
71 | Before 2000 | Moderate-high | Agriculture, charcoal production, mining-related activities | ||||
| Mulomba | Along RN39 25°05’28.30’’E 10°21’58.85’’S |
82 | Before 2000 | Moderate | Agriculture, charcoal production | ||||
| Mpwita | Along mining exploration road 25°03’57.67’’E 10°24’54.00’’S |
88 | 2012 | Low-moderate | Agriculture, charcoal production, mining-related activities | ||||
| Village | Geographic coordinates and setting |
Distance from Kolwezi (km) | Approximate period of establishment | Accessibility level | Main livelihood activities |
Table 2.
Temporal variation in the PLAND for major land-cover classes during 1998–2023.
| Land cover | Year | |||||
| 1998 | 2002 | 2007 | 2013 | 2017 | 2023 | |
| Forest | 39.92 | 44.98 | 40.03 | 32.45 | 26.65 | 12.50 |
| Wooded savannas | 29.39 | 20.93 | 29.21 | 27.66 | 23.20 | 26.60 |
| Grasslands and wetlands | 27.65 | 30.40 | 24.93 | 28.84 | 32.80 | 37.00 |
| Water | 0.16 | 0.24 | 0.26 | 0.31 | 0.30 | 0.37 |
| Agricultural | 2.19 | 2.81 | 4.75 | 9.43 | 14.80 | 16.66 |
| Built-up and bare soil | 0.64 | 0.59 | 0.77 | 1.28 | 2.22 | 6.80 |
Disclaimer/Publisher’s Note: The statements, opinions and data contained in all publications are solely those of the individual author(s) and contributor(s) and not of MDPI and/or the editor(s). MDPI and/or the editor(s) disclaim responsibility for any injury to people or property resulting from any ideas, methods, instructions or products referred to in the content. |
© 2026 by the authors. Licensee MDPI, Basel, Switzerland. This article is an open access article distributed under the terms and conditions of the Creative Commons Attribution (CC BY) license.
Copyright: This open access article is published under a Creative Commons CC BY 4.0 license, which permit the free download, distribution, and reuse, provided that the author and preprint are cited in any reuse.


