
Submitted:
01 July 2026
Posted:
01 July 2026
You are already at the latest version
Abstract
Processing tomato harvesters require real-time sorting of ripe tomatoes, unripe tomatoes, defective tomatoes, and soil clods in dense material flows. The key challenge is that category evidence is subtle, local, and spatially uneven: defect textures, fruit boundaries, and soil-clod cues are easily diluted by adjacent objects and background clutter. To address this, we propose SG-RTDETR, which adapts RT-DETRv2 to selectively allocate representation capacity to informative target regions while retaining local evidence. The model preserves high-resolution details during downsampling, applies saliency-guided token selection to focus global encoding on target-related locations, and reintegrates encoded tokens through residual spatial refill to maintain feature continuity. Context-aware feature organization and spatially adaptive cross-scale fusion further reduce fragmented responses and background-dominated fusion. Together, these operations target two main error sources: lost local cues and cluttered cross-region interactions. We constructed a four-category processing tomato dataset with 1,000 multi-object images and 400 single-object images for supplementary representation learning. Under a unified evaluation protocol, SG-RTDETR achieved 87.9% mAP50:95, 92.5% mAP50, and 95.6% mAR50:95, outperforming RT-DETRv2 by 3.4, 3.6, and 0.6 percentage points, respectively, while maintaining 103.6 FPS. These results show that selective modeling of spatially uneven evidence improves real-time tomato sorting.
Keywords:
processing tomato
; online sorting
; real-time object detection
; RT-DETRv2
; saliency-guided token selection
; selective representational allocation
1. Introduction
High-throughput online sorting in processing tomato harvesters requires real-time detectors that can make fruit-level and impurity-level decisions under dense material-flow conditions [1,2,3,4]. During mechanized harvesting, ripe tomatoes, unripe tomatoes, defective tomatoes, and soil clods must be localized and classified rapidly so that grading quality, impurity removal, and harvester efficiency can be maintained. Unlike conventional fruit detection tasks that mainly emphasize fruit localization, online sorting requires object localization and category discrimination to be solved jointly in real time [5,6]. This requirement is difficult because detached materials are frequently adjacent or partially crowded, while ripe, unripe, and defective tomatoes may share similar color, shape, and texture characteristics. Processing tomato online sorting should therefore be treated as a dense multi-category detection task in which localization efficiency and fine-grained category discrimination are both critical.
Existing tomato vision studies have mainly focused on fruit localization, yield counting, maturity recognition, and phenotypic measurement in field and greenhouse environments [7,8,9,10,11,12]. These studies have advanced agricultural perception, but most of them address preharvest scenes in which tomatoes remain attached to plants or are evaluated for growth, ripeness, or phenotype-related traits [13,14]. Their objectives and evaluation settings do not directly match postharvest online sorting, where detached fruits and field impurities must be classified at the object level under dense conditions [15,16]. As a result, the accuracy–efficiency trade-off of detectors for simultaneous real-time localization and reliable discrimination among visually similar processing tomato categories remains insufficiently studied.
The central technical challenge in processing tomato sorting is that discriminative evidence is subtle, local, and spatially uneven. Defective tomatoes are especially difficult to identify because visually different defects, including cracks, wormholes, rotten navels, scars, and deformation, are grouped into a single fruit-level category [17,18]. At the same time, defective tomatoes may resemble ripe or unripe tomatoes in their overall color, shape, and surface appearance [19,20]. Reliable discrimination therefore depends on locally distributed cues, such as defect regions, boundary variations, and category-specific textures, rather than only on whole-fruit appearance [21,22]. Under dense sorting conditions, responses from adjacent fruits, inter-object gaps, soil clods, and background regions can further obscure these cues [23,24]. A detector for this task must therefore preserve detail-sensitive local structures while selectively allocating representational capacity to informative target-related regions.
Current real-time detectors do not fully resolve this representation problem. Convolution-based detectors, particularly YOLO-style models, have been widely applied in agricultural vision because they provide efficient local feature extraction and high inference speed [25,26]. Their local modeling is useful for deployment-oriented detection, but dense sorting also requires contextual reasoning among adjacent and visually similar targets [27,28,29,30]. Transformer-based detectors provide stronger global interaction, and the DETR family progressively combines end-to-end set prediction, deformable attention, and real-time inference [31,32,33,34]. However, directly applying RT-DETRv2 still leaves three task-specific issues: detail-sensitive cues may be weakened during downsampling, global interaction may be spent on background or adjacent-object regions, and cross-scale fusion may mix target-related responses with irrelevant clutter. A task-oriented RT-DETRv2 variant is therefore needed to direct representation learning toward informative regions without sacrificing local evidence or real-time efficiency.
To address these limitations, we propose SG-RTDETR, a saliency-guided real-time detector built on RT-DETRv2 and organized around the principle of selective representational allocation. Instead of uniformly enhancing all spatial responses, SG-RTDETR preserves detail-sensitive structures before deep semantic modeling, selects informative spatial tokens for global interaction, organizes mid-level target responses, adaptively fuses cross-scale features, and aligns classification confidence with localization quality. Specifically, Frequency-aware Detail Preservation (FADP) stabilizes high-resolution detail cues during downsampling; the Saliency-Guided Feature Encoder (SGFE) concentrates global modeling on salient target-related tokens and restores them through residual spatial refill; Context-aware Feature Organization (CAFO) improves mid-level target response coherence; Spatially Adaptive Cross-scale Fusion (SACF) suppresses background-dominated fusion responses; and Quality Focal Loss (QFL) improves confidence–localization consistency in dense scenes. Together, these designs form a coordinated detector for fine-grained real-time sorting rather than a simple accumulation of independent modules.
Experiments on a four-category processing tomato dataset support the effectiveness of this design. The dataset contains 1,000 multi-object images as the primary dense-scene data and 400 single-object images for supplementary representation learning. Single-object augmentation improves the representation of underrepresented categories, while the final validation and test settings retain dense multi-object scenes. Under a unified evaluation protocol, SG-RTDETR achieves 87.9% , 92.5% , and 95.6% , outperforming RT-DETRv2 by 3.4, 3.6, and 0.6 percentage points, respectively, while maintaining 103.6 FPS. Ablation and visualization results further show that the performance gain comes from complementary detail preservation, salient-region global modeling, adaptive fusion, and quality-aware supervision.
The main contributions of this study are summarized as follows:
1. We formulate processing tomato online sorting as a dense real-time multi-category detection task that requires efficient object localization and reliable discrimination among visually similar fruit and impurity categories.
2. We propose SG-RTDETR, a saliency-guided real-time detection framework that selectively allocates representation capacity across detail preservation, salient-token global modeling, mid-level response organization, adaptive cross-scale fusion, and quality-aware supervision.
3. We construct a four-category processing tomato dataset and introduce a single-object augmentation strategy for underrepresented categories. Comprehensive experiments show that SG-RTDETR improves detection accuracy over RT-DETRv2 and representative detectors while maintaining real-time inference efficiency.
2. Materials and Methods
This section describes the data construction procedure, the proposed SG-RTDETR model, and the experimental protocol used for controlled evaluation. We first introduce the processing tomato image dataset, including sample collection, category definition, annotation, partitioning, and supplementary single-object augmentation. We then present the saliency-guided detector from its overall architecture to each functional component, following the forward-processing order of feature preservation, salient-token encoding, feature organization, cross-scale fusion, and quality-aware supervision. Finally, we report the hardware, software, and training settings used to ensure that all model comparisons were conducted under the same evaluation protocol.
2.1. Materials
2.1.1. Data Acquisition
The dataset was constructed to represent the postharvest material stream encountered in processing tomato sorting. Tomato samples were collected under open-field conditions in Changji Hui Autonomous Prefecture, Xinjiang Uygur Autonomous Region, China, during two field campaigns. The first campaign was conducted on August 4, 2025, in Yuanhu Village, Hutubi County (N, E), and the second on August 23, 2025, in Laotai Township, Jimsar County (N, E). Four sorting categories were defined before annotation: ripe tomatoes, unripe tomatoes, defective tomatoes, and soil clods. Fruits at the semi-ripe stage were assigned to the unripe category, and fruits with visible defects, including cracking, wormhole, and rotten navel, were grouped into a single fruit-level defective category. Representative examples of the collected multi-object and single-object samples are shown in Figure 1.
After field collection, all samples were transported to the laboratory for image acquisition under a controlled but variable imaging setup. As shown in Figure 2, the system consisted of a vertically mounted camera, an annular light source, and a sample platform arranged in a near-top-down configuration. Moderate variations in illumination and camera-to-object distance were introduced to increase appearance diversity while keeping the acquisition procedure reproducible. Images were captured using the rear wide-angle camera of an Apple iPhone XR (35 mm equivalent focal length: 26 mm; aperture: f/1.8), and the original images were recorded in HEIF format at a resolution of 3024 × 4032 pixels.
A total of 1,000 multi-object images and 400 single-object images were collected for model development. The multi-object images were formed by naturally piling harvested materials and adding soil clods, yielding approximately 44 objects per image on average. These images served as the primary dense-scene detection data. The 400 single-object images contained 100 samples for each category and were reserved for supplementary augmentation. All images were converted to JPEG format and resized to 640 × 640 pixels for model training and evaluation.
2.1.2. Dataset Annotation, Partition, and Single-Object Augmentation
The multi-object subset contained 23,603 ripe tomatoes, 12,997 unripe tomatoes, 5,982 defective tomatoes, and 1,970 soil clods. This distribution showed clear class imbalance, with ripe tomatoes dominating the dataset and defective tomatoes and soil clods being underrepresented. All original images were manually annotated in Labelme. Polygon annotations were first drawn for the four categories and then converted into axis-aligned bounding boxes for detector training. Defective tomatoes were annotated at the fruit level, so all visible defect patterns were merged into one defective category.
Single-object images were introduced only as supplementary training samples to improve the visual representation of underrepresented categories. Compared with dense multi-object scenes, single-object images provide cleaner views of shape, texture, and color cues, which helps the detector learn category-specific appearances without replacing dense-scene context. Data augmentation was therefore applied only to the annotated single-object samples. As shown in Figure 3, the augmentation operations included random translation, brightness adjustment, contrast adjustment, and random rotation. These operations generated 2,000 additional single-object images, increasing the number of single-object training images from 400 to 2,400, and all corresponding annotations were transformed synchronously during augmentation.
The 1,000 multi-object images were split into training, validation, and test sets at a ratio of 7:2:1, resulting in 700, 200, and 100 images, respectively. The augmented single-object samples were added only to the training set, whereas the validation and test sets retained the original multi-object distribution. This setting prevents supplementary single-object samples from entering the evaluation data and keeps validation and test performance tied to dense sorting scenes. All images and annotations were finally organized in COCO format for subsequent training and evaluation.
2.2. Overall Architecture and Design of SG-RTDETR
RT-DETRv2 provides an effective real-time end-to-end baseline for processing tomato sorting, but its generic feature processing does not explicitly address subtle local defects, dense object distributions, or background interference. In particular, detail-sensitive cues may be weakened during downsampling, global modeling may include many irrelevant spatial regions, and cross-scale fusion may propagate background-dominated responses. SG-RTDETR addresses these limitations by selectively preserving and modeling target-related evidence.
As shown in Figure 4, FADP preserves high-resolution detail cues before deeper semantic processing. SGFE then selects informative spatial tokens for global encoding and reintegrates them through residual refill. CAFO organizes mid-level target responses, SACF adaptively modulates cross-scale fusion, and QFL aligns classification confidence with localization quality. Together, these components form a saliency-guided representation pipeline for dense fine-grained detection.
Formally, given an input image , SG-RTDETR predicts a fixed-size set of candidate detections through an end-to-end detector :
where M is the number of detection queries, is the predicted bounding box of the i-th query, and is its category score vector over C sorting categories.
2.3. Saliency-Guided Feature Encoder
The Saliency-Guided Feature Encoder (SGFE) is the core implementation of selective representational allocation. It determines which spatial regions should receive global semantic modeling and how the encoded information should be reintegrated into the original feature grid. In processing tomato sorting scenes, highly discriminative cues are usually concentrated in limited spatial locations, such as subtle defect regions, fruit boundaries, and category-specific texture patterns. Uniformly applying global self-attention to all spatial positions can increase computational cost, propagate irrelevant background responses, and weaken the representation of target-related regions. Prior token-sparsification and token-reorganization studies have shown that selectively retaining informative visual tokens can reduce redundant computation while preserving task-relevant representations [35,36,37]. SGFE therefore first selects salient spatial tokens according to their predicted importance and performs global encoding only on these informative tokens. After encoding, the selected tokens are written back to the feature map through residual spatial refill, while unselected locations retain their original convolutional representations. In this way, SGFE enhances informative regions without disrupting the spatial continuity of the original feature map. The architecture of SGFE is shown in Figure 5.
Let the input feature map be , and let . SGFE first predicts a saliency map through a saliency branch consisting of two convolutional layers with a ReLU activation in between, which is defined as:
where denotes the rectified linear unit activation function, and S represents the predicted saliency map encoding the relative importance of different spatial locations.
The saliency map is flattened along the spatial dimensions to obtain a saliency score vector, as shown in Eq. (3):
where each element corresponds to the saliency value of one spatial location. For each sample, spatial locations are ranked according to their saliency scores, and the indices of the top-k salient locations are selected according to Eq. (4):
where denotes the selected spatial index set, and the TopK operation is independently applied along the spatial dimension for each sample. The number of retained tokens is determined by the token retention ratio, as defined in Eq. (5):
where controls the proportion of spatial tokens preserved for global self-attention.
During training, SGFE adopts a sample-source-aware token retention strategy to account for the different visual complexities of the supplementary single-object images and the original multi-object images. Specifically, single-object supplementary images use a lower token retention ratio of 40%, because they contain cleaner object appearances and fewer contextual interactions. In contrast, original multi-object images use a higher token retention ratio of 60%, so that sufficient spatial tokens are retained for modeling dense object distributions and inter-object contextual relationships. During inference, the token retention ratio is fixed at 60% to provide a deterministic token budget and stable inference latency. The effectiveness of this training–inference retention policy is further analyzed in Section 3.5.1 and Section 3.5.3.
Given the selected index set , the input feature map is reshaped into a sequence of spatial tokens . The selected token sequence is obtained by gathering features at the Top-k indices:
Two-dimensional sinusoidal positional encodings are gathered at the same spatial indices and added to the selected tokens. The resulting position-aware sequence is then processed by a Transformer encoder :
where M denotes the encoded salient-token representation. Because self-attention is applied only to , global semantic modeling is concentrated on informative regions rather than uniformly distributed over all spatial positions.
After global encoding, SGFE maps the encoded salient tokens back to the original spatial feature grid through residual spatial refill. The refill operation scatters the encoded tokens to their original locations and adds them to the corresponding convolutional features:
where places the encoded tokens at the selected locations and assigns zero values to unselected locations. Therefore, selected locations receive global semantic updates, while unselected locations retain their original convolutional representations.
Finally, the updated token grid is reshaped back to the spatial domain to obtain the SGFE output feature map:
By combining saliency-guided token selection, selective global encoding, and residual spatial refill, SGFE enhances discriminative regions without disrupting the original spatial structure of the feature map. This design allows global interaction to focus on target-related regions while retaining local convolutional evidence at unselected positions, which is important for subtle local abnormalities and dense agricultural backgrounds.
2.4. Frequency-Aware Detail Preservation
Frequency-aware Detail Preservation (FADP) is introduced to support the saliency-guided representation framework by preserving detail-sensitive local cues before high-level token selection and global semantic modeling. In processing tomato sorting scenes, subtle defects and category boundaries are often expressed as local texture variations, edge discontinuities, and small surface abnormalities. These discriminative cues are mainly contained in high-resolution feature maps but can be weakened during early downsampling. Conventional strided downsampling may also introduce aliasing artifacts, which disturbs fine-grained feature representations and reduces the reliability of subsequent salient-region modeling; anti-aliased pooling has been shown to improve shift consistency by reducing such downsampling artifacts [38]. FADP is therefore designed at the high-resolution S3 stage by combining anti-aliased downsampling, low-frequency complementary fusion, and channel-wise recalibration. This design reduces information distortion during resolution reduction and provides a more stable detail-preserving feature basis for subsequent context modeling and cross-scale fusion. The corresponding structure is illustrated in Figure 6, and the ECA mechanism used for channel-wise recalibration is shown in Figure 7.
In S3-Block1, downsampling from S2 to S3 is achieved via a BlurPool-based dual-branch fusion design. Let denote the high-resolution input feature map of this stage. In the left branch, BlurPool with stride 2 performs anti-aliased subsampling, and a Conv-BN layer then recovers local spatial context. An Efficient Channel Attention (ECA) unit [39] is applied to the output of this branch to recalibrate informative channel responses. In parallel, the right branch uses AvgPool with stride 2 followed by a Conv-BN layer to provide a smooth low-frequency complement. The two branch features are fused by element-wise summation and activated by ReLU to obtain the downsampled high-resolution feature map . The downsampling and feature fusion process can be formulated as follows:
where and denote the features extracted by the BlurPool-based and AvgPool-based branches, respectively, and denotes the resulting downsampled high-resolution feature map.
In S3-Block2, channel-wise recalibration is further incorporated into the high-resolution residual block. Specifically, an ECA unit is inserted after the second Conv-BN layer to adaptively enhance informative channel responses. The recalibrated features are then fused with the block input through residual addition, followed by ReLU activation to produce the final output of this stage.
By integrating anti-aliased downsampling, low-frequency complementary fusion, and channel-wise recalibration, FADP reduces information distortion during early resolution reduction and maintains stable detail-sensitive representations at the high-resolution stage. This provides a more reliable feature basis for subsequent context modeling and cross-scale feature fusion.
2.5. Context-Aware Feature Organization
Context-aware Feature Organization (CAFO) extends the selective representation principle to the mid-level feature stage. In SG-RTDETR, the fourth feature stage (S4) serves as a transition between high-resolution local details and high-level semantic representations. Under dense and cluttered harvesting conditions, mid-level responses may become spatially scattered and sensitive to background textures, weakening the structural continuity of target-related regions. CAFO therefore reorganizes S4 features by enlarging contextual perception and recalibrating responses along both channel and spatial dimensions. The aim is not generic attention enhancement, but the transformation of fragmented mid-level activations into more coherent target-related representations while keeping the feature resolution and backbone topology unchanged. The resulting organized features provide a more stable basis for subsequent cross-scale fusion and object detection. The architecture of CAFO is shown in Figure 8.
Given the input feature map , a dilated convolution with a dilation rate of 2 is first applied to expand the effective receptive field without reducing spatial resolution, following the established use of dilated convolution for multi-scale context aggregation [40]:
where denotes the context-enhanced mid-level feature map. This operation provides a broader neighborhood context for dense fruit regions while preserving the spatial layout required for detection.
The dilated feature map is then recalibrated along both channel and spatial dimensions. For channel-wise recalibration, global average pooling and global max pooling are applied over the spatial dimensions to obtain complementary channel descriptors. These descriptors are processed by lightweight mapping functions and combined to generate channel-wise weights:
where and denote global average pooling and global max pooling, respectively, denotes the channel-wise weighting map, is the Sigmoid activation function, and ⊙ denotes broadcast element-wise multiplication.
For spatial response organization, average pooling and max pooling are applied along the channel dimension. The resulting spatial descriptors are concatenated and processed by a convolution followed by Sigmoid activation:
where denotes the spatial weighting map, and denote average pooling and max pooling along the channel dimension, respectively, and denotes concatenation. The channel and spatial recalibration processes jointly emphasize informative feature responses and spatially coherent target-related regions.
Finally, local structural refinement and residual modulation are performed in a unified update. The channel-recalibrated feature map is first refined using depthwise convolution and then modulated by the spatial weighting map. A learnable scaling parameter is subsequently used to regulate the modulation strength before residual fusion with the input feature:
where denotes the output feature map of CAFO, is a learnable scaling parameter, and denotes depthwise convolution.
Through this design, CAFO transforms scattered mid-level responses into more coherent and target-related representations by combining enlarged-context modeling, channel-wise recalibration, spatial response organization, and residual modulation. The resulting S4 features provide a more structured basis for subsequent cross-scale fusion and object detection.
2.6. Spatially Adaptive Cross-Scale Fusion
Spatially Adaptive Cross-scale Fusion (SACF) extends the selective representation principle to the feature fusion stage. Cross-scale feature fusion is essential for integrating local details and high-level semantics in object detection, as demonstrated by feature-pyramid and weighted bidirectional fusion designs [41,42]. However, the original RepVGGBlock in CSPRepLayer performs linear additive fusion with spatially uniform weighting, which does not account for position-dependent differences in feature importance [43]. Under complex harvesting conditions, such uniform fusion may propagate background-dominated responses together with target-related features and weaken the selectivity of cross-scale integration. SACF therefore introduces a spatial gating branch to adaptively modulate the main feature response at each spatial location before fusion. In this way, feature integration is transformed from uniform additive aggregation into position-dependent adaptive modulation, allowing informative target-related responses to be emphasized while suppressing less relevant background interference. The resulting fused features provide more discriminative representations for subsequent object detection. The corresponding architecture is shown in Figure 9.
The proposed SACF design consists of a main feature branch and a spatial gating branch. Given an input feature map , the main branch extracts the base semantic representation using a convolutional kernel , yielding an intermediate feature response Y:
where X denotes the input feature map, denotes the convolution kernel of the main branch, and Y denotes the resulting intermediate feature response.
In parallel, the gating branch applies an independent convolutional kernel with the same receptive field to generate a single-channel spatial weight map. A Sigmoid activation is then used to normalize the gating values to the range :
where denotes the spatial gating map, denotes the Sigmoid activation function, and denotes the convolution kernel of the gating branch.
The spatial gating map is then applied to the main-branch response through element-wise multiplication to achieve position-dependent feature modulation:
where Z denotes the modulated feature output and ⊙ denotes element-wise multiplication. As shown in Figure 9, the output Z is further fused with the parallel branch in the fusion block through element-wise addition to obtain the final fused representation.
Through SACF, cross-scale feature fusion is transformed from spatially uniform additive integration into position-dependent adaptive modulation. This allows target-related responses to be emphasized while background-dominated responses are attenuated before fusion, thereby improving the robustness of deeply fused features under complex field conditions.
2.7. Quality Focal Loss (QFL)
Accurate online sorting requires not only correct category prediction but also reliable localization confidence. This requirement is particularly important in dense processing tomato scenes, where adjacent fruits, ambiguous boundaries, small soil clods, and subtle defective regions may cause a mismatch between classification confidence and bounding-box localization quality. Focal Loss addresses foreground–background imbalance by down-weighting easy examples, while VarifocalNet further introduces IoU-aware classification scores for dense detection [44,45]. Although the RT-DETRv2 baseline used in this study adopts a quality-aware classification supervision design rather than a BCE-only loss, its varifocal-style supervision may still produce insufficient confidence–localization consistency under such fine-grained dense sorting conditions.
To further improve this consistency, SG-RTDETR replaces the baseline varifocal-style classification supervision with Quality Focal Loss (QFL), following [46]. QFL uses the IoU between the predicted box and the matched ground-truth box as a continuous quality target for the corresponding category. Therefore, the classification score is encouraged to reflect both category confidence and localization quality, rather than only category correctness. This design helps suppress high-confidence but poorly localized predictions and improves the reliability of detection results in dense tomato sorting scenes with small targets, adjacent fruits, and ambiguous boundaries.
Let denote the predicted score of query i for class c, and let denote its quality-aware target. For the matched category of a positive query, is set to the IoU between the predicted bounding box and the matched ground-truth box; for unmatched categories and negative queries, . The QFL classification objective can be written as:
where is the focusing parameter. This formulation reduces the loss contribution of well-aligned predictions and increases the penalty for predictions whose classification confidence is inconsistent with localization quality.
2.8. Experimental Setup
All experiments were conducted under the same hardware and software environment to ensure controlled comparison. The hardware platform was a desktop computer running Windows 11 Pro (64-bit), equipped with a 12th-generation Intel® Core (TM) i7-12700KF processor (3.60 GHz), 64 GB of RAM, an NVIDIA GeForce RTX 4060 Ti GPU with 16 GB of memory, and a 1 TB NVMe SSD for data and model storage. The software environment was based on CUDA 11.6, Python 3.9.21, and PyTorch 2.1.0, with Visual Studio Code (VS Code) used as the integrated development environment.
All compared detectors were trained and evaluated under a unified deployment-oriented protocol. During training, all input images were resized to 640 × 640 pixels, the batch size was set to 8, the number of training epochs was set to 120, and the Adam optimizer was used with an initial learning rate of 0.01. For controlled comparison and reproducibility, the same dataset split, input resolution, preprocessing pipeline, training epoch budget, and evaluation protocol were used for all compared models. This protocol was intended to evaluate the relative accuracy–efficiency trade-off of different detectors under the same deployment-oriented setting, rather than to claim that each detector was trained with its individually optimal recipe.
3. Results
3.1. Evaluation Metrics
We evaluate detection performance under the standard COCO evaluation protocol. The main metrics include , , and . Here, denotes mean average precision at an IoU threshold of 0.5. denotes mean average precision averaged over IoU thresholds from 0.5 to 0.95 with a step size of 0.05. denotes mean average recall over the same IoU thresholds. In addition to these evaluation metrics, we also report the number of parameters, FLOPs, and inference speed in frames per second (FPS) in selected comparative experiments. These results help evaluate the trade-off between detection accuracy and computational efficiency.
3.2. Impact of Single-Object Sample Introduction and Augmentation Strategies on Model Performance
This experiment tests whether supplementary single-object images can improve the representation of underrepresented categories while retaining dense multi-object images as the validation and test setting. Four training configurations were evaluated using RT-DETRv2 under the same dataset split, preprocessing procedure, training schedule, and optimization setting. The data composition of each configuration is summarized in Table 1. A1 was trained only on the original multi-object images and served as the baseline. A2 applied conventional augmentation to multi-object images. A3 introduced the 400 original single-object samples without further augmentation. A4 further applied augmentation to the single-object samples, generating 2,000 additional augmented single-object images. Therefore, A2 and A4 generated the same number of augmented images (2,000), but applied augmentation to different sources: A2 augmented the multi-object images, whereas A4 augmented the single-object images and additionally retained the 400 original single-object images, resulting in 3,100 training images in total.
The performance comparison under the four data configurations is shown in Figure 10. Figure 10(a) presents the overall detection metrics, and Figure 10(b) shows the class-wise AP results. Compared with the baseline A1, both A2 and A3 improved the overall detection performance. A2 increased and to 80.6% and 87.1%, respectively, while A3 achieved comparable values of 80.3% and 87.2%. These results indicate that both conventional multi-object augmentation and the introduction of single-object samples improved detection accuracy over the baseline.
Among the four configurations, A4 achieved the best overall performance, reaching 84.5% and 88.9% . Relative to A1, these values correspond to improvements of 6.9 and 3.6 percentage points, respectively. The class-wise results in Figure 10(b) further show that A4 consistently outperformed the other configurations across all categories. Compared with A1, A4 improved class-wise by 4.9 percentage points for ripe tomatoes, 7.4 percentage points for unripe tomatoes, 4.7 percentage points for defective tomatoes, and 10.7 percentage points for soil clods. The largest gain was observed for soil clods, which were the least represented category in the original multi-object dataset.
Overall, augmenting the introduced single-object samples produced the most substantial and consistent improvement among the evaluated data strategies, with gains observed in both overall detection accuracy and class-wise AP. Since A4 achieved the best overall performance among the evaluated data configurations, it was adopted as the default training data configuration for all subsequent ablation studies, model comparisons, and qualitative analyses unless otherwise specified.
3.3. Training Dynamics of SG-RTDETR
Figure 11 compares the training dynamics and convergence behavior of RT-DETRv2 and SG-RTDETR under the same training settings. As shown in Figure 11(a)–(c), SG-RTDETR exhibits faster metric improvement during the early training stage and reaches higher final values in , , and . The proposed model also shows a more stable upward trend before convergence, suggesting that the introduced feature modeling strategies improve the learning process without causing unstable optimization.
The precision–recall curves in Figure 11(d) further show that SG-RTDETR maintains higher precision over most recall intervals than RT-DETRv2. This indicates that the proposed model improves prediction reliability while preserving detection completeness. In particular, the curve of SG-RTDETR remains above that of the baseline across a broad recall range, suggesting improved discrimination between target regions and background interference.
The loss curves in Figure 11(e) and Figure 11(f) also show more favorable convergence behavior for SG-RTDETR. Compared with RT-DETRv2, SG-RTDETR exhibits a faster decrease in training loss during the early epochs and converges to a lower final value. A similar trend is observed for the bounding-box regression loss, where the proposed model reaches a lower and smoother convergence state. These results suggest that SG-RTDETR improves both detection accuracy and convergence stability compared with the baseline RT-DETRv2.
3.4. Ablation Studies
The ablation study tests whether the proposed accuracy gain comes from a coordinated selective-representation design rather than an isolated change to the detector. Using RT-DETRv2 as the baseline, we evaluated SGFE, SACF, QFL, FADP, and CAFO under identical hardware conditions, dataset splits, training schedules, and optimization settings. The ablation study was organized into two parts. Experiments 2–6 evaluated the individual contribution of each design by adding only one component to the baseline. Experiments 7–10 further examined representative multi-component combinations to assess the complementarity among the proposed designs. The quantitative results are summarized in Table 2.
The single-component experiments first confirm that each design contributes a positive gain when added individually to the baseline. SGFE produced the largest single-component improvement, raising from 84.5% to 86.3% (+1.8 percentage points), followed by CAFO at 86.1% (+1.6). SACF, QFL, and FADP each yielded gains of 1.0 to 1.2 percentage points, reaching 85.7%, 85.6%, and 85.5%, respectively. These results indicate that all five designs independently strengthen detection, with the two global-context-oriented components, SGFE and CAFO, contributing the most.
The multi-component experiments further show that the proposed designs are complementary. When SGFE and SACF were combined, increased to 86.8%, exceeding the performance of either design used alone. After further introducing QFL, FADP, and CAFO, the detection accuracy continued to improve. The full SG-RTDETR model achieved the best overall performance, with 87.9% , 92.5% , and 95.6% . Compared with the baseline, these values correspond to improvements of 3.4, 3.6, and 0.6 percentage points, respectively. This progressive improvement supports the intended design logic: local detail preservation, salient-region global modeling, adaptive fusion, and quality-aware supervision operate as complementary parts of the same representation-allocation strategy.
In terms of model complexity, the full model maintained a parameter size comparable to that of the baseline, increasing only from 20.09 M to 20.14 M. The FLOPs remained nearly unchanged at approximately 61 G. Although the inference speed decreased from 110.5 FPS to 103.6 FPS after integrating all components, the model still maintained real-time inference capability above 100 FPS. These results indicate that the proposed designs improve detection accuracy while preserving computational efficiency.
The following subsections provide dedicated mechanism analyses for SGFE, FADP, and CAFO, which involve spatial token selection, frequency-domain detail preservation, and mid-level response organization that benefit from further interpretation. The contributions of SACF and QFL are already quantified in the ablation study above, as their effects on cross-scale fusion and confidence–localization consistency are directly reflected in the detection metrics rather than in dedicated feature visualizations.
3.5. Ablation and Mechanism Analysis of SGFE
To further examine the internal design and working mechanism of SGFE, a series of controlled experiments was conducted from four aspects: token retention ratio, token selection strategy, training–inference retention policy, and spatial refill scheme. The following mechanism analyses (Section 3.5, Section 3.6, Section 3.7 and Section 3.8) are organized by component contribution magnitude reported in Table 2, starting from SGFE, rather than by the forward-processing order used in the method section. These experiments test the core claim that SGFE improves dense sorting not by token sparsification alone, but by selecting informative regions and reintegrating them without destroying local spatial continuity. In addition, qualitative visualizations of saliency score maps and selected-refill locations were provided to interpret the internal behavior of SGFE. Unless otherwise specified, all experiments in this section were conducted under identical training and inference settings, and only the factor under investigation was changed.
3.5.1. Sensitivity Analysis of Token Retention Ratio
To analyze the sensitivity of SGFE to the token retention ratio, we varied the proportion of retained tokens during inference while keeping the network architecture, training configuration, and token selection strategy unchanged. In this experiment, SGFE adopted the saliency-guided Top-k token selection strategy, and the token retention ratio, denoted as , was increased from 10% to 100%.
The results are shown in Figure 12. As increased from 10% to 60%, showed an overall upward trend and reached its highest value of 86.3% at . The also improved with increasing token retention and reached its maximum value of 94.9% at . However, increasing the retention ratio beyond 60% did not further improve ; instead, the accuracy showed a slight decline. Meanwhile, FLOPs increased gradually as more tokens were retained, whereas FPS remained within a real-time range across all settings.
Considering the balance between detection accuracy and computational efficiency, was selected for subsequent experiments. At this setting, SGFE achieved the highest while maintaining competitive recall, moderate FLOPs, and an inference speed of 110.7 FPS.
3.5.2. Effect of Saliency-Guided Token Selection
To evaluate the effect of different token selection strategies in SGFE, comparative experiments were conducted under a fixed token budget. In all experiments, the token retention ratio was set to , and the same number of tokens was selected from the spatial locations of the input feature map. Only the token selection strategy was varied, while the network architecture, training procedure, and inference settings were kept unchanged. The evaluated strategies included random-k sampling, uniform-k sampling, and saliency-guided Top-k selection.
The results are shown in Figure 13. Under the same token budget, saliency-guided Top-k selection achieved the best performance, with 86.3% and 94.7% . In comparison, random-k sampling achieved 84.8% and 94.1% , while uniform-k sampling achieved 85.1% and 94.5%, respectively. These results suggest that the improvement of SGFE comes primarily from selecting informative spatial tokens rather than merely reducing the number of tokens. Therefore, saliency-guided token selection is more effective than random or spatially uniform sampling for preserving discriminative information under a fixed computational budget.
3.5.3. Impact of Token Retention Policies
To evaluate the impact of the token retention policy in SGFE, we compared different training configurations under the same network architecture, training settings, and inference protocol. The evaluated policies included: (i) a fixed retention policy, in which a token retention ratio of 60% was used during both training and inference; and (ii) a source-aware training policy, in which single-object supplementary images used a lower retention ratio of 40%, while original multi-object images used a higher retention ratio of 60%. For inference, the token retention ratio was fixed at 60% for both SGFE variants to ensure a deterministic token budget and stable inference latency.
The quantitative results are summarized in Table 3. Compared with the baseline, both SGFE variants improved . The Fixed–Fixed policy achieved 85.3% and 94.5% . In comparison, the Source-aware–Fixed policy achieved the best of 86.3%, while maintaining a competitive of 94.7%.
These results indicate that using a source-aware retention policy during training helps SGFE adapt to samples with different scene complexities. The lower retention ratio for single-object supplementary images avoids unnecessary global modeling over simple scenes, whereas the higher retention ratio for original multi-object images preserves sufficient spatial tokens for dense object distributions and contextual interactions. During inference, the fixed 60% retention ratio provides a deterministic token budget and stable inference behavior. Therefore, the Source-aware–Fixed policy was adopted in the final model.
3.5.4. Effect of Residual Spatial Refill Strategy
To evaluate the effect of different spatial refill strategies in SGFE, we conducted controlled experiments under a fixed token retention ratio. In all experiments, the same saliency-guided token selection strategy was used, and the token retention ratio was fixed at . The evaluated strategies differed only in how encoded tokens were written back to the feature map. Three strategies were compared: (i) an overwrite strategy that replaces the original features at selected spatial locations with encoded tokens; (ii) a zero-fill strategy that retains encoded features only at selected locations while setting all other positions to zero; and (iii) a residual strategy that adds the encoded tokens to the original convolutional features at selected locations.
The quantitative results are summarized in Table 4. The residual spatial refill strategy achieved the highest , reaching 86.3%, while maintaining a competitive of 94.7%. Although the overwrite strategy obtained a slightly higher of 94.9%, its was lower than that of the residual strategy. The zero-fill strategy produced the lowest , indicating that removing non-selected spatial features degrades detection performance.
The qualitative comparison in Figure 14 further illustrates the differences among the three refill strategies. Compared with overwrite and zero-fill, the residual strategy produces more continuous object-related responses and better preserves the spatial structure of tomato regions. These results indicate that residual refill provides a more effective way to integrate encoded salient tokens while maintaining the original convolutional feature continuity.
3.5.5. Qualitative Analysis of Saliency-Guided Token Scoring and Residual Refill
To further examine the internal behavior of SGFE, the predicted saliency score maps and the corresponding selected-refill locations were visualized, as shown in Figure 15. Rows (a)–(c) correspond to three representative test samples with different scene characteristics. The first column presents the input images, the second column shows the saliency score maps predicted by the saliency branch, and the third column illustrates the spatial locations selected by the Top-k strategy and updated through residual refill. Brighter regions in the saliency score maps indicate higher token importance.
As shown in Figure 15, the high-response regions in the saliency score maps are mainly concentrated on tomato bodies, object boundaries, and visually informative regions in dense fruit areas. In contrast, many background regions and low-discrimination areas receive relatively lower saliency responses. This indicates that the saliency branch does not assign importance uniformly over the entire feature map, but tends to emphasize target-related spatial regions.
The selected-refill visualizations further show that the retained tokens are mainly distributed around tomato regions rather than being randomly scattered across the image. These selected locations correspond to the feature-map positions used for subsequent global encoding and residual refill. It should be noted that the highlighted blocks represent discrete spatial positions on the feature map projected back to the image plane, rather than pixel-level segmentation masks. Therefore, the block-wise appearance reflects the resolution of the feature map used for token selection.
Overall, these visualizations provide qualitative evidence that SGFE allocates global modeling capacity to informative target-related regions while preserving the original spatial structure through residual refill. This observation is consistent with the quantitative results in the token selection and refill strategy experiments, where saliency-guided Top-k selection and residual spatial refill achieved better detection performance under the same token budget.
3.6. Frequency- and Spatial-Domain Validation of FADP
To evaluate whether FADP provides a more stable detail-preserving basis for selective representation, both frequency-domain and spatial-domain analyses were performed. The frequency-domain evaluation focused on frequency response stability and aliasing behavior using four metrics: high-frequency leakage ratio (HFER/ALI), passband response ratio (PBR), channel coherence (Coh), and aliasing score.
Under identical experimental settings, introducing FADP led to consistent changes across the frequency-domain metrics compared with the baseline, as reported in Table 5. Specifically, HFER/ALI decreased from 0.0005 to 0.0003, PBR decreased from 1.5206 to 1.1693, and the aliasing score decreased from 0.189591 to 0.064604, while Coh increased from 1.4036 to 1.6912. These results suggest that FADP stabilizes the frequency response during downsampling by reducing high-frequency leakage and aliasing artifacts while improving inter-channel coherence.
In addition to the quantitative analysis, spatial-domain feature responses were visualized for the baseline and FADP-enhanced models, as shown in Figure 16. Compared with the baseline, the FADP-enhanced model produces more continuous responses around tomato regions and object boundaries, whereas the baseline responses appear more fragmented and scattered. This observation suggests that FADP helps maintain more stable and informative high-resolution feature representations during resolution reduction.
3.7. Visualization of Mid-Level Feature Responses with CAFO
To examine whether CAFO organizes fragmented mid-level responses into more coherent target-related representations, feature response maps at the fourth stage (S4) were visualized for the baseline model and the CAFO-enhanced model, as shown in Figure 17. The figure includes the input image, the S4 response map of the baseline model, and the S4 response map after introducing CAFO.
In the baseline model, the S4 feature responses exhibit a spatially scattered distribution. Activated regions within fruits appear fragmented and isolated, and noticeable responses are also present in inter-fruit gaps and background areas. These response patterns indicate limited spatial continuity across individual fruit regions.
After introducing CAFO, the S4 feature responses become more spatially organized. Activated regions within fruits form more continuous response areas, while responses in inter-fruit gaps and background regions are less pronounced. Compared with the baseline, CAFO produces more coherent mid-level feature responses around tomato regions, suggesting improved contextual organization at the S4 stage.
3.8. Quantitative Comparison Between CAFO and Typical Attention Mechanisms
Beyond the qualitative observation of mid-level responses above, we further quantify the advantage of CAFO by comparing it against typical attention mechanisms. To compare task-specific feature organization with typical attention enhancement at the mid-level feature stage, we conduct quantitative experiments under a unified detection framework and identical training settings. Specifically, SE [47], CBAM [48], and the proposed CAFO are separately integrated into the fourth stage (S4) of RT-DETRv2, while all other network architectures and training parameters remain unchanged. The comparative results are illustrated in Figure 18.
As shown in Figure 18(a), introducing either SE or CBAM at S4 improves detection performance relative to the baseline model. Among the two conventional attention mechanisms, CBAM achieves slightly higher recall, whereas SE provides slightly better . When CAFO is introduced, further improvements are observed across all major detection metrics. Specifically, the CAFO-based model achieves 86.1% , 90.9% , and 95.2% , outperforming the SE- and CBAM-based variants under the same experimental conditions.
As shown in Figure 18(b), the different mechanisms introduce only marginal differences in computational cost. The parameter count and FLOPs remain nearly unchanged across all variants, while the FPS decreases only slightly after incorporating CAFO. These results indicate that CAFO improves mid-level feature organization and detection accuracy with only marginal additional computational overhead.
3.9. Comparison with Other Models
To evaluate the accuracy–efficiency balance of SG-RTDETR under the dense sorting protocol, comparative experiments were conducted against several representative object detection methods, including YOLOv8n, YOLOv11n, RTMDet [49], Faster R-CNN [50], Deformable DETR [32], and the original RT-DETRv2 [34]. For a controlled comparison, all models were trained and evaluated using the same dataset split, input resolution, training epoch budget, and evaluation protocol. This setting was adopted to compare different detectors under a unified deployment-oriented training protocol. It should be noted that this protocol does not necessarily represent the fully optimized model-specific recipe for each detector. The quantitative results are summarized in Table 6.
In terms of detection accuracy, the proposed method achieves an of 87.9%, which is higher than that of the baseline RT-DETRv2 and the other compared detectors. On , the proposed method attains a score of 92.5%, representing the highest value among the evaluated methods under the same experimental conditions.
With respect to object recall, the proposed model reaches an of 95.6%, exceeding those of the YOLO-based methods, RTMDet, Faster R-CNN, and Deformable DETR under the same experimental setting. Regarding model complexity and inference efficiency, SG-RTDETR contains 20.14 M parameters, which is comparable to the original RT-DETRv2, and requires 61.17 G FLOPs. The inference speed of the proposed model reaches 103.6 frames per second (FPS), which is higher than that of RTMDet, Faster R-CNN, and Deformable DETR.
3.10. Visualization of Detection Results
Figure 19 presents a qualitative comparison between the baseline RT-DETRv2 and the proposed method under several challenging detection scenarios. In the visualizations, white circles denote false positives, and orange circles denote false negatives. The baseline model exhibits more false positives and missed detections in challenging scenarios with blurred fruit boundaries, dense small objects, and strong background interference. These errors are particularly evident in regions where fruits are small or where object appearance is similar to background textures.
In comparison, the proposed method produces detection results that show closer spatial correspondence with the ground-truth fruit regions. Fewer false positives and false negatives are observed across the evaluated scenarios. In environments with dense fruit distributions and complex backgrounds, the predicted bounding boxes more consistently overlap with the ground-truth annotations, while fewer erroneous detections appear in background regions.
4. Discussion
The results support the view that processing tomato online sorting is not only a fast object-detection problem, but also a representation-allocation problem. The categories considered in this study differ through local and unevenly distributed cues, such as surface defects, boundary variations, and soil-clod textures. Under dense material-flow conditions, these cues can be obscured by neighboring fruits and background regions. The improvement of SG-RTDETR over RT-DETRv2 therefore indicates that real-time global modeling is useful, but insufficient unless the model is guided toward target-related evidence while retaining local detail.
The ablation and mechanism analyses clarify the source of this improvement. In Table 2, SGFE and CAFO produced the two largest single-component gains, suggesting that selective global modeling and mid-level response organization are central to this task. The token-selection experiments further show that the gain of SGFE does not come merely from reducing the number of modeled tokens. Under the same token budget, saliency-guided Top-k selection outperformed random and uniform sampling, and residual spatial refill achieved the best among the refill strategies. These findings support the intended mechanism: informative regions should receive global interaction, but the original convolutional feature continuity should not be discarded.
The frequency-domain and feature-response analyses further show that selective modeling needs a stable feature basis across stages. FADP reduced high-frequency leakage and aliasing during downsampling while improving channel coherence, which helps preserve boundary and texture cues before salient-token encoding. CAFO then transformed scattered S4 responses into more coherent target-related activations, and its comparison with SE and CBAM suggests that task-specific organization of spatial responses is more suitable here than generic attention enhancement. SACF extends this logic to feature fusion by reducing background-dominated responses before cross-scale integration. Taken together, the improvements are better interpreted as a progressive representation-refinement process than as independent module stacking.
The comparison with representative detectors places this design in a practical accuracy–efficiency context. YOLOv8n and YOLOv11n were faster, but their accuracy and recall were lower under the same protocol. Two-stage and transformer-based alternatives were generally slower or less accurate. Compared with RT-DETRv2, SG-RTDETR increased from 84.5% to 87.9% and from 88.9% to 92.5%, while maintaining a comparable parameter size, similar FLOPs, and an inference speed of 103.6 FPS. This trade-off is relevant for online sorting, where both throughput and category-level discrimination are required. The comparisons should nevertheless be interpreted under the unified training and evaluation protocol used in this study, rather than as fully optimized results for every detector family.
This study also has clear limitations. First, the experiments were performed on images collected after field sampling and acquired under a controlled imaging setup; validation on a physical online sorting line under continuous material flow is still needed before making deployment-level claims. Second, defective tomatoes were treated as a single fruit-level category, so the present results do not establish subtype-level recognition of cracks, wormholes, rotten navels, scars, or deformation. Third, the model comparisons used a unified deployment-oriented protocol, which improves fairness but may not match the best recipe for each detector. These limitations define the boundary of the current evidence and point to the next stage of validation.
5. Conclusions
This study addressed real-time multi-category detection for processing tomato online sorting, where ripe tomatoes, unripe tomatoes, defective tomatoes, and soil clods must be distinguished under dense material-flow conditions. We constructed a four-category dataset and proposed SG-RTDETR, which adapts RT-DETRv2 through selective representational allocation. The central idea is to preserve subtle local cues while directing global modeling and cross-scale fusion toward informative target-related regions, rather than enhancing all spatial responses uniformly.
Under a unified evaluation protocol, SG-RTDETR achieved 87.9% , 92.5% , and 95.6% , outperforming RT-DETRv2 by 3.4, 3.6, and 0.6 percentage points, respectively, while maintaining 103.6 FPS. Ablation, token-selection, frequency-domain, and feature-visualization results indicate that the improvement comes from coordinated detail preservation, salient-region modeling, feature organization, and adaptive fusion. Future work will focus on validation on a physical online sorting line under continuous material flow and on extending the current fruit-level defective category to subtype-level defect recognition.
Author Contributions
Conceptualization, X.J. and X.P.; methodology, X.J.; software, X.J.; validation, X.J. and X.W.; formal analysis, X.J. and X.W.; investigation, Y.Z.; resources, W.C.; data curation, Y.Z.; writing—original draft preparation, X.J.; writing—review and editing, X.W., Y.Z., X.P., and W.C.; visualization, Y.Z.; supervision, X.P. and W.C.; project administration, W.C.; funding acquisition, W.C. All authors have read and agreed to the published version of the manuscript.
Funding
This research was funded by the National Natural Science Foundation of China, grant number (52365008); the Guiding Science and Technology Plan Project of Xinjiang Production and Construction Corps, grant number (2023ZD060); the Integration Project for R&D, Manufacturing, Promotion and Application of Agricultural Machinery of Xinjiang Production and Construction Corps, grant number (NY240612-01); and the Major Science and Technology Project of the Science and Technology Plan of Xinjiang Production and Construction Corps, grant number (2024AA001).
Institutional Review Board Statement
Not applicable.
Informed Consent Statement
Not applicable.
Data Availability Statement
The raw data supporting the conclusions of this article will be made available by the authors on request.
Conflicts of Interest
The authors declare no conflicts of interest.
References
- Akter, T.; Bhattacharya, T.; Kim, J.H.; Kim, M.S.; Baek, I.; Chan, D.E.; Cho, B.K. A comprehensive review of external quality measurements of fruits and vegetables using nondestructive sensing technologies. Journal of Agriculture and Food Research 2024, 15, 101068. [CrossRef]
- Chang, S.; Zhang, M.; Kong, D.; Mujumdar, A.S. Artificial intelligence-driven postharvest quality control of fruit and vegetable products: intelligent detection, optimization strategies and application prospects. Food Bioscience 2025, 74, 108004. [CrossRef]
- Chuquimarca, L.E.; Vintimilla, B.X.; Velastin, S.A. A review of external quality inspection for fruit grading using CNN models. Artificial Intelligence in Agriculture 2024, 14, 1–20. [CrossRef]
- Ma, J.; Wan, Y.; Min, W.; Ma, Z.; Tan, L.; Jiang, S. Frontiers and advances of deep learning-based fruit and vegetable image analysis. Computers and Electronics in Agriculture 2026, 241, 111256. [CrossRef]
- Lu, Y.; Saeys, W.; Kim, M.; Peng, Y.; Lu, R. Hyperspectral imaging technology for quality and safety evaluation of horticultural products: a review and celebration of the past 20-year progress. Postharvest Biology and Technology 2020, 170, 111318. [CrossRef]
- Yang, C.; Guo, Z.; Fernandes Barbin, D.; Dai, Z.; Watson, N.; Povey, M.; Zou, X. Hyperspectral imaging and deep learning for quality and safety inspection of fruits and vegetables: a review. Journal of Agricultural and Food Chemistry 2025, 73, 10019–10035. [CrossRef]
- Afonso, M.; Fonteijn, H.; Fiorentin, F.S.; Lensink, D.; Mooij, M.; Faber, N.; Polder, G.; Wehrens, R. Tomato fruit detection and counting in greenhouses using deep learning. Frontiers in Plant Science 2020, 11, 571299. [CrossRef]
- Gao, J.; Zhang, J.; Zhang, F.; Gao, J. LACTA: a lightweight and accurate algorithm for cherry tomato detection in unstructured environments. Expert Systems with Applications 2024, 238, 122073. [CrossRef]
- Gu, Z.; Ma, X.; Guan, H.; Jiang, Q.; Deng, H.; Wen, B.; Zhu, T.; Wu, X. Tomato fruit detection and phenotype calculation method based on the improved RTDETR model. Computers and Electronics in Agriculture 2024, 227, 109524. [CrossRef]
- Koirala, A.; Walsh, K.B.; Wang, Z.; McCarthy, C. Deep learning–method overview and review of use for fruit detection and yield estimation. Computers and Electronics in Agriculture 2019, 162, 219–234. [CrossRef]
- Solimani, F.; Cardellicchio, A.; Dimauro, G.; Petrozza, A.; Summerer, S.; Cellini, F.; Renò, V. Optimizing tomato plant phenotyping detection: boosting YOLOv8 architecture to tackle data complexity. Computers and Electronics in Agriculture 2024, 218, 108728. [CrossRef]
- Zhang, W.; Wang, J.; Liu, Y.; Chen, K.; Li, H.; Duan, Y.; Wu, W.; Shi, Y.; Guo, W. Deep-learning-based in-field citrus fruit detection and tracking. Horticulture Research 2022, 9, uhac003. [CrossRef]
- Wang, A.; Qian, W.; Li, A.; Xu, Y.; Hu, J.; Xie, Y.; Zhang, L. NVW-YOLOv8s: an improved YOLOv8s network for real-time detection and segmentation of tomato fruits at different ripeness stages. Computers and Electronics in Agriculture 2024, 219, 108833. [CrossRef]
- Zeng, T.; Li, S.; Song, Q.; Zhong, F.; Wei, X. Lightweight tomato real-time detection method based on improved YOLO and mobile deployment. Computers and Electronics in Agriculture 2023, 205, 107625. [CrossRef]
- Bresilla, K.; Perulli, G.D.; Boini, A.; Morandi, B.; Corelli Grappadelli, L.; Manfrini, L. Single-shot convolution neural networks for real-time fruit detection within the tree. Frontiers in Plant Science 2019, 10, 611–622. [CrossRef]
- Kang, H.; Chen, C. Fast implementation of real-time fruit detection in Apple orchards using deep learning. Computers and Electronics in Agriculture 2020, 168, 105108. [CrossRef]
- Da Costa, A.Z.; Figueroa, H.E.; Fracarolli, J.A. Computer vision based detection of external defects on tomatoes using deep learning. Biosystems Engineering 2020, 190, 131–144. [CrossRef]
- Ireri, D.; Belal, E.; Okinda, C.; Makange, N.; Ji, C. A computer vision system for defect discrimination and grading in tomatoes using machine learning and image processing. Artificial Intelligence in Agriculture 2019, 2, 28–37. [CrossRef]
- Huang, Y.; Xiong, J.; Yao, Z.; Huang, Q.; Tang, K.; Jiang, D.; Yang, Z. A fluorescence detection method for postharvest tomato epidermal defects based on improved YOLOv5m. Journal of the Science of Food and Agriculture 2024, 104, 6615–6625. [CrossRef]
- Xue, S.; Li, Z.; Wang, D.; Zhu, T.; Zhang, B.; Ni, C. YOLO-ALDS: an instance segmentation framework for tomato defect segmentation and grading based on active learning and improved YOLO11. Computers and Electronics in Agriculture 2025, 238, 110820. [CrossRef]
- Cai, X.; Zhu, Y.; Liu, S.; Yu, Z.; Xu, Y. FastSegFormer: a knowledge distillation-based method for real-time semantic segmentation of surface defects in navel oranges. Computers and Electronics in Agriculture 2024, 217, 108604. [CrossRef]
- Nanda, M.A.; Saukat, M.; Yusuf, A.; Wigati, L.P.; Tanaka, F.; Tanaka, F. Identification of tomatoes with bruise using laser-light backscattering imaging technique. Scientia Horticulturae 2025, 350, 114301. [CrossRef]
- Feng, J.; Wang, Z.; Wang, S.; Tian, S.; Xu, H. MSDD-YOLOX: an enhanced YOLOX for real-time surface defect detection of oranges by type. European Journal of Agronomy 2023, 149, 126918. [CrossRef]
- Rong, D.; Rao, X.; Ying, Y. Computer vision detection of surface defect on oranges by means of a sliding comparison window local segmentation algorithm. Computers and Electronics in Agriculture 2017, 137, 59–68. [CrossRef]
- Chen, Y.; Huang, Y.; Zhang, Z.; Wang, Z.; Liu, B.; Liu, C.; Huang, C.; Dong, S.; Pu, X.; Wan, F.; et al. Plant image recognition with deep learning: a review. Computers and Electronics in Agriculture 2023, 212, 108072. [CrossRef]
- Ren, C.; Jeong, D.; Kim, D.K. A survey of deep learning in agriculture: techniques and their applications. Journal of Information Processing Systems 2020, 16, 1015–1033. [CrossRef]
- Li, C.; Lin, J.; Li, Z.; Mai, C.; Jiang, R.; Li, J. An efficient detection method for litchi fruits in a natural environment based on improved YOLOv7-litchi. Computers and Electronics in Agriculture 2024, 217, 108605. [CrossRef]
- Mao, D.; Sun, H.; Li, X.; Yu, X.; Wu, J.; Zhang, Q. Real-time fruit detection using deep neural networks on CPU (RTFD): an edge AI application. Computers and Electronics in Agriculture 2023, 204, 107517. [CrossRef]
- Min, W.; Wang, Z.; Yang, J.; Liu, C.; Jiang, S. Vision-based fruit recognition via multi-scale attention CNN. Computers and Electronics in Agriculture 2023, 210, 107911. [CrossRef]
- Wang, D.; He, D. Channel pruned YOLO V5s-based deep learning approach for rapid and accurate apple fruitlet detection before fruit thinning. Biosystems Engineering 2021, 210, 271–281. [CrossRef]
- Carion, N.; Massa, F.; Synnaeve, G.; Usunier, N.; Kirillov, A.; Zagoruyko, S. End-to-End Object Detection with Transformers, 2020. [CrossRef]
- Zhu, X.; Su, W.; Lu, L.; Li, B.; Wang, X.; Dai, J. Deformable DETR: deformable transformers for end-to-end object detection, 2021. arXiv:2010.04159 [cs], . [CrossRef]
- Zhao, Y.; Lv, W.; Xu, S.; Wei, J.; Wang, G.; Dang, Q.; Liu, Y.; Chen, J. DETRs Beat YOLOs on Real-Time Object Detection, 2023. [CrossRef]
- Lv, W.; Zhao, Y.; Chang, Q.; Huang, K.; Wang, G.; Liu, Y. RT-DETRv2: improved baseline with bag-of-freebies for real-time detection transformer, 2024. arXiv:2407.17140 [cs], . [CrossRef]
- Rao, Y.; Zhao, W.; Liu, B.; Lu, J.; Zhou, J.; Hsieh, C.J. DynamicViT: Efficient Vision Transformers with Dynamic Token Sparsification, 2021. [CrossRef]
- Ryoo, M.S.; Piergiovanni, A.J.; Arnab, A.; Dehghani, M.; Angelova, A. TokenLearner: What Can 8 Learned Tokens Do for Images and Videos?, 2021. [CrossRef]
- Liang, Y.; Ge, C.; Tong, Z.; Song, Y.; Wang, J.; Xie, P. Not All Patches Are What You Need: Expediting Vision Transformers via Token Reorganizations, 2022. [CrossRef]
- Zhang, R. Making Convolutional Networks Shift-Invariant Again, 2019. [CrossRef]
- Wang, Q.; Wu, B.; Zhu, P.; Li, P.; Zuo, W.; Hu, Q. ECA-net: efficient channel attention for deep convolutional neural networks. In Proceedings of the 2020 IEEE/CVF Conference on Computer Vision and Pattern Recognition (CVPR), Seattle, WA, USA, June 2020; pp. 11531–11539. [CrossRef]
- Yu, F.; Koltun, V. Multi-Scale Context Aggregation by Dilated Convolutions, 2015. [CrossRef]
- Lin, T.Y.; Dollár, P.; Girshick, R.; He, K.; Hariharan, B.; Belongie, S. Feature Pyramid Networks for Object Detection, 2016. [CrossRef]
- Tan, M.; Pang, R.; Le, Q.V. EfficientDet: Scalable and Efficient Object Detection, 2019. [CrossRef]
- Ding, X.; Zhang, X.; Ma, N.; Han, J.; Ding, G.; Sun, J. RepVGG: Making VGG-Style ConvNets Great Again, 2021. [CrossRef]
- Lin, T.Y.; Goyal, P.; Girshick, R.; He, K.; Dollár, P. Focal Loss for Dense Object Detection, 2017. [CrossRef]
- Zhang, H.; Wang, Y.; Dayoub, F.; Sünderhauf, N. VarifocalNet: An IoU-Aware Dense Object Detector, 2020. [CrossRef]
- Li, X.; Wang, W.; Wu, L.; Chen, S.; Hu, X.; Li, J.; Tang, J.; Yang, J. Generalized Focal Loss: Learning Qualified and Distributed Bounding Boxes for Dense Object Detection. In Proceedings of the Advances in Neural Information Processing Systems, 2020, pp. 21002–21012.
- Hu, J.; Shen, L.; Sun, G. Squeeze-and-Excitation Networks. In Proceedings of the IEEE Conference on Computer Vision and Pattern Recognition (CVPR), 2018, pp. 7132–7141. [CrossRef]
- Woo, S.; Park, J.; Lee, J.Y.; Kweon, I.S. CBAM: convolutional block attention module. In Computer vision–ECCV 2018; Ferrari, V.; Hebert, M.; Sminchisescu, C.; Weiss, Y., Eds.; Springer International Publishing: Cham, 2018; Vol. 11211, pp. 3–19. Series Title: Lecture Notes in Computer Science, . [CrossRef]
- Lyu, C.; Zhang, W.; Huang, H.; Zhou, Y.; Wang, Y.; Liu, Y.; Zhang, S.; Chen, K. RTMDet: an empirical study of designing real-time object detectors, 2022. arXiv:2212.07784 [cs], . [CrossRef]
- Ren, S.; He, K.; Girshick, R.; Sun, J. Faster R-CNN: towards real-time object detection with region proposal networks, 2016. arXiv:1506.01497 [cs], . [CrossRef]
Figure 1.
Representative images of multi-object and single-object samples in the dataset.
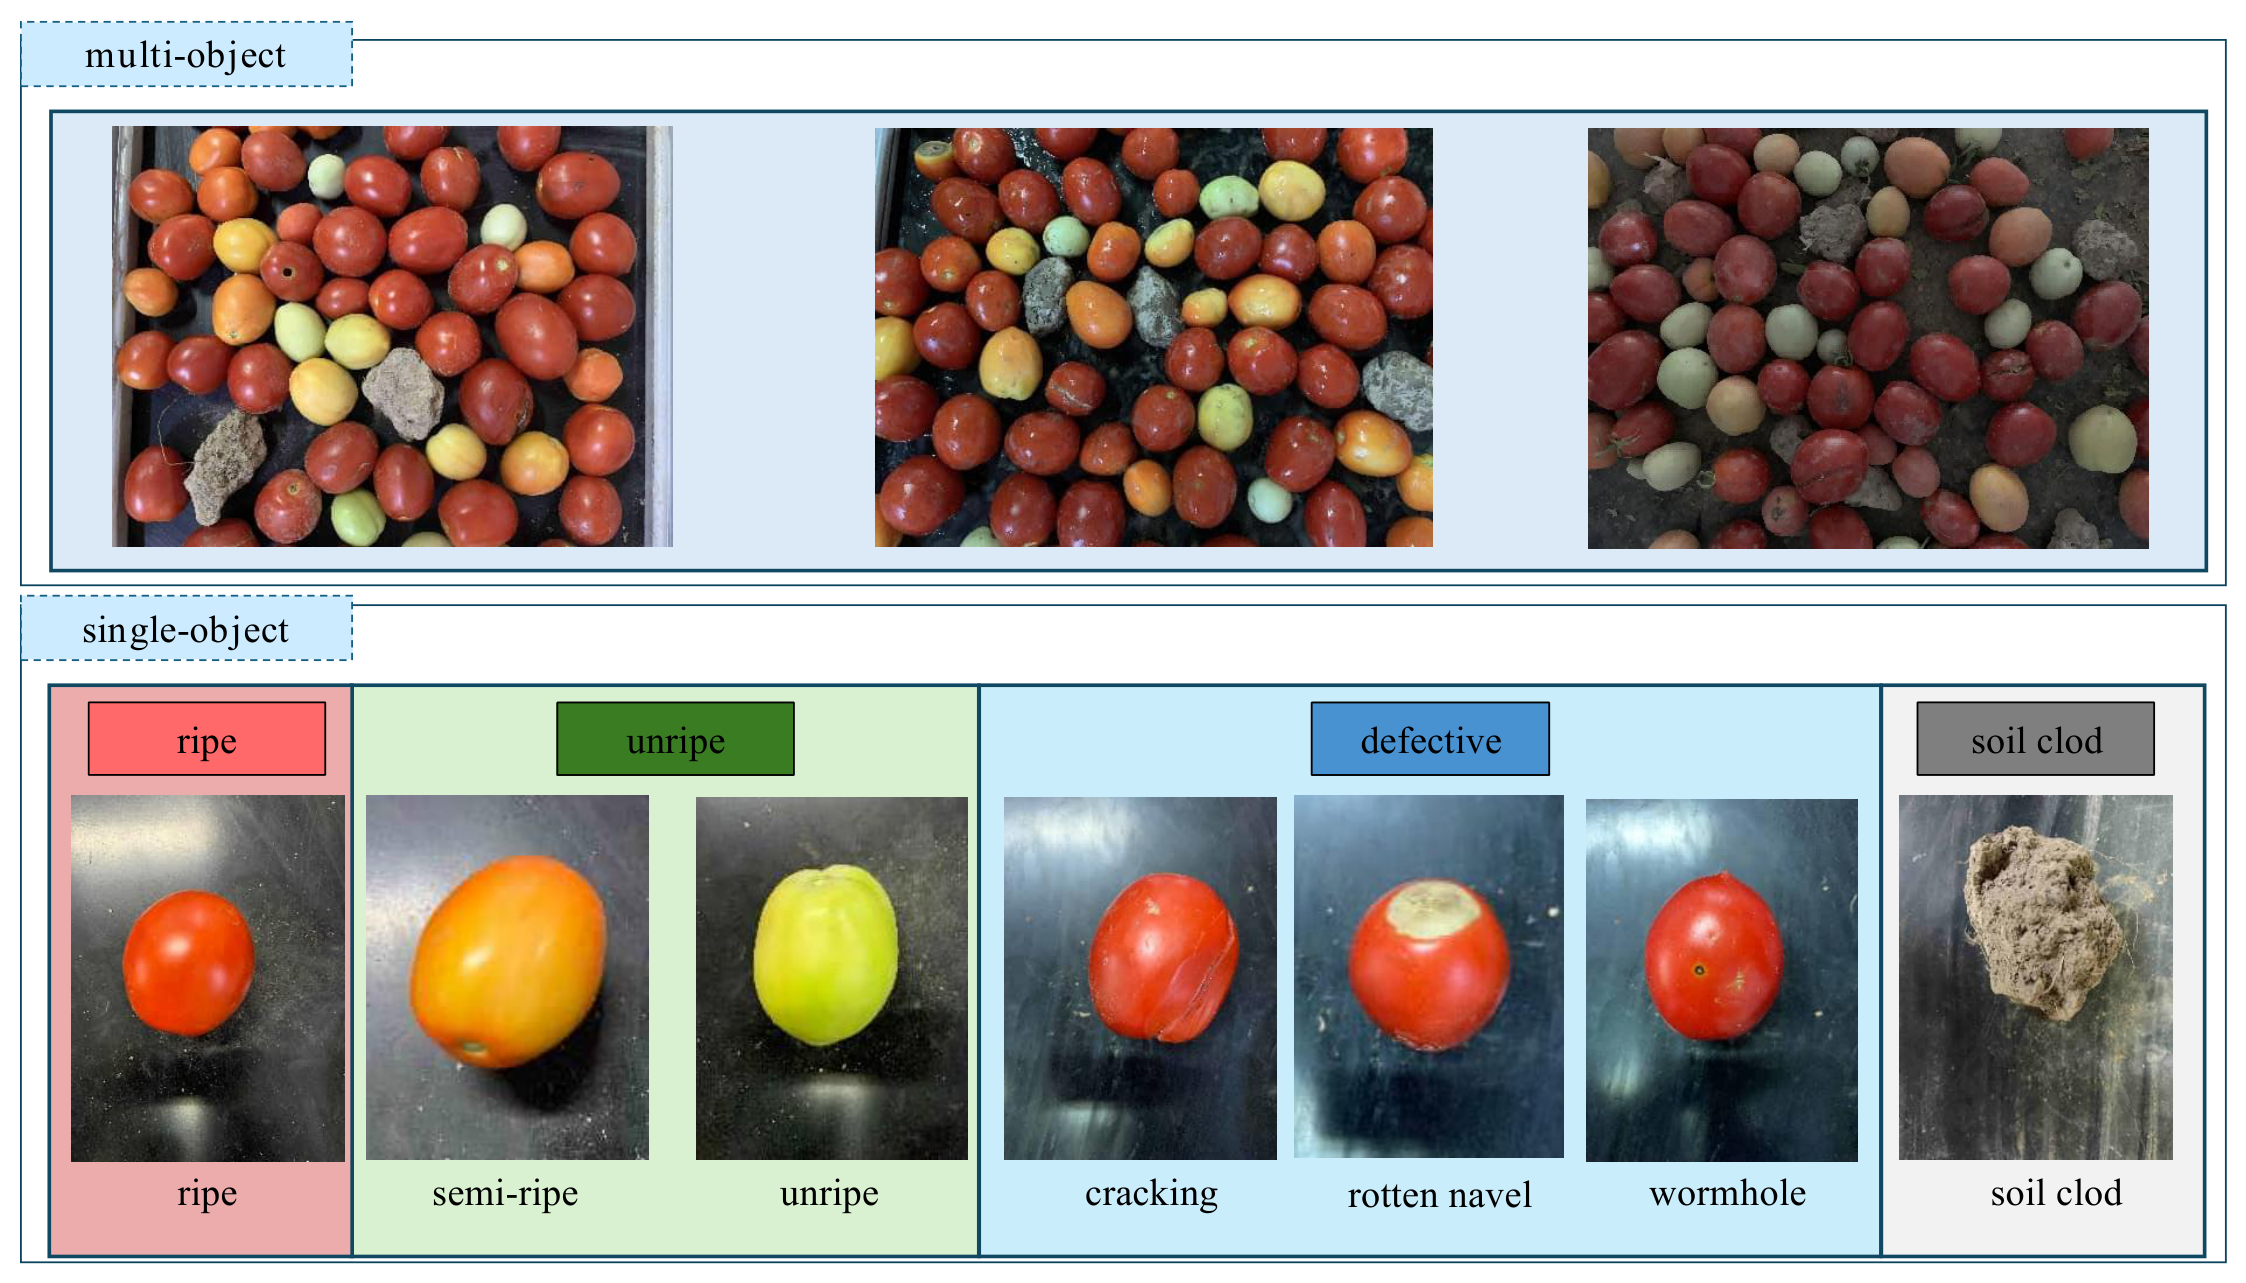
Figure 2.
Schematic diagram of image collection.
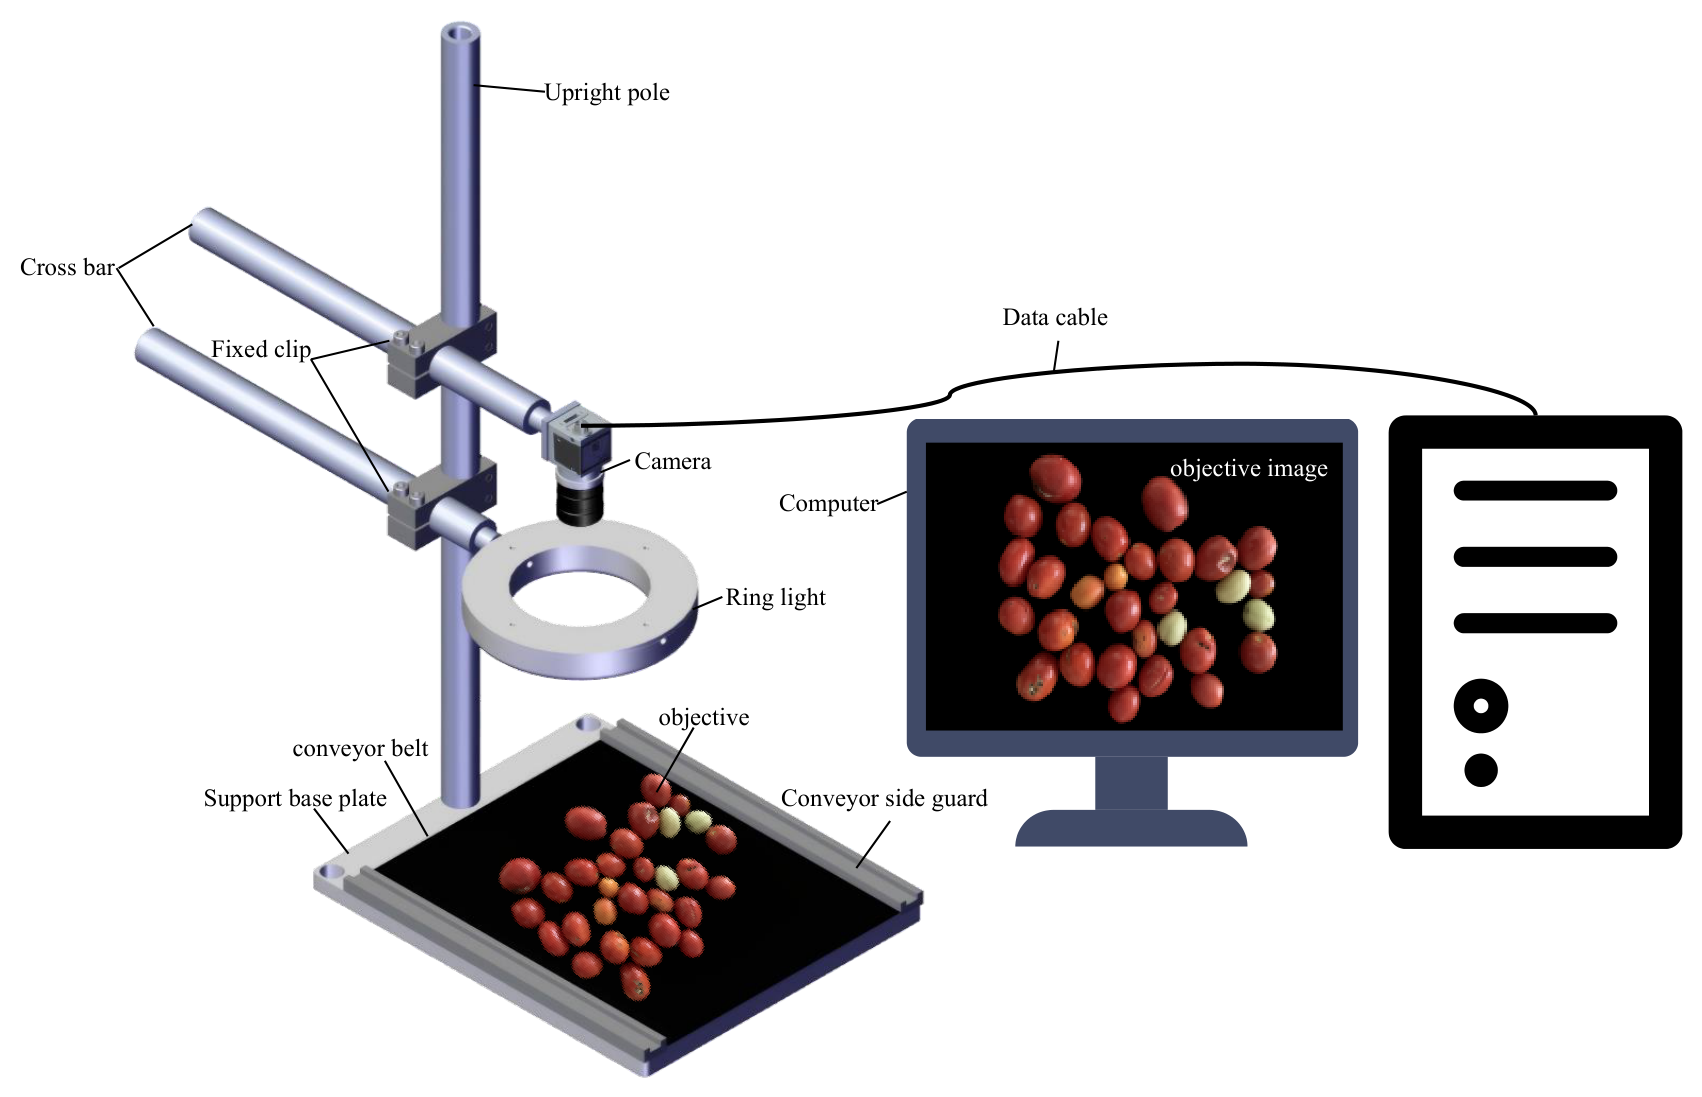
Figure 3.
Examples of data augmentation applied to single-object samples. (a) Original image. (b) Brightness adjustment. (c) Contrast adjustment. (d) Translation. (e) Rotation.
Figure 3.
Examples of data augmentation applied to single-object samples. (a) Original image. (b) Brightness adjustment. (c) Contrast adjustment. (d) Translation. (e) Rotation.
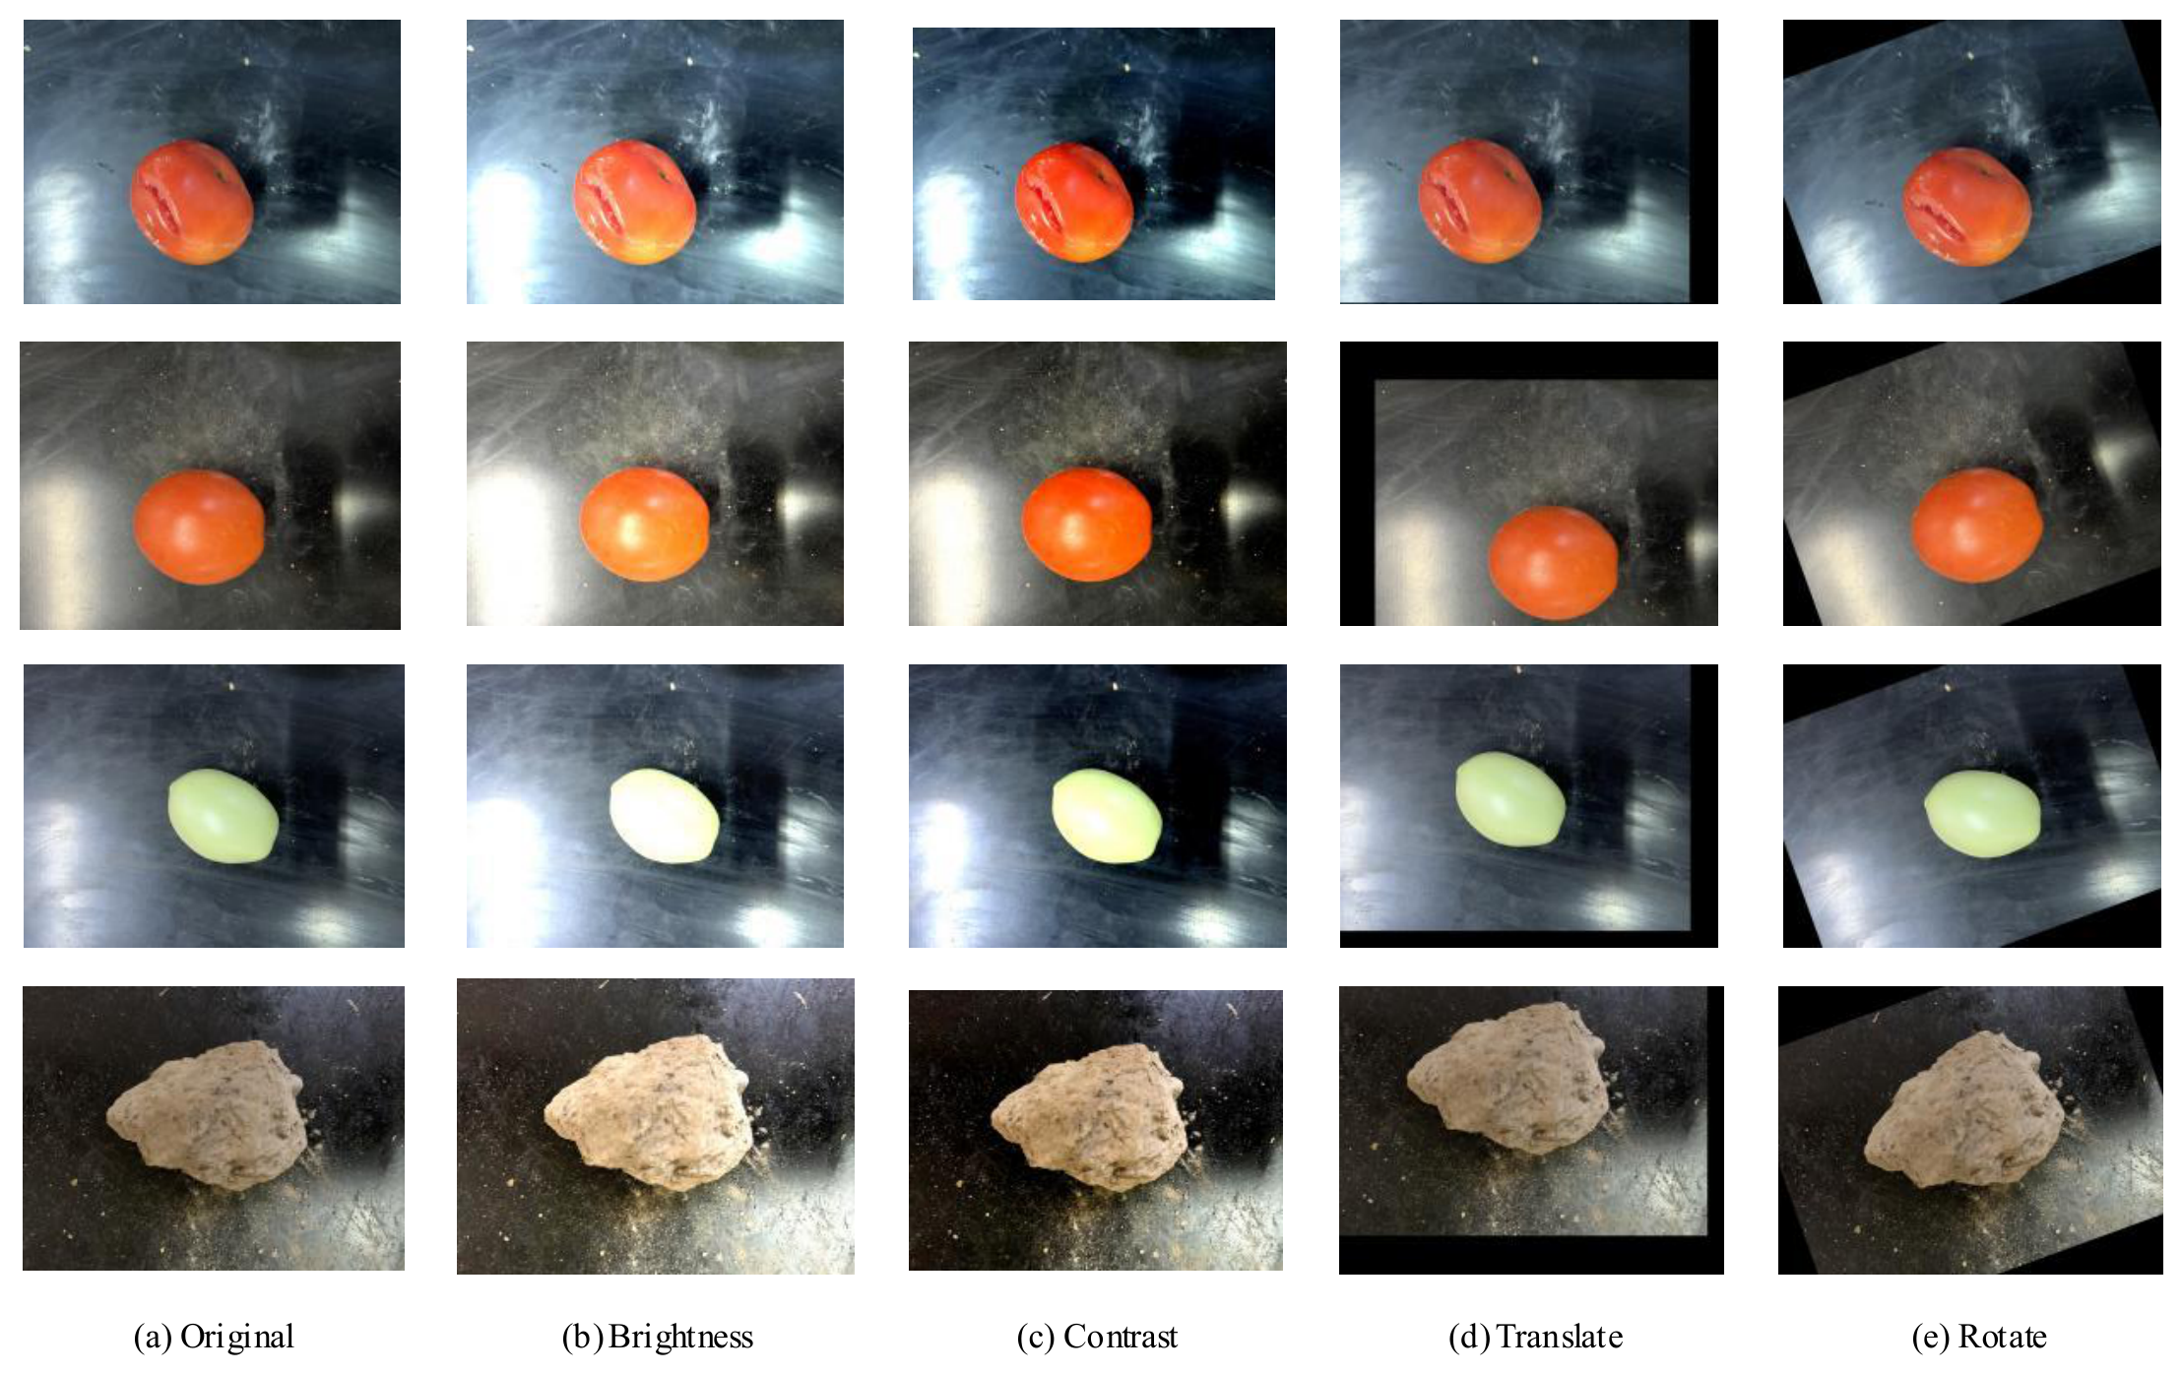
Figure 4.
Overall architecture of the proposed SG-RTDETR.
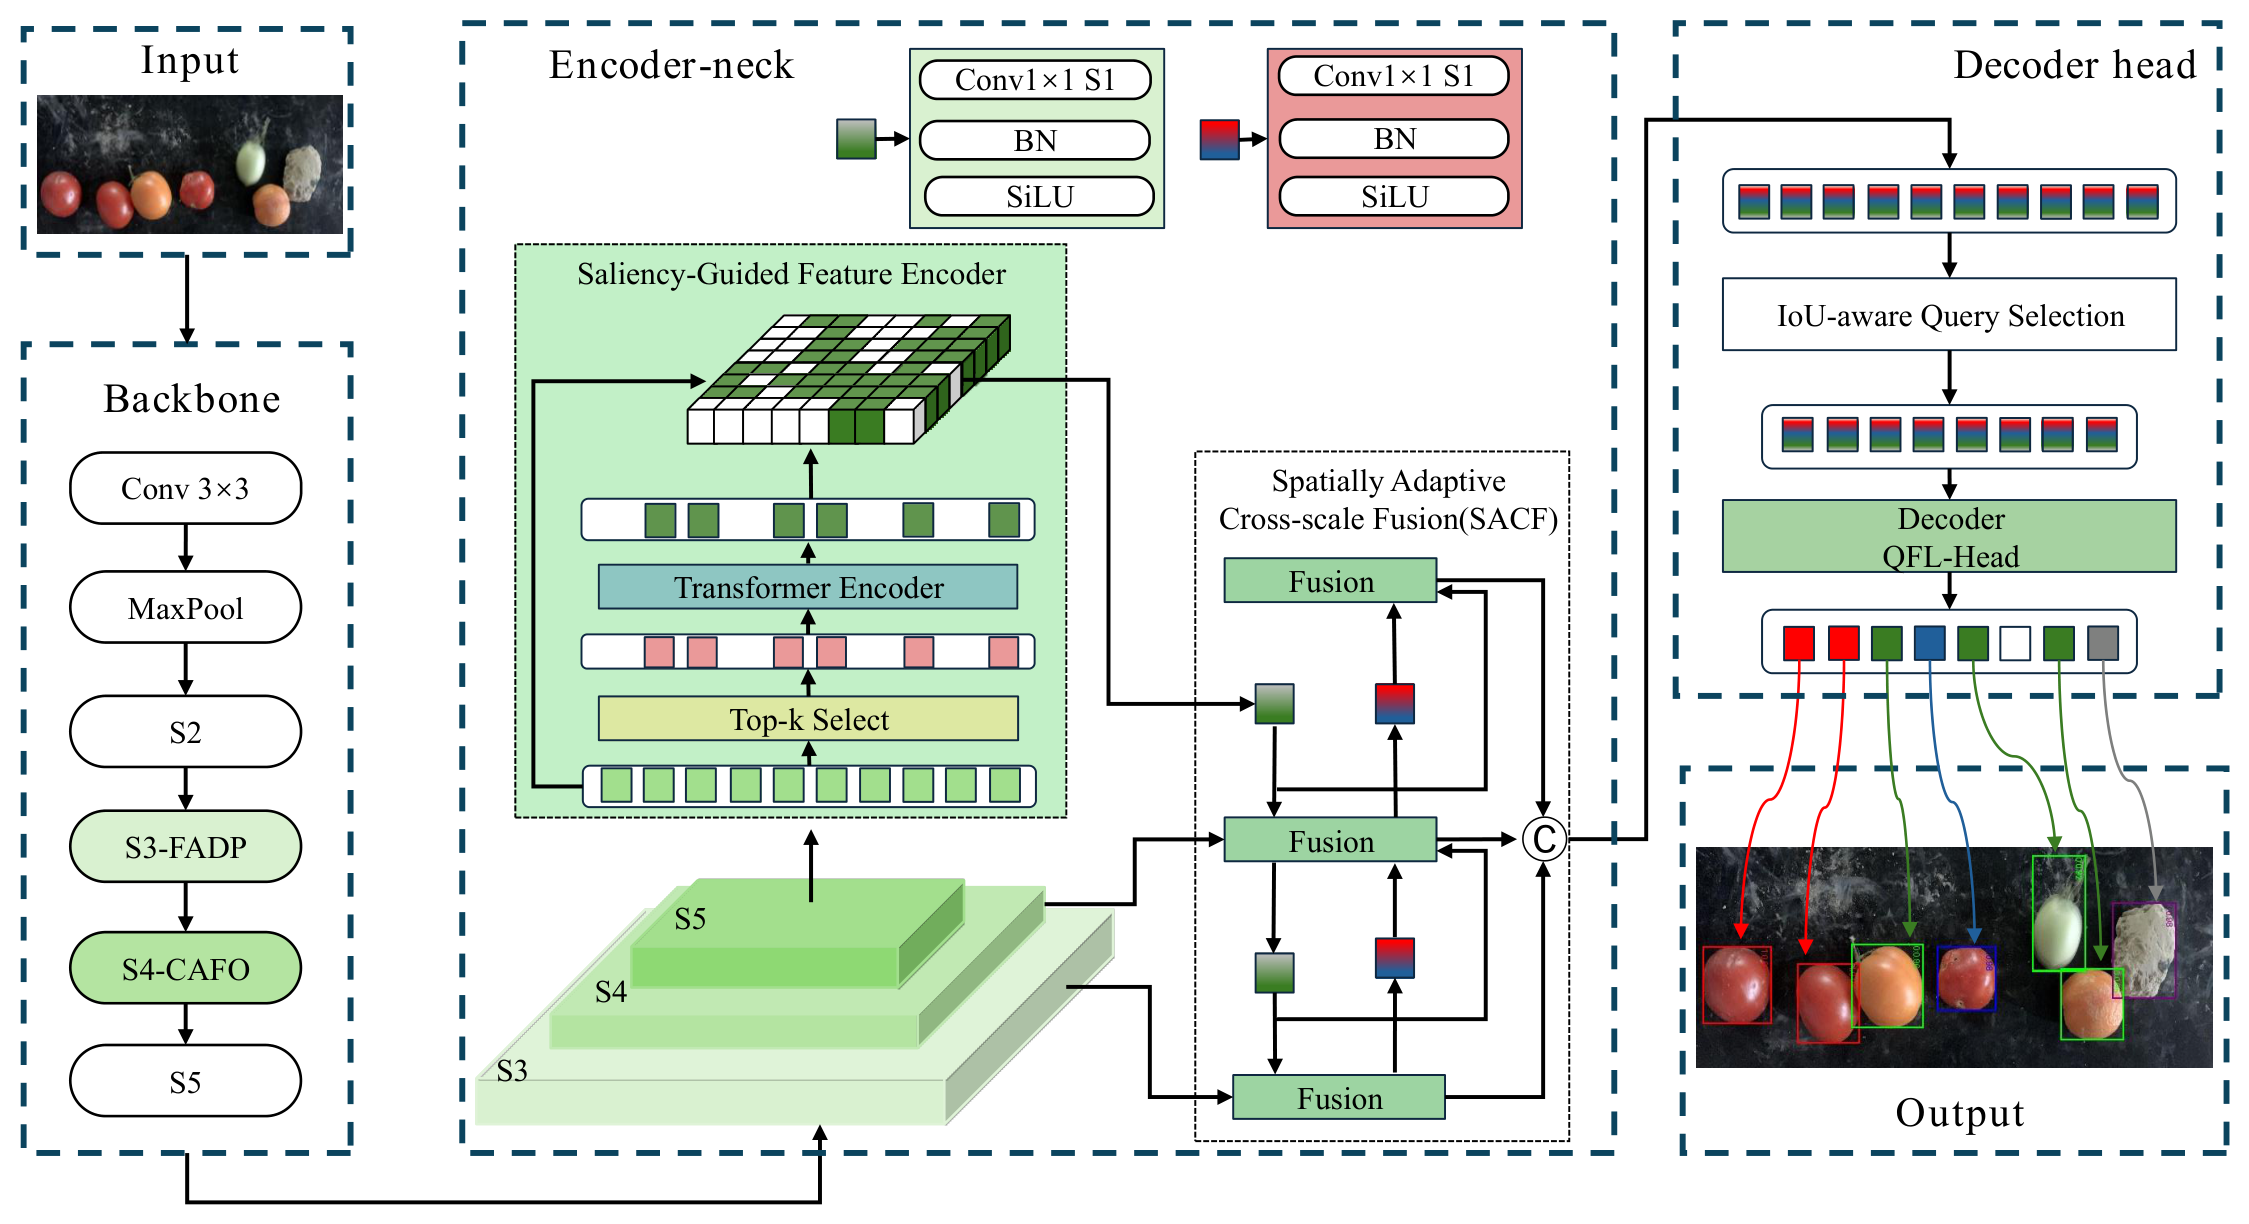
Figure 5.
Saliency-guided feature encoder with selective token modeling and residual spatial refill.
Figure 5.
Saliency-guided feature encoder with selective token modeling and residual spatial refill.
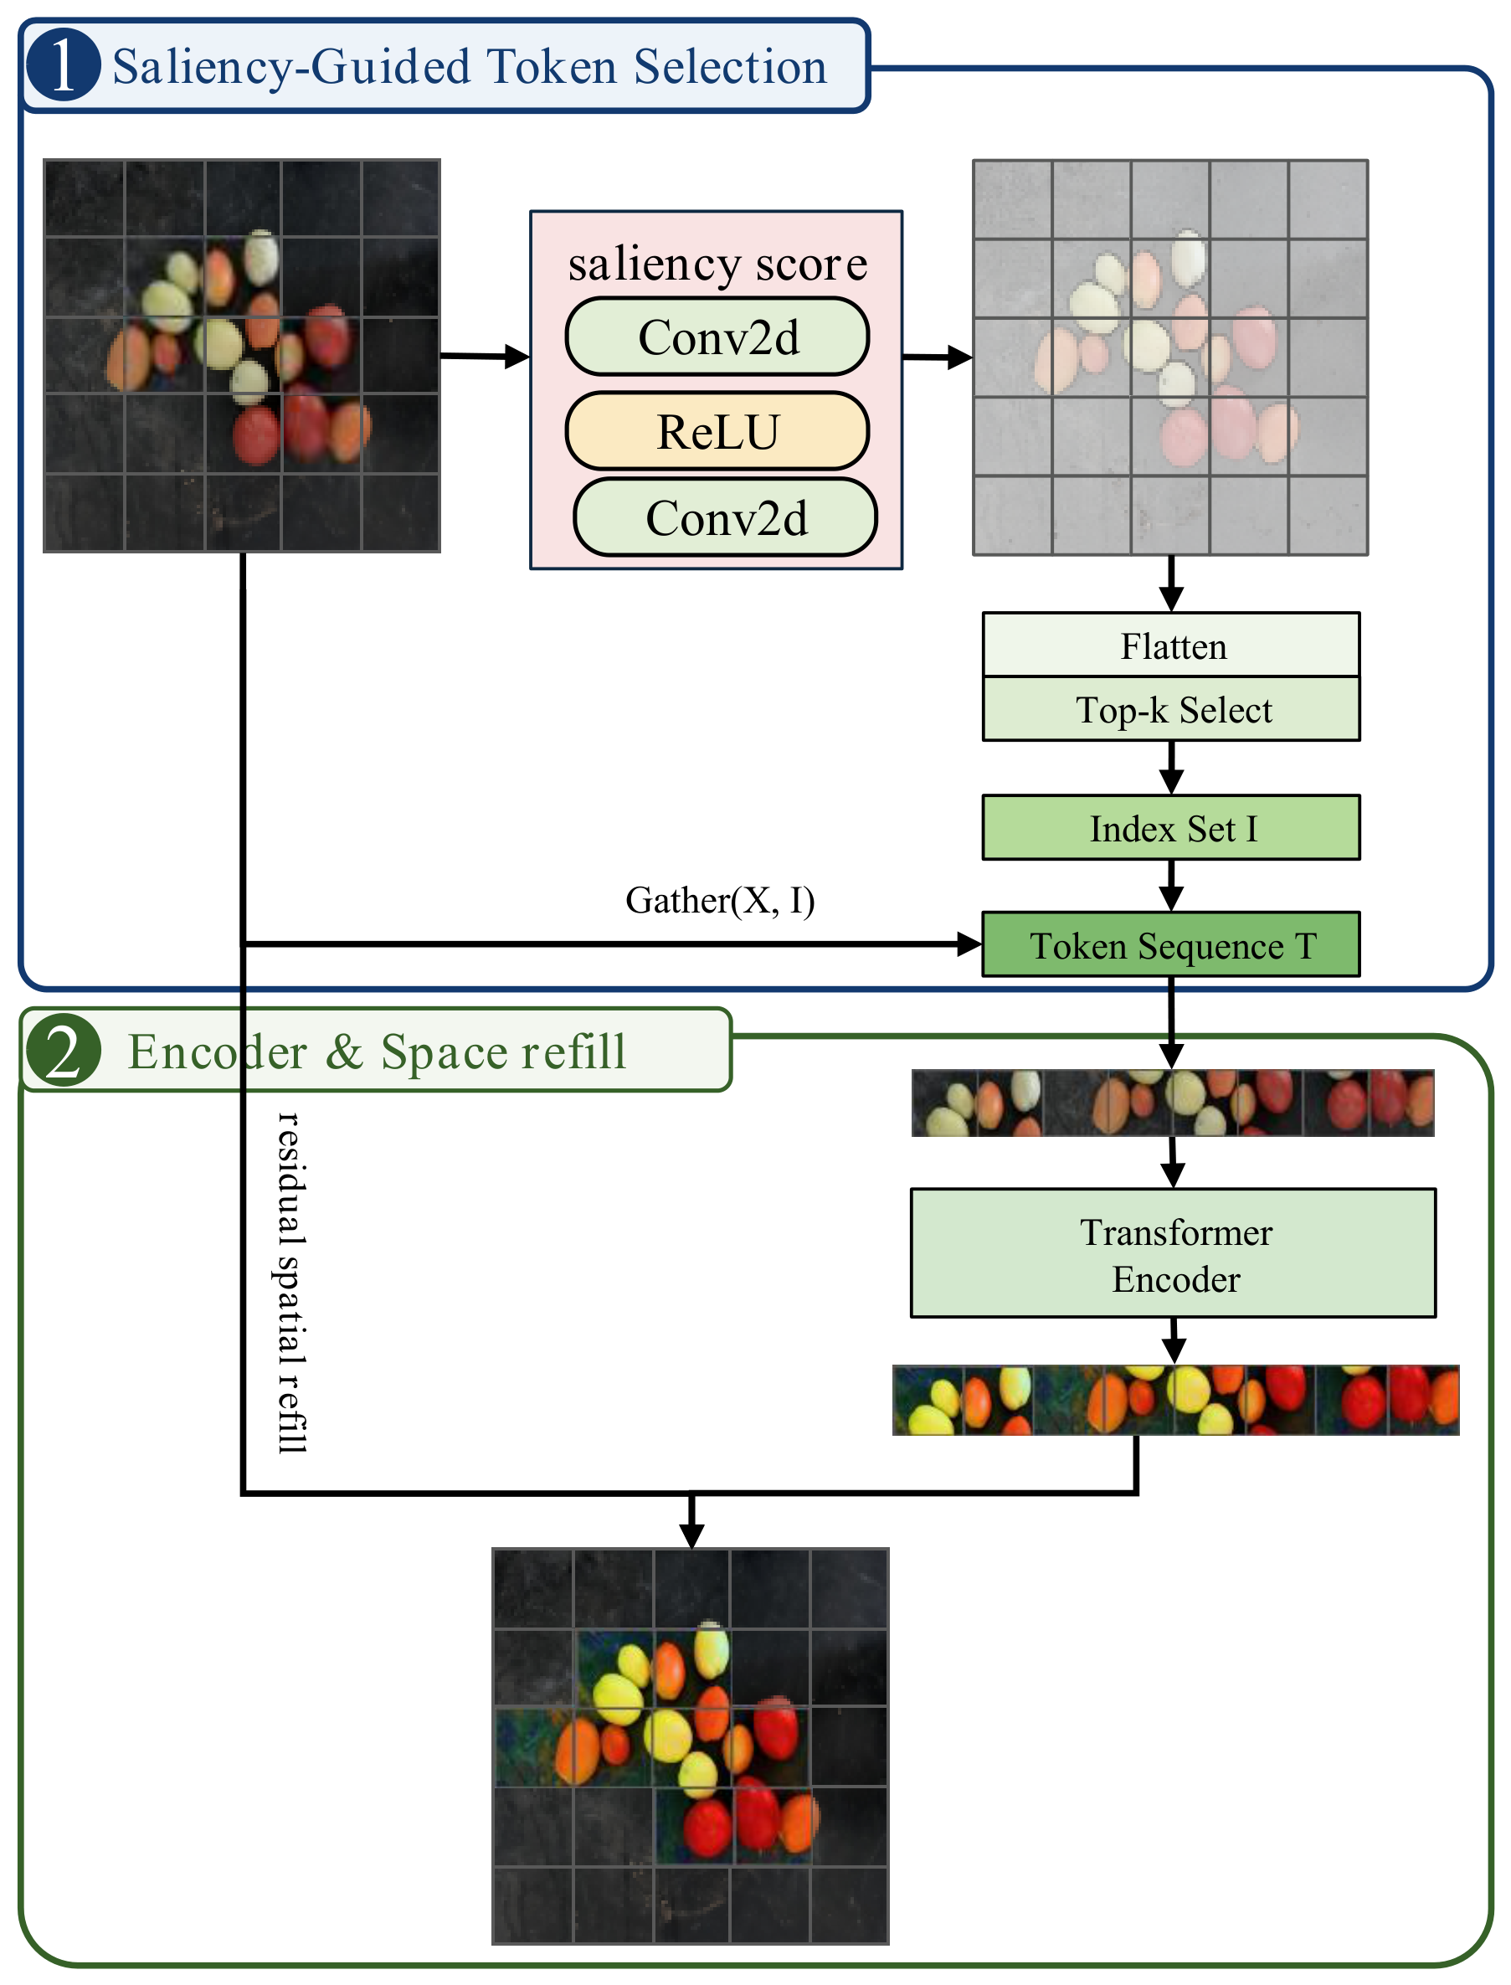
Figure 6.
Frequency-aware Detail Preservation design at the high-resolution stage.
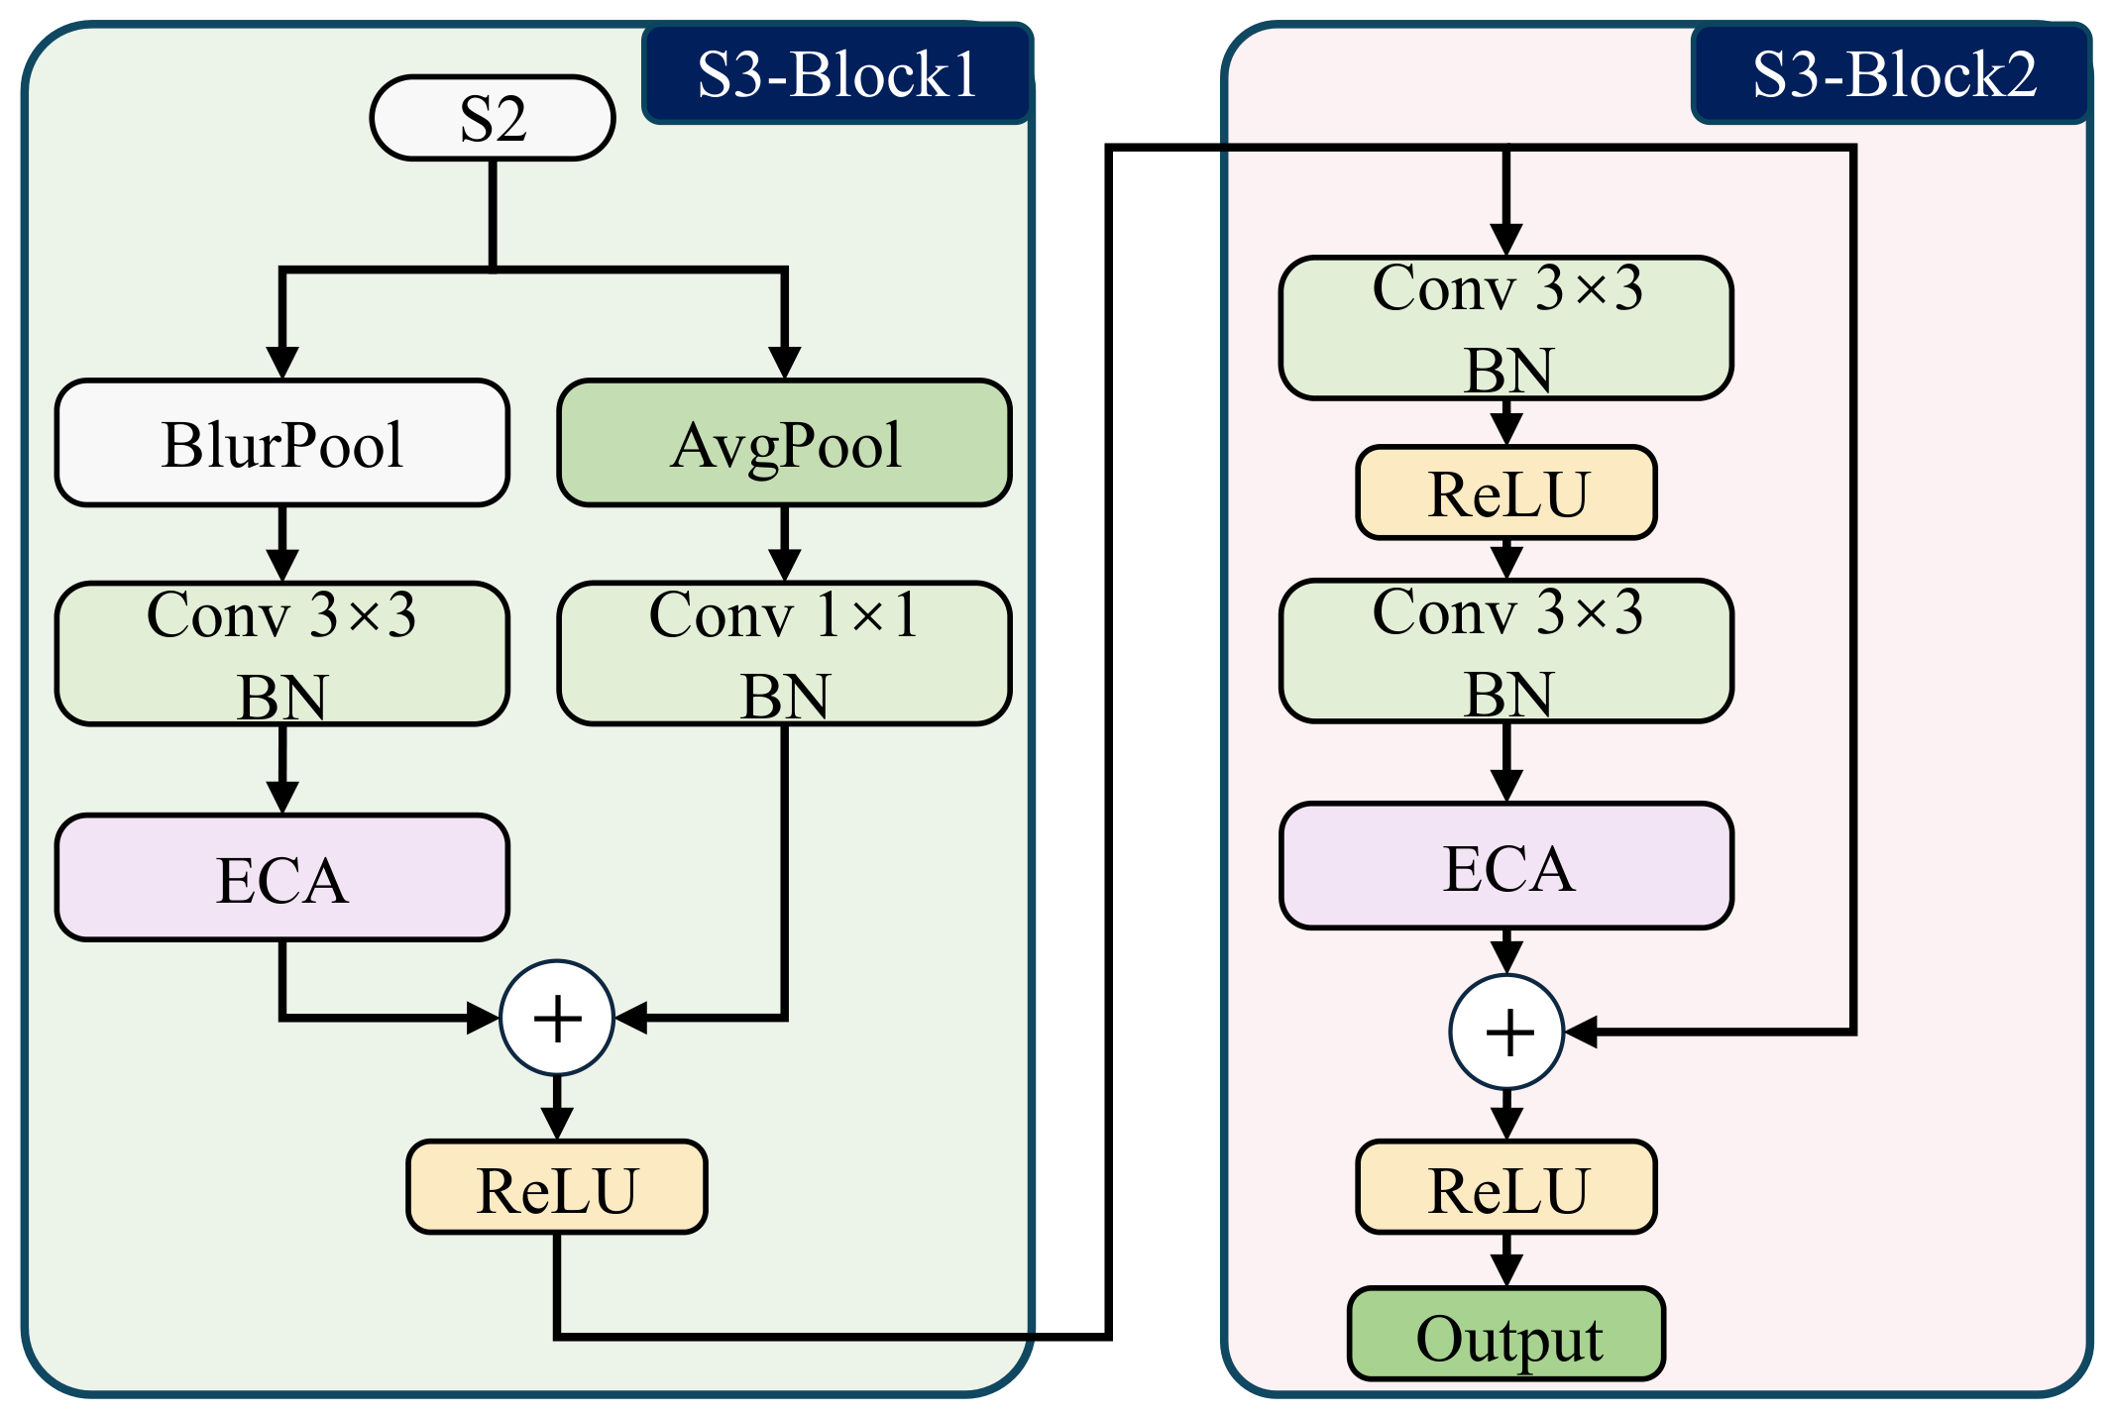
Figure 7.
Illustration of the Efficient Channel Attention (ECA) mechanism.
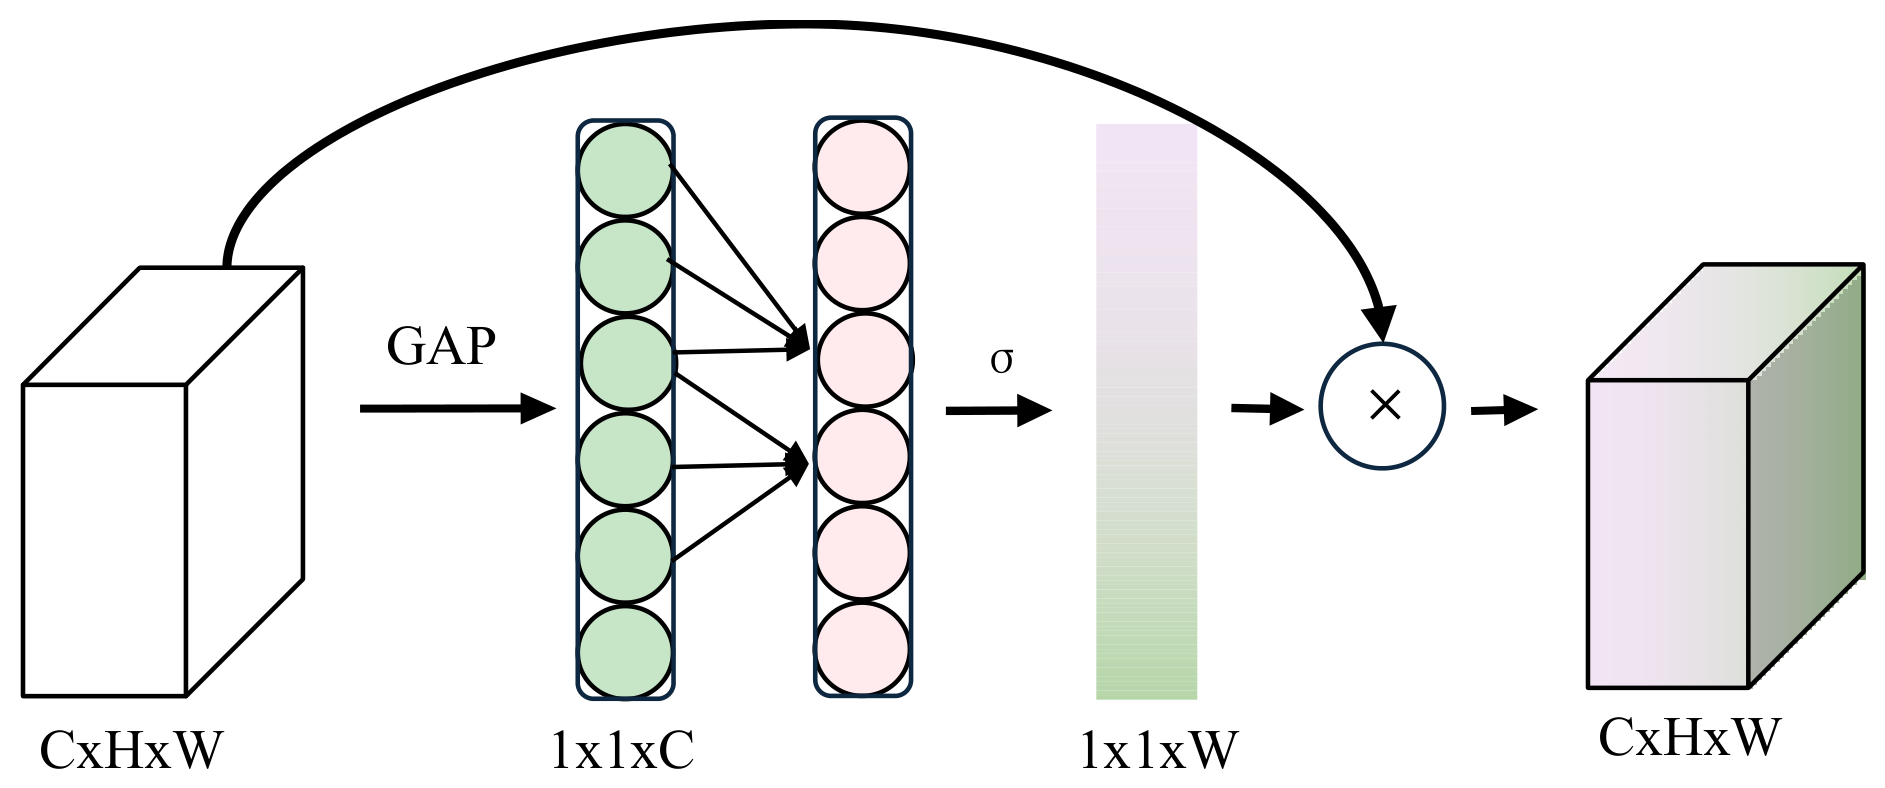
Figure 8.
Context-aware Feature Organization at the S4 stage.
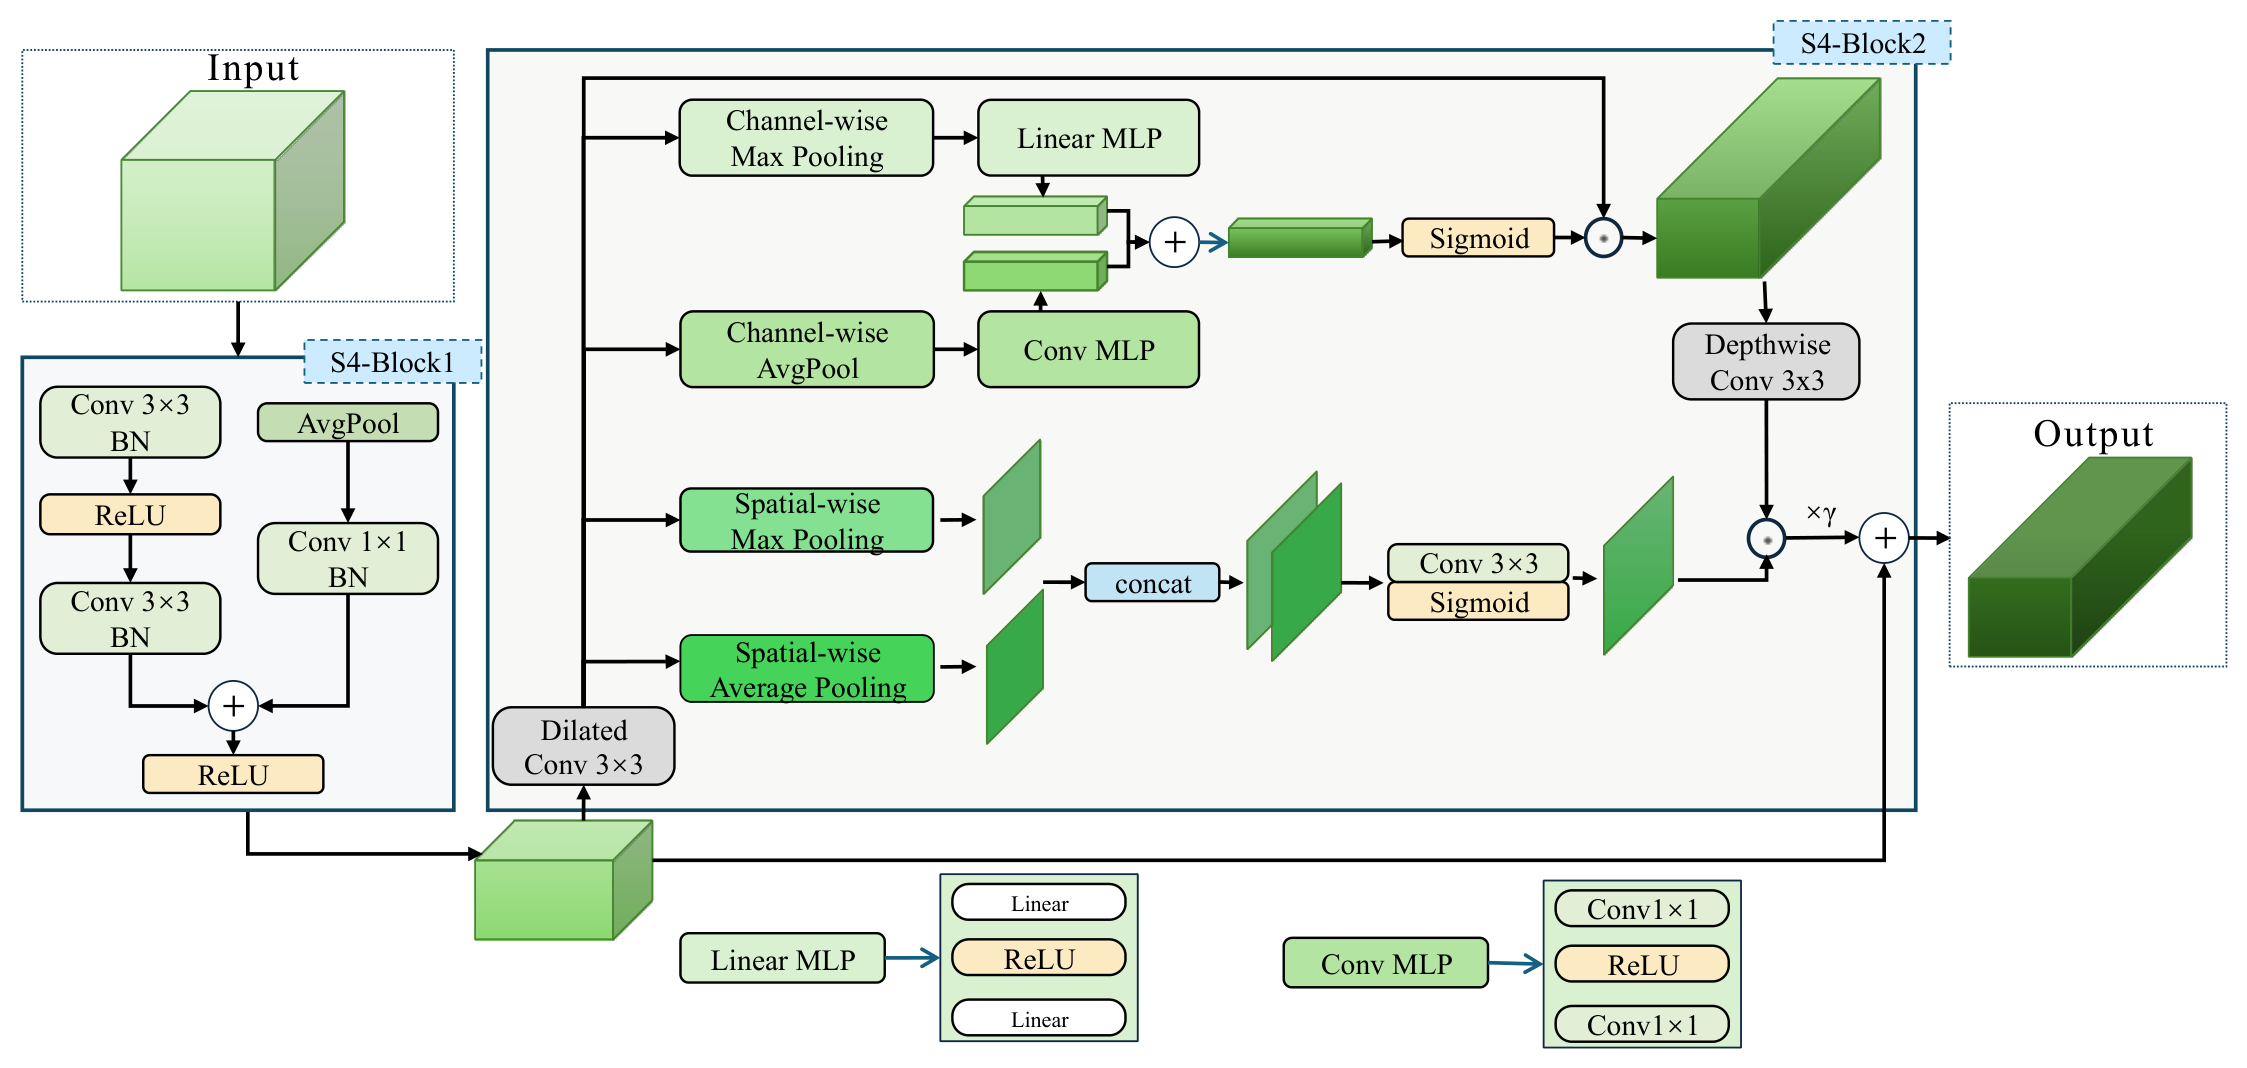
Figure 9.
Spatially Adaptive Cross-scale Fusion design in CSPRepLayer.
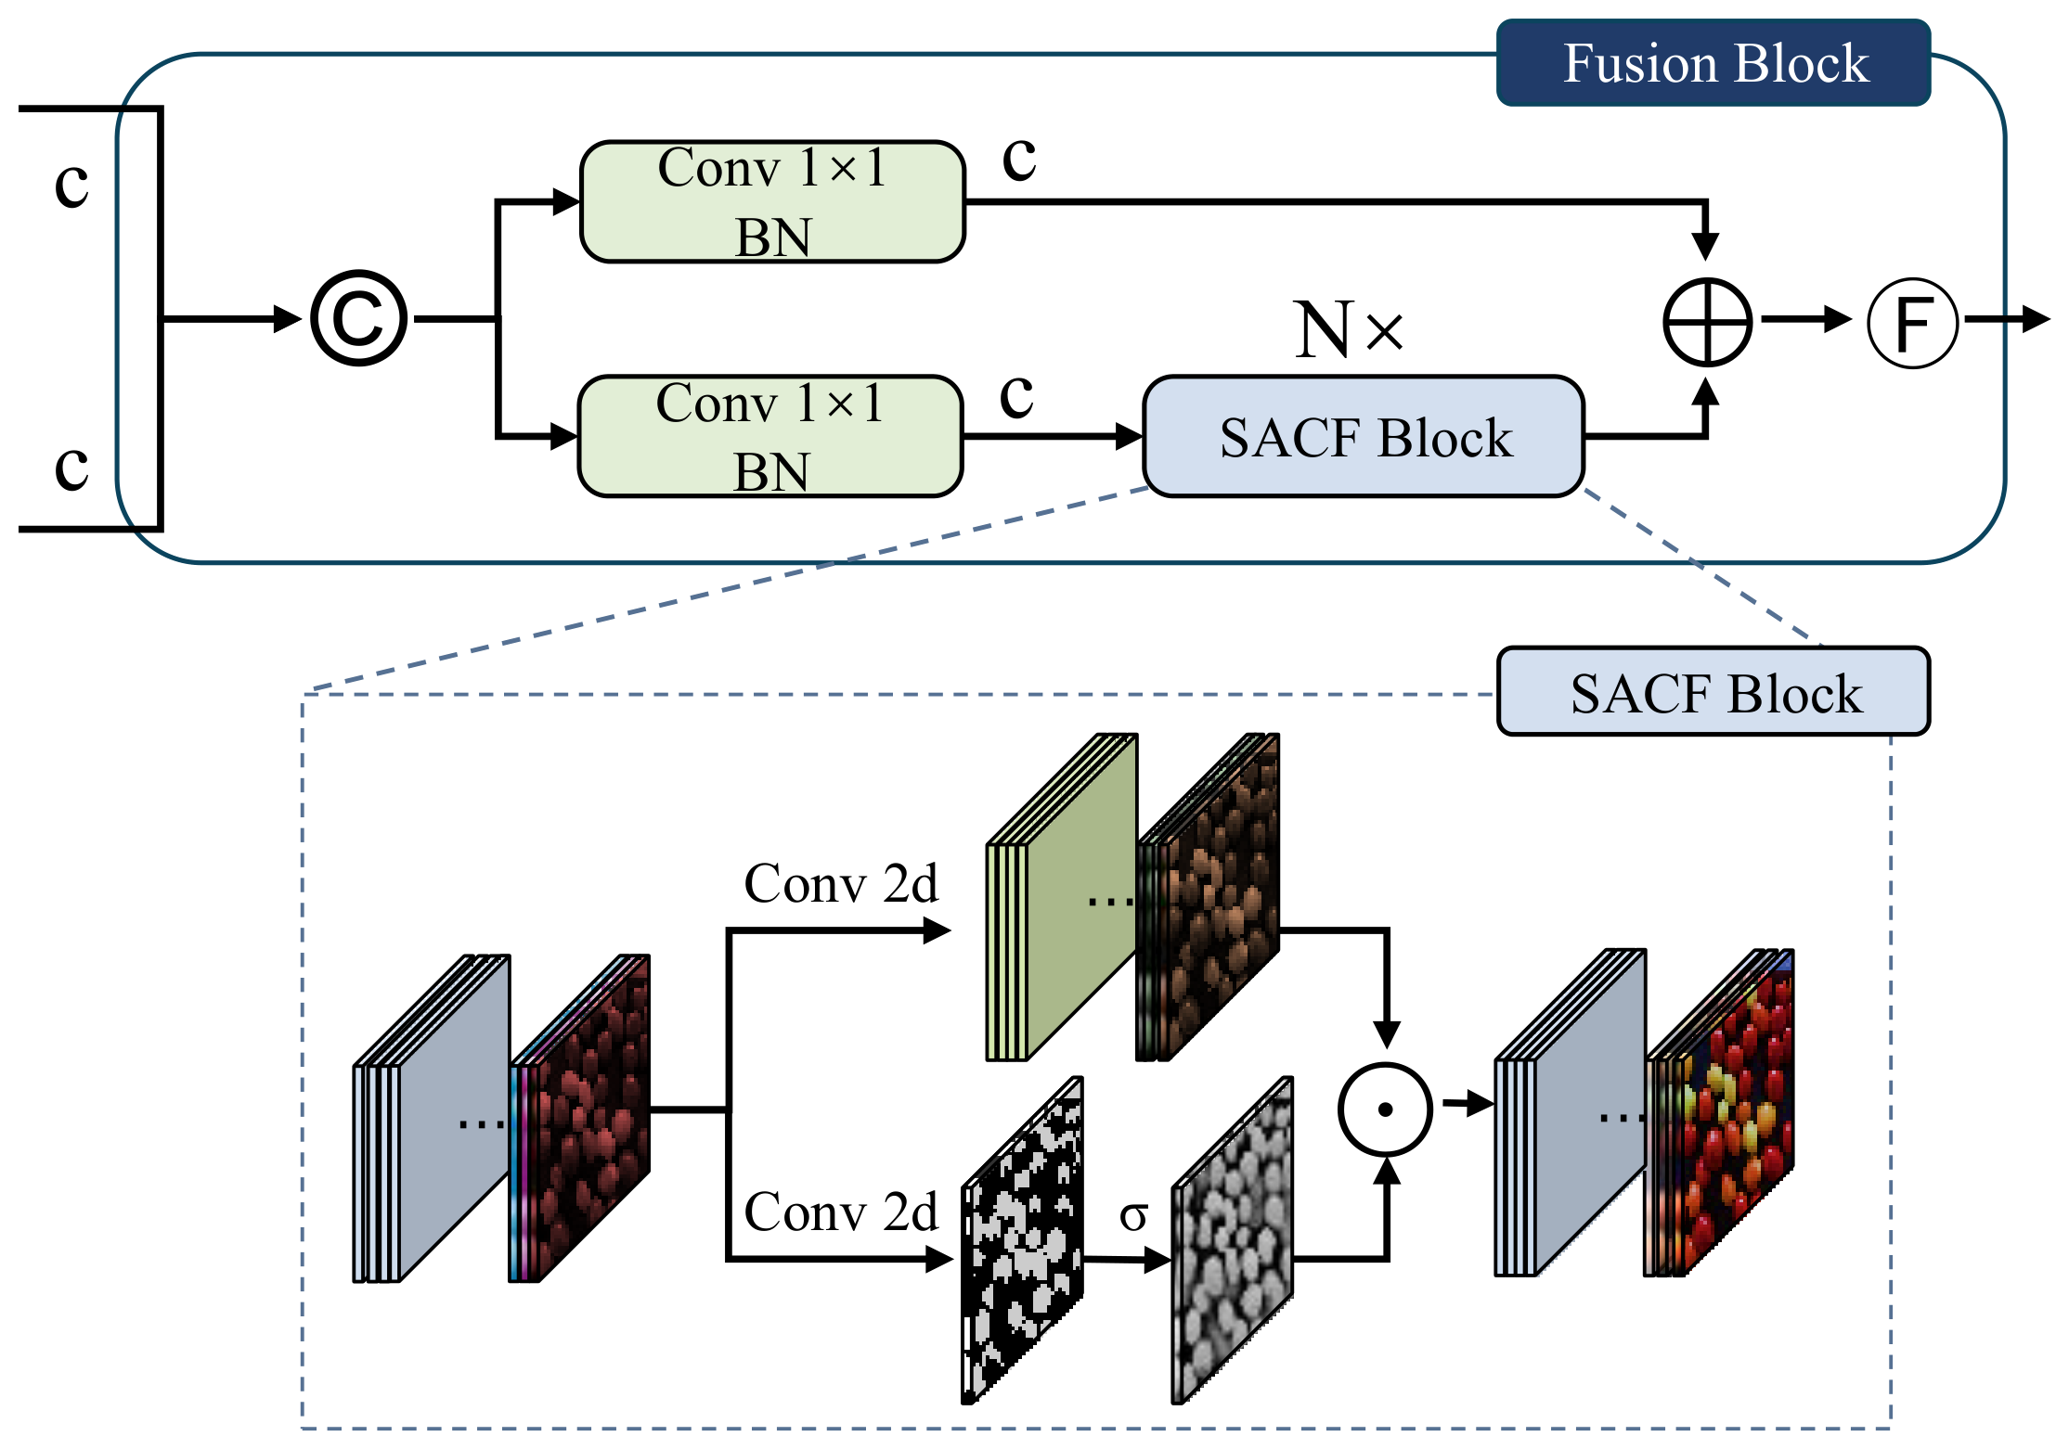
Figure 10.
Detection performance under different single-object sample introduction and augmentation strategies. (a) Overall and results. (b) Class-wise results for ripe tomatoes, unripe tomatoes, defective tomatoes, and soil clods.
Figure 10.
Detection performance under different single-object sample introduction and augmentation strategies. (a) Overall and results. (b) Class-wise results for ripe tomatoes, unripe tomatoes, defective tomatoes, and soil clods.
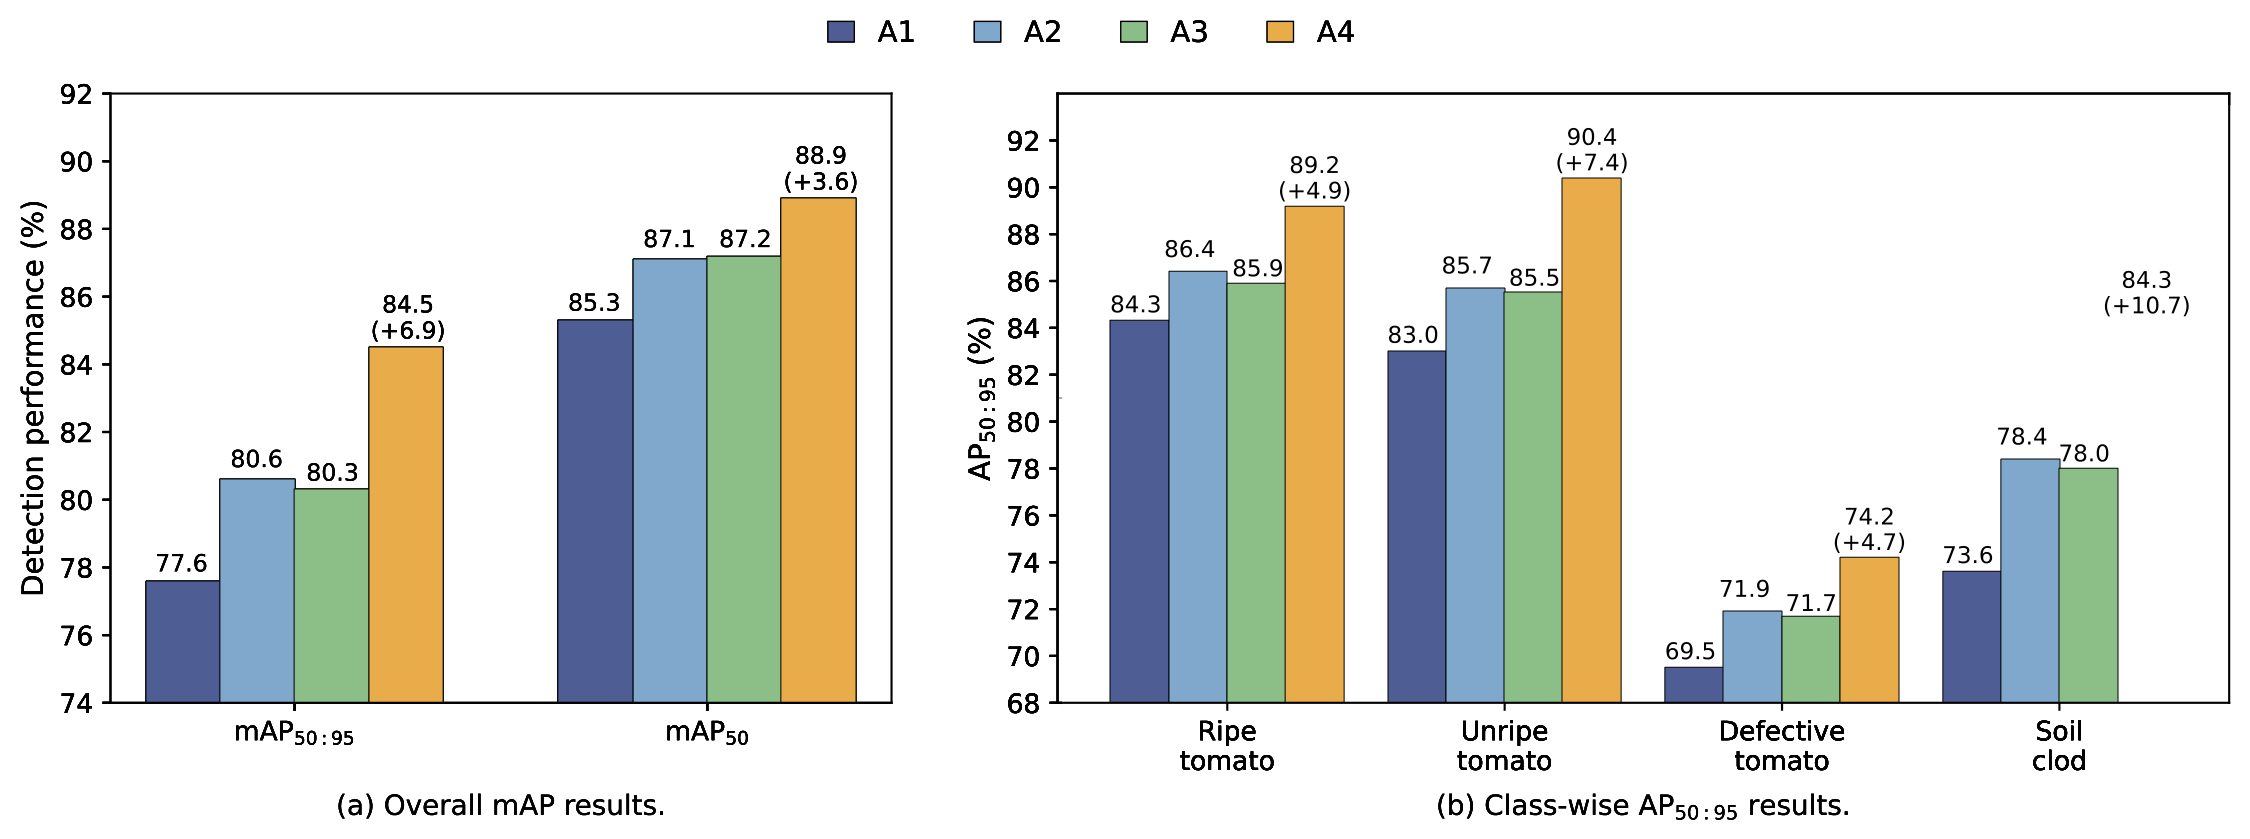
Figure 11.
Training performance comparison of RT-DETRv2 and SG-RTDETR. (a) during training. (b) during training. (c) during training. (d) Precision-recall curves on the test set. (e) Overall training loss during training. (f) Bounding-box regression loss during training.
Figure 11.
Training performance comparison of RT-DETRv2 and SG-RTDETR. (a) during training. (b) during training. (c) during training. (d) Precision-recall curves on the test set. (e) Overall training loss during training. (f) Bounding-box regression loss during training.
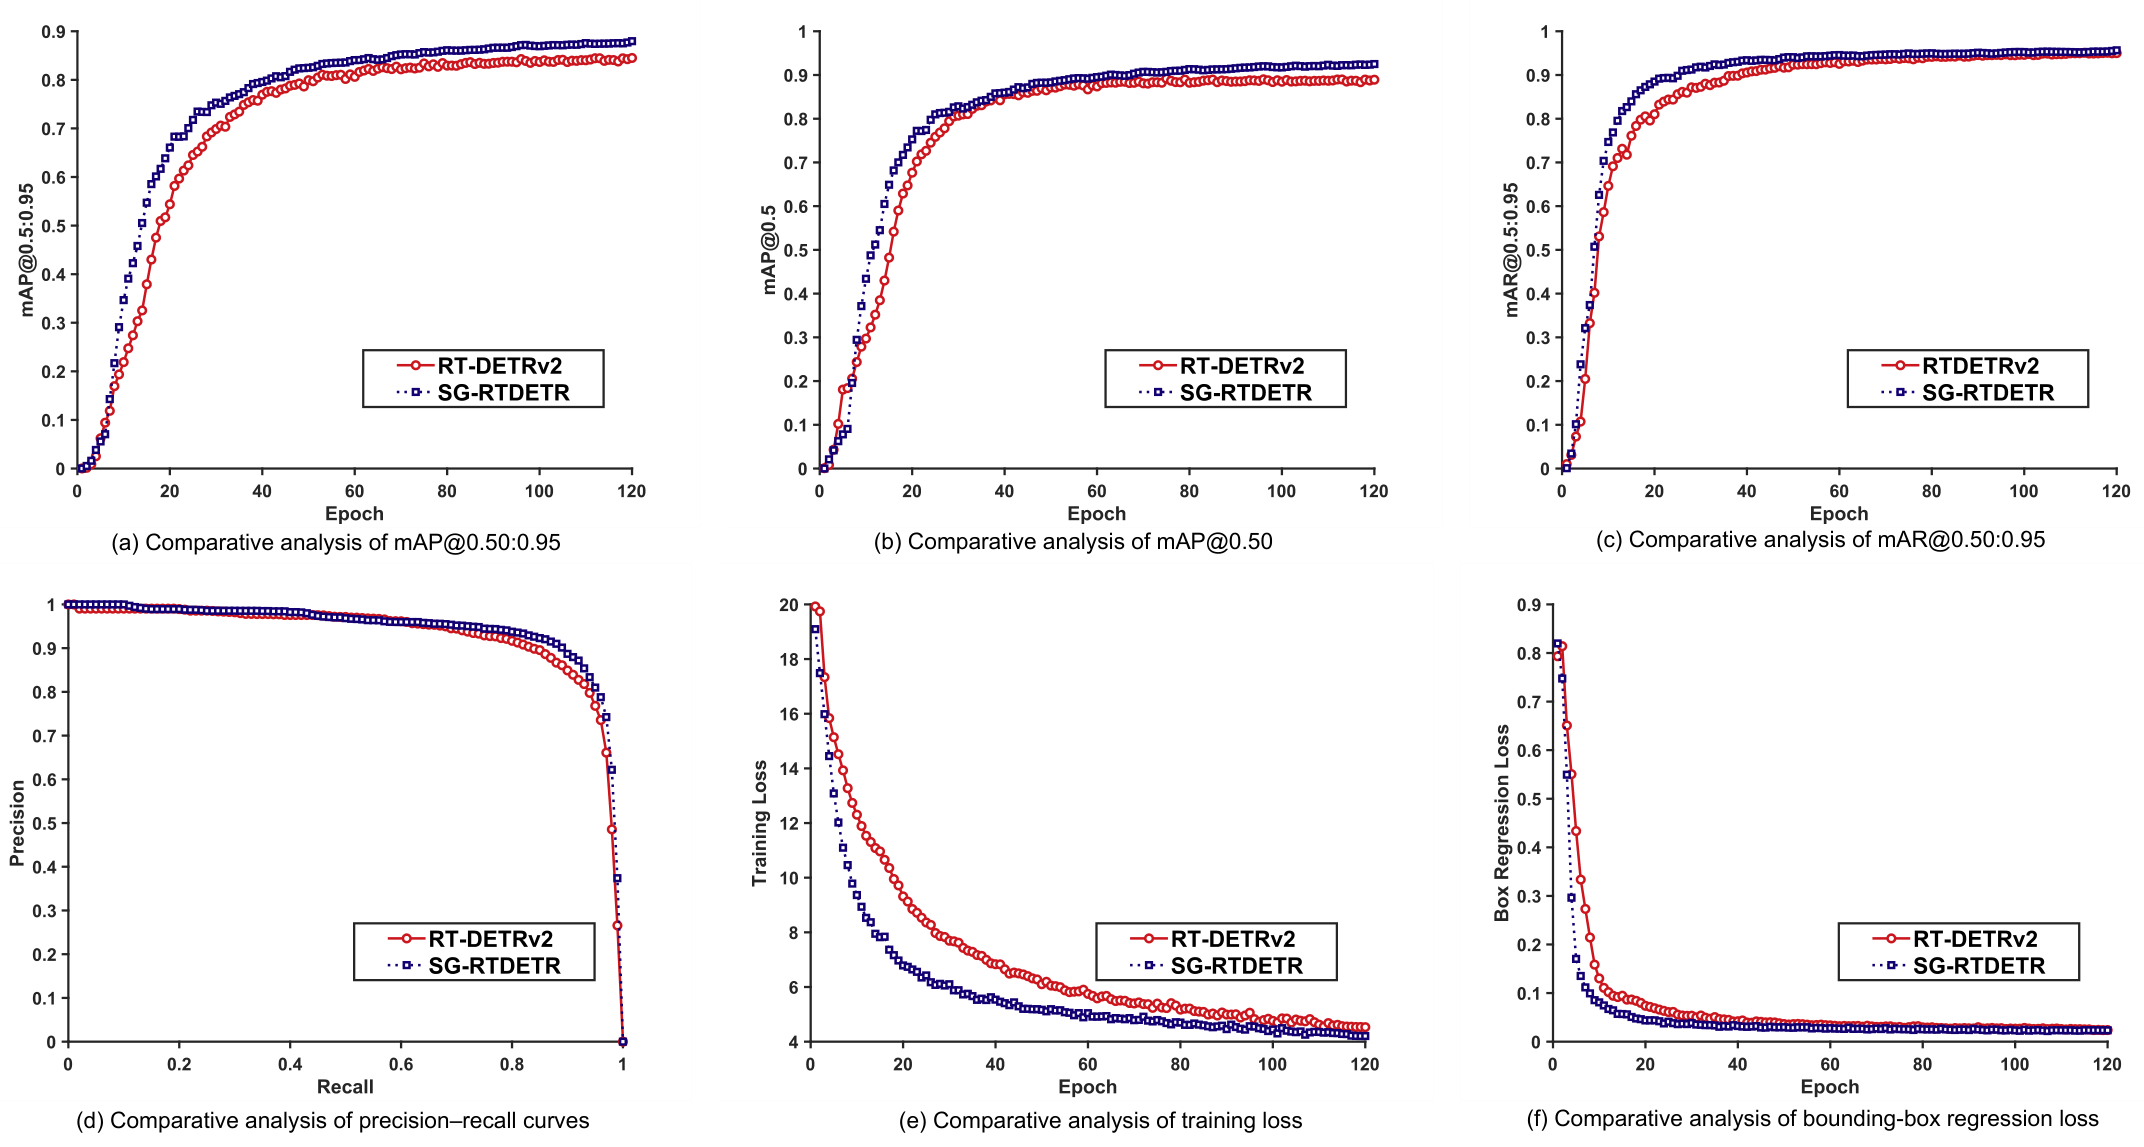
Figure 12.
Sensitivity analysis of SGFE with respect to token retention ratio. (a) . (b) . (c) FLOPs. (d) FPS. The dashed vertical line marks the selected ratio of 60%, which provides the best while maintaining real-time inference efficiency.
Figure 12.
Sensitivity analysis of SGFE with respect to token retention ratio. (a) . (b) . (c) FLOPs. (d) FPS. The dashed vertical line marks the selected ratio of 60%, which provides the best while maintaining real-time inference efficiency.
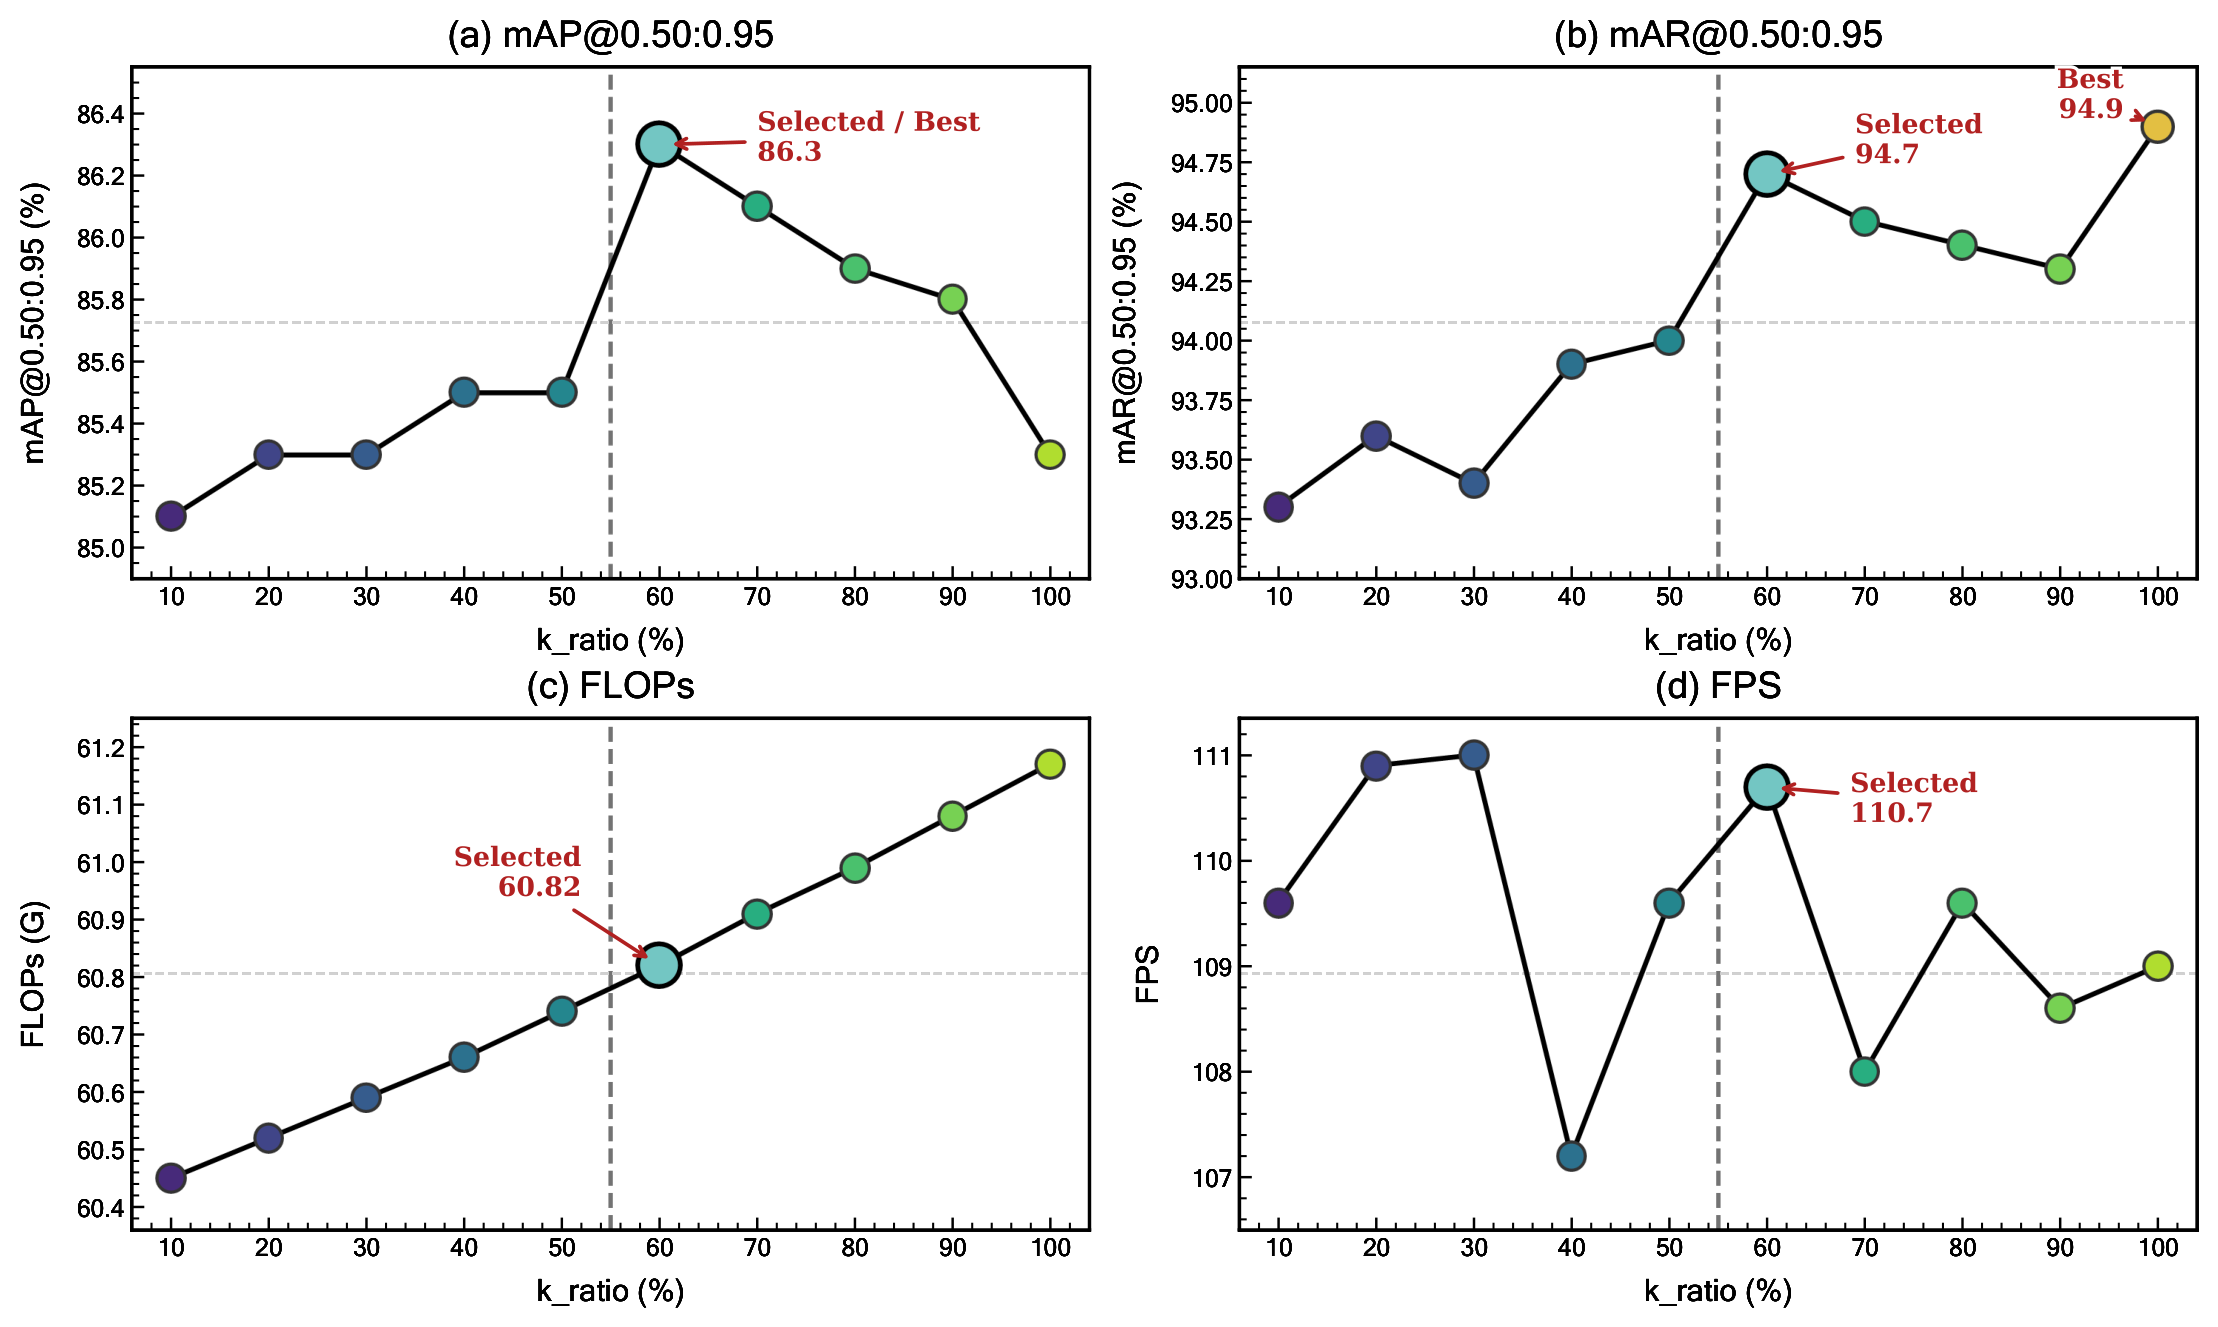
Figure 13.
Comparison of different token selection strategies in SGFE under a fixed token retention ratio. (a) Detection accuracy comparison in terms of . (b) Recall comparison in terms of .
Figure 13.
Comparison of different token selection strategies in SGFE under a fixed token retention ratio. (a) Detection accuracy comparison in terms of . (b) Recall comparison in terms of .
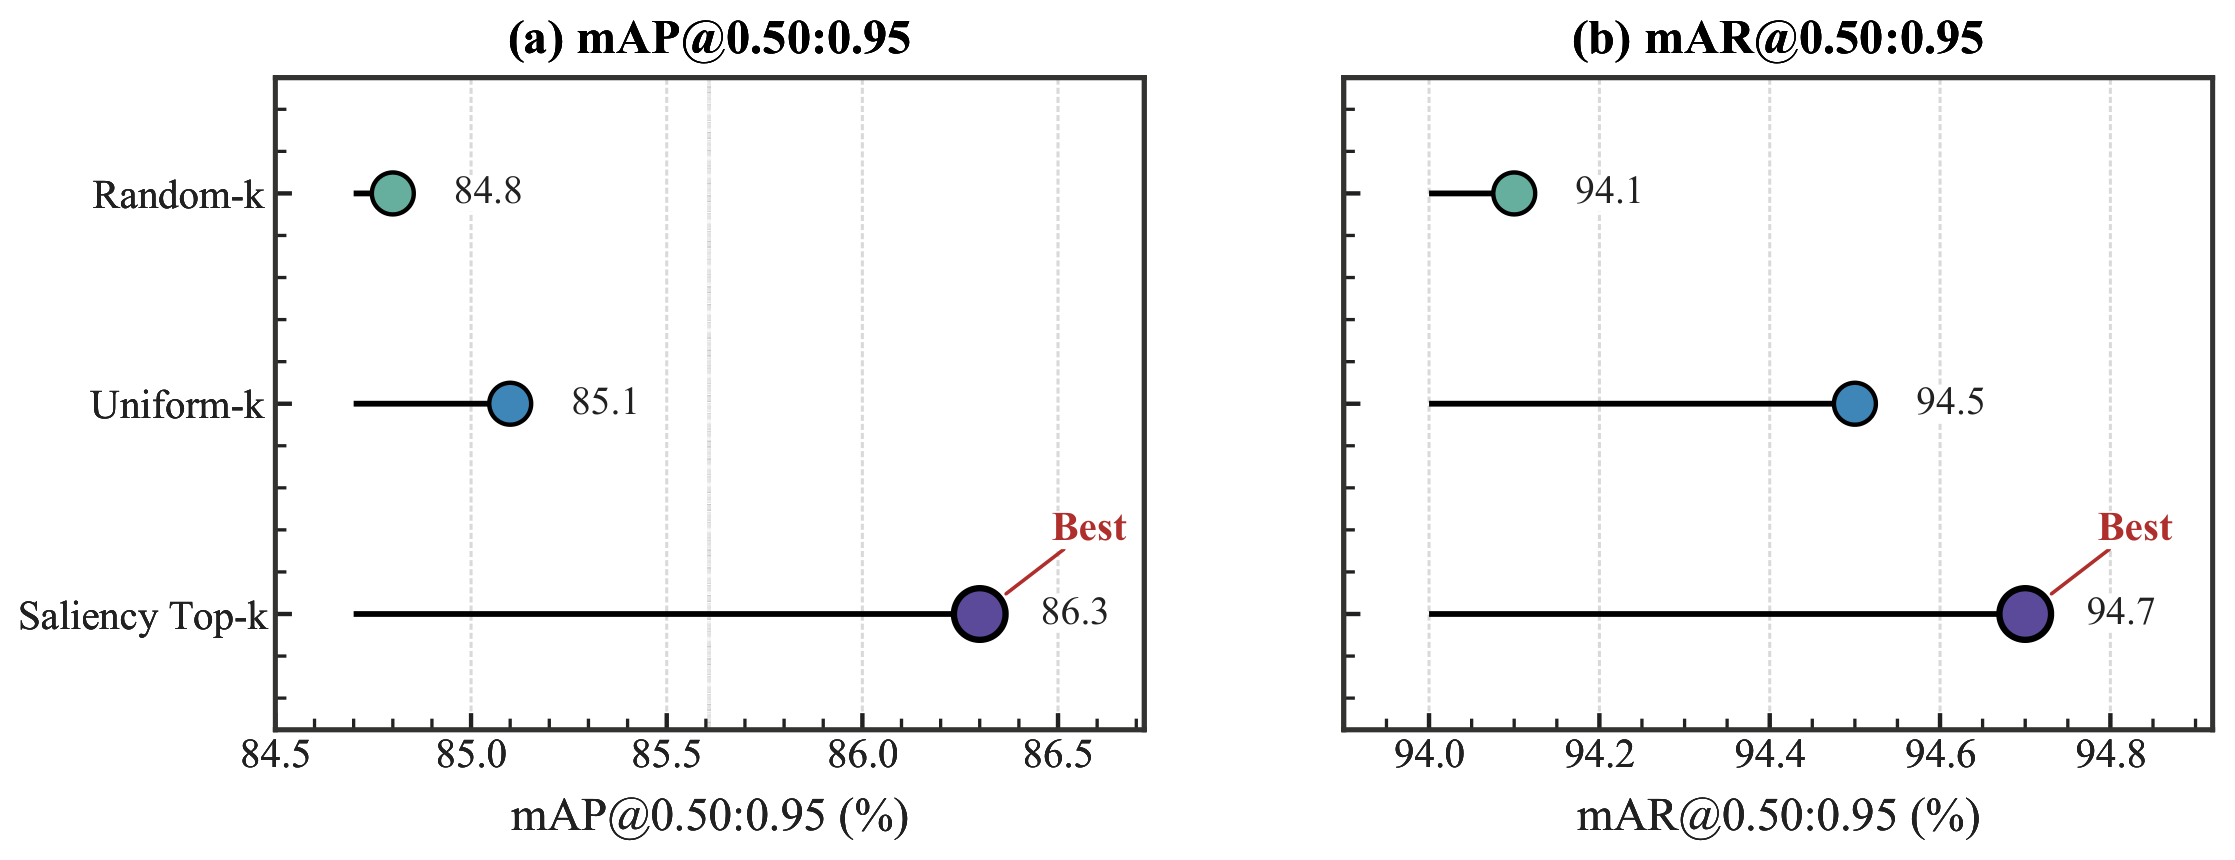
Figure 14.
Qualitative comparison of different spatial refill strategies in SGFE. (a) Input image. (b) Feature response using overwrite refill. (c) Feature response using zero-fill refill. (d) Feature response using residual refill.
Figure 14.
Qualitative comparison of different spatial refill strategies in SGFE. (a) Input image. (b) Feature response using overwrite refill. (c) Feature response using zero-fill refill. (d) Feature response using residual refill.
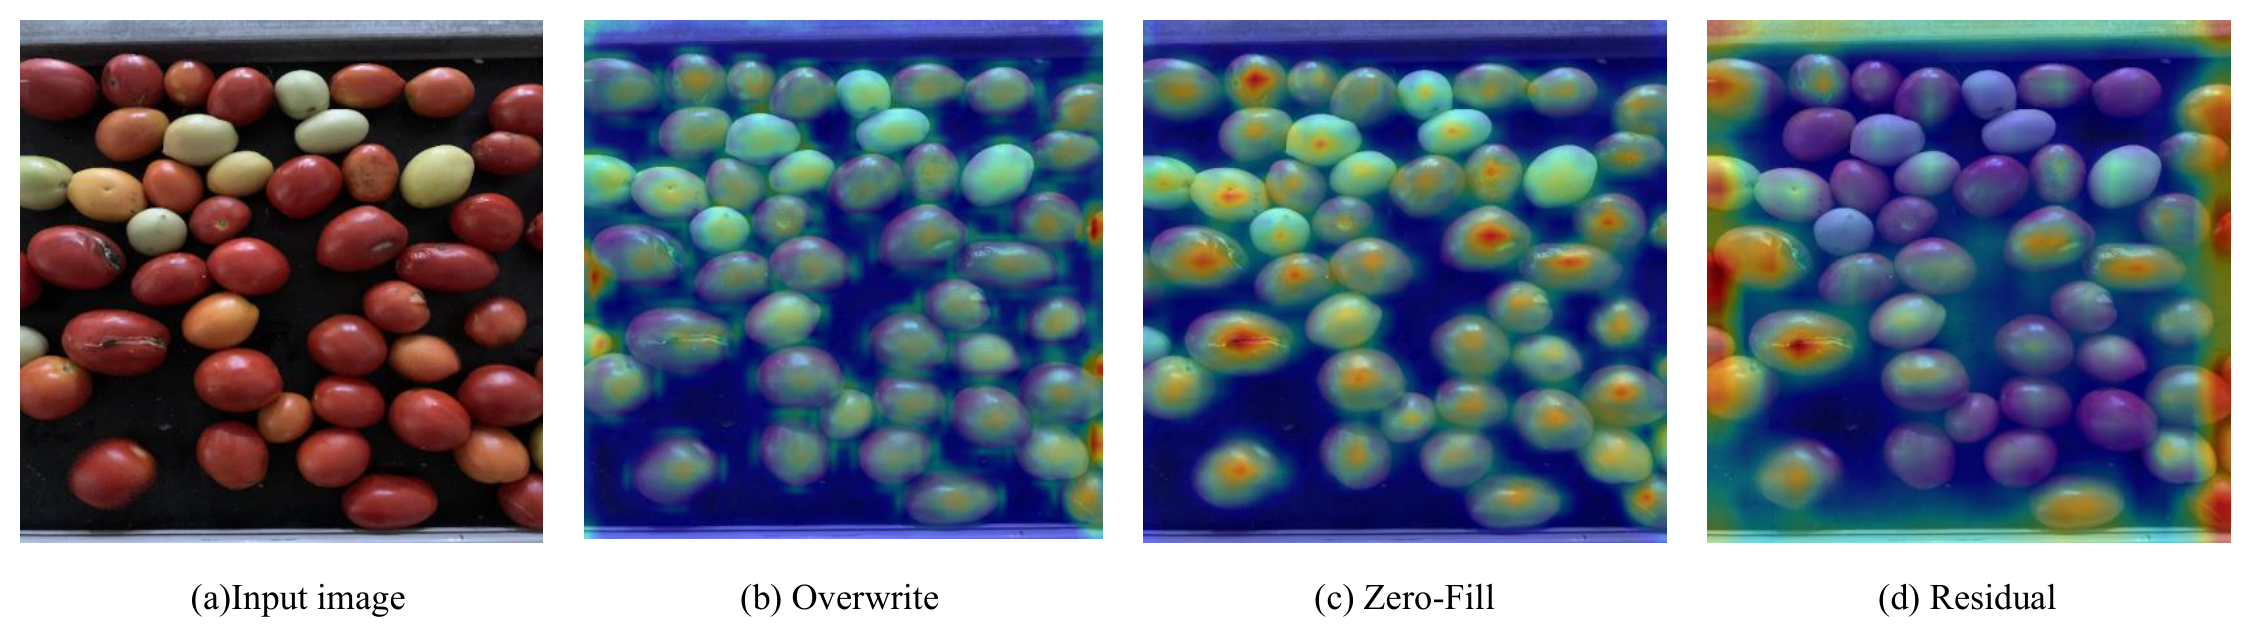
Figure 15.
Visualization of saliency-guided token selection and residual refill in SGFE for three representative test samples. Rows (a)–(c) show three representative test samples.
Figure 15.
Visualization of saliency-guided token selection and residual refill in SGFE for three representative test samples. Rows (a)–(c) show three representative test samples.
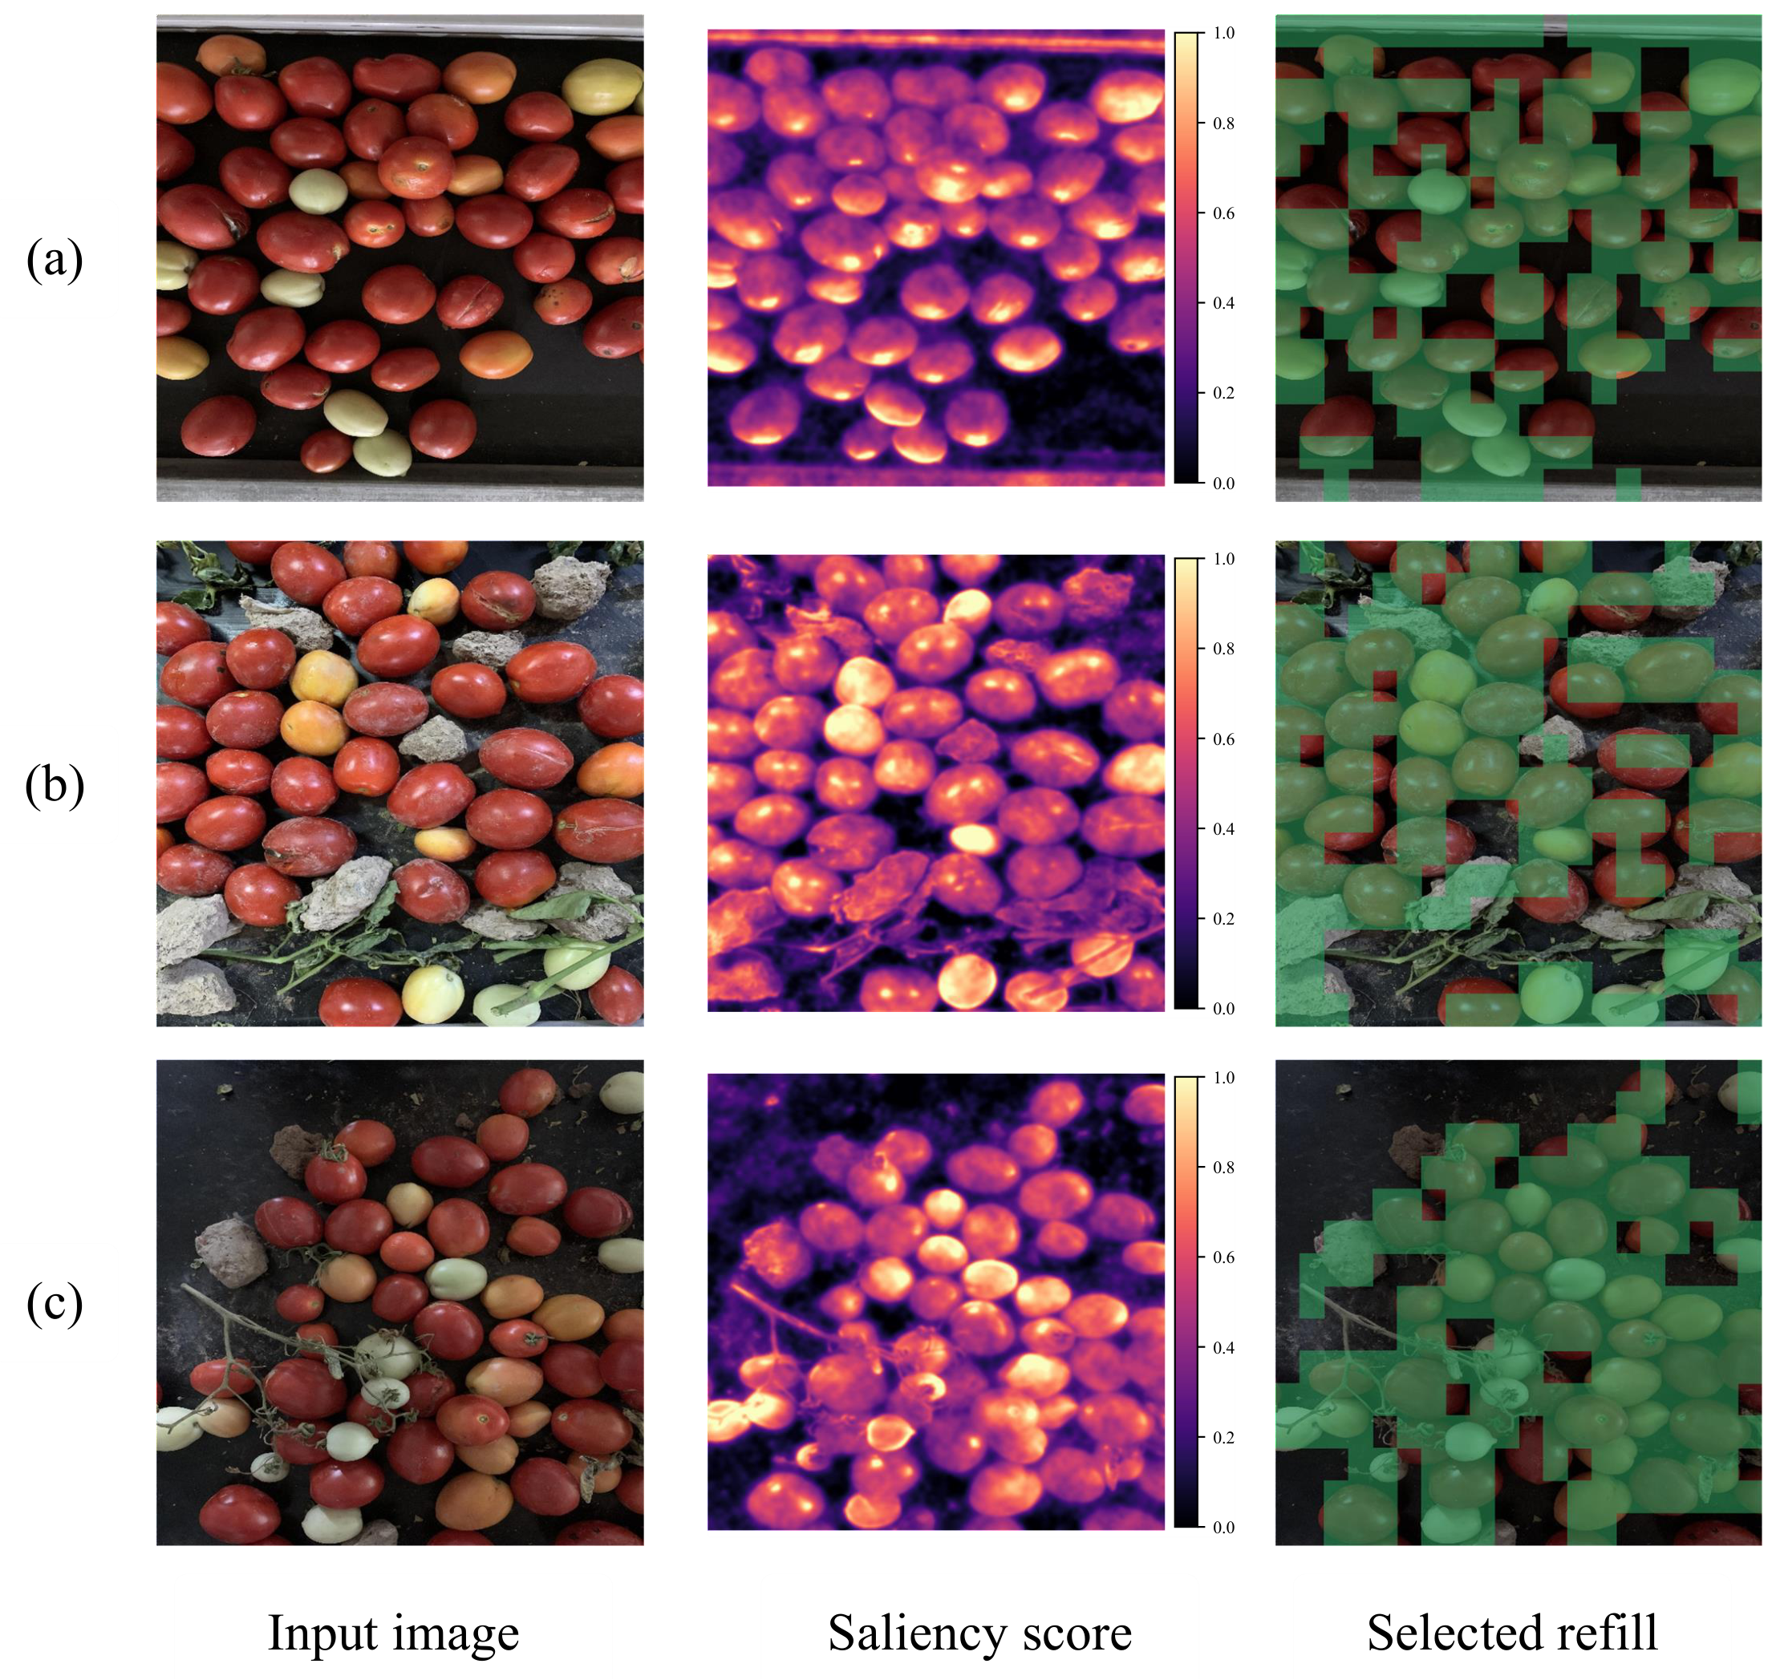
Figure 16.
Spatial-domain visualization of feature differences before and after introducing FADP. (a) Input image. (b) Feature response of the baseline model. (c) Feature response of the FADP model.
Figure 16.
Spatial-domain visualization of feature differences before and after introducing FADP. (a) Input image. (b) Feature response of the baseline model. (c) Feature response of the FADP model.
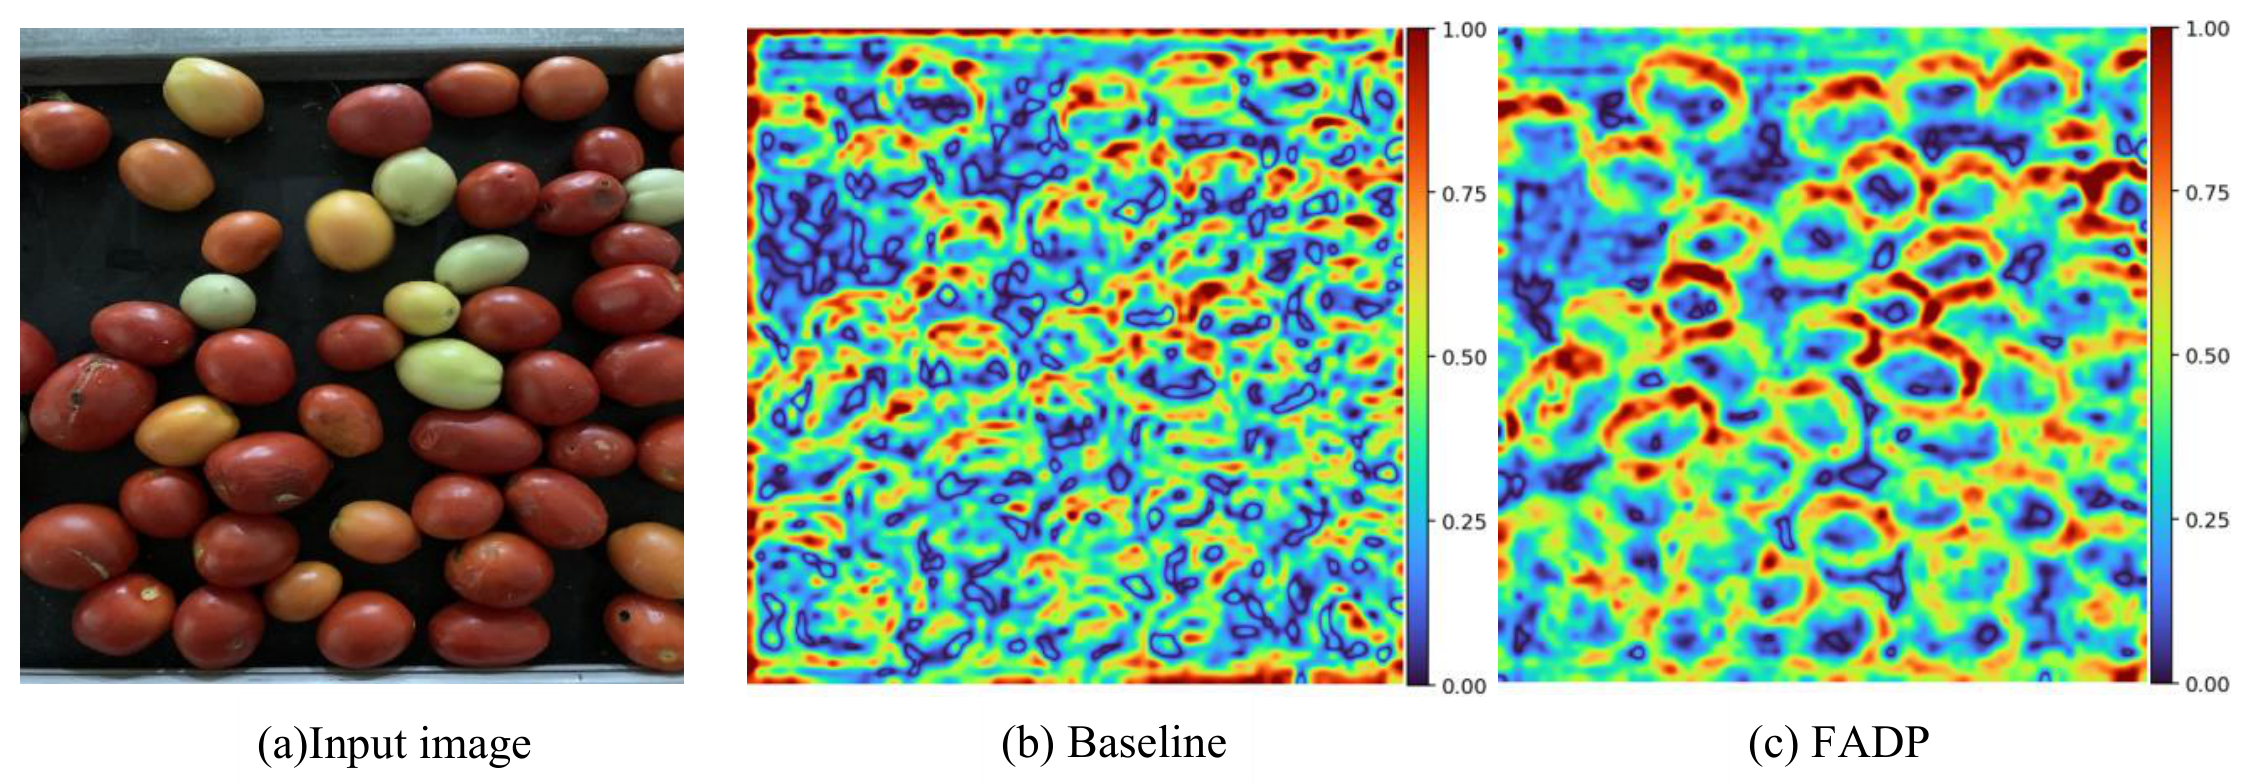
Figure 17.
Visualization of mid-level feature responses at S4 with and without CAFO. (a) Input image. (b) Feature response of the baseline model. (c) Feature response after introducing CAFO.
Figure 17.
Visualization of mid-level feature responses at S4 with and without CAFO. (a) Input image. (b) Feature response of the baseline model. (c) Feature response after introducing CAFO.
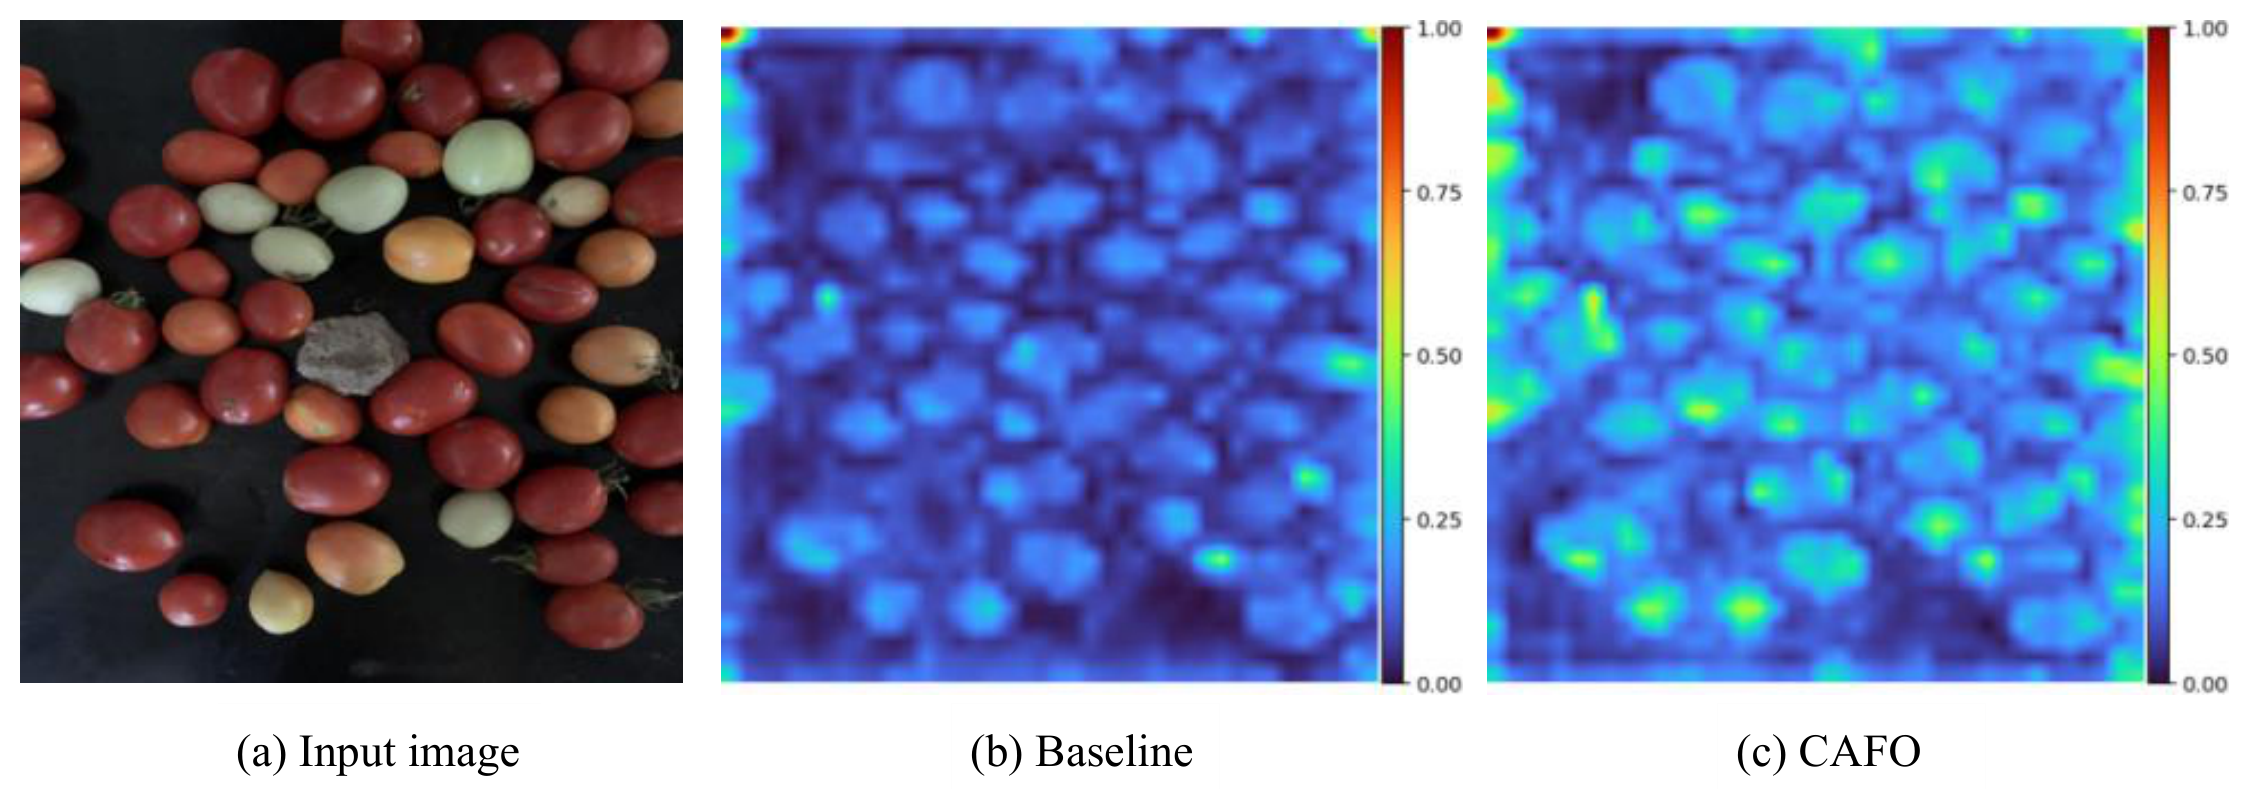
Figure 18.
Quantitative comparison between CAFO and typical attention mechanisms. (a) Detection accuracy comparison based on , , and . (b) Efficiency comparison based on parameters, FLOPs, and FPS.
Figure 18.
Quantitative comparison between CAFO and typical attention mechanisms. (a) Detection accuracy comparison based on , , and . (b) Efficiency comparison based on parameters, FLOPs, and FPS.
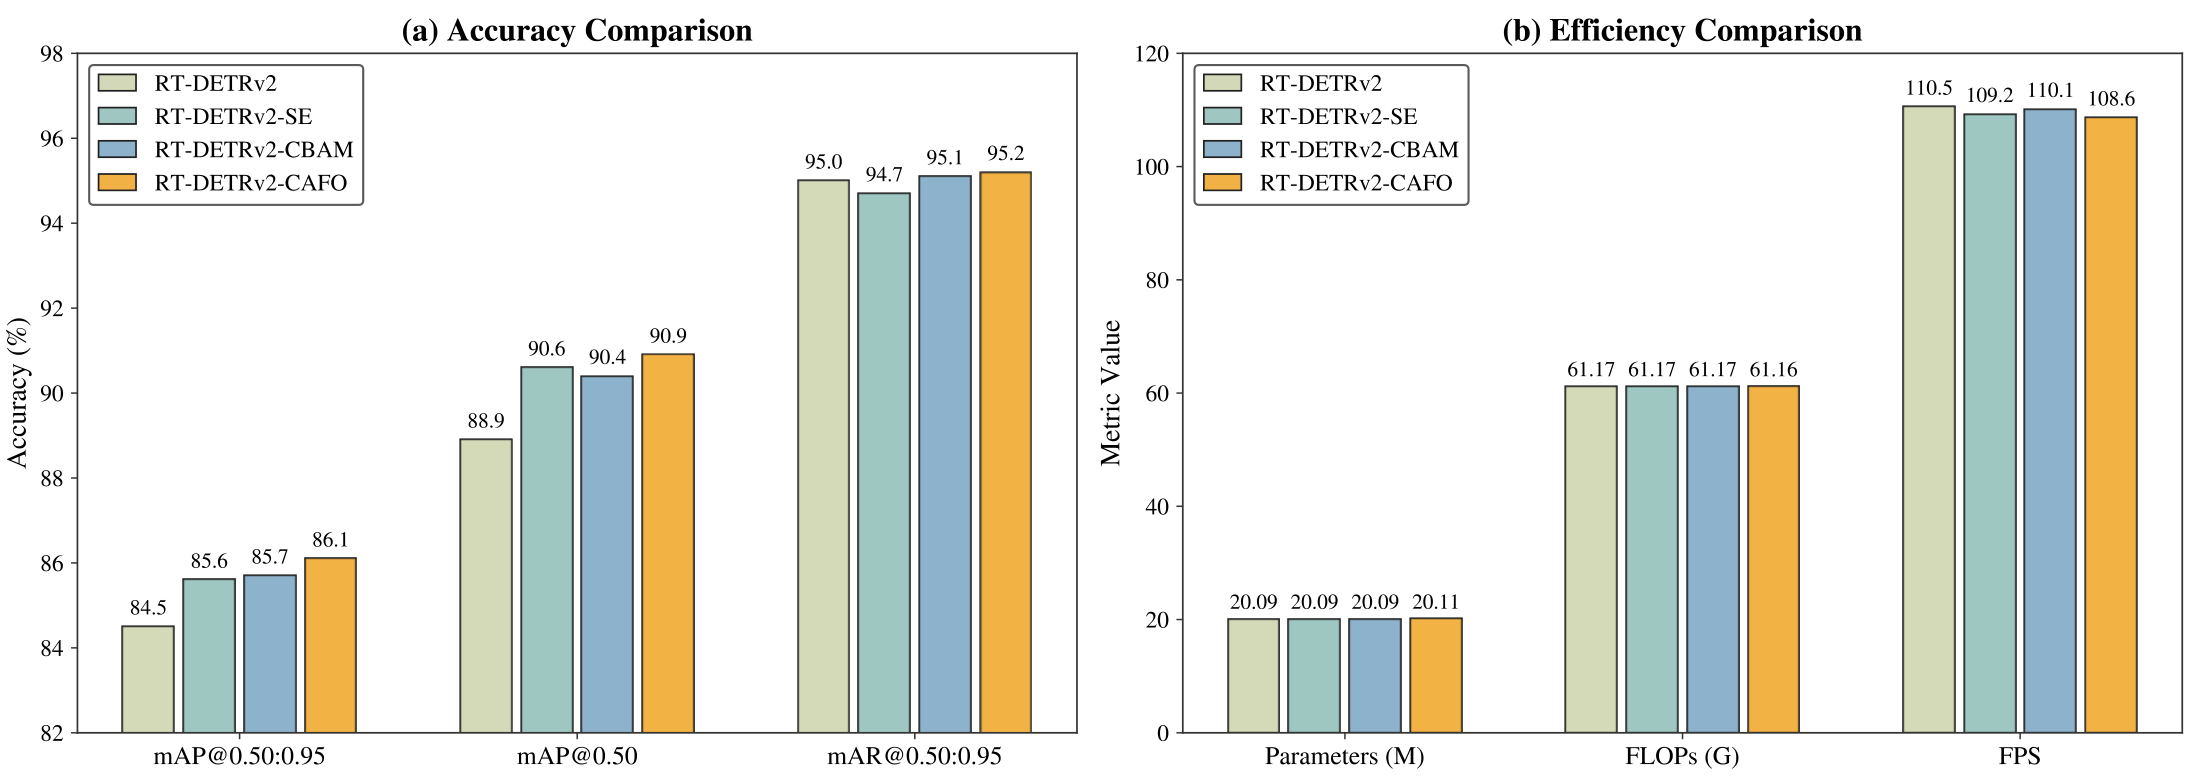
Figure 19.
Qualitative comparison of detection results between RT-DETRv2 and the proposed SG-RTDETR on three representative test images. Columns (a)–(c) correspond to sample 1, sample 2, and sample 3, respectively.
Figure 19.
Qualitative comparison of detection results between RT-DETRv2 and the proposed SG-RTDETR on three representative test images. Columns (a)–(c) correspond to sample 1, sample 2, and sample 3, respectively.
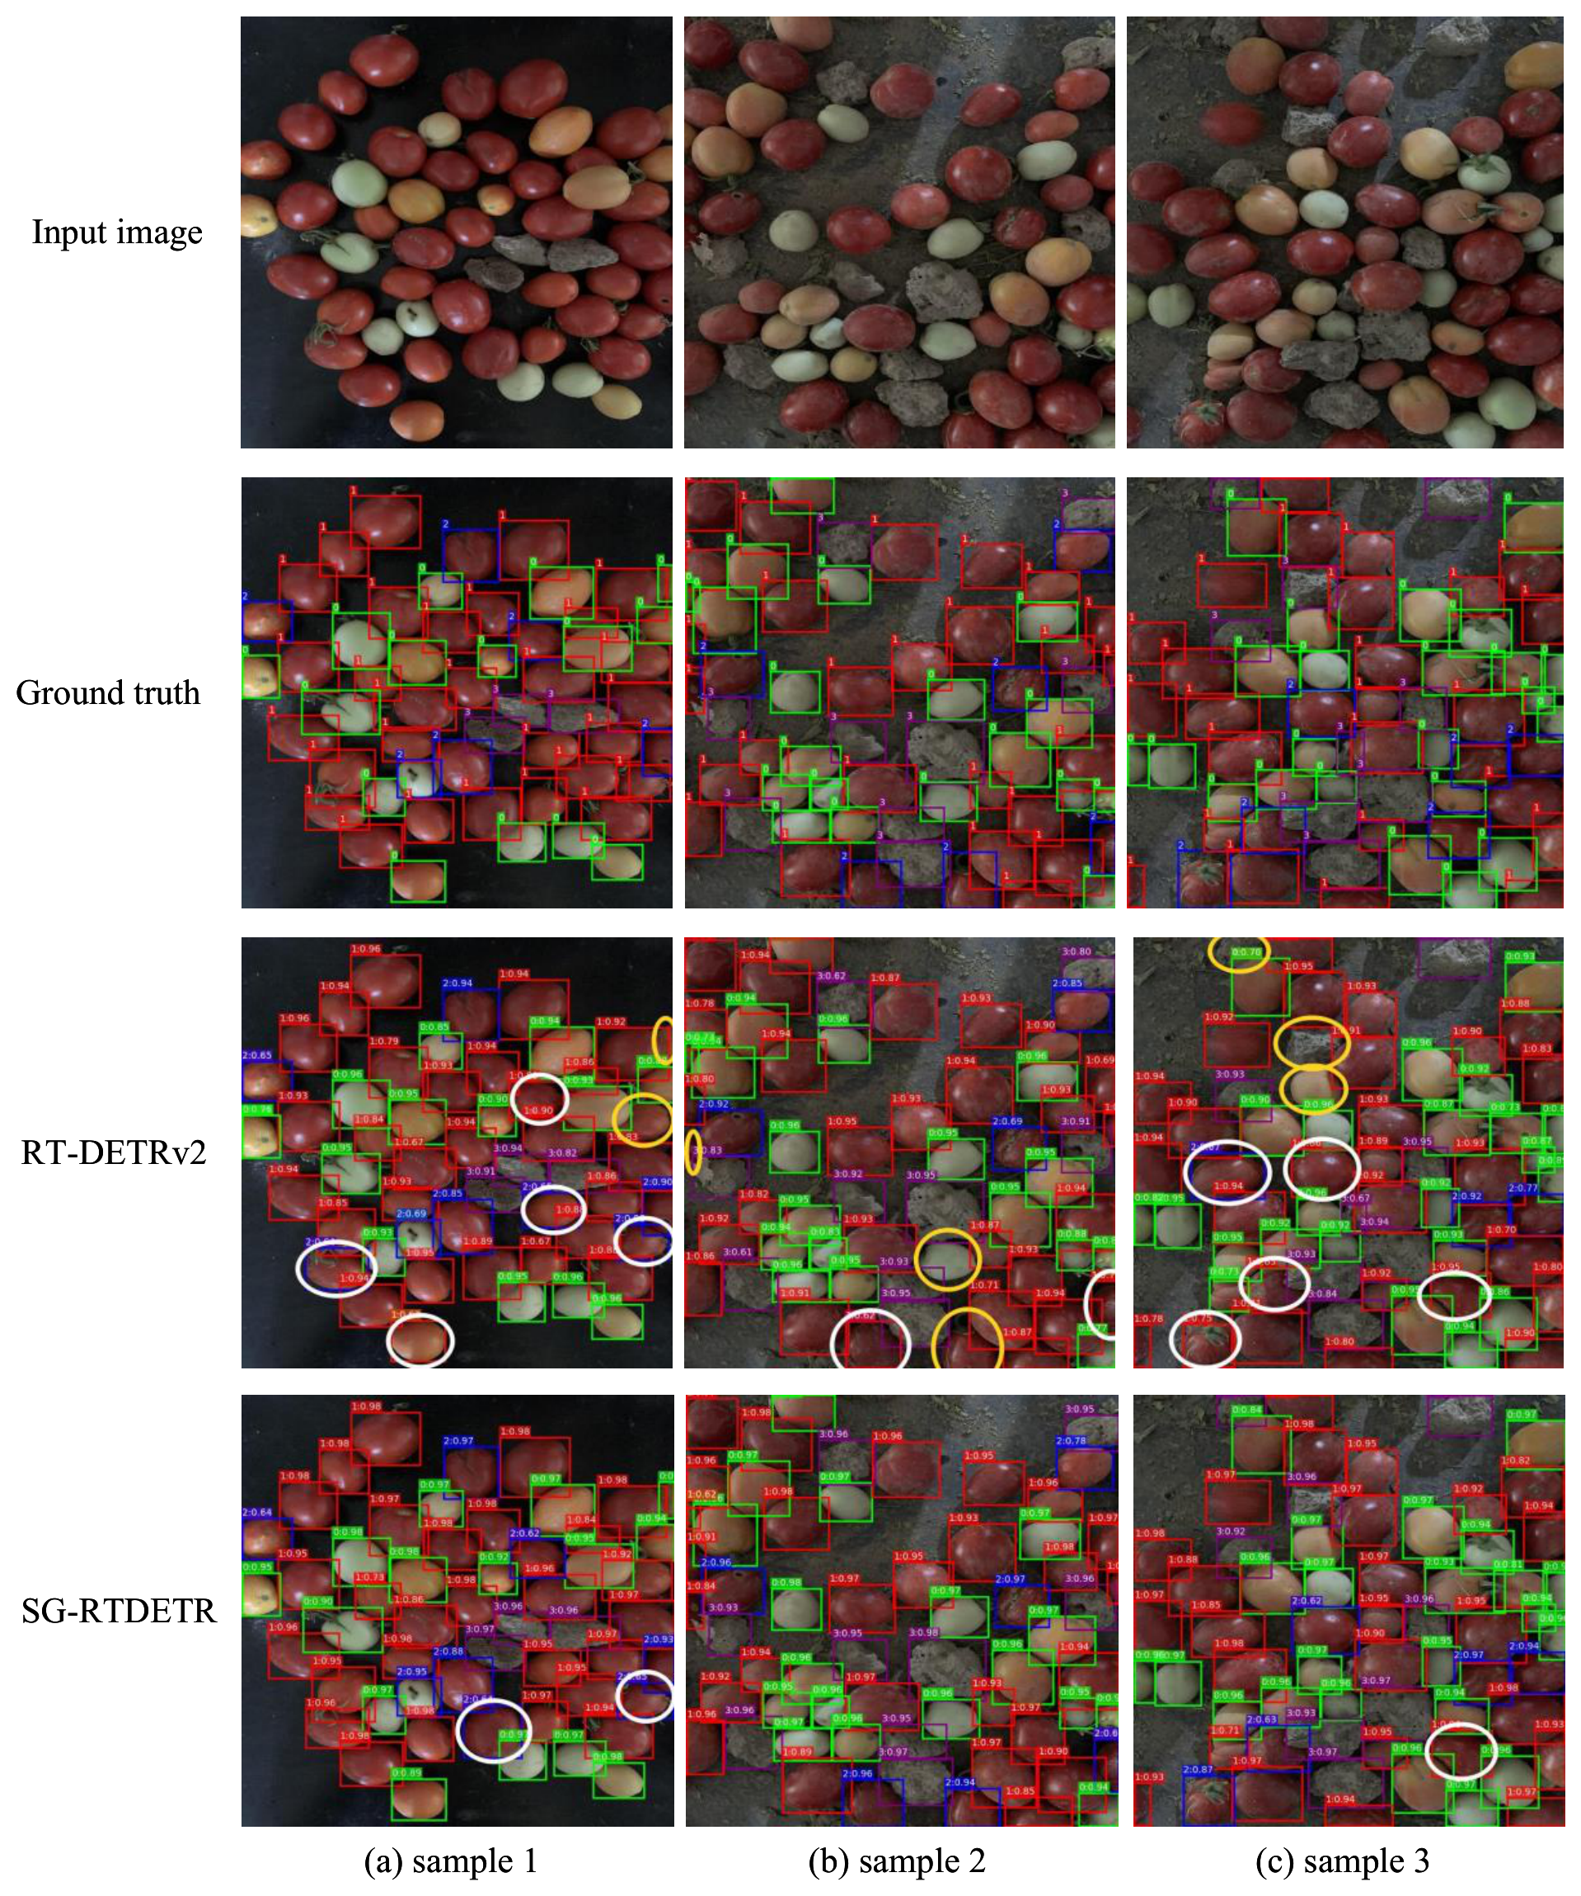

Table 1.
Composition of training data with single-object sample introduction.
| Experiments | |||||
|---|---|---|---|---|---|
| A1 | 700 | 0 | 0 | 0 | 700 |
| A2 | 700 | 0 | 2000 | 0 | 2700 |
| A3 | 700 | 400 | 0 | 0 | 1100 |
| A4 | 700 | 400 | 0 | 2000 | 3100 |
Table 2.
Ablation study on the effects of different components in SG-RTDETR.
| Experiments | SGFE | SACF | QFL | FADP | CAFO |
(%)↑ |
(%)↑ |
(%)↑ |
Params (M)↓ |
FLOPs (G)↓ |
FPS↑ |
|---|---|---|---|---|---|---|---|---|---|---|---|
| 1 | 84.5 | 88.9 | 95.0 | 20.09 | 61.17 | 110.5 | |||||
| 2 | ✓ | 86.3 | 91.5 | 94.7 | 20.10 | 60.82 | 110.7 | ||||
| 3 | ✓ | 85.7 | 90.3 | 95.1 | 20.11 | 61.29 | 106.1 | ||||
| 4 | ✓ | 85.6 | 90.7 | 95.0 | 20.09 | 61.17 | 109.4 | ||||
| 5 | ✓ | 85.5 | 90.5 | 95.0 | 20.10 | 61.30 | 104.3 | ||||
| 6 | ✓ | 86.1 | 90.9 | 95.2 | 20.09 | 61.27 | 106.4 | ||||
| 7 | ✓ | ✓ | 86.8 | 91.6 | 95.3 | 20.13 | 60.65 | 107.8 | |||
| 8 | ✓ | ✓ | ✓ | 87.1 | 91.8 | 95.3 | 20.13 | 60.80 | 106.2 | ||
| 9 | ✓ | ✓ | ✓ | ✓ | 87.3 | 91.9 | 95.4 | 20.13 | 61.18 | 104.5 | |
| 10 | ✓ | ✓ | ✓ | ✓ | ✓ | 87.9 | 92.5 | 95.6 | 20.14 | 61.17 | 103.6 |
Table 3.
Impact of different token retention strategies on SGFE performance.
| Setting | Train policy | Test policy | (%)↑ | (%)↑ |
|---|---|---|---|---|
| Baseline | – | – | 84.5 | 95.0 |
| Fixed–Fixed | Fixed, | Fixed, | 85.3 | 94.5 |
| Source-aware–Fixed | Source-aware, / 60% | Fixed, | 86.3 | 94.7 |
Table 4.
Comparison of spatial refill strategies in SGFE.
| Experiments | (%)↑ | (%)↑ |
|---|---|---|
| SGFE-Overwrite | 85.3 | 94.9 |
| SGFE-Zero-Fill | 84.2 | 94.5 |
| SGFE-Residual | 86.3 | 94.7 |
Table 5.
Frequency-domain quantitative evaluation of FADP.
| Experiments | HFER/ALI | PBR | Coh | |
|---|---|---|---|---|
| Baseline | 0.0005 | 1.5206 | 1.4036 | 0.189591 |
| FADP | 0.0003 | 1.1693 | 1.6912 | 0.064604 |
Table 6.
Quantitative comparison with representative object detection methods.
| Experiments | Backbone |
(%)↑ |
(%)↑ |
(%)↑ |
Params (M)↓ |
FLOPs (G)↓ |
FPS↑ |
|---|---|---|---|---|---|---|---|
| YOLOv8n | CSPDarknet-n | 82.4 | 89.1 | 84.2 | 3.01 | 8.10 | 256 |
| YOLOv11n | CSPDarknet-n | 82.4 | 89.3 | 83.7 | 2.58 | 6.30 | 333 |
| RTMDet | ResNet-50 | 85.0 | 91.6 | 93.9 | 52.26 | 79.96 | 33.7 |
| Faster R-CNN | ResNet-50-FPN | 82.7 | 89.2 | 90.4 | 41.75 | 91.30 | 17.18 |
| Deformable DETR | ResNet-50 | 81.6 | 90.5 | 91.1 | 40.10 | 123.00 | 14.59 |
| RT-DETRv2 | ResNet-50 | 84.5 | 88.9 | 95.0 | 20.09 | 61.17 | 110.5 |
| Ours | ResNet-50 | 87.9 | 92.5 | 95.6 | 20.14 | 61.17 | 103.6 |
Disclaimer/Publisher’s Note: The statements, opinions and data contained in all publications are solely those of the individual author(s) and contributor(s) and not of MDPI and/or the editor(s). MDPI and/or the editor(s) disclaim responsibility for any injury to people or property resulting from any ideas, methods, instructions or products referred to in the content. |
© 2026 by the authors. Licensee MDPI, Basel, Switzerland. This article is an open access article distributed under the terms and conditions of the Creative Commons Attribution (CC BY) license (http://creativecommons.org/licenses/by/4.0/).
Copyright: This open access article is published under a Creative Commons CC BY 4.0 license, which permit the free download, distribution, and reuse, provided that the author and preprint are cited in any reuse.


