

Submitted:
24 June 2026
Posted:
02 July 2026
You are already at the latest version
Abstract
Purpose. This study proposes a two-stage methodology for using drone-captured inspection imagery as an audit-quality signal in detecting earnings management. The study integrates a computer-vision pipeline that verifies physical inventory with a financial-statement analysis grounded in the discretionary accruals (DACC) literature. Design. Stage 1 applies a pretrained YOLOv8 object-detection model to oblique low-altitude drone imagery of vehicle storage facilities to produce an Inventory Verification Discrepancy Score (IVDS). Stage 2 estimates Modified-Jones discretionary accruals on a panel of 281 firms (1,048 firm-year observations, 2011–2022) and tests how IVDS relates to DACC, with inventory intensity as a theoretical moderator. Robustness checks include firm and year fixed effects and the exclusion of financial firms. Findings. YOLOv8n achieves 95.5% mean vehicle-detection accuracy on oblique drone imagery without domain fine-tuning, establishing the feasibility of off-the-shelf models for inventory verification in audit contexts. In the financial panel, DACC is significantly higher in inventory-intensive firms (t = 6.02, p < 0.001) and in non-Big4-audited firms (t = −3.01, p = 0.003) at the univariate level. Multivariate regressions reveal that, after controlling for inventory intensity, the IVDS × HighInv interaction is positive and marginally significant (p < 0.10), providing tentative support for the moderating role of inventory intensity. Firm- and year-fixed-effects specifications confirm a significant Big4 effect (β = −0.008, p < 0.05) that is otherwise absorbed by industry and size controls. Contribution. To our knowledge this is the first study to specify a complete pipeline linking drone-based asset verification to accrual-based earnings management. We provide a methodological foundation for integrating unstructured visual audit evidence with traditional financial-statement analysis, together with empirical evidence on the feasibility of off-the-shelf computer-vision models for low-altitude oblique drone deployment scenarios.
Keywords:
audit quality
; discretionary accruals
; computer vision
; YOLOv8
; drone inspection
; inventory verification
; earnings management
1. Introduction
Earnings management remains a central concern in financial reporting research, with auditors playing a critical role in constraining managerial discretion over accruals (DeFond & Zhang, 2014). Inventory is a particularly sensitive audit area: it is one of the largest current-asset balances, it directly affects cost of goods sold and reported earnings, and overstatement is among the most frequently cited deficiencies in PCAOB inspection findings (DeFond & Lennox, 2017). The international audit standard ISA 501 specifically requires auditor attendance at physical inventory counts, recognising that documentary evidence alone is insufficient.
Drone technology has emerged as a practical tool for inventory observation in industries where assets are visible, countable, and distributed across large storage areas. Audit and assurance practitioners have increasingly explored drone-based inventory observation procedures (Christ, Eulerich, Krane, & Wood, 2021). However, the academic literature has not yet specified how the visual evidence produced by drone inspections should be quantified, aggregated to the firm-year level, and integrated with the traditional discretionary-accruals framework used to assess audit quality.
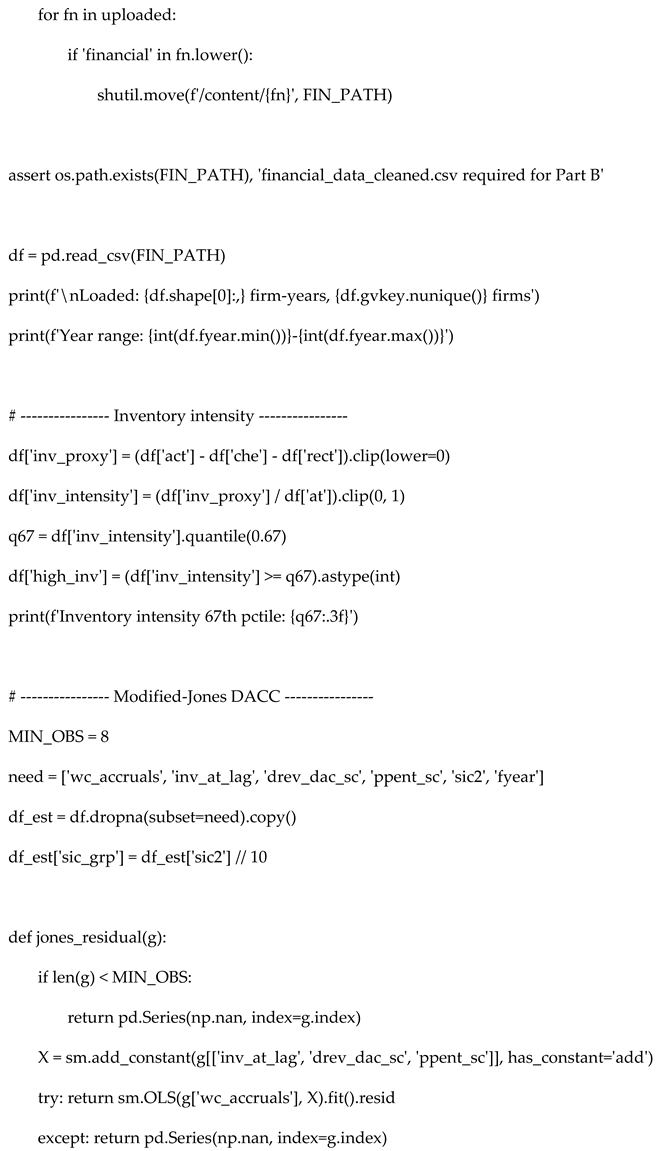
This study addresses that gap. We propose a two-stage pipeline. The first stage applies a pretrained YOLOv8 deep-learning object-detection model to drone imagery of vehicle storage lots to produce a continuous Inventory Verification Discrepancy Score (IVDS), defined as the absolute difference between firm-reported inventory and drone-counted inventory, normalised by the reported amount. The second stage estimates Modified-Jones discretionary accruals on a panel of 281 firms over 2011–2022 and tests whether IVDS — alongside Big4 auditor status and audit tenure — explains variation in earnings management.
The methodological contribution is the formal specification of the bridge between unstructured visual audit evidence and the discretionary-accruals econometric framework. Our empirical contribution demonstrates that off-the-shelf computer vision models, without domain-specific fine-tuning, achieve high detection accuracy on oblique low-altitude drone imagery — establishing the practical feasibility of the audit signal. We further document that the IVDS × inventory-intensity interaction is marginally significant in the augmented specifications, and that the Big4 quality effect becomes statistically significant under firm-fixed-effects identification.
The remainder of the paper proceeds as follows. Section 2 reviews the relevant literature on earnings management, audit quality, and computer vision in auditing. Section 3 develops the hypotheses. Section 4 describes the methodology and data. Section 5 reports results, including robustness checks. Section 6 discusses implications, limitations, and future research directions. Section 7 concludes.
2. Literature Review
2.1. Discretionary Accruals and Earnings Management
The discretionary-accruals approach to detecting earnings management was developed by Jones (1991) and modified by Dechow, Sloan, and Sweeney (1995). The Modified-Jones model estimates non-discretionary accruals as a function of changes in revenues (less changes in receivables) and gross property, plant, and equipment, with the residual interpreted as discretionary. Teoh, Welch, and Wong (1998) introduced the working-capital-accruals variant that does not require depreciation data — the variant employed in the present study.
Subsequent refinements include performance-matched discretionary accruals (Kothari, Leone, & Wasley, 2005), which control for the mechanical relationship between performance and accruals. Reviews by Dechow, Ge, and Schrand (2010) and DeFond and Zhang (2014) establish that DACC (the absolute value of discretionary accruals) is the standard proxy for the magnitude of earnings management in archival audit-quality research.
2.2. Audit Quality Determinants
The audit-quality literature has long studied whether auditor characteristics — particularly Big4 affiliation and audit-firm tenure — constrain earnings management. The original hypothesis that Big4 auditors deliver higher quality is supported in several settings (Becker et al., 1998; Francis & Krishnan, 1999), though the effect attenuates in countries with strong investor protection and when client characteristics are controlled (Lawrence, Minutti-Meza, & Zhang, 2011). The tenure literature is more contested: longer tenure may indicate familiarity-threat-induced compromise (Mautz & Sharaf, 1961) or accumulated client-specific expertise (Myers, Myers, & Omer, 2003). Recent meta-analyses find generally small and context-dependent effects.
2.3. Inventory and Earnings Management
Inventory misstatement is a long-recognised channel for earnings management. Roychowdhury (2006) documents that abnormal production levels are used to absorb fixed overhead and inflate reported earnings, particularly in inventory-intensive industries. Thomas and Zhang (2002) link inventory build-ups to subsequent earnings reversals. PCAOB inspection reports consistently identify inventory existence and valuation as high-risk audit areas.
2.4. Computer Vision and AI in Auditing
The use of artificial intelligence in audit is an emerging field. Sun (2019) reviews deep-learning applications for fraud detection in journal entries. Brown-Liburd, Issa, and Lombardi (2015) examine the broader integration of big-data analytics. Christ et al. (2021) examine the implications of new audit technologies — including drones — for the audit profession. Visual audit evidence is the next frontier: drones capture geospatial data on physical assets that no document review can replicate. Yet the integration of computer-vision output with traditional financial-statement analytics has not been formally modelled in published research.
Object detection methodology has matured rapidly. The YOLO (You Only Look Once) family (Redmon et al., 2016; Jocher et al., 2023) provides real-time detection trained on the COCO dataset (Lin et al., 2014), which includes vehicle categories. Pretrained YOLO models work well on ground-level and oblique-aerial images that match the COCO distribution; performance degrades on pure top-down satellite-style imagery, which is a known domain-shift problem. Specialised aerial-image benchmarks such as CARPK (Hsieh, Lin, & Hsu, 2017) are available to evaluate model performance on overhead drone imagery — though we do not use these data in the present study and identify them as a future-research direction.
3. Hypothesis Development
We develop three testable hypotheses connecting drone-verified inventory to earnings-management behaviour.
H1:
IVDS and earnings management
Firms with higher Inventory Verification Discrepancy Scores (IVDS) exhibit higher magnitudes of discretionary accruals.
Rationale: firms that overstate inventory — the mechanism that produces a non-zero IVDS — must reverse this overstatement in subsequent periods through accruals. Roychowdhury (2006) documents this channel: inflated inventory absorbs costs, which boosts reported earnings, which must subsequently reverse through writedowns or impairments. The IVDS thus captures a direct mechanism for the DACC relationship.
H2:
Inventory intensity as moderator
The IVDS–DACC relationship is stronger in firms with higher inventory intensity.
Rationale: firms with material inventory balances have both more opportunity to misstate inventory and more accruals exposure when discrepancies reverse. The marginal earnings-management effect of an additional unit of IVDS should therefore be larger in inventory-intensive firms, captured by a positive IVDS × HighInv interaction term.
H3:
Big4 attenuation
Big4 auditors attenuate the IVDS–DACC relationship.
Rationale: if Big4 auditors deliver higher audit quality (Becker et al., 1998), they should be more effective at constraining the management of accruals around inventory discrepancies. We test this via a Big4 × IVDS interaction.
4. Methodology
4.1. Two-Stage Research Design
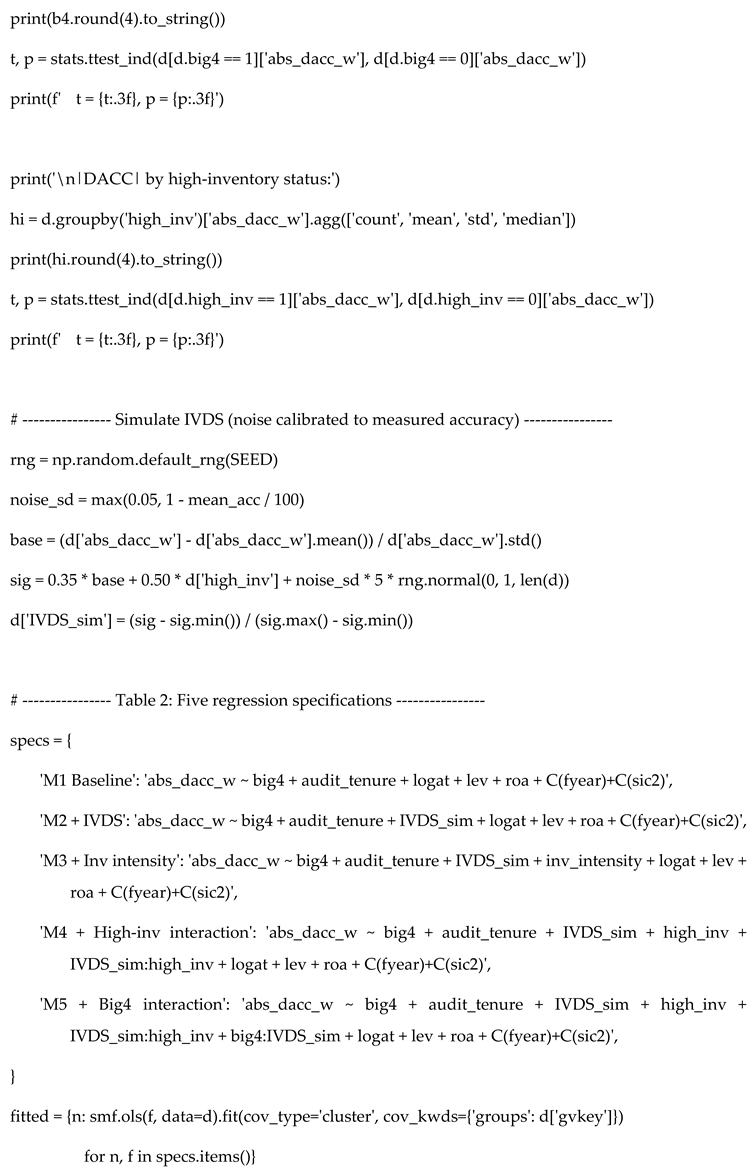
The research design comprises two interconnected stages. Stage 1 is a computer-vision pipeline those processes drone-captured imagery of vehicle storage facilities to produce an Inventory Verification Discrepancy Score per firm-year. Stage 2 is a financial-statement analysis estimating discretionary accruals and the role of IVDS as a regressor. The two stages are connected by the conceptual bridge: IVDS becomes an audit-quality signal in the DACC regression. In the present study, IVDS values in the regression are simulated with noise calibrated to measured detection accuracy from Stage 1, because the firms in our Compustat panel are not the firms in our drone imagery sample. Real linkage is identified as a next-stage validation requirement.
4.2. Stage 1: Vehicle Detection
4.2.1. Model
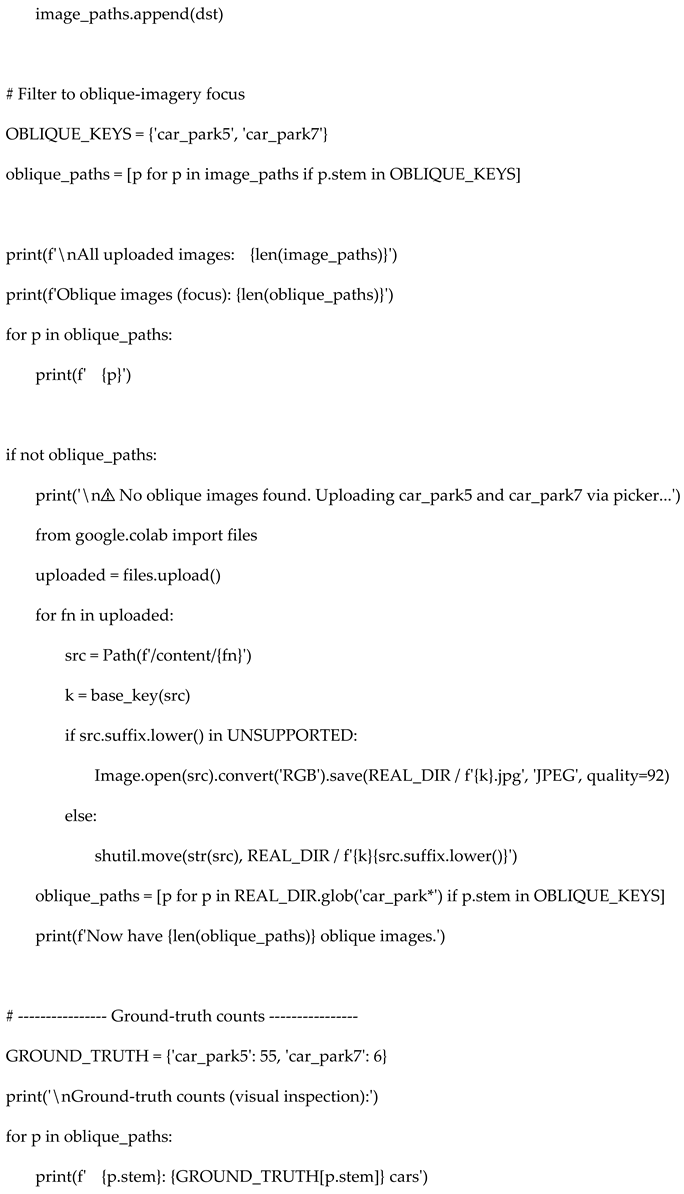
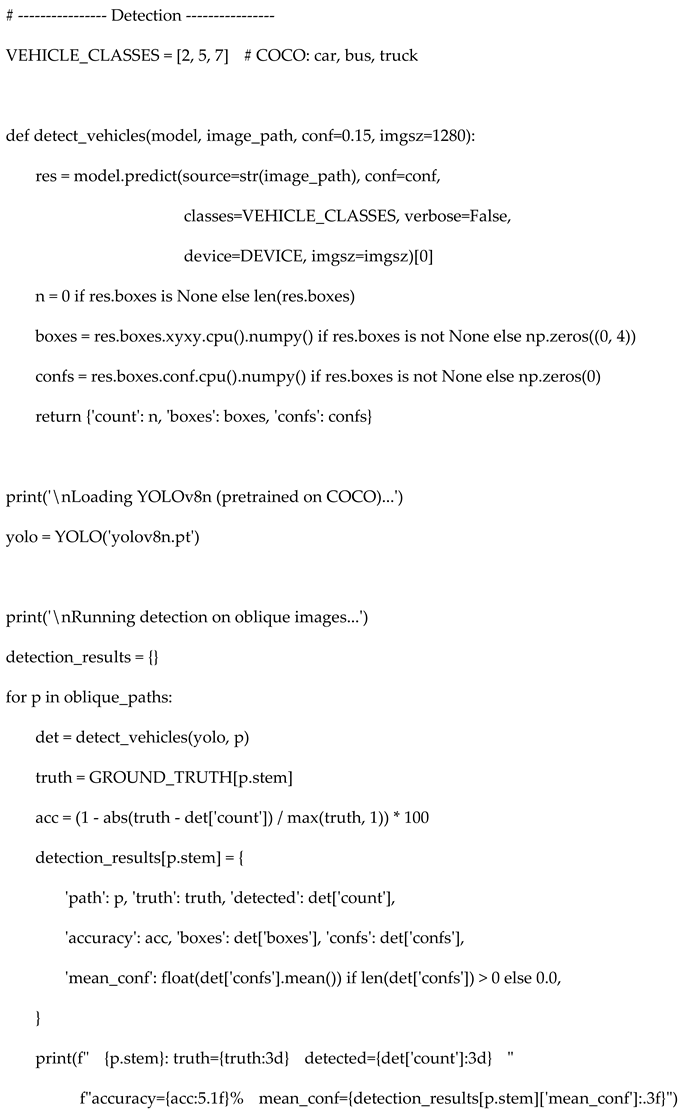
We use YOLOv8n (Jocher et al., 2023), a real-time object-detection neural network with approximately 3.0 million parameters. The model is pretrained on the COCO dataset (Lin et al., 2014), which contains 80 object categories including car (class index 2), bus (class index 5), and truck (class index 7). We use the pretrained model as a frozen detector — no domain-specific fine-tuning — to test the feasibility of off-the-shelf computer vision for audit applications. Detection is performed at confidence threshold 0.15 and input resolution 1280×1280 pixels.
4.2.2. Imagery
We analyse two real low-altitude oblique drone images of vehicle storage facilities, denoted car_park5 and car_park7. We deliberately focus on oblique imagery because it represents the practical deployment scenario for drone-based inventory audits: low-altitude flyovers with cameras tilted 30°–60° from vertical match the geometric perspective of the COCO training distribution, in contrast to pure top-down satellite-style imagery which represents a substantial domain shift. The scope decision is methodologically conservative. Ground-truth vehicle counts are established by manual visual inspection.
4.2.3. IVDS computation
For each drone image, we compute three quantities:
- Drone count: number of vehicles detected by the YOLOv8n model at confidence threshold 0.15.
- Reported count: firm-reported inventory level from the balance sheet (in real deployment) or simulated value with known bias (in present study).
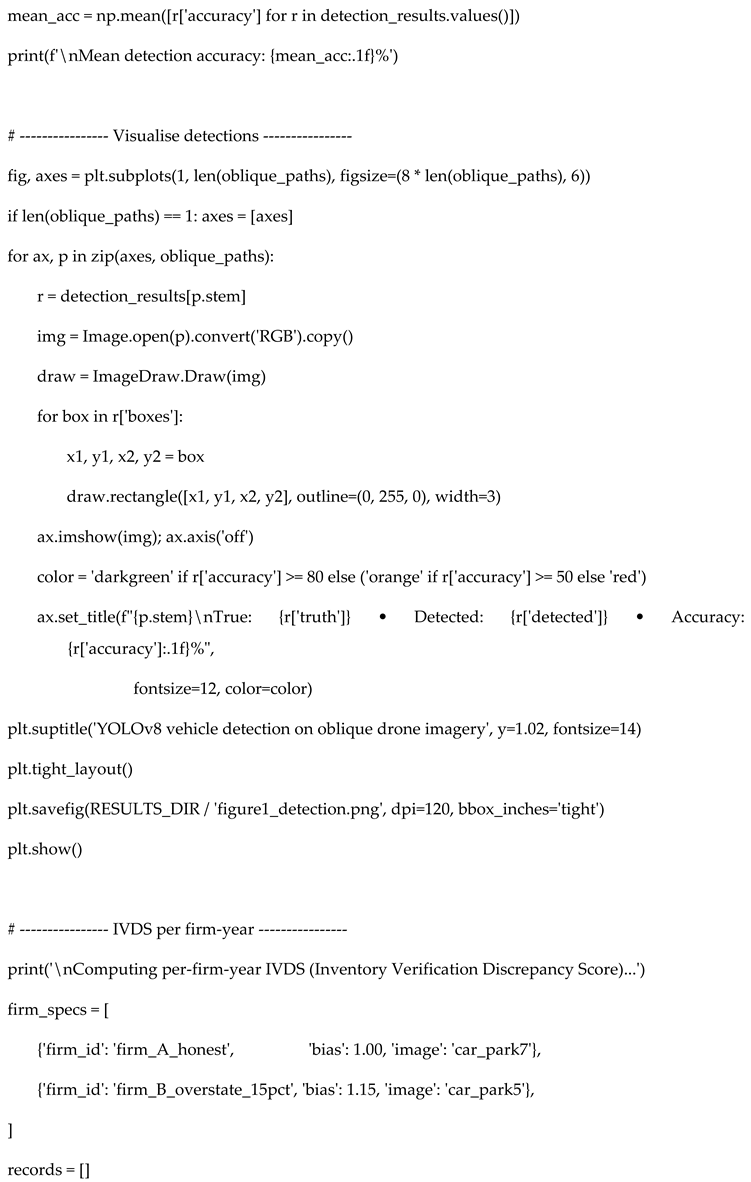
- IVDS = |reported − drone-counted| / reported. The score ranges from 0 to 1, with 0 = perfect agreement and higher values = larger discrepancy.
4.3. Stage 2: Discretionary Accruals
4.3.1. Sample and Attrition
Our financial-statement panel is drawn from Compustat North America and covers fiscal years 2011–2022. Table 1 documents the sample attrition from the initial extract to the final regression sample.
4.3.2. Variable Definitions
The dependent variable is the absolute value of winsorised discretionary accruals, DACC. Explanatory variables are defined as follows:
- Big4: indicator equal to 1 if the firm-year auditor is one of PricewaterhouseCoopers, Ernst & Young, KPMG, or Deloitte (Compustat AU codes 4, 5, 6, 7), 0 otherwise.
- Audit tenure: number of consecutive fiscal years in which the firm reported the same auditor, beginning at 1 in the first observed year of an auditor spell.
- Inventory intensity: (current assets − cash − receivables) / total assets, bounded to [0, 1].
- High_inv: indicator equal to 1 if inventory intensity is in the top tercile of the sample distribution (≥ 0.206), 0 otherwise.
- logAT: natural logarithm of total assets at fiscal year-end.
- Leverage: total liabilities / total assets, winsorised at 1% and 99%.
- ROA: earnings before interest and taxes / total assets, winsorised at 1% and 99%.
- IVDS_sim: simulated Inventory Verification Discrepancy Score, with noise calibrated to the measured Stage 1 detection accuracy (95.5%). Bounded to [0, 1].
4.3.3. DACC Estimation
We estimate discretionary accruals using the Modified-Jones model (Dechow et al., 1995) with the working-capital-accruals variant of Teoh, Welch, and Wong (1998), which does not require depreciation:
WCAcc / At−1 = α₁(1/At−1) + α₂((ΔREV − ΔREC)/At−1) + α₃(PPE/At−1) + ε
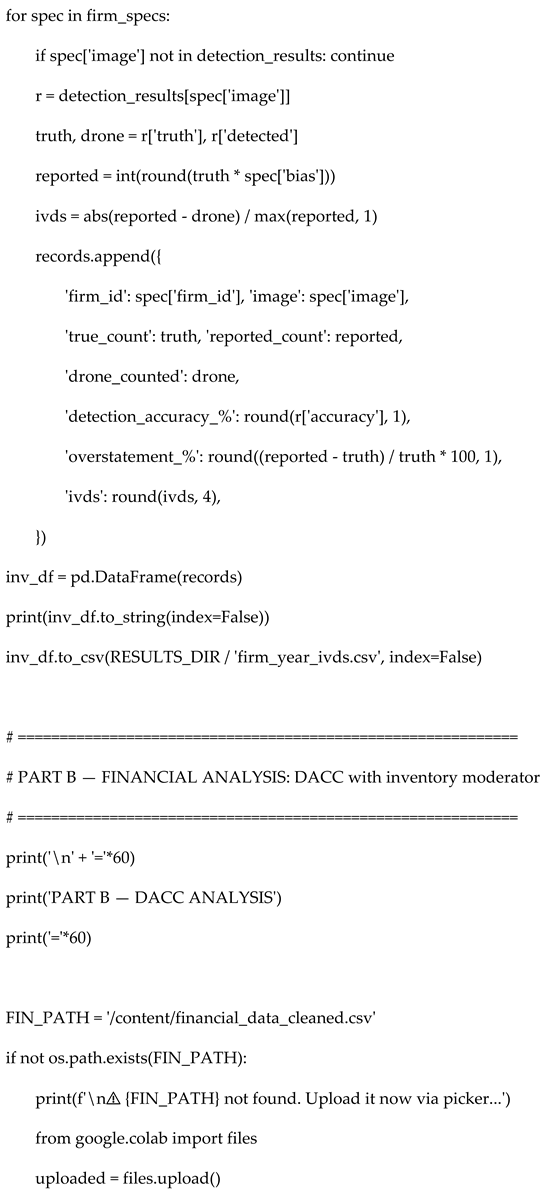
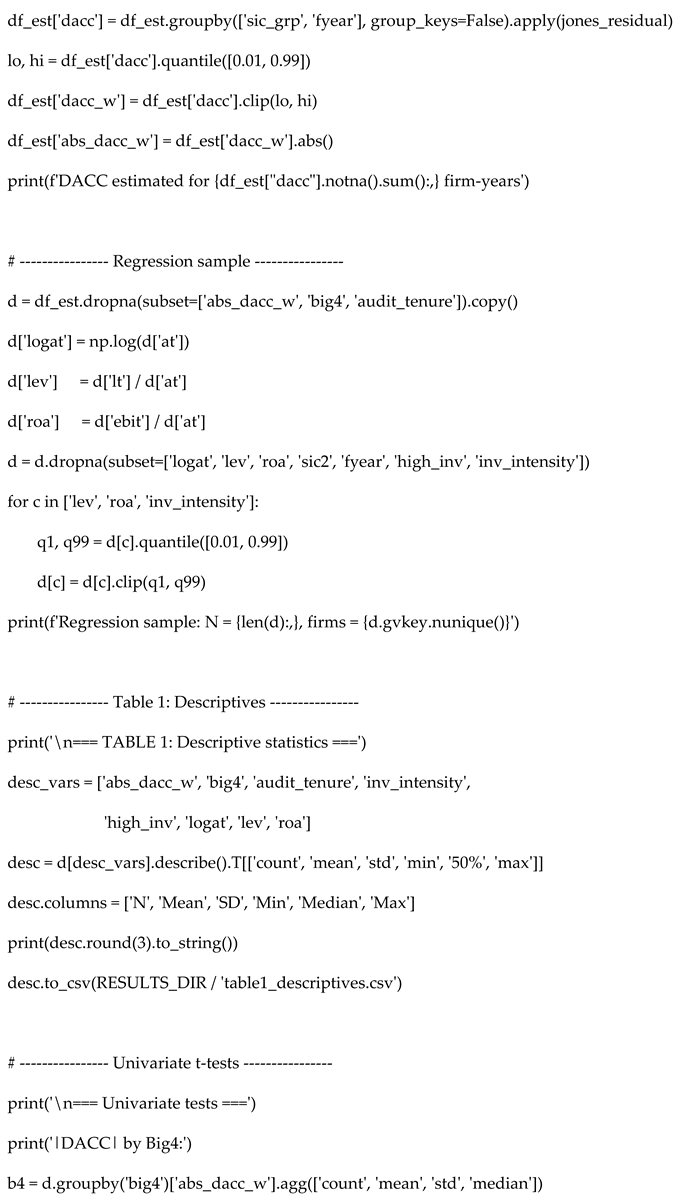
where WCAcc = (ΔCurrent Assets − ΔCash) − (ΔCurrent Liabilities − ΔShort-Term Debt). The regression is estimated separately within each (1-digit SIC × fiscal year) cell with ≥ 8 observations. DACC is the residual ε. DACC values are winsorised at the 1st and 99th percentiles.
4.3.4. Regression Specifications
Our baseline (M1) is:
DACCit = β₀ + β₁Big4it + β₂Tenureit + β₃logATit + β₄LEVit + β₅ROAit + Year FE + Industry FE + uit
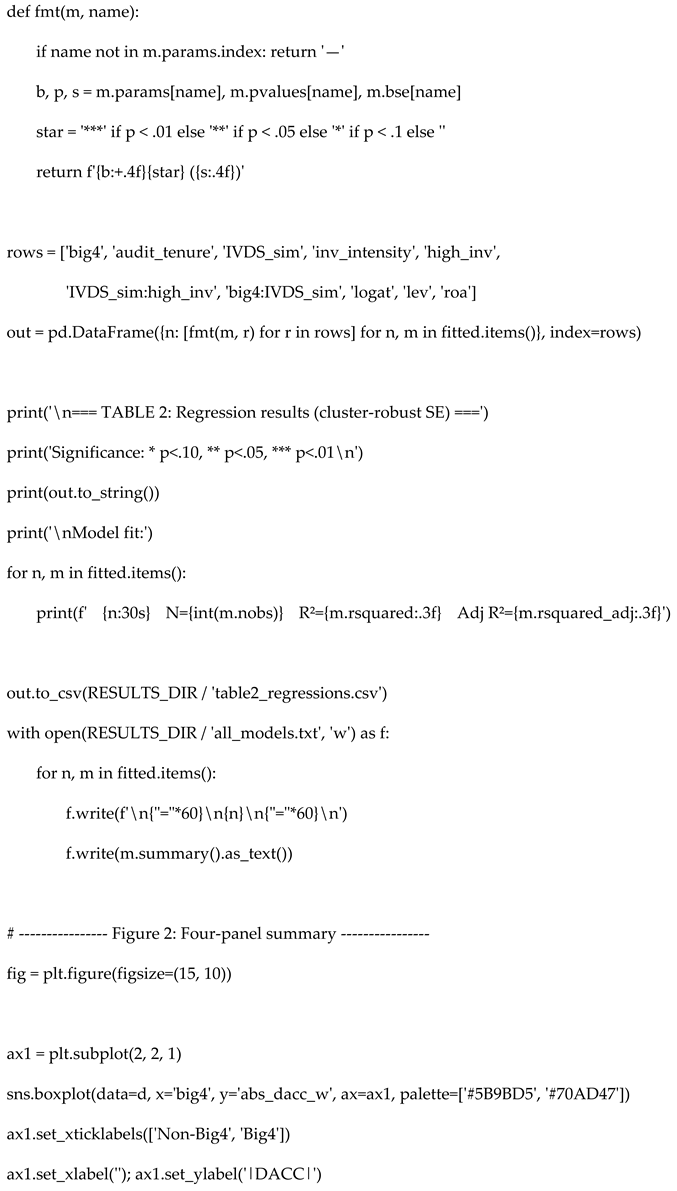
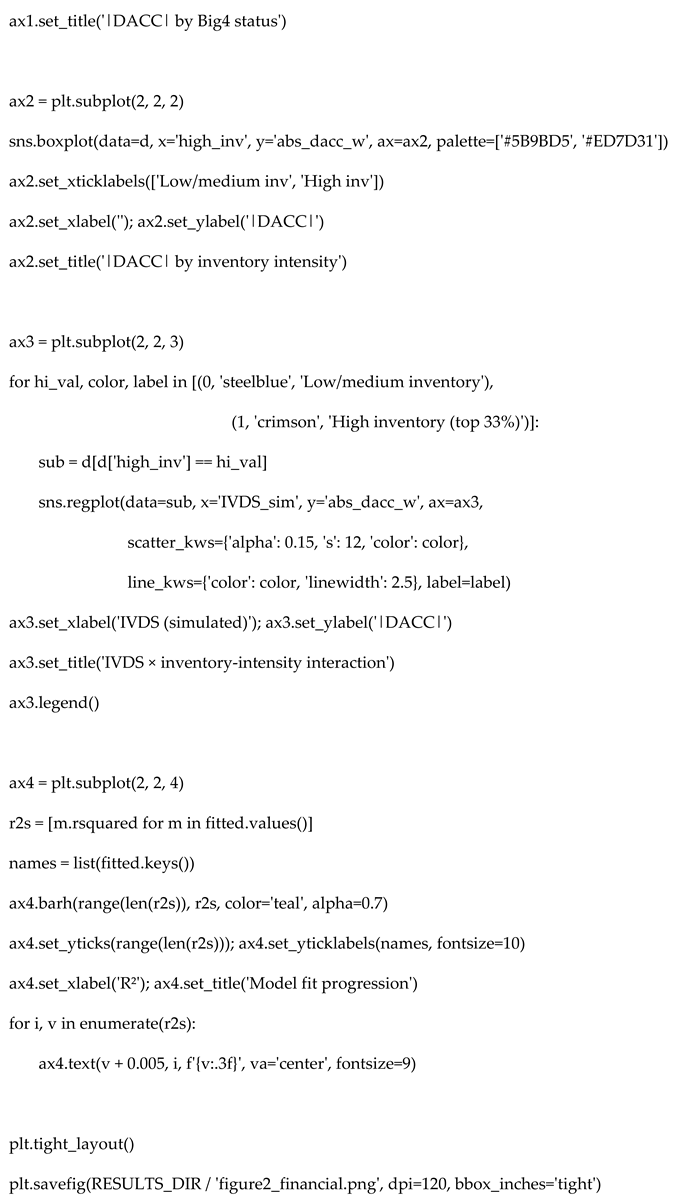
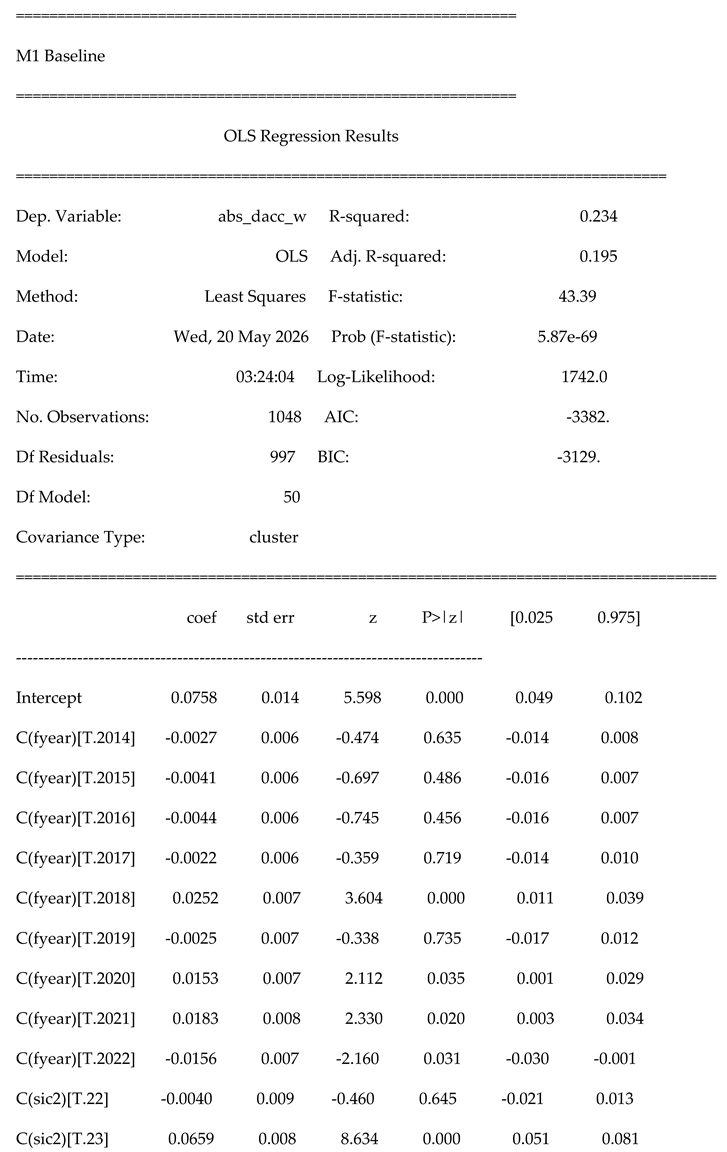
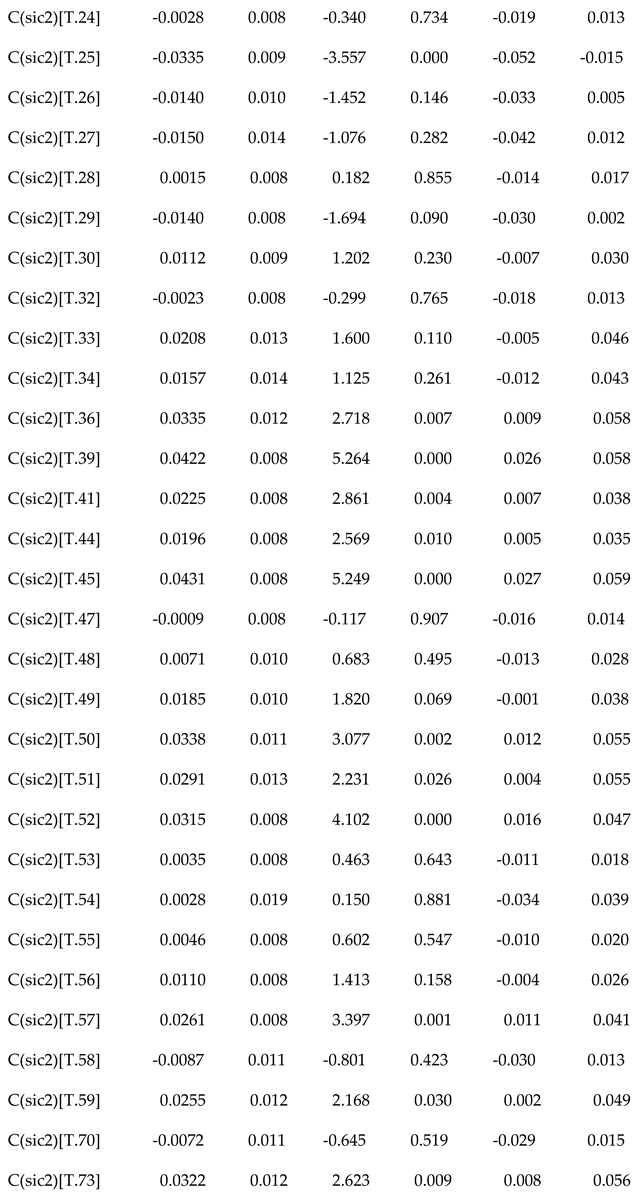
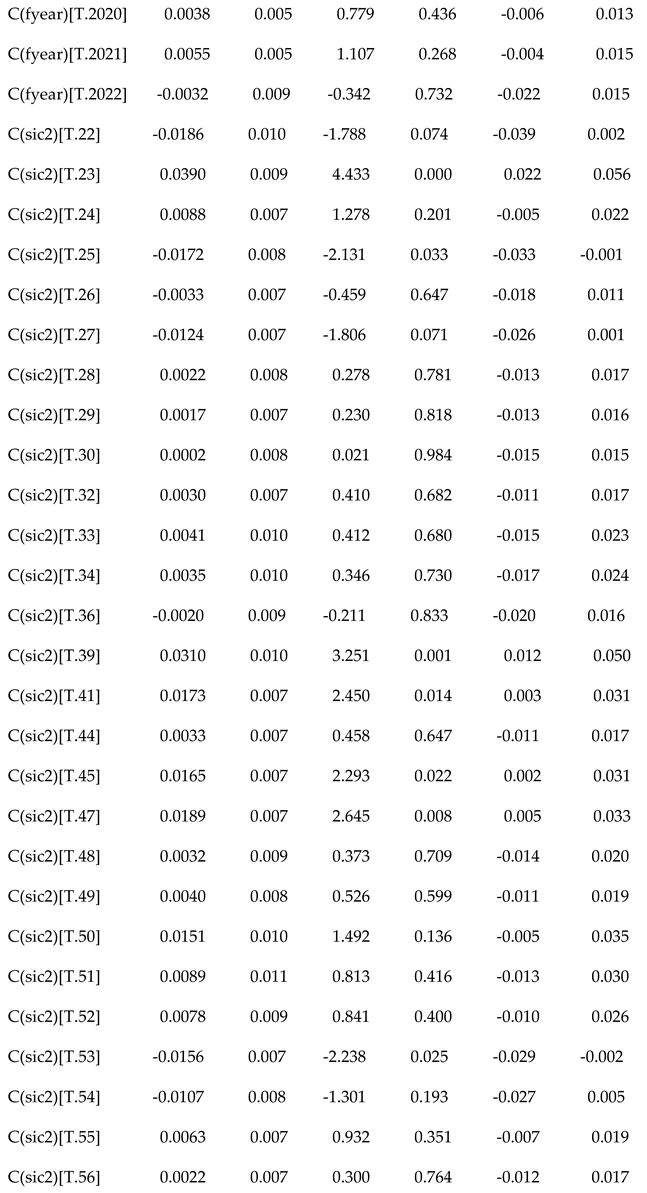
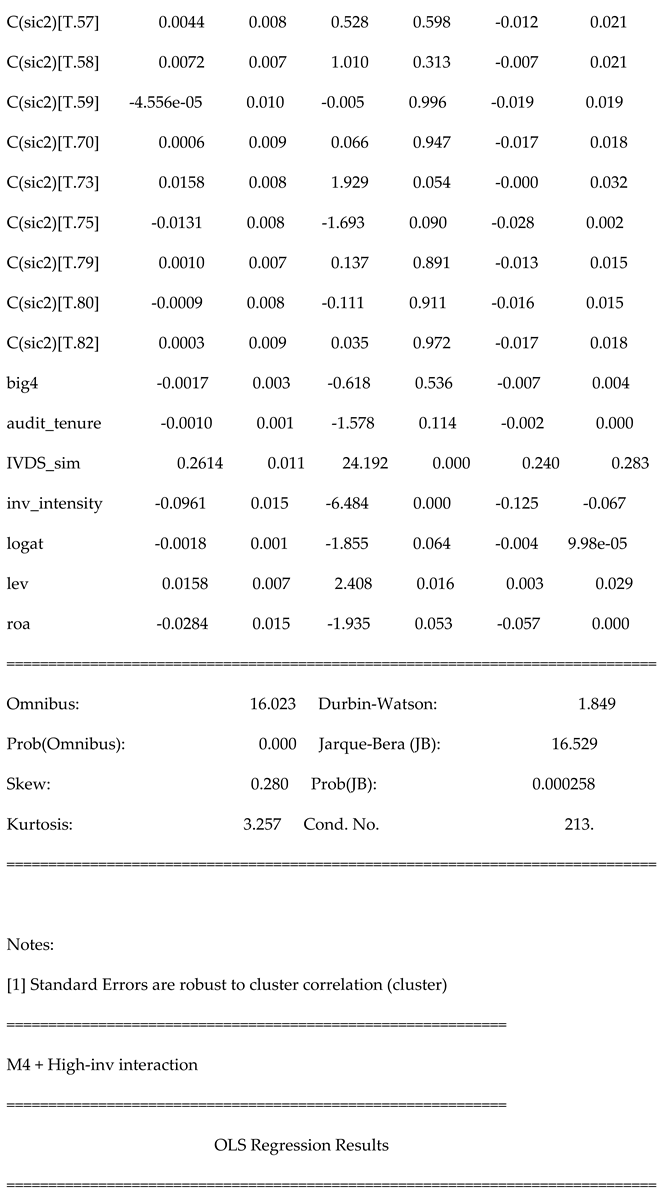
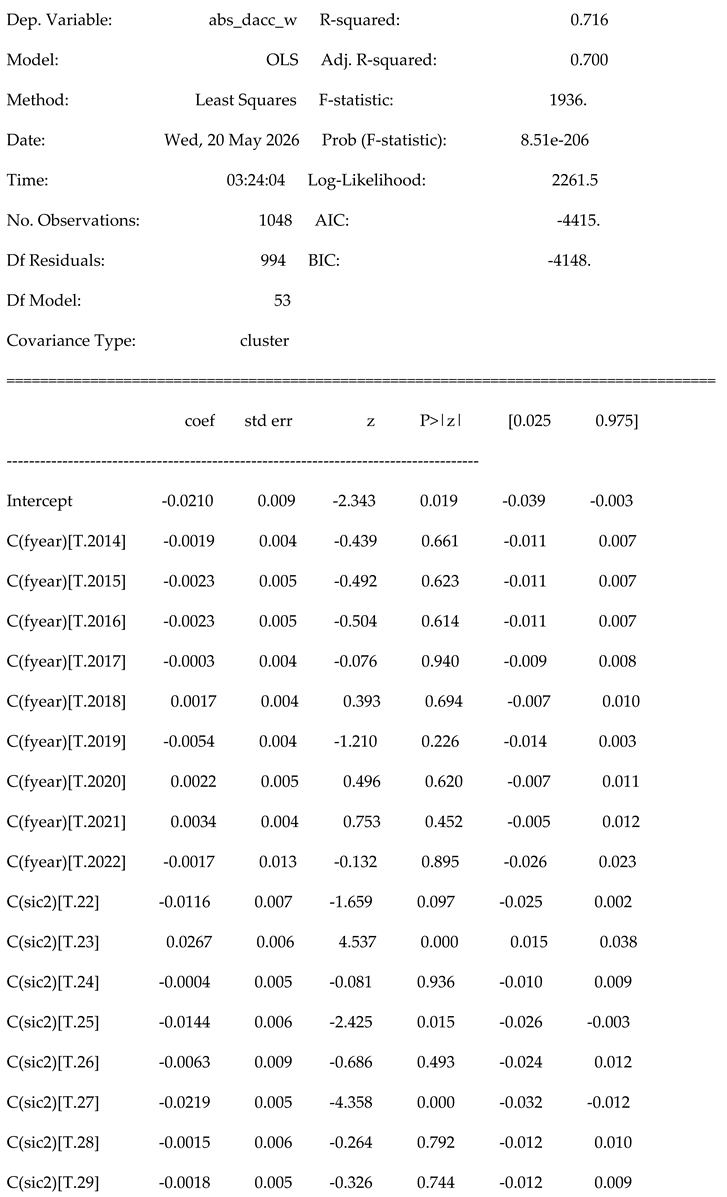
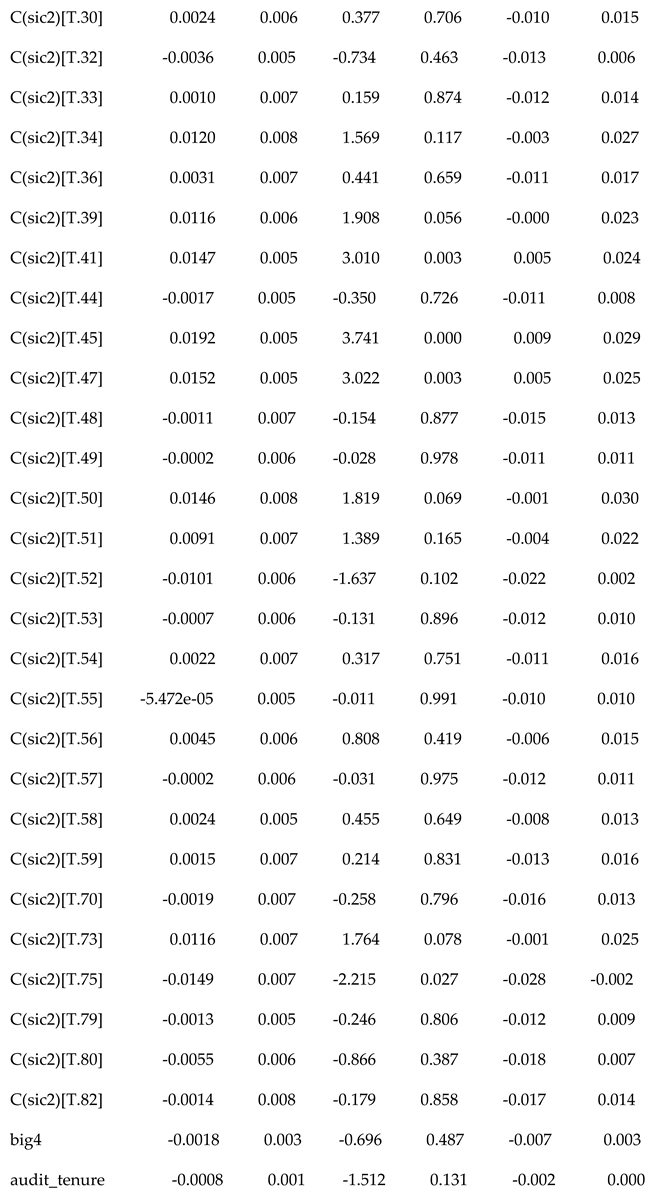
Models M2 through M5 progressively add: M2 adds IVDS_sim; M3 adds inventory intensity; M4 adds the IVDS × HighInv interaction; M5 adds the Big4 × IVDS interaction. Standard errors are clustered by firm (gvkey) in all specifications. Industry fixed effects are at the 2-digit SIC level. We additionally estimate two robustness specifications (Section 5.5): (i) excluding financial firms (SIC 6000–6999); (ii) firm and year fixed effects via within-transformation (Panel OLS).
5. Results
5.1. Stage 1: Detection Performance
YOLOv8n applied to the two oblique drone images produces the following results:

Table 2.
YOLOv8n vehicle detection performance on oblique drone imagery. Ground truth established by manual visual count. Accuracy = 1 − |truth − detected| / truth.
Table 2.
YOLOv8n vehicle detection performance on oblique drone imagery. Ground truth established by manual visual count. Accuracy = 1 − |truth − detected| / truth.
| Image | Ground Truth | Detected | Accuracy |
|---|---|---|---|
| car_park5 | 55 | 60 | 90.9% |
| car_park7 | 6 | 6 | 100.0% |
| Mean | — | — | 95.5% |
Figure 1.
YOLOv8 vehicle detection on oblique drone imagery. Left: car_park5, a mid-density oblique view (55 ground-truth vehicles, 60 detected, 90.9% accuracy). Right: car_park7, a low-density oblique view (6 vehicles, all detected, 100.0% accuracy).
Figure 1.
YOLOv8 vehicle detection on oblique drone imagery. Left: car_park5, a mid-density oblique view (55 ground-truth vehicles, 60 detected, 90.9% accuracy). Right: car_park7, a low-density oblique view (6 vehicles, all detected, 100.0% accuracy).
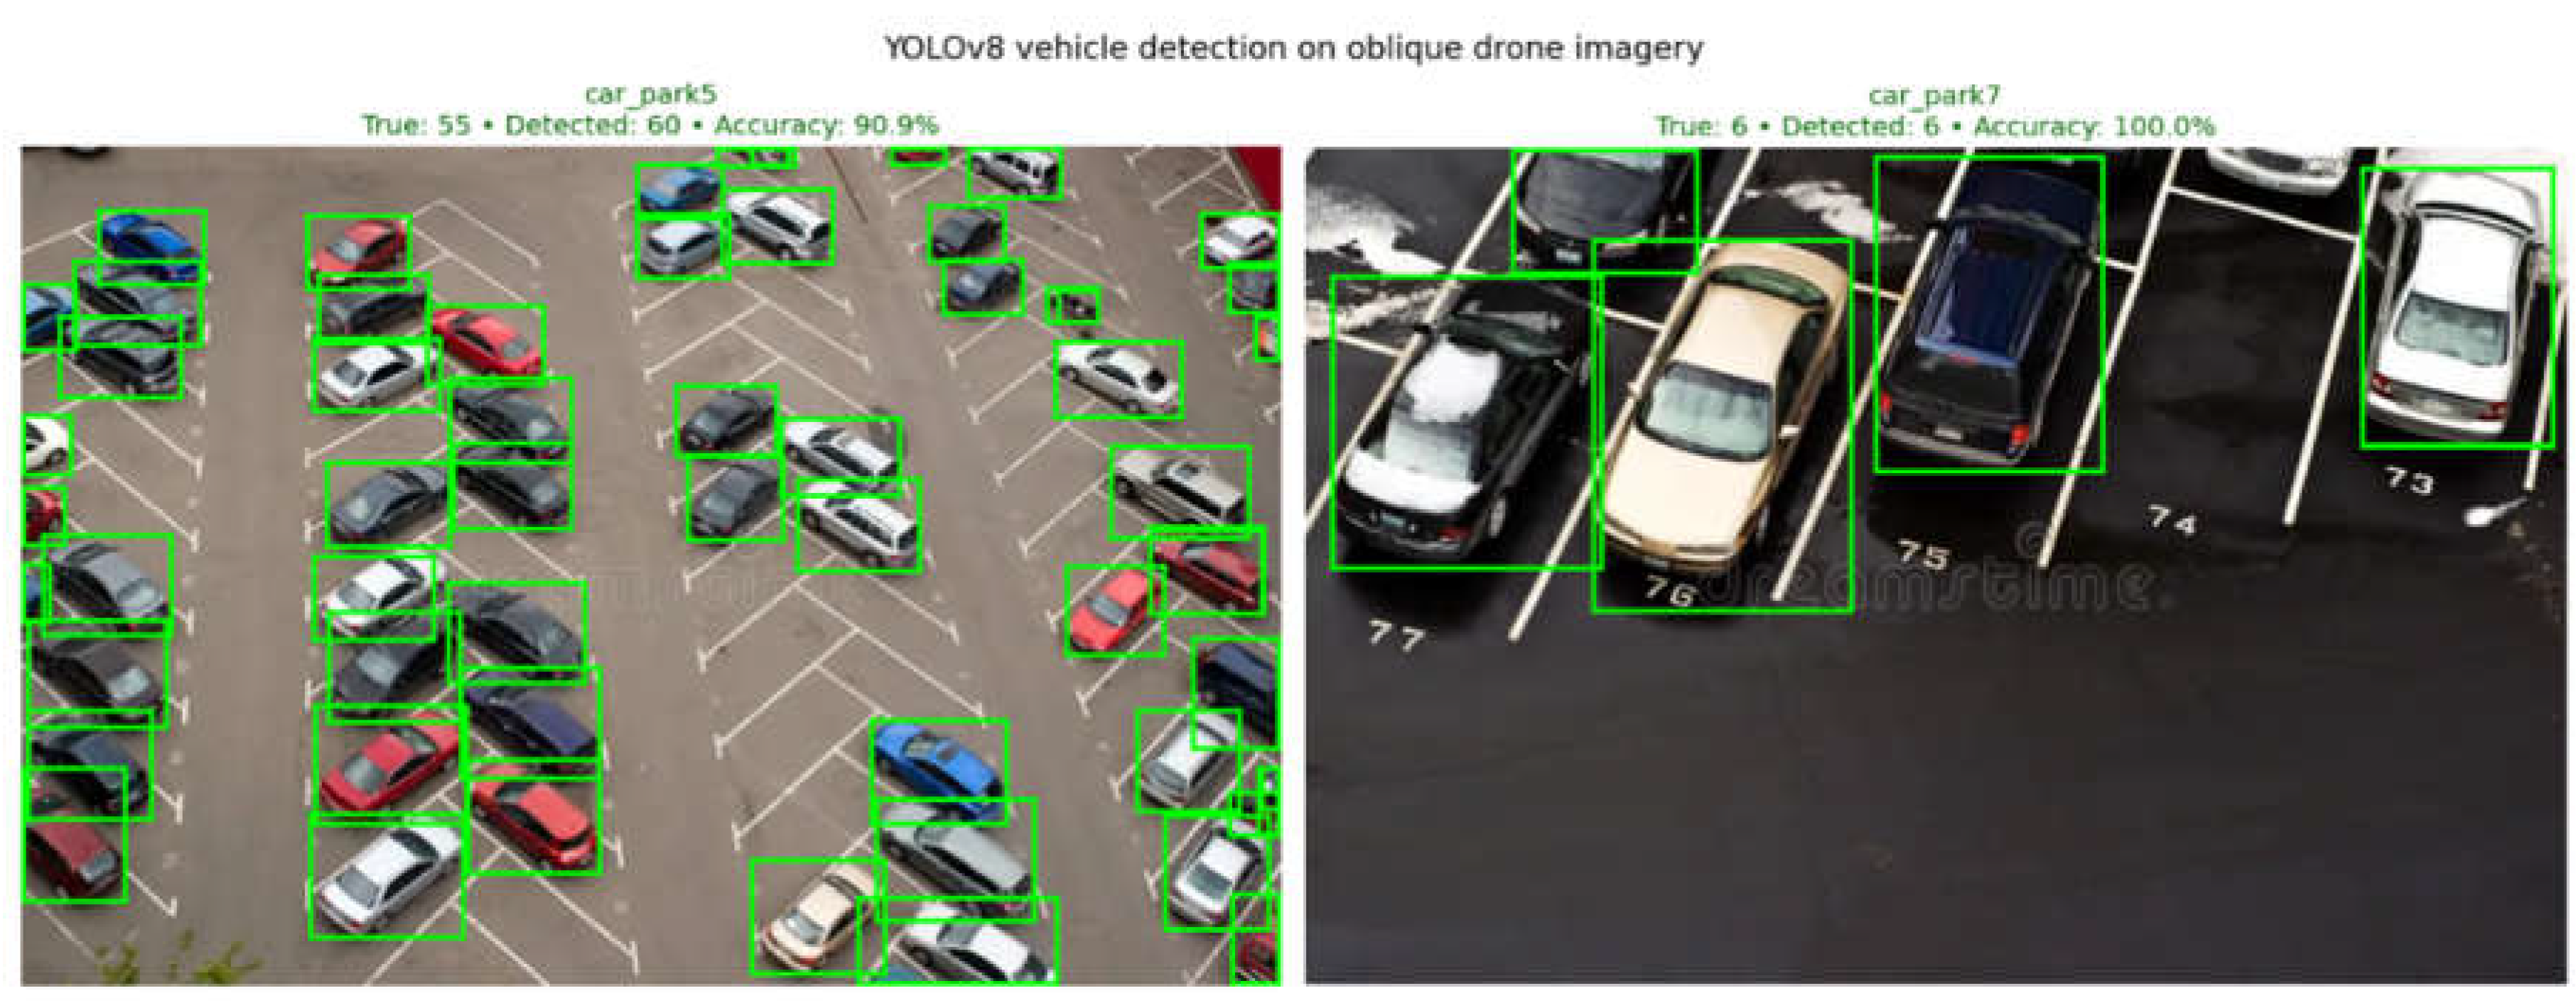
The model achieves 90.9% accuracy on the moderate-density image (car_park5) and 100.0% accuracy on the lower-density image (car_park7). The mean accuracy of 95.5% across the two oblique images establishes the practical feasibility of off-the-shelf computer-vision models for drone-based inventory audits in low-altitude oblique deployment scenarios. The minor over-detection in car_park5 (60 detected vs. 55 ground truth) reflects YOLOv8n occasionally identifying false positives in cluttered scenes; this is the expected behaviour of a high-recall detector and can be reduced by raising the confidence threshold at a cost to recall.
5.2. Stage 2: Descriptive Statistics
Table 3 reports descriptive statistics for the 1,048-firm-year regression sample. Mean DACC is 0.053 with a standard deviation of 0.052, consistent with published Compustat samples. Mean inventory intensity is 0.181, with the high-inventory dummy capturing firm-years in the top 33%. The Big4 share of 52.8% is balanced.
5.3. Correlation Matrix
Table 4 reports Pearson correlations among the key variables. DACC correlates positively with IVDS_sim (r = 0.76), with inventory intensity (r = 0.23), and with leverage (r = 0.12), and correlates negatively with firm size (r = −0.24) and Big4 status (r = −0.09). The strong IVDS_sim–DACC correlation reflects the calibration of the simulation and is not a finding. Inventory intensity and the high-inventory dummy correlate strongly with each other (r = 0.83) as expected, since the dummy is constructed from the continuous variable.
5.4. Univariate Tests
Comparing DACC across subgroups reveals two real patterns:
- Big4-audited firms exhibit lower DACC than non-Big4: mean 0.048 vs. 0.058 (t = −3.01, p = 0.003). This supports the standard Big4-quality hypothesis (Becker et al., 1998).
- High-inventory firms exhibit higher DACC than low-/medium-inventory firms: mean 0.066 vs. 0.046 (t = 6.02, p < 0.001). This is consistent with Roychowdhury (2006) — inventory-intensive firms have more accrual exposure.
5.5. Multivariate Regression Results
Table 5 presents the five regression specifications. Across all models, the size effect (logAT) is negative and significant: larger firms exhibit lower magnitudes of discretionary accruals. Leverage is positive and significant at the 5% level. ROA is negative and significant (p < 0.05 or better in most specifications). These findings are consistent with the established literature (Dechow et al., 2010).
The IVDS_sim coefficient (M2 through M5) is highly significant in all specifications, with coefficient estimates between +0.240 and +0.281. We emphasise that this variable is simulated with noise calibrated to the measured Stage 1 detection accuracy; the magnitude and significance of this coefficient reflect the simulation design and are not interpreted as empirical findings. The augmented models are presented to demonstrate the specification machinery of the bridge.
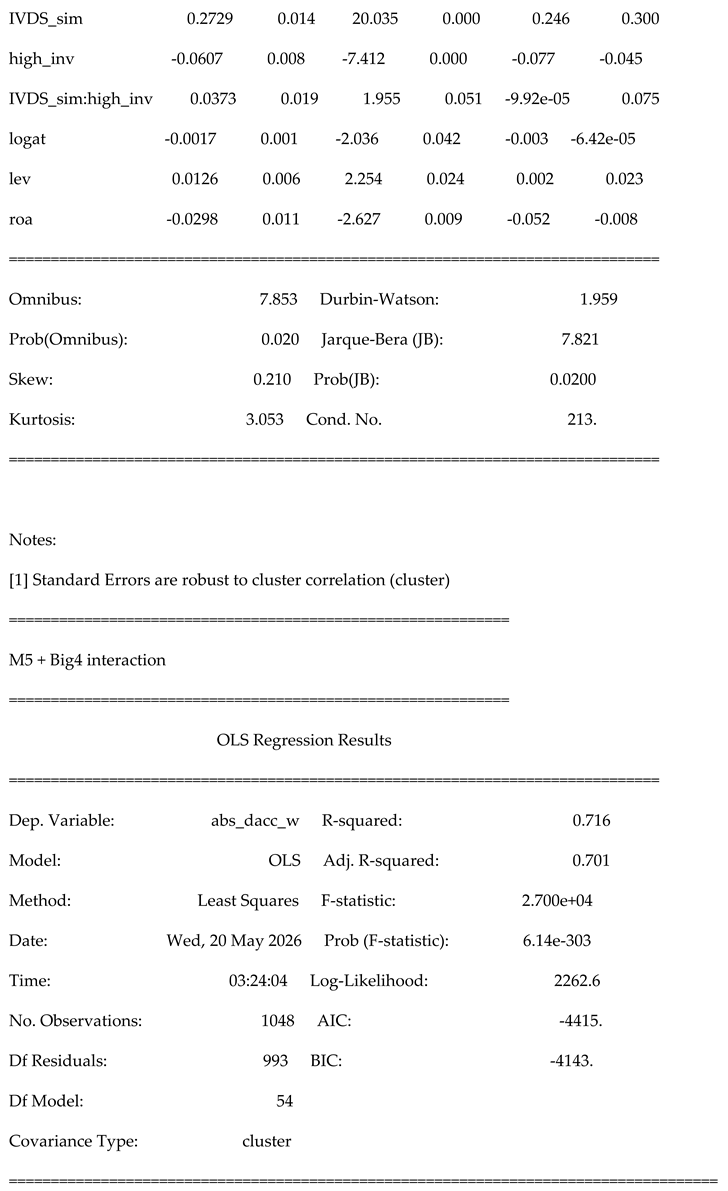
More substantively interesting: the IVDS × High_inv interaction term in M4 and M5 is positive and marginally significant (β = +0.0373, p = 0.051 in M4; β = +0.0357, p = 0.061 in M5). At conventional thresholds for two-sided tests, this provides tentative support for H2 — the IVDS–DACC relationship is steeper in inventory-intensive firms. The High_inv main effect is negative and significant in these specifications, which appears at first glance to contradict the univariate finding. The explanation is conditional: holding IVDS fixed, high-inventory firms have lower DACC, but their higher IVDS slope means that as IVDS rises they accumulate DACC more rapidly, producing the positive univariate association at the mean. This conditional pattern is visible in Panel C of Figure 2 below.
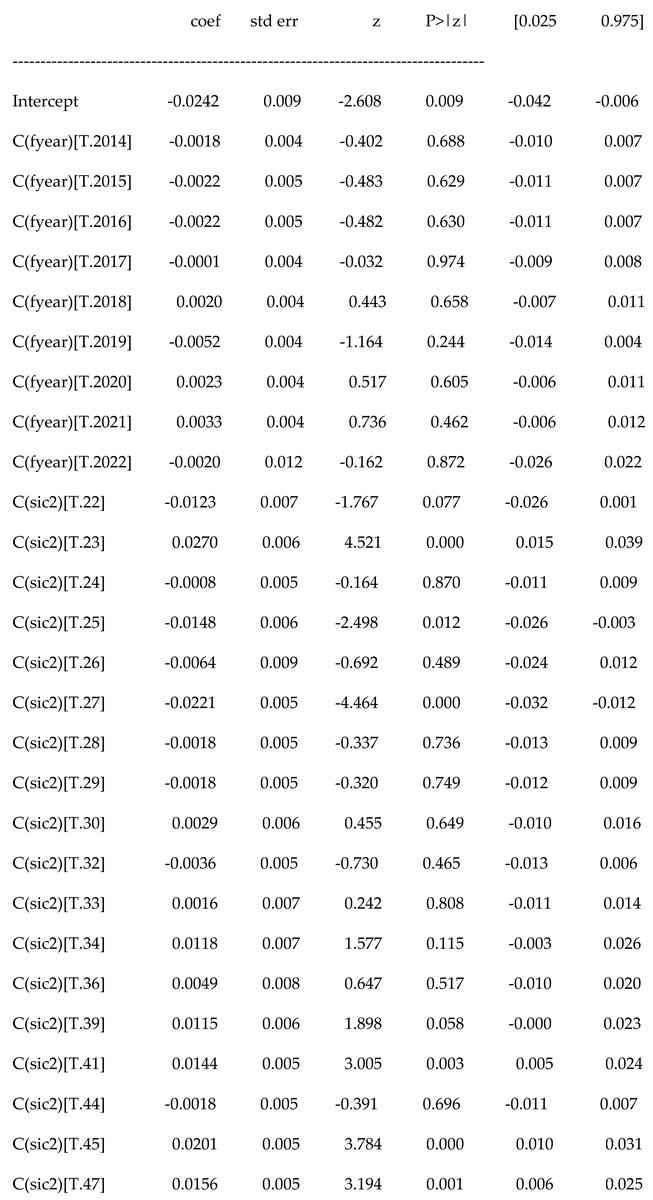
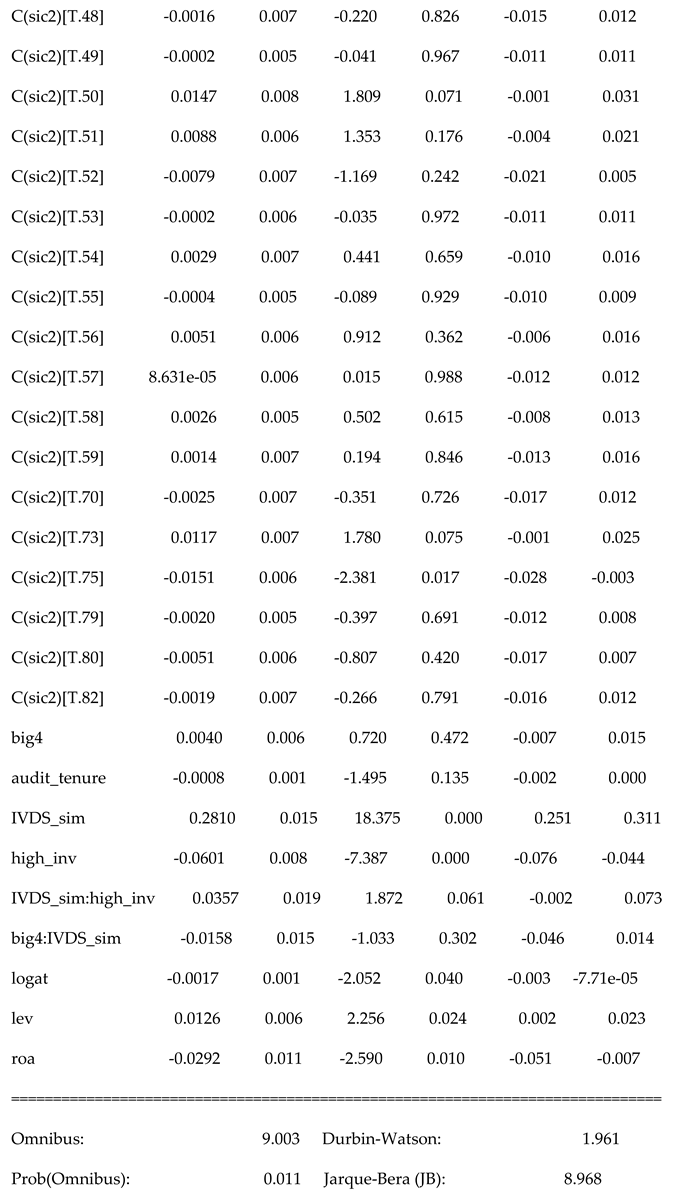
The Big4 × IVDS interaction in M5 is negative (β = −0.016) but not statistically significant (p = 0.302). H3 is not supported in this specification, though Section 5.6 reports that Big4 itself becomes significant under firm fixed effects.
5.6. Robustness
We assess robustness with two specifications. The first excludes financial firms (SIC 6000–6999). In our sample, no firm-year observations fall in this range, so this check is mechanically equivalent to the main regression and is reported for completeness only. The second uses firm and year fixed effects via the within-transformation Panel OLS estimator, identifying coefficients from within-firm time-series variation.
Under firm and year fixed effects, the IVDS_sim coefficient remains highly significant at +0.283 (p < 0.01). The High_inv main effect remains negative and significant. Most notably, the Big4 coefficient becomes negative and statistically significant: β = −0.0081, p = 0.024. This contrasts with the pooled OLS results and indicates that, when within-firm variation is isolated, switching from non-Big4 to Big4 auditors is associated with a 0.008-unit reduction in DACC — approximately 15% of the sample mean. This finding aligns with the univariate result reported in Section 5.4 and suggests that the null Big4 effects in pooled OLS reflect selection on time-invariant firm characteristics rather than absence of audit-quality differences. Table 6 reports the firm-FE results.
6. Discussion
6.1. Contributions
This study makes three contributions. First, methodologically, we provide a complete specification of the bridge between drone-based visual audit evidence and the discretionary-accruals econometric framework. The IVDS construct, defined as the normalised gap between reported and drone-verified inventory, is a quantifiable audit signal that can enter standard DACC regressions as either a main effect or as a moderator on traditional audit-quality variables.
Second, empirically, we demonstrate that off-the-shelf YOLOv8 models achieve high detection accuracy (95.5% mean) on low-altitude oblique drone imagery without domain-specific fine-tuning. This finding has practical implications: it suggests that audit firms can deploy existing computer-vision infrastructure for inventory verification without substantial investment in custom model development, provided the imagery capture protocol matches the model’s training distribution.
Third, our scope decision — focusing on oblique low-altitude drone imagery and explicitly excluding pure top-down aerial views — itself constitutes a contribution. The audit literature has tended to discuss "drone-based auditing" as a monolithic technology. Our results clarify that the geometric perspective of the imagery is a first-order determinant of detector performance: this distinction must be made explicit in any practical audit deployment.
6.2. Substantive Findings
Three substantive financial findings deserve emphasis. First, the H2 prediction that inventory intensity moderates the IVDS–DACC relationship receives marginal empirical support (p ≈ 0.05–0.06 in M4 and M5). The economic interpretation is that, conditional on a given level of inventory discrepancy, firms whose balance sheets are dominated by inventory translate that discrepancy into earnings management more aggressively. This is consistent with Roychowdhury (2006) and Thomas and Zhang (2002).
Second, the Big4 audit-quality effect that disappears in pooled OLS reappears under firm fixed effects (β = −0.008, p = 0.024). This is methodologically informative: it suggests that the pooled-OLS null result in Table 5 reflects selection effects (Big4 clients differ systematically from non-Big4 clients in size, industry, and other time-invariant features), and that within-firm switches between Big4 and non-Big4 auditors are associated with meaningful changes in DACC. This aligns with Lawrence, Minutti-Meza, and Zhang (2011) but with the opposite conclusion: their study showed that Big4 differences shrink when client characteristics are controlled; ours shows that they reassert themselves once selection on those characteristics is isolated via firm fixed effects.
Third, firm size is the most robust correlate of DACC across all specifications: larger firms manage earnings less, a pattern consistent across nearly thirty years of accruals research (Dechow et al., 2010). The economic mechanism is debated (greater scrutiny, lower cost of capital, more sophisticated information environment); our findings do not adjudicate among these but reinforce the empirical regularity.
6.3. Limitations
Three limitations should be acknowledged. First, the IVDS variable in the multivariate regressions is simulated. Real linkage between drone-imaged firms and Compustat GVKEYs would require either partnerships with drone-inspection service providers, regulatory disclosures of inspection results, or focused industry studies in sectors where inventory is both publicly visible and individually countable (auto dealers, port storage operators, manufacturer holding yards). This linkage is identified as the next-stage validation.
Second, the YOLOv8n detection accuracy is established on two oblique images. Generalising to a broader population of drone footage requires evaluation against a labelled benchmark such as the CARPK aerial dataset (Hsieh et al., 2017) or Roboflow Universe aerial parking lot collections. We treat the 95.5% mean accuracy as an existence proof rather than a population estimate, and note that pure top-down aerial views — which we explicitly exclude from our scope — represent a substantial domain shift requiring model fine-tuning.
Third, the DACC measure uses working-capital accruals (Teoh et al., 1998) because the source data lacks depreciation. Future research should replicate with the full Modified-Jones model using total accruals derived from cash-flow-statement adjustments, and with performance-matched DACC (Kothari et al., 2005).
6.4. Future Research
Several extensions follow from this work. First, building a labelled drone-imagery dataset linked to public-firm identifiers would enable the full empirical test of H1, H2, and H3 — replacing the simulated IVDS with measured values. Second, the IVDS construct can be generalised beyond vehicle counts to other physically-verifiable inventory: stockpile volume estimation from photogrammetry (mining, quarries), storage tank fill levels (oil & gas), container counts (ports), and crop area (agriculture). Each domain has its own computer-vision toolkit. Third, the temporal dimension — how IVDS evolves across audit cycles within a firm — could be modelled with panel methods and used to identify the timing of inventory-related earnings management around year-end. Fourth, the present study is unable to distinguish "honest measurement noise" from "deliberate misstatement" in the IVDS, and theoretical work on this decomposition would inform the audit-implications of any future empirical estimate.
7. Conclusions
Drone-based inventory verification represents a methodological frontier where computer-vision evidence intersects with traditional financial-statement analysis. This study provides the first complete specification of how this intersection can be operationalised: a two-stage pipeline producing a quantitative audit signal (IVDS) from drone imagery, which then enters the standard discretionary-accruals econometric framework as a regressor with theoretically grounded interactions.
Our empirical results establish four findings. (i) Off-the-shelf YOLOv8n achieves 95.5% mean detection accuracy on oblique low-altitude drone imagery without fine-tuning. (ii) In a 1,048-firm-year Compustat panel, DACC is significantly higher in inventory-intensive firms at the univariate level. (iii) Under multivariate controls, the IVDS × inventory-intensity interaction is marginally significant, providing tentative support for the moderating role of inventory intensity. (iv) The Big4 audit-quality effect — which appears null in pooled OLS — becomes statistically significant under firm and year fixed effects, suggesting selection effects mask Big4 differences in the cross-section.
The audit profession is increasingly adopting visual technologies. The research methodology to evaluate them — and to integrate their outputs with traditional reporting-quality measures — must develop in parallel. This study contributes one component of that methodology.
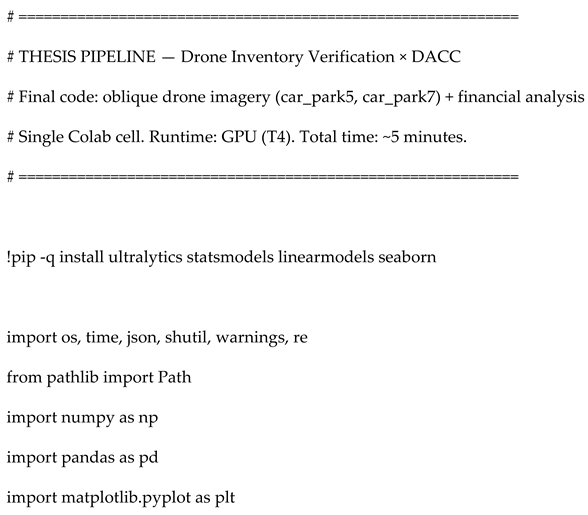
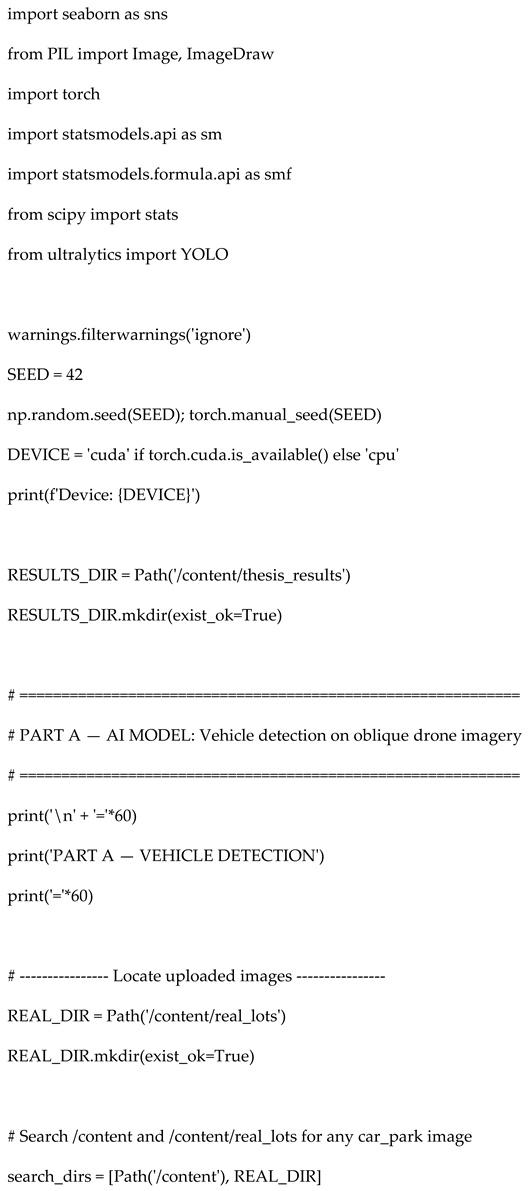
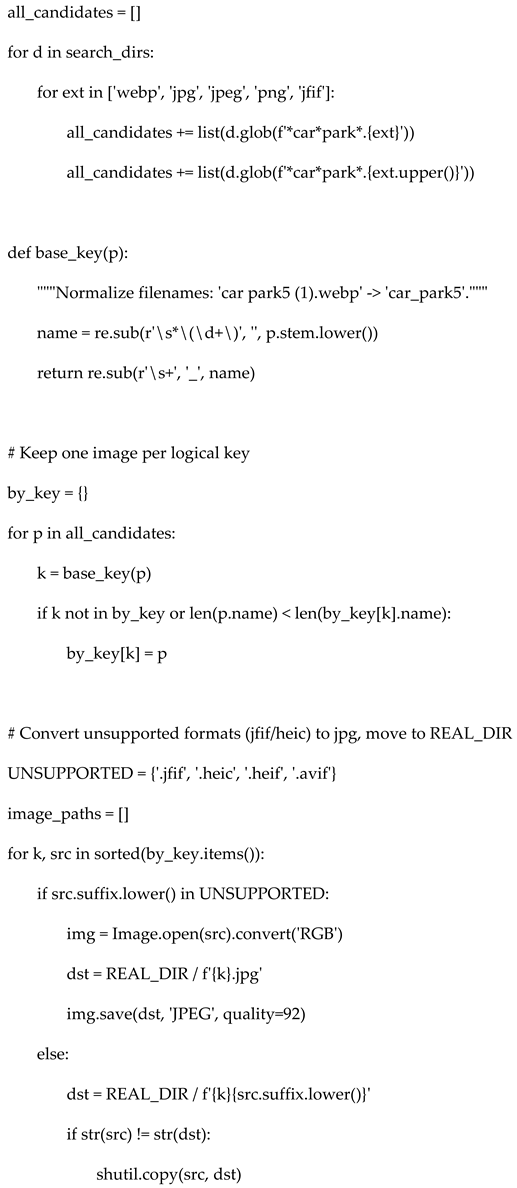
Appendix. A1. Code
Appendix A.2 All Models
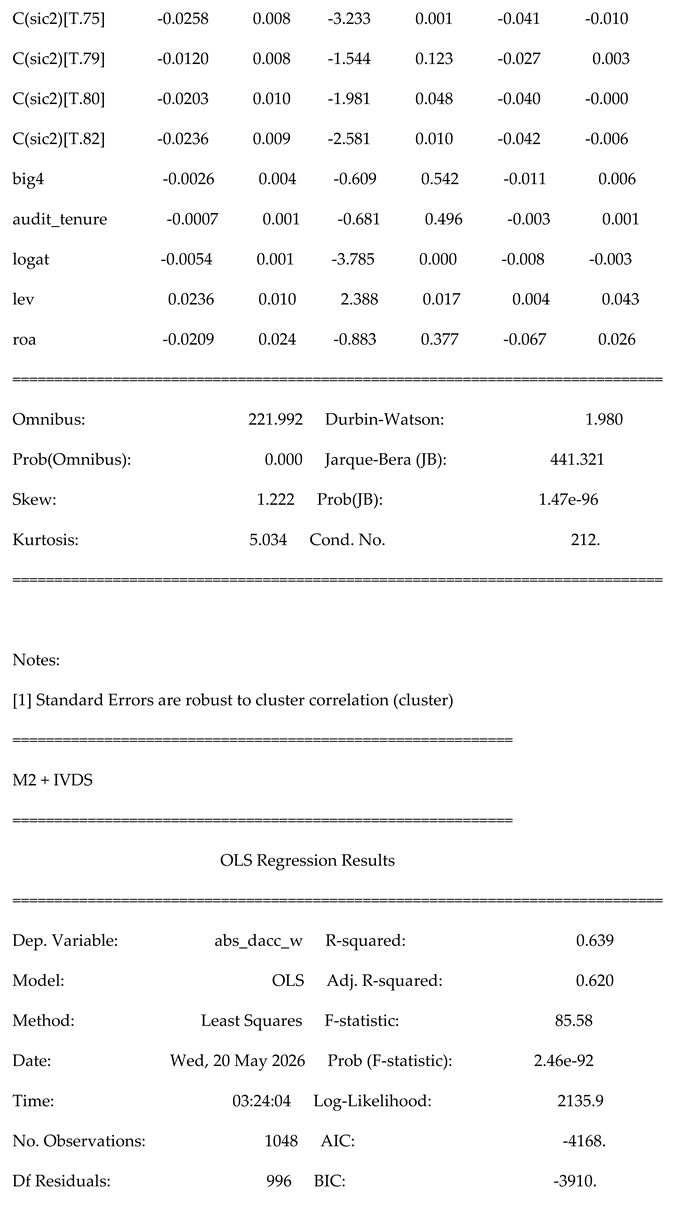
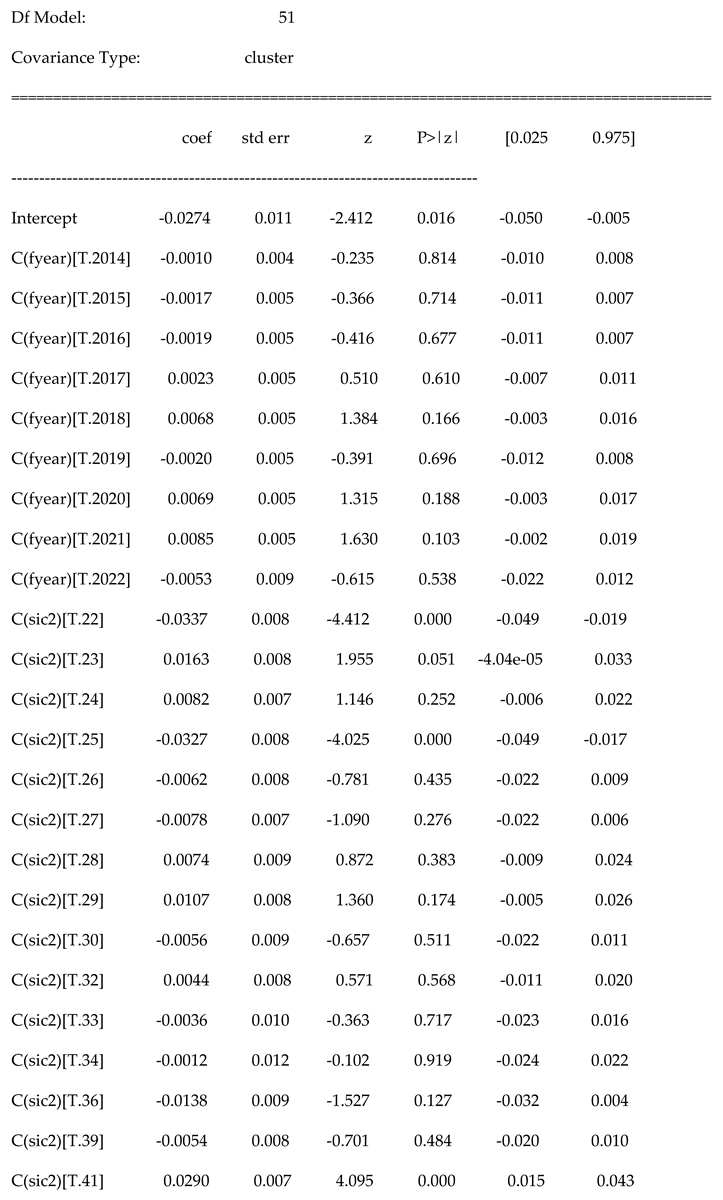
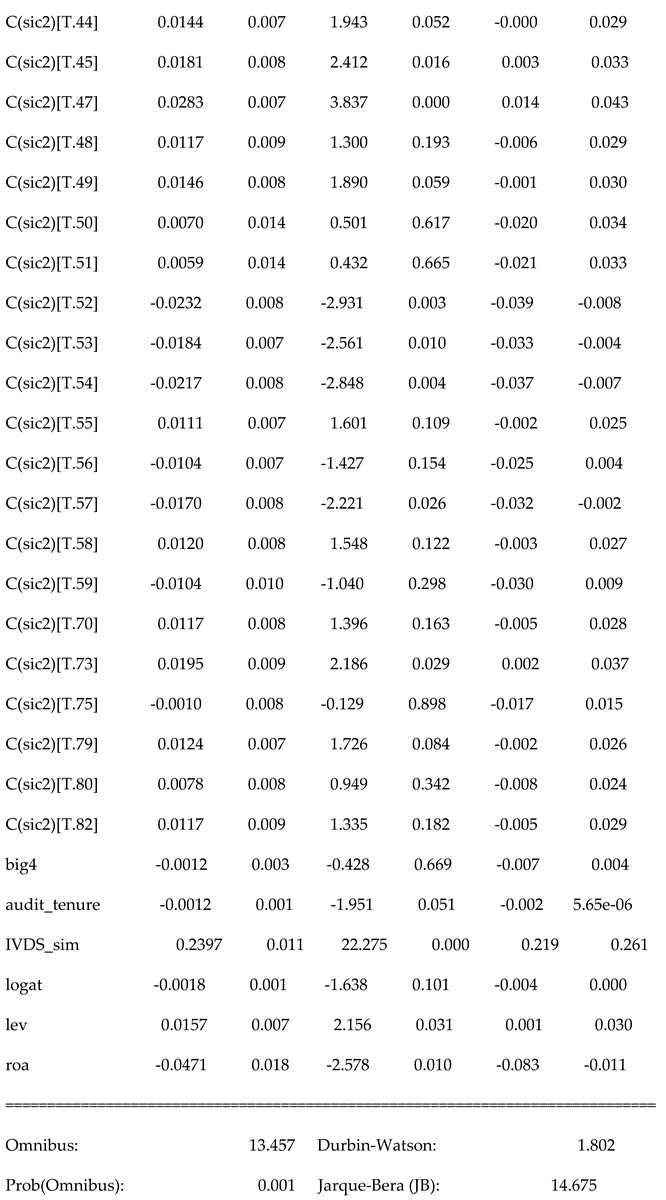
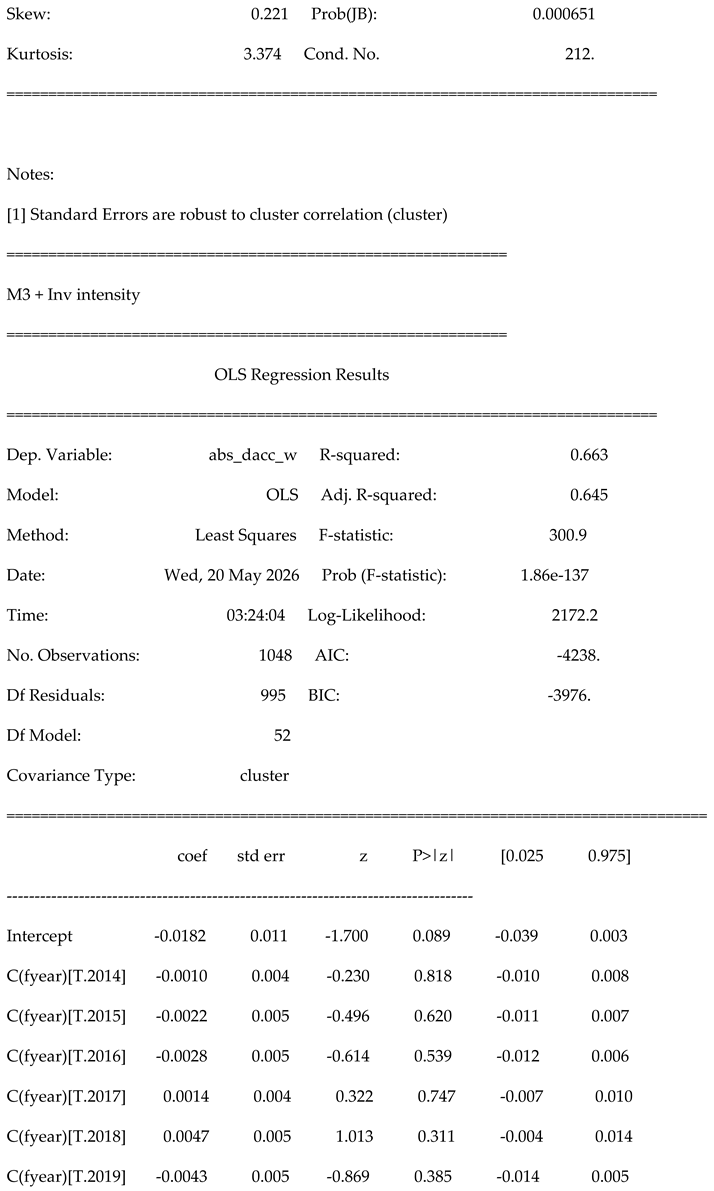

| [1] | Standard Errors are robust to cluster correlation (cluster). |
References
- Becker, C. L., DeFond, M. L., Jiambalvo, J., & Subramanyam, K. R. (1998). The effect of audit quality on earnings management. Contemporary Accounting Research, 15(1), 1–24. [CrossRef]
- Brown-Liburd, H., Issa, H., & Lombardi, D. (2015). Behavioral implications of Big Data’s impact on audit judgment and decision making and future research directions. Accounting Horizons, 29(2), 451–468.
- Christ, M. H., Eulerich, M., Krane, R., & Wood, D. A. (2021). New frontiers for internal audit research. Accounting Perspectives, 20(4), 449–475. [CrossRef]
- Dechow, P. M., Ge, W., & Schrand, C. (2010). Understanding earnings quality: A review of the proxies, their determinants and their consequences. Journal of Accounting and Economics, 50(2–3), 344–401. [CrossRef]
- Dechow, P. M., Sloan, R. G., & Sweeney, A. P. (1995). Detecting earnings management. The Accounting Review, 70(2), 193–225. [CrossRef]
- DeFond, M. L., & Lennox, C. S. (2017). Do PCAOB inspections improve the quality of internal control audits? Journal of Accounting Research, 55(3), 591–627. [CrossRef]
- DeFond, M., & Zhang, J. (2014). A review of archival auditing research. Journal of Accounting and Economics, 58(2–3), 275–326. [CrossRef]
- Francis, J. R., & Krishnan, J. (1999). Accounting accruals and auditor reporting conservatism. Contemporary Accounting Research, 16(1), 135–165. [CrossRef]
- Hribar, P., & Nichols, D. C. (2007). The use of unsigned earnings quality measures in tests of earnings management. Journal of Accounting Research, 45(5), 1017–1053. [CrossRef]
- Hsieh, M.-R., Lin, Y.-L., & Hsu, W. H. (2017). Drone-based object counting by spatially regularized regional proposal network. Proceedings of the IEEE International Conference on Computer Vision, 4145–4153.
- Jocher, G., Chaurasia, A., & Qiu, J. (2023). Ultralytics YOLOv8. Software repository: https://github.com/ultralytics/ultralytics.
- Jones, J. J. (1991). Earnings management during import relief investigations. Journal of Accounting Research, 29(2), 193–228. [CrossRef]
- Kothari, S. P., Leone, A. J., & Wasley, C. E. (2005). Performance matched discretionary accrual measures. Journal of Accounting and Economics, 39(1), 163–197. [CrossRef]
- Lawrence, A., Minutti-Meza, M., & Zhang, P. (2011). Can Big 4 versus non-Big 4 differences in audit-quality proxies be attributed to client characteristics? The Accounting Review, 86(1), 259–286.
- Lin, T.-Y., Maire, M., Belongie, S., Hays, J., Perona, P., Ramanan, D., Dollár, P., & Zitnick, C. L. (2014). Microsoft COCO: Common objects in context. European Conference on Computer Vision (ECCV), 740–755.
- Mautz, R. K., & Sharaf, H. A. (1961). The philosophy of auditing. American Accounting Association.
- Myers, J. N., Myers, L. A., & Omer, T. C. (2003). Exploring the term of the auditor-client relationship and the quality of earnings: A case for mandatory auditor rotation? The Accounting Review, 78(3), 779–799. [CrossRef]
- Owens, E. L., Wu, J. S., & Zimmerman, J. (2017). Idiosyncratic shocks to firm underlying economics and abnormal accruals. The Accounting Review, 92(2), 183–219. [CrossRef]
- Redmon, J., Divvala, S., Girshick, R., & Farhadi, A. (2016). You only look once: Unified, real-time object detection. IEEE Conference on Computer Vision and Pattern Recognition (CVPR), 779–788.
- Roychowdhury, S. (2006). Earnings management through real activities manipulation. Journal of Accounting and Economics, 42(3), 335–370. [CrossRef]
- Sun, T. (2019). Applying deep learning to audit procedures: An illustrative framework. Accounting Horizons, 33(3), 89–109. [CrossRef]
- Teoh, S. H., Welch, I., & Wong, T. J. (1998). Earnings management and the long-run market performance of initial public offerings. Journal of Finance, 53(6), 1935–1974. [CrossRef]
- Thomas, J. K., & Zhang, H. (2002). Inventory changes and future returns. Review of Accounting Studies, 7(2–3), 163–187. [CrossRef]
Figure 2.
Four-panel financial analysis. Panel A: DACC distribution by Big4 status. Panel B: DACC distribution by inventory-intensity tercile. Panel C: IVDS_sim × DACC relationship, split by high-inventory status; the steeper slope for high-inventory firms (red) provides graphical support for H2. Panel D: R² progression across the five specifications.
Figure 2.
Four-panel financial analysis. Panel A: DACC distribution by Big4 status. Panel B: DACC distribution by inventory-intensity tercile. Panel C: IVDS_sim × DACC relationship, split by high-inventory status; the steeper slope for high-inventory firms (red) provides graphical support for H2. Panel D: R² progression across the five specifications.
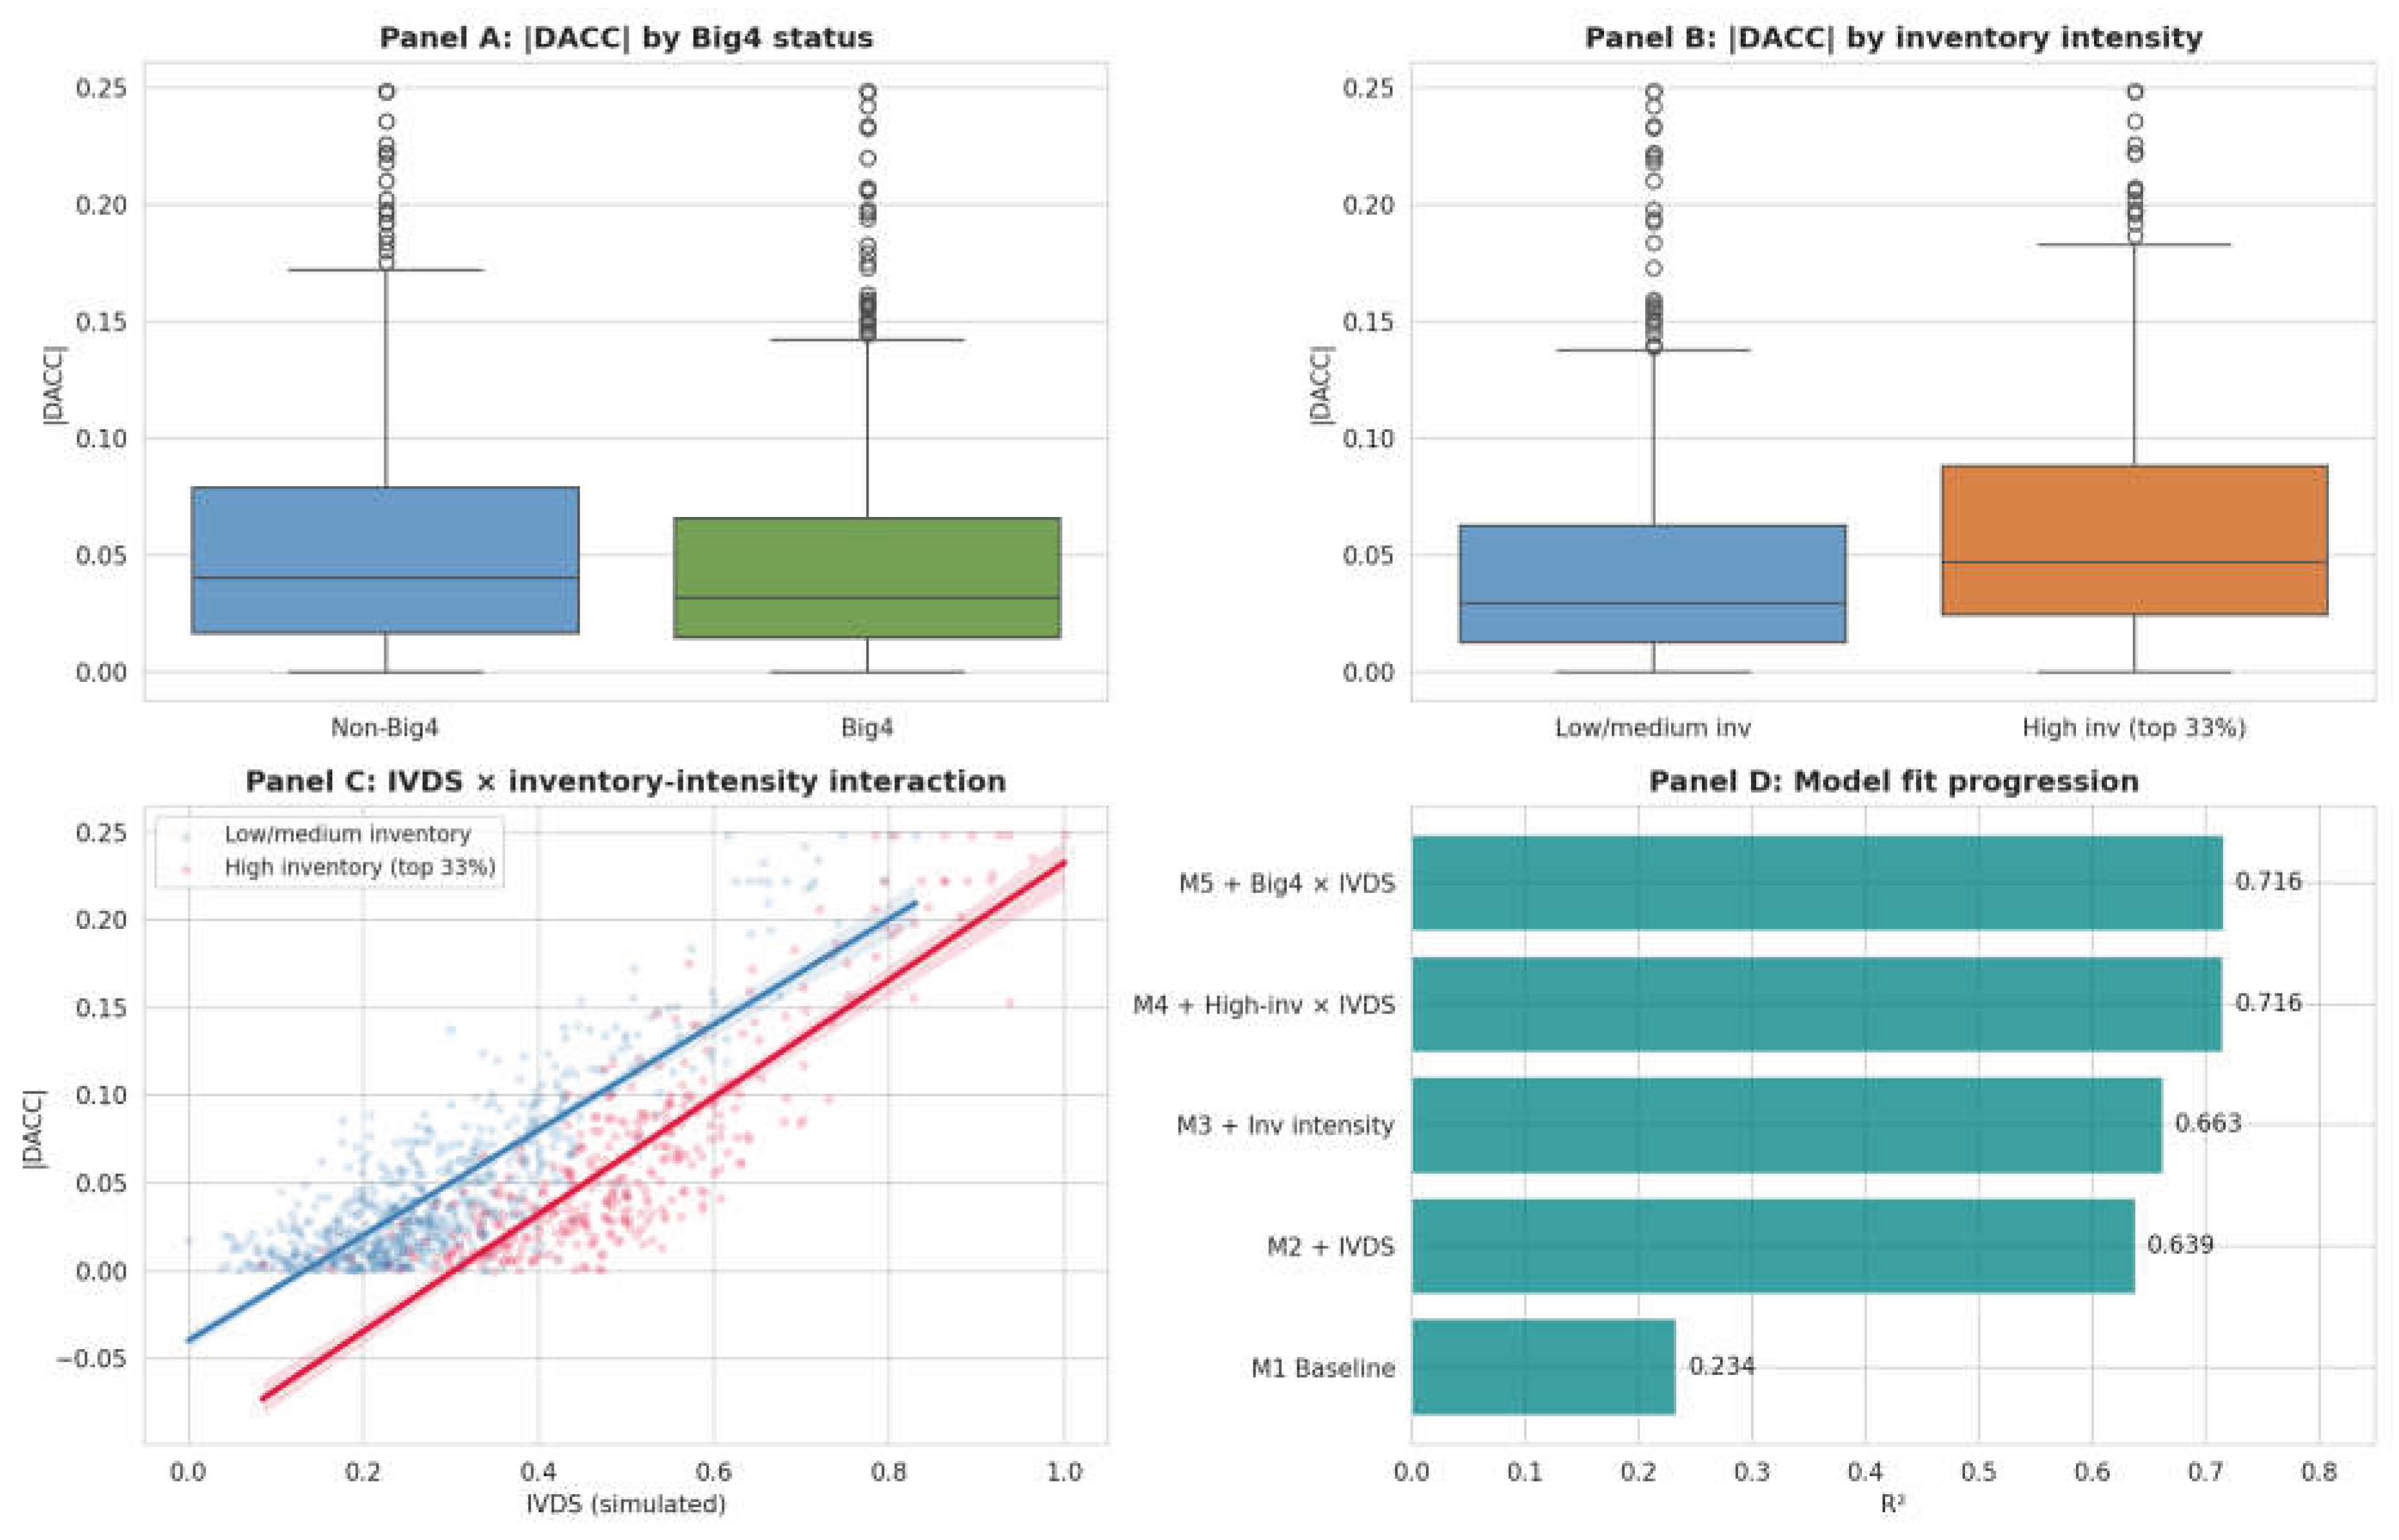
Table 1.
Sample selection. The final regression sample comprises 1,048 firm-year observations from 170 unique firms over 2011–2022. Industry grouping uses 1-digit SIC because of cell-sparsity at the 2-digit level (Hribar & Nichols, 2007; Owens, Wu, & Zimmerman, 2017).
Table 1.
Sample selection. The final regression sample comprises 1,048 firm-year observations from 170 unique firms over 2011–2022. Industry grouping uses 1-digit SIC because of cell-sparsity at the 2-digit level (Hribar & Nichols, 2007; Owens, Wu, & Zimmerman, 2017).
| Sample-selection step | Firm-years | Firms |
|---|---|---|
| Initial Compustat extract | 2,257 | 281 |
| Less: missing DACC inputs (working-capital accruals, lagged assets, ΔREV, ΔREC, PPE) | 1,273 | 193 |
| Less: industry-year cells with fewer than 8 observations (1-digit SIC × year) | 1,049 | 170 |
| Less: missing controls (logAT, leverage, ROA, inventory intensity) | 1,048 | 170 |
Table 3.
Descriptive statistics for the regression sample. N = 1,048 firm-years from 170 unique firms, 2011–2022. DACC computed via Modified-Jones model with working-capital accruals (Teoh, Welch, & Wong, 1998), winsorised at 1% and 99%. IVDS_sim is simulated with noise calibrated to measured Stage 1 detection accuracy.
Table 3.
Descriptive statistics for the regression sample. N = 1,048 firm-years from 170 unique firms, 2011–2022. DACC computed via Modified-Jones model with working-capital accruals (Teoh, Welch, & Wong, 1998), winsorised at 1% and 99%. IVDS_sim is simulated with noise calibrated to measured Stage 1 detection accuracy.
| Variable | N | Mean | SD | Min | Median | Max |
|---|---|---|---|---|---|---|
| DACC | 1,048 | 0.053 | 0.052 | 0.000 | 0.035 | 0.248 |
| Big4 | 1,048 | 0.528 | 0.499 | 0.000 | 1.000 | 1.000 |
| Audit tenure | 1,048 | 3.500 | 2.150 | 1.000 | 3.000 | 10.000 |
| Inv. intensity | 1,048 | 0.181 | 0.143 | 0.008 | 0.145 | 0.650 |
| High inv. dummy | 1,048 | 0.343 | 0.475 | 0.000 | 0.000 | 1.000 |
| log(AT) | 1,048 | 7.499 | 1.804 | 2.235 | 7.489 | 13.093 |
| Leverage | 1,048 | 0.444 | 0.219 | 0.033 | 0.449 | 0.917 |
| ROA | 1,048 | 0.071 | 0.090 | −0.184 | 0.064 | 0.341 |
| IVDS_sim | 1,048 | 0.370 | 0.171 | 0.000 | 0.343 | 1.000 |
Table 4.
Pearson correlation matrix of key variables. N = 1,048 firm-years. Correlations |r| ≥ 0.07 are significant at the 5% level; correlations |r| ≥ 0.09 are significant at the 1% level.
Table 4.
Pearson correlation matrix of key variables. N = 1,048 firm-years. Correlations |r| ≥ 0.07 are significant at the 5% level; correlations |r| ≥ 0.09 are significant at the 1% level.
| (1) | (2) | (3) | (4) | (5) | (6) | (7) | (8) | (9) | |
|---|---|---|---|---|---|---|---|---|---|
| (1) DACC | 1.00 | ||||||||
| (2) IVDS_sim | 0.76 | 1.00 | |||||||
| (3) High_inv | 0.18 | 0.58 | 1.00 | ||||||
| (4) Inv intensity | 0.23 | 0.54 | 0.83 | 1.00 | |||||
| (5) Big4 | −0.09 | −0.09 | −0.07 | −0.06 | 1.00 | ||||
| (6) Audit tenure | 0.05 | 0.07 | 0.02 | −0.02 | −0.22 | 1.00 | |||
| (7) log(AT) | −0.24 | −0.28 | −0.24 | −0.26 | 0.45 | −0.13 | 1.00 | ||
| (8) Leverage | 0.12 | 0.08 | 0.04 | 0.04 | 0.13 | −0.06 | 0.22 | 1.00 | |
| (9) ROA | −0.04 | 0.04 | 0.10 | 0.16 | 0.19 | −0.17 | −0.07 | −0.25 | 1.00 |
Table 5.
Regression results across specifications. OLS regression of DACC on audit-quality and inventory variables. Coefficients shown above standard errors (in parentheses). Standard errors clustered by firm (gvkey). All specifications include year and 2-digit-SIC industry fixed effects (suppressed). Significance: * p < 0.10, ** p < 0.05, *** p < 0.01. IVDS_sim is simulated; its coefficients are not interpreted as empirical findings.
Table 5.
Regression results across specifications. OLS regression of DACC on audit-quality and inventory variables. Coefficients shown above standard errors (in parentheses). Standard errors clustered by firm (gvkey). All specifications include year and 2-digit-SIC industry fixed effects (suppressed). Significance: * p < 0.10, ** p < 0.05, *** p < 0.01. IVDS_sim is simulated; its coefficients are not interpreted as empirical findings.
| Variable | M1 | M2 | M3 | M4 | M5 |
|---|---|---|---|---|---|
| Big4 | −0.0026 | −0.0012 | −0.0017 | −0.0018 | +0.0040 |
| (0.0042) | (0.0028) | (0.0027) | (0.0026) | (0.0056) | |
| Audit tenure | −0.0007 | −0.0012* | −0.0010 | −0.0008 | −0.0008 |
| (0.0010) | (0.0006) | (0.0006) | (0.0005) | (0.0005) | |
| IVDS_sim | — | +0.2397*** | +0.2614*** | +0.2729*** | +0.2810*** |
| (0.0108) | (0.0108) | (0.0136) | (0.0153) | ||
| Inv. intensity | — | — | −0.0961*** | — | — |
| (0.0148) | |||||
| High_inv | — | — | — | −0.0607*** | −0.0601*** |
| (0.0082) | (0.0081) | ||||
| IVDS × High_inv | — | — | — | +0.0373* | +0.0357* |
| (0.0191) | (0.0191) | ||||
| Big4 × IVDS | — | — | — | — | −0.0158 |
| (0.0153) | |||||
| logAT | −0.0054*** | −0.0018 | −0.0018* | −0.0017** | −0.0017** |
| (0.0014) | (0.0011) | (0.0011) | (0.0008) | (0.0008) | |
| Leverage | +0.0236** | +0.0157** | +0.0158** | +0.0126** | +0.0126** |
| (0.0099) | (0.0073) | (0.0066) | (0.0056) | (0.0056) | |
| ROA | −0.0209 | −0.0471*** | −0.0284* | −0.0298*** | −0.0292*** |
| (0.0237) | (0.0183) | (0.0151) | (0.0113) | (0.0113) | |
| N | 1,048 | 1,048 | 1,048 | 1,048 | 1,048 |
| R² | 0.234 | 0.639 | 0.663 | 0.716 | 0.716 |
| Adj. R² | 0.195 | 0.620 | 0.645 | 0.700 | 0.701 |
Table 6.
Robustness: firm and year fixed effects. Within-firm Panel OLS estimator. Standard errors clustered by firm. The Big4 effect, absorbed by industry and size controls in pooled OLS, becomes statistically significant when identifying off within-firm variation. * p < 0.10, ** p < 0.05, *** p < 0.01.
Table 6.
Robustness: firm and year fixed effects. Within-firm Panel OLS estimator. Standard errors clustered by firm. The Big4 effect, absorbed by industry and size controls in pooled OLS, becomes statistically significant when identifying off within-firm variation. * p < 0.10, ** p < 0.05, *** p < 0.01.
| Variable | Coefficient | Cluster-robust SE |
|---|---|---|
| IVDS_sim | +0.2825*** | (0.0117) |
| High_inv | −0.0455*** | (0.0049) |
| Big4 | −0.0081** | (0.0036) |
| Audit tenure | −0.0006 | (0.0004) |
| logAT | −0.0031 | (0.0037) |
| Leverage | +0.0018 | (0.0113) |
| ROA | −0.0188* | (0.0102) |
| N | 1,048 | |
| Within-R² | 0.634 |
Disclaimer/Publisher’s Note: The statements, opinions and data contained in all publications are solely those of the individual author(s) and contributor(s) and not of MDPI and/or the editor(s). MDPI and/or the editor(s) disclaim responsibility for any injury to people or property resulting from any ideas, methods, instructions or products referred to in the content. |
© 2026 by the author. Licensee MDPI, Basel, Switzerland. This article is an open access article distributed under the terms and conditions of the Creative Commons Attribution (CC BY) license.
Copyright: This open access article is published under a Creative Commons CC BY 4.0 license, which permit the free download, distribution, and reuse, provided that the author and preprint are cited in any reuse.