

Submitted:
30 June 2026
Posted:
01 July 2026
You are already at the latest version
Abstract
Background: Imeglimin is a novel oral antidiabetic agent that improves mitochondrial function and glucose metabolism in patients with type 2 diabetes mellitus (T2DM). Its effects on liver enzymes remain unclear. We investigated the effects of imeglimin on hepatic biomarkers, particularly γ-glutamyl transpeptidase (γ-GTP), and the reversibility of these changes after treatment discontinuation. Methods: This post-hoc analysis of the prospective INFINITY Study included 25 patients with T2DM who completed 6 months of imeglimin treatment followed by a 3-month withdrawal period. Clinical parameters were averaged within predefined 3-month study phases. Treatment responses and withdrawal rebounds were analyzed. Results: Imeglimin significantly improved glycemic control. The geometric mean γ-GTP decreased from 36.2 (27.1–48.4) U/L during the Baseline Phase to 31.1 (23.5–41.1) U/L during the Late Treatment Phase (P < 0.05). Aspartate aminotransferase (AST) and alanine aminotransferase (ALT) also showed downward trends, although these changes were not statistically significant. During the Withdrawal Phase, γ-GTP returned to 35.6 (26.4–48.5) U/L (P < 0.05 vs. Late Treatment Phase). Patients with baseline γ-GTP >50 U/L showed larger but non-significant changes. Treatment response and withdrawal rebound were inversely correlated (r = −0.480, P = 0.015). Only total cholesterol correlated with γ-GTP during both treatment (r = 0.554, P = 0.005) and withdrawal (r = 0.450, P = 0.024). Conclusions: Imeglimin selectively reduced γ-GTP in patients with T2DM, and this effect was reversible after treatment discontinuation. The close association between γ-GTP and total cholesterol suggests that imeglimin may influence hepatic metabolism beyond glucose lowering.
Keywords:
imeglimin
; γ-glutamyl transpeptidase
; total cholesterol
; type 2 diabetes mellitus
; mitochondrial function
; INFINITY study
1. Introduction
Type 2 diabetes mellitus (T2DM) is a systemic metabolic disorder associated with a wide range of chronic complications [1]. In recent years, the liver has increasingly been recognized as a primary target organ for diabetes-related metabolic dysfunction, alongside conventional vascular complications [2]. Patients with T2DM frequently exhibit liver enzyme abnormalities accompanied by dyslipidemia, which strongly reflect the underlying insulin resistance and metabolic impairment [3]. Among various hepatic biomarkers, γ-glutamyl transferase (γ-GTP) has traditionally been utilized as an indicator for biliary tract diseases and alcohol-induced liver injury [4]. However, accumulating evidence has demonstrated that elevated γ-GTP levels are closely associated with insulin resistance [5], metabolic syndrome [6], metabolic dysfunction-associated steatotic liver disease (MASLD) [2], cardiovascular disease [7], and all-cause mortality [8]. Therefore, γ-GTP is increasingly recognized as an integrative biomarker reflecting systemic metabolic health rather than merely a marker of hepatic injury.
Given these observations, increasing attention has been directed toward antidiabetic therapies that provide metabolic and hepatoprotective benefits beyond glucose lowering. Several glucose-lowering agents have been reported to improve liver enzyme abnormalities [9]. In particular, glucagon-like peptide-1 receptor agonists (GLP-1RAs) have recently demonstrated efficacy in resolving steatohepatitis and preventing fibrosis progression, leading to regulatory approval for metabolic dysfunction-associated steatohepatitis (MASH) [10]. These advances have heightened interest in the potential hepatic benefits of antidiabetic medications.
Imeglimin is the first-in-class oral antidiabetic agent of the novel glimin class [11]. It improves glycemic control through multiple mechanisms, including optimization of mitochondrial bioenergetics, enhancement of insulin sensitivity, and preservation of pancreatic β-cell function [11,12]. Pivotal clinical trials have demonstrated that imeglimin significantly reduces HbA1c levels and improves glucose metabolism in patients with T2DM [13]. Furthermore, recent studies suggest that imeglimin may exert pleiotropic metabolic benefits mediated by the regulation of mitochondrial function and cellular energy homeostasis, extending beyond its primary glucose-lowering efficacy [14].
As a prominent clinical evaluation of these pleiotropic effects, the INFINITY Study—an exploratory, prospective interventional trial—demonstrated that imeglimin extends erythrocyte lifespan, which potentially leads to disproportionately higher HbA1c levels relative to the actual glycemic status [15,16]. Furthermore, a post-hoc analysis of the same study suggested that imeglimin improves erythrocyte deformability [17]. These findings indicate that imeglimin holds therapeutic promise for mitigating chronic diabetic complications, thereby expanding its clinical utility beyond conventional glycemic control [17]. Although several glucose-lowering agents have been reported to improve liver enzymes [9], the effects of imeglimin on γ-GTP and how these changes relate to metabolic indicators remain to be fully elucidated. In particular, whether the changes in γ-GTP observed during imeglimin therapy represent a reversible phenomenon, and whether these changes are associated with fluctuations in lipid metabolism, have not yet been investigated.
To address these gaps, the present study conducted a post-hoc analysis using data from the exploratory, prospective interventional "INFINITY Study" to evaluate the detailed dynamics of γ-GTP during imeglimin therapy and after its discontinuation in patients with type 2 diabetes mellitus. The primary objective of this study was to verify the reversibility of imeglimin-induced γ-GTP changes and to comprehensively investigate their associations with various metabolic parameters—including glycemic status, lipid profiles, body mass index, and other liver enzymes—thereby identifying specific metabolic markers that are intrinsically linked to γ-GTP fluctuations.
2. Materials and Methods
2.1. Study Design
The present study was a post-hoc analysis of the INFINITY Study, a prospective, single-arm, open-label, exploratory clinical trial conducted at Naka Kinen Clinic, Japan. Participants received imeglimin (TWYMEEG®) at a dose of 1,000 mg twice daily for 6 months. A 2-month pre-observation period was incorporated to establish baseline measurements, followed by a 3-month post-treatment follow-up period to evaluate the reversibility of treatment-related changes. Throughout the pre-observation, treatment, and follow-up periods, initiation of new antidiabetic medications or dose escalation of existing therapies was not permitted. However, participants receiving stable doses of metformin and/or α-glucosidase inhibitors were allowed to continue these medications without modification [15].
2.2. Participants
Eligible participants were adults with type 2 diabetes mellitus (T2DM) who were either treatment-naïve or receiving stable treatment with metformin and/or α-glucosidase inhibitors. A total of 30 patients were initially enrolled in the INFINITY Study. One participant withdrew consent, resulting in a full analysis set (FAS) of 29 patients. Subsequently, four patients were excluded because of treatment discontinuation or poor treatment adherence, yielding a per-protocol set (PPS) of 25 patients. For the present post-hoc analysis, data from the PPS population (n = 25) were used to evaluate longitudinal changes in liver enzymes, lipid parameters, and metabolic indices during imeglimin treatment and after drug withdrawal. The participant flow is shown in Figure 1 (CONSORT-style flow diagram adapted for this single-arm trial) [16].
2.3. Clinical and Laboratory Assessments
Venous blood samples were collected during four predefined study phases: the Baseline Phase (months −2 to 0), Early Treatment Phase (months 1 to 3), Late Treatment Phase (months 4 to 6), and Withdrawal Phase (months 7 to 9). At the screening visit (month −2), blood sampling was performed under non-fasting conditions to assess study eligibility. Therefore, fasting-dependent parameters, including fasting blood glucose (FBG) and fasting triglycerides (FTG), were not obtained at this time point. Baseline values for these parameters were established using measurements obtained after an overnight fast of at least 10 hours from month −1 onward. All blood samples collected during the treatment and withdrawal phases were obtained after an overnight fast of at least 10 hours.
Routine laboratory analyses were performed using standard automated analyzers at Naka Kinen Clinic. Glycemic parameters included FBG, glycated hemoglobin (HbA1c), and glycoalbumin (GA). Liver-related parameters included γ-glutamyl transpeptidase (γ-GTP), aspartate aminotransferase (AST), and alanine aminotransferase (ALT). Lipid parameters included total cholesterol (T-CHO), high-density lipoprotein cholesterol (HDL-C), and FTG. Anthropometric measurements were obtained at each study visit. Height measured at month −2 was used throughout the study, whereas body weight was assessed at each visit. Body mass index (BMI) was calculated as weight divided by the square of height (kg/m2).
To assess insulin resistance and hepatic fibrosis, the following metabolic indices were calculated:
Triglyceride-Glucose (TyG) Index:
The TyG index was calculated using the following formula:
TyG index = ln [FTG (mg/dL) × FBG (mg/dL) / 2]
Fibrosis-4 (FIB-4) Index:
The FIB-4 index was calculated using the following formula:
FIB-4 index = [Age (years) × AST (U/L)] / [Platelet count (109/L) × √ALT (U/L)].
2.4. Statistical Analysis
All analyses were performed using the PPS population (n = 25). Laboratory and clinical parameters obtained at monthly visits were averaged within four predefined study phases: Baseline Phase (months −2 to 0), Early Treatment Phase (months 1 to 3), Late Treatment Phase (months 4 to 6), and Withdrawal Phase (months 7 to 9). Data are presented as mean ± standard deviation (SD) unless otherwise specified. Because hepatic enzymes (γ-GTP, AST, and ALT), FTG, and FIB-4 index exhibited skewed distributions, these variables were logarithmically transformed using the base-10 logarithm (log10) before statistical analyses. For presentation in tables and figures, log-transformed variables were back-transformed and expressed as geometric means with corresponding 95% confidence intervals (CIs) [lower and upper limits]. Temporal changes across study phases were analyzed using a mixed-effects model followed by Tukey’s multiple-comparison test.
To evaluate treatment-related changes and post-withdrawal reversibility, two indices were predefined:
- -
- Treatment Response (ΔTreatment): Late Treatment Phase − Baseline Phase
- -
- Withdrawal Rebound (ΔWithdrawal): Withdrawal Phase − Late Treatment Phase
Pearson’s correlation coefficients (r) and simple linear regression analyses were used to evaluate:
- -
- The relationship between Treatment Response and Withdrawal Rebound for each clinical parameter (Table 2).
- -
- The associations between γ-GTP dynamics and concurrent changes in metabolic and clinical parameters. Specifically, correlations between γ-GTP Treatment Response and Treatment Responses of other parameters, as well as correlations between γ-GTP Withdrawal Rebound and Withdrawal Rebounds of other parameters, were assessed (Table 3).
To investigate the influence of baseline liver enzyme status, participants were stratified according to baseline γ-GTP levels into a high γ-GTP group (>50 U/L, n = 8) and a low γ-GTP group (≤50 U/L, n = 17).
All statistical analyses were performed using GraphPad Prism version 8.4.3 (GraphPad Software LLC, San Diego, CA, USA). A two-sided P value < 0.05 was considered statistically significant.
3. Results
3.1. Longitudinal Changes in Clinical, Metabolic, and Liver-Related Parameters Across the Study Phases
Table 1 summarizes the longitudinal changes in clinical, metabolic, and liver-related parameters across the four predefined study phases in the PPS (n = 25). Among the glycemic parameters, FBG, HbA1c, and GA were significantly reduced during both the Early Treatment Phase (all P < 0.01) and the Late Treatment Phase (P < 0.05 or P < 0.01) compared with the Baseline Phase. These improvements were attenuated after imeglimin withdrawal, and values returned to levels comparable to those observed during the Baseline Phase in the Withdrawal Phase (all P < 0.01). No significant changes in BMI were observed throughout the study period (P = 0.450).

Table 1.
Clinical, metabolic, and hepatic parameters across the four study phases during and after imeglimin treatment.
Table 1.
Clinical, metabolic, and hepatic parameters across the four study phases during and after imeglimin treatment.
| Parameter | N | Baseline (-2–0M) |
Early TM (1–3M) |
Late TM (4–6M) |
Withdrawal (7–9M) |
P value |
|---|---|---|---|---|---|---|
| FBG (mg/dL) | 25 | 147.4 ± 22.7 | 133.4 ± 17.3 ** | 133.8 ± 22.5 * | 154.3 ± 33.1 ## | < 0.01 |
| HbA1c (%) | 25 | 7.4 ± 0.5 | 7.1 ± 0.5 ** | 6.9 ± 0.4 ** | 7.4 ± 0.7 ## | < 0.01 |
| GA (%) | 25 | 18.5 ± 2.3 | 17.1 ± 2.3 ** | 16.7 ± 2.2 ** | 18.7 ± 3.0 ## | < 0.01 |
| BMI (kg/m2) | 25 | 25.4 ± 3.1 | 25.3 ± 3.1 | 25.3 ± 3.2 | 25.3 ± 3.1 | 0.450 |
| γ-GTP (U/L) | 25 | 36.2 (27.1 – 48.4) |
32.4 * (24.5 – 42.9) |
31.1 * (23.5 –41.1) |
35.6 # (26.4 – 48.5) |
< 0.01 |
| ASL (U/L) | 25 | 21.8 (19.4 – 24.6) |
21.7 (19.2 – 24.5) |
21.9 (19.6 – 24.6) |
23.1 (20.2 – 26.3) |
0.249 |
| ALT (U/L) | 25 | 23.7 (19.0 – 29.6) |
22.8 (18.2 – 28.6) |
22.9 (18.4 – 28.5) |
25.5 (19.6 – 33.1) |
0.101 |
| T-CHO (mg/dL) | 25 | 188.9 ± 28.9 | 187.2 ± 28.7 | 185.2 ± 28.9 | 191..8 ± 32.8 | 0.240 |
| HDL-C (mg/dL) | 25 | 56.3 ± 12.1 | 56.2 ± 13.1 | 57.2 ± 12.9 | 57.4 ± 13.4 | 0.360 |
| FTG (mg/dL) | 25 | 118.5 (99.6 – 140.9) |
119.5 (101.9 – 140.2) |
112.0 (94.4 – 132.9) |
125.8 (105.0– 150.9) |
0.074 |
| TyG Index | 25 | 9.06 ± 0.47 | 8.97 ± 0.43 | 8.90 ± 0.48 | 9.16 ± 0.47 ## | < 0.01 |
| FIB-4 Index | 25 | 1.45 (1.15 – 1.83) |
1.44 (1.15 – 1.82) |
1.44 (1.15 – 1.82) |
1.42 (1.13 – 1.78) |
0.795 |
Data are presented as mean ± SD or geometric means with 95% CIs. * P < 0.05, ** P < 0.01 vs. Baseline Phase, # P < 0.05, ## P < 0.01 vs. Late Treatment (TM) Phase. Statistical comparisons were performed using mixed-effects analysis followed by Tukey's multiple comparisons test.
For the liver-related parameters, geometric means calculated from log-transformed values demonstrated significant reductions in γ-GTP during both the Early Treatment Phase [32.4 (24.5–42.9) U/L] and the Late Treatment Phase [31.1 (23.5–41.1) U/L] compared with the Baseline Phase [36.2 (27.1–48.4) U/L] (both P < 0.05). Following imeglimin withdrawal, γ-GTP increased to 35.6 (26.4–48.5) U/L during the Withdrawal Phase, returning to levels comparable to those observed during the Baseline Phase (P < 0.05 versus the Late Treatment Phase) (Figure 2). In contrast, AST and ALT showed similar trends but did not change significantly throughout the study period (P = 0.249 and P = 0.101, respectively) (Figure 2). No significant changes were observed in lipid parameters (T-CHO, HDL-C, and FTG) or the FIB-4 index across the study phases. However, the TyG index tended to decrease during the treatment period and increased significantly during the Withdrawal Phase compared with the Late Treatment Phase (P < 0.01).
3.2. Influence of Baseline γ-GTP Levels on Reversible γ-GTP Responses
To further characterize the reversible changes in γ-GTP, participants were stratified according to baseline γ-GTP levels into a high γ-GTP group (>50 U/L, n = 8) and a low γ-GTP group (≤50 U/L, n = 17). Participants with baseline γ-GTP levels >50 U/L tended to exhibit greater reductions in γ-GTP during imeglimin treatment and greater increases following drug withdrawal than those with baseline γ-GTP levels ≤50 U/L (Figure 3a).
Among the 25 participants, 16 reported habitual alcohol consumption and 9 did not. Comparable reversible γ-GTP responses were observed in participants with and without habitual alcohol consumption (data not shown).
Consistent with these findings, a significant inverse correlation was observed between the treatment response and withdrawal rebound of log-transformed γ-GTP (r = −0.480, P = 0.015; Figure 3b), indicating that participants with greater reductions in γ-GTP during imeglimin treatment tended to exhibit greater increases following drug withdrawal.
3.3. Correlations Between Treatment Responses and Withdrawal Rebounds
Correlations between treatment responses (ΔTreatment) and withdrawal rebounds (ΔWithdrawal) for each clinical parameter are summarized in Table 2. In addition to γ-GTP (Section 3.2), significant inverse correlations between treatment response and withdrawal rebound were observed for total cholesterol (T-CHO; r = −0.631, P < 0.001), log-transformed fasting triglycerides (FTG; r = −0.491, P = 0.013), the TyG index (r = −0.448, P = 0.025), and BMI (r = −0.458, P = 0.021). No significant correlations between treatment response and withdrawal rebound were observed for FBG, HbA1c, GA, AST, ALT, or the FIB-4 index.
3.4. Associations Between γ-GTP Responses and Corresponding Changes in Metabolic Parameters
To identify metabolic factors associated with reversible γ-GTP changes, correlations between γ-GTP responses and the corresponding changes in clinical and metabolic parameters were examined (Table 3). For the treatment response, log-transformed γ-GTP was significantly correlated with changes in total cholesterol (ΔT-CHO; r = 0.554, P = 0.005) (Figure 4A) and BMI (ΔBMI; r = 0.314, P = 0.024). For the withdrawal rebound, log-transformed γ-GTP was significantly correlated with the corresponding change in total cholesterol (ΔT-CHO; r = 0.450, P = 0.024) (Figure 4B). No significant associations were observed with BMI (ΔBMI; r = 0.355, P = 0.081), log-transformed fasting triglycerides (r = 0.109, P = 0.605), the TyG index, or the other clinical parameters during the withdrawal phase. Among all parameters examined, total cholesterol was the only variable that showed significant associations with γ-GTP during both the treatment and withdrawal phases..
Treatment response was defined as the change from the Baseline Phase to the Late Treatment Phase, and withdrawal rebound as the change from the Late Treatment Phase to the Withdrawal Phase. Pearson's correlation coefficients (r) and corresponding P values are shown. γ-GTP was analyzed after log10 transformation.
4. Discussion
4.1. Principal Findings
This post-hoc analysis of the prospective INFINITY Study identified three principal findings regarding the hepatic effects of imeglimin in patients with T2DM. First, imeglimin significantly reduced serum γ- GTP during the treatment period, whereas AST and ALT showed only non-significant downward trends. Second, the γ-GTP reduction was completely reversible after treatment discontinuation, with enzyme levels returning to baseline during the withdrawal phase. Third, among all clinical parameters evaluated, only total cholesterol consistently correlated with γ-GTP changes during both treatment and withdrawal. Patients with higher baseline γ-GTP levels also tended to show greater reductions during treatment, although this trend did not reach statistical significance. Collectively, these findings suggest that imeglimin induces reversible hepatometabolic remodeling beyond conventional glycemic control. The coordinated changes in γ-GTP and total cholesterol raise the possibility that imeglimin may exert beneficial effects on hepatic metabolic dysfunction, with potential implications for organ protection, including MASLD, in patients with T2DM.
4.2. Potential Clinical Significance of the γ-GTP-Lowering Effect of Imeglimin
γ-GTP has traditionally been regarded as a biomarker of cholestatic liver disease and alcohol-related liver injury [4]. However, accumulating evidence indicates that γ-GTP also reflects systemic metabolic dysfunction rather than merely hepatocellular injury [2,5,6,7,8] and is increasingly recognized as a marker of disturbances in hepatic redox homeostasis, oxidative stress, and metabolic regulation [18,19]. Against this background, the reversible reduction in γ-GTP observed during imeglimin therapy suggests that the drug may exert favorable effects on hepatometabolic pathways beyond its glucose-lowering action, possibly through improvements in mitochondrial function and redox homeostasis.
Although the present study was not designed to evaluate clinical outcomes, the observed reduction in γ-GTP may have implications extending beyond liver biochemistry. Collectively, these findings support the concept that the pleiotropic actions of imeglimin may extend beyond glucose lowering and warrant further investigation into its potential role in preventing or ameliorating metabolic liver disease and other diabetes-related organ complications.
4.3. Reversible γ-GTP Changes and Their Association with Total Cholesterol
Although several clinical parameters exhibited a similar temporal pattern, with modest decreases during the treatment phase followed by increases after imeglimin withdrawal at the group level, this alone does not necessarily indicate a coordinated pharmacological response. To address this issue, we evaluated the relationship between the individual treatment response and withdrawal rebound for each parameter. Interestingly, significant inverse correlations were observed only for BMI, total cholesterol, fasting triglycerides, and the TyG index in addition to γ-GTP. In contrast, glycemic parameters, including FBG, HbA1c, and glycoalbumin, did not demonstrate such within-subject reversibility despite showing significant improvements during treatment. This finding suggests that the degree of glycemic rebound after imeglimin withdrawal varied considerably among individuals, probably reflecting interindividual differences in residual β-cell function, insulin sensitivity, or lifestyle factors [11,20]. By contrast, the highly coordinated reversible response observed for γ-GTP indicates that its changes were tightly coupled to the pharmacological action of imeglimin and were less influenced by individual variability. These observations further support the hypothesis that γ-GTP reflects a specific hepatometabolic response to imeglimin rather than a nonspecific consequence of improved glycemic control [4,18].
Another important finding was the specific association between γ-GTP and total cholesterol. Among the parameters that demonstrated coordinated reversibility, as evidenced by significant inverse correlations between individual treatment responses and withdrawal rebounds, only total cholesterol was significantly associated with γ-GTP during both the treatment and withdrawal phases. BMI showed a modest trend toward association, whereas fasting triglycerides and the TyG index, despite exhibiting reversible within-subject responses, were not significantly correlated with γ-GTP. These findings raise the possibility that the reversible change in γ-GTP reflects a hepatometabolic response that is more closely associated with cholesterol metabolism than with the other metabolic parameters examined in the present study [21]. Although this association does not establish causality, its consistency during both the treatment and withdrawal phases supports the hypothesis that cholesterol homeostasis may participate in the reversible hepatometabolic effects of imeglimin, possibly through mechanisms related to mitochondrial metabolic regulation [21,22].
4.4. Potential Mechanisms and Clinical Implications
Imeglimin is distinguished from conventional glucose-lowering agents by its direct effects on mitochondrial bioenergetics [11,12]. Experimental studies have demonstrated that imeglimin improves mitochondrial function, reduces excessive reactive oxygen species production, and restores cellular energy homeostasis [14,23]. Because γ-GTP plays a key role in glutathione metabolism and reflects oxidative stress [4,18,19], the reversible reduction observed in this study may represent improvement of hepatic metabolic function rather than structural liver injury. The close association between γ-GTP and total cholesterol further supports the hypothesis [21,22] that mitochondrial regulation by imeglimin influences hepatic cholesterol metabolism, although this interpretation remains speculative and requires mechanistic confirmation.
These findings also have potential clinical implications. γ-GTP may serve as a practical biomarker for monitoring hepatic metabolic responses to imeglimin, particularly in patients with T2DM accompanied by metabolic liver dysfunction [2,5,6]. Furthermore, the tendency toward greater γ-GTP reduction in patients with higher baseline enzyme levels suggests that individuals with increased hepatic metabolic stress may derive greater benefit from imeglimin, although this hypothesis should be confirmed in larger prospective studies. Future investigations incorporating hepatic imaging, oxidative stress biomarkers, and metabolomic analyses will help clarify the clinical significance of these observations and determine whether they are applicable to patients with MASLD [24].
4.5. Limitations
Several limitations of this study should be acknowledged. First, this was a post-hoc analysis of a single-arm exploratory study with a relatively small sample size, thereby limiting statistical power and precluding definitive causal inference. In particular, the tendency for patients with higher baseline γ-GTP levels to exhibit greater treatment responses did not reach statistical significance and should therefore be interpreted as hypothesis-generating. Second, hepatic imaging, liver histology, and direct assessments of hepatic fat content or mitochondrial function were not performed. Consequently, the mechanistic basis linking γ-GTP, cholesterol metabolism, and mitochondrial regulation could not be directly evaluated. Third, serum γ-GTP may be influenced by alcohol consumption and other clinical factors [4]. Although additional analyses indicated that the reversible γ-GTP response was also observed in participants without habitual alcohol consumption, residual confounding cannot be completely excluded.
Despite these limitations, the study possesses several notable strengths. The prospective design with predefined treatment and withdrawal phases enabled detailed longitudinal evaluation of hepatic metabolic dynamics at the individual patient level. Furthermore, the inclusion of a planned withdrawal period provided a unique opportunity to demonstrate the reversibility of γ-GTP changes, an aspect that has rarely been examined in previous studies of glucose-lowering agents. The consistent correlation between γ-GTP and total cholesterol observed during both treatment and withdrawal further strengthens the biological plausibility of the findings.
5. Conclusions
In conclusion, imeglimin induced a significant and reversible reduction in γ-GTP in patients with T2DM, whereas AST and ALT showed only non-significant downward trends. Among the clinical parameters evaluated, only total cholesterol consistently paralleled γ-GTP changes during both treatment and withdrawal, suggesting coordinated regulation of hepatic metabolic pathways. These findings extend the current understanding of the pleiotropic actions of imeglimin beyond glucose lowering and raise the possibility that imeglimin favorably modulates hepatometabolic dysfunction through reversible mitochondrial metabolic regulation. Although confirmation in larger mechanistic and prospective studies is required, the present findings suggest potential therapeutic implications not only for glycemic control but also for hepatic metabolic health and organ protection, including MASLD.
Author Contributions
Conceptualization, T.O. and M.K.; methodology, M.K.; software, M.K.; validation, T.O. and M.K.; formal analysis, M.K.; investigation, T.O., S.S., M.S., M.H. and S.D.; resources, T.O. and S.D.; data curation, K.O. and M.K.; writing—original draft preparation, M.K.; writing—review and editing, T.O.; visualization, M.K.; supervision, T.O.; project administration, M.K.; funding acquisition, T.O. All authors have read and agreed to the published version of the manuscript.
Funding
This study is funded by Sumitomo Pharma Co., Ltd, the manufacturer of imeglimin. The funders have no role in the study design, data collection, and analysis, decision to publish, or manuscript preparation.
Institutional Review Board Statement
The study was conducted in accordance with the Declaration of Helsinki and the Clinical Research Act of Japan. The trial was approved by the Certified Review Boards of Toho University (protocol code THU22002 and date of approval Nov 21, 2022) and later Saitama Medical University. The study protocol was registered in the Japan Registry of Clinical Trials (jRCTs031220489).
Informed Consent Statement
Informed consent was obtained from all subjects involved in the study. Specifically, the study physicians provided comprehensive explanations using written information and consent forms, and obtained voluntary written informed consent from all participants prior to their enrollment.
Data Availability Statement
The data supporting the findings of this study are available from the corresponding author upon reasonable request. Due to ethical restrictions and participant confidentiality, access to the data may be limited and will be provided in accordance with institutional guidelines and applicable data-sharing policies.
Acknowledgments
The authors wish to thank Norie Watahiki for their technical assistance, Mari Sasaki and Yui Ito for their assistance with the research, Masaki Ito for his help with data collection, and all the physicians and staff members of the Naka Kinen Clinic.
Conflicts of Interest
T. Osonoi received research funding from Novo Nordisk Pharma Ltd., Takeda Pharmaceutical Co., Ltd., Ono Pharmaceutical Co., Ltd., Otsuka Pharmaceutical Co., Ltd., Eli Lilly Japan K.K., Bayer Yakuhin, Ltd., Kowa Pharmaceutical Co., Ltd., Fuji Yakuhin Co., Ltd., Mochida Pharmaceutical Co. Ltd., Sumitomo Pharma Co. Ltd., Hakubaku Co., Ltd., and Gilead Sciences, and honoraria for lectures from Novo Nordisk Pharma Co., Ltd., and Sumitomo Pharma Co. Ltd.. S. Shirabe received honoraria for lectures from Eli Lilly Japan K.K. The remaining authors declare that the research was conducted in the absence of any commercial or financial relationships that could be construed as a potential conflict of interest.
Abbreviations
The following abbreviations are used in this manuscript:
| ALT | Alanine aminotransferase |
| AST | Aspartate aminotransferase |
| BMI | Body mass index |
| CIs | Confidence intervals |
| FAS | Full analysis set |
| FBG | Fasting blood glucose |
| FTG | Fasting triglycerides |
| FIB-4 Index | Fibrosis-4 Index |
| γ-GTP | γ-glutamyl transpeptidase |
| GLP-1RAs | Glucagon-like peptide-1 receptor agonists |
| GA | Glycoalbumin |
| HbA1c | Hemoglobin A1c |
| HDL-C | High-density lipoprotein cholesterol |
| MASH | Metabolic dysfunction-associated steatohepatitis |
| MASLD | Metabolic dysfunction-associated steatotic liver disease |
| PPS | Per-protocol set |
| SD | Standard deviation |
| T-CHO | Total cholesterol |
| TyG Index | Triglyceride-Glucose Index |
| T2DM | Type 2 diabetes mellitus |
References
- Defronzo, R.A. Banting Lecture. From the triumvirate to the ominous octet: a new paradigm for the treatment of type 2 diabetes mellitus. Diabetes 2009, 58, 773–795. [Google Scholar] [PubMed]
- Eslam, M.; Newsome, P.N.; Sarin, S.K.; Anstee, Q.M.; Targher, G.; Romero-Gomez, M.; Zelber-Sagi, S.; Wai-Sun Wong, V.; Dufour, J.F.; Schattenberg, J.M. A new definition for metabolic dysfunction-associated fatty liver disease: An international expert consensus statement. J. Hepatol. 2020, 73, 202–209. [Google Scholar] [CrossRef] [PubMed]
- Holleboom, A.G.; Francque, S.M.; Cusi, K.; Caussy, C. Close multilevel links between metabolic dysfunction-associated steatotic liver disease and type 2 diabetes mellitus. Metabol. Open 2025, 28, 100424. [Google Scholar] [CrossRef] [PubMed]
- Whitfield, J.B. Gamma glutamyl transferase. Crit. Rev. Clin. Lab. Sci. 2001, 38, 263–355. [Google Scholar] [CrossRef] [PubMed]
- Thamer, C.; Tschritter, O.; Haap, M.; Shirkavand, F.; Machann, J.; Fritsche, A.; Schick, F.; Häring, H.; Stumvoll, M. Elevated serum GGT concentrations predict reduced insulin sensitivity and increased intrahepatic lipids. Horm. Metab. Res. 2005, 37, 246–251. [Google Scholar] [CrossRef] [PubMed]
- Mohapatra, E.; Priya, R.; Nanda, R.; Patel, S. Serum GGT and serum ferritin as early markers for metabolic syndrome. J. Fam. Med. Prim. Care 2020, 9, 3458–3463. [Google Scholar] [CrossRef]
- Kunutsor, S.K.; Bakker, S.J.; Kootstra-Ros, J.E.; Gansevoort, R.T.; Dullaart, R.P. Circulating gamma glutamyltransferase and prediction of cardiovascular disease. Atherosclerosis 2015, 238, 356–364. [Google Scholar] [CrossRef] [PubMed]
- Yuwaki, K.; Shimazu, T.; Yamagiwa, Y.; Inoue, M.; Goto, A.; Yamaji, T.; Iwasaki, M.; Sawada, N.; Tsugane, S. JPHC Study Group. Association between serum liver enzymes and all-cause mortality: The Japan Public Health Center-based Prospective Study. Liver Int. 2019, 39, 1566–1576. [Google Scholar] [PubMed]
- Mantovani, A.; Byrne, C.D.; Targher, G. Efficacy of peroxisome proliferator-activated receptor agonists, glucagon-like peptide-1 receptor agonists, or sodium-glucose cotransporter-2 inhibitors for treatment of non-alcoholic fatty liver disease: a systematic review. Lancet Gastroenterol. Hepatol. 2022, 7, 367–378. [Google Scholar] [PubMed]
- Abdeen, A.A.; Ayer, T.; Biswas, A.; Wehrle, C.J.; Laique, S.N.; Aminian, A. Cost-Effectiveness of Pharmacologic Therapies for Metabolic Dysfunction-Associated Steatohepatitis With Significant Fibrosis in the United States. Diabetes Obes. Metab. 2026. [Google Scholar] [CrossRef] [PubMed]
- Hallakou-Bozec, S.; Vial, G.; Kergoat, M.; Fouqueray, P.; Bolze, S.; Borel, A.L.; Fontaine, E.; Moller, D.E. Mechanism of action of imeglimin: A novel therapeutic agent for type 2 diabetes. Diabetes Obes. Metab. 2021, 23, 664–673. [Google Scholar] [PubMed]
- Hallakou-Bozec, S.; Kergoat, M.; Fouqueray, P.; Bolze, S.; Moller, D.E. Imeglimin amplifies glucose-stimulated insulin release from diabetic islets via a distinct mechanism of action. PLoS ONE 2021, 16, e0241651. [Google Scholar] [CrossRef] [PubMed]
- Tewari, J.; Qidwai, K.A.; Tewari, A.; Rana, A.; Singh, V.; Tewari, V.; Mateen, R.; Khatoon, S.; Ahmad, F.; Haque, S. Efficacy and safety of imeglimin, a novel oral agent in the management of type 2 diabetes mellitus: a systematic review and meta-analysis. Naunyn Schmiedebergs Arch. Pharmacol. 2025, 398, 14501–14513. [Google Scholar] [CrossRef] [PubMed]
- Yanai, H.; Adachi, H.; Hakoshima, M.; Katsuyama, H. Glucose-Lowering Effects of Imeglimin and Its Possible Beneficial Effects on Diabetic Complications. Biology 2023, 12, 726. [Google Scholar] [CrossRef] [PubMed]
- Osonoi, T.; Shirabe, S.; Saito, M.; Hosoya, M.; Douguchi, S.; Ofuchi, K.; Katoh, M. Comparative evaluation of clinical glycemic control markers treated with imeglimin and its effect on erythrocytes in patients with type 2 diabetes mellitus: study protocol of a single-arm, open-label, prospective, exploratory trial. Front. Pharmacol. 2023, 14, 1205021. [Google Scholar] [PubMed]
- Osonoi, T.; Shirabe, S.; Saito, M.; Hosoya, M.; Watahiki, N.; Shiozawa, N.; Douguchi, S.; Ofuchi, K.; Katoh, M. Imeglimin may affect hemoglobin A1c accuracy via prolongation of erythrocyte lifespan in patients with type 2 diabetes mellitus: insights from the INFINITY clinical trial. Front. Endocrinol. 2025, 16, 1699591. [Google Scholar] [CrossRef]
- Osonoi, T.; Shirabe, S.; Saito, M.; Hosoya, M.; Watahiki, N.; Shiozawa, N.; Douguchi, S.; Ofuchi, K.; Katoh, M. Imeglimin Treatment May Improve Erythrocyte Deformability and Influence Hemorheology in Patients with Type 2 Diabetes Mellitus: A Post Hoc Analysis of the INFINITY Study. Preprints.org. 2026. [Google Scholar] [CrossRef]
- Kunutsor, S.K. Gamma-glutamyltransferase-friend or foe within? Liver Int. 2016, 36, 1723–1734. [Google Scholar] [PubMed]
- Lu, S.C. Glutathione synthesis. Biochim Biophys. Acta 2013, 1830, 3143–3153. [Google Scholar] [CrossRef] [PubMed]
- Davies, M.J.; Aroda, V.R.; Collins, B.S.; Gabbay, R.A.; Green, J.; Maruthur, N.M.; Rosas, S.E.; Del Prato, S.; Mathieu, C.; Mingrone, G. Management of Hyperglycemia in Type 2 Diabetes, 2022. A Consensus Report by the American Diabetes Association (ADA) and the European Association for the Study of Diabetes (EASD). Diabetes Care 2022, 45, 2753–2786. [Google Scholar] [CrossRef] [PubMed]
- Friedman, S.L.; Neuschwander-Tetri, B.A.; Rinella, M.; Sanyal, A.J. Mechanisms of NAFLD development and therapeutic strategies. Nat. Med. 2018, 24, 908–922. [Google Scholar] [CrossRef] [PubMed]
- Venkatesan, N.; Doskey, L.C.; Malhi, H. The Role of Endoplasmic Reticulum in Lipotoxicity during Metabolic Dysfunction-Associated Steatotic Liver Disease (MASLD) Pathogenesis. Am. J. Pathol. 2023, 193, 1887–1899. [Google Scholar] [PubMed]
- Li, Y.; Lou, N.; Liu, X.; Zhuang, X.; Chen, S. Exploring new mechanisms of Imeglimin in diabetes treatment: Amelioration of mitochondrial dysfunction. Biomed. Pharmacother. 2024, 175, 116755. [Google Scholar] [CrossRef] [PubMed]
- European Association for the Study of the Liver (EASL); European Association for the Study of Diabetes (EASD); European Association for the Study of Obesity (EASO). EASL-EASD-EASO clinical practice guidelines on the management of metabolic dysfunction-associated steatotic liver disease (MASLD). J. Hepatol. 2024, 81, 492–542. [Google Scholar] [PubMed]
Figure 1.
CONSORT-style flow diagram in the INFINITY study. Adapted from [16].
Figure 1.
CONSORT-style flow diagram in the INFINITY study. Adapted from [16].
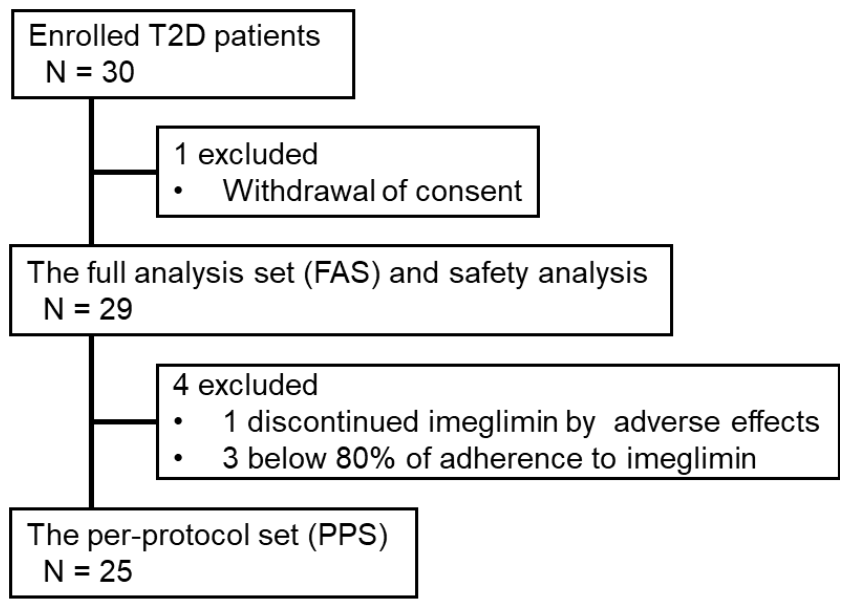
Figure 2.
Longitudinal changes in serum liver enzymes (γ-GTP, AST, and ALT) during and after imeglimin treatment. Values are presented as geometric means. Only the lower 95% CIs are shown for graphical clarity. * P < 0.05 vs. Month 0, # P < 0.05 vs. Month 6. Statistical comparisons were performed using mixed-effects analysis followed by Tukey’s multiple comparisons test.
Figure 2.
Longitudinal changes in serum liver enzymes (γ-GTP, AST, and ALT) during and after imeglimin treatment. Values are presented as geometric means. Only the lower 95% CIs are shown for graphical clarity. * P < 0.05 vs. Month 0, # P < 0.05 vs. Month 6. Statistical comparisons were performed using mixed-effects analysis followed by Tukey’s multiple comparisons test.
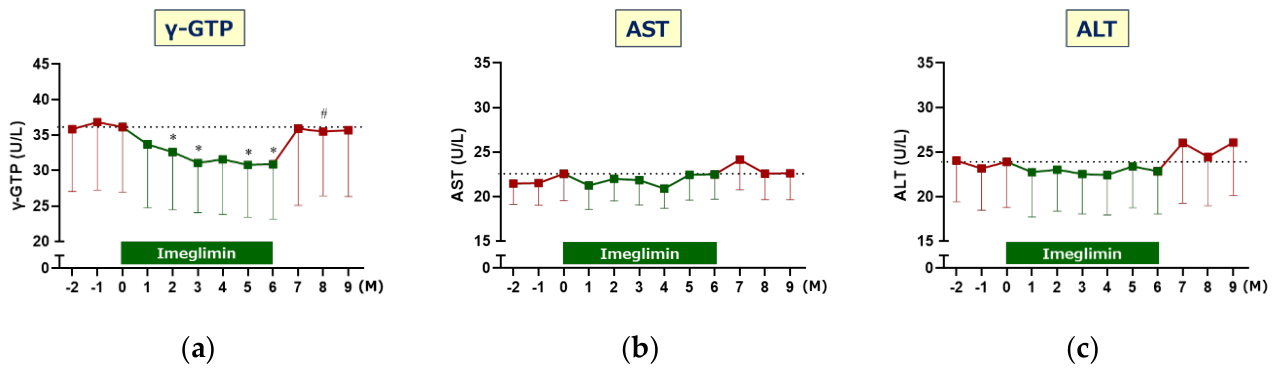
Figure 3.
Reversible changes in γ-GTP according to baseline γ-GTP levels and the association between treatment response and withdrawal rebound. (a) Longitudinal changes in γ-GTP stratified by baseline γ-GTP levels (>50 U/L and ≤50 U/L). (b) Correlation between γ-GTP treatment response (ΔTreatment) and withdrawal rebound (ΔWithdrawal). Treatment response was defined as the change from the Baseline Phase to the Late Treatment Phase, whereas withdrawal rebound was defined as the change from the Late Treatment Phase to the Withdrawal Phase. γ-GTP values were log10-transformed before analysis. Pearson’s correlation coefficient (r) and P value are shown.
Figure 3.
Reversible changes in γ-GTP according to baseline γ-GTP levels and the association between treatment response and withdrawal rebound. (a) Longitudinal changes in γ-GTP stratified by baseline γ-GTP levels (>50 U/L and ≤50 U/L). (b) Correlation between γ-GTP treatment response (ΔTreatment) and withdrawal rebound (ΔWithdrawal). Treatment response was defined as the change from the Baseline Phase to the Late Treatment Phase, whereas withdrawal rebound was defined as the change from the Late Treatment Phase to the Withdrawal Phase. γ-GTP values were log10-transformed before analysis. Pearson’s correlation coefficient (r) and P value are shown.
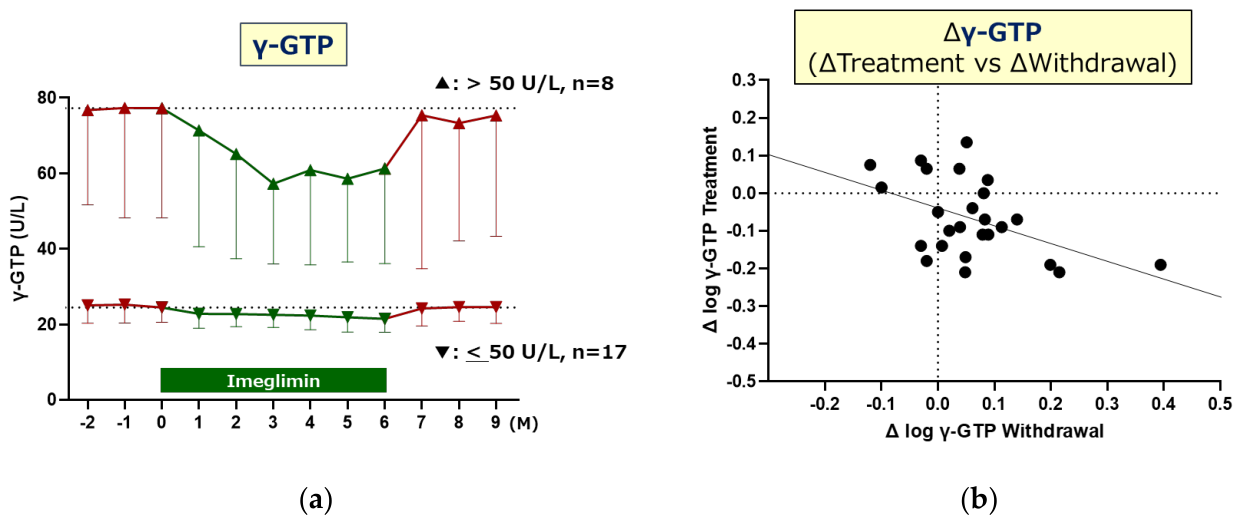
Figure 4.
Associations between changes in γ-GTP and total cholesterol during the treatment and withdrawal phases. (a) Correlation between the treatment response of log10-transformed γ-GTP (ΔTreatment) and the corresponding change in total cholesterol (ΔT-CHO). (b) Correlation between the withdrawal rebound of log10-transformed γ-GTP (ΔWithdrawal) and the corresponding change in total cholesterol (ΔT-CHO).
Figure 4.
Associations between changes in γ-GTP and total cholesterol during the treatment and withdrawal phases. (a) Correlation between the treatment response of log10-transformed γ-GTP (ΔTreatment) and the corresponding change in total cholesterol (ΔT-CHO). (b) Correlation between the withdrawal rebound of log10-transformed γ-GTP (ΔWithdrawal) and the corresponding change in total cholesterol (ΔT-CHO).
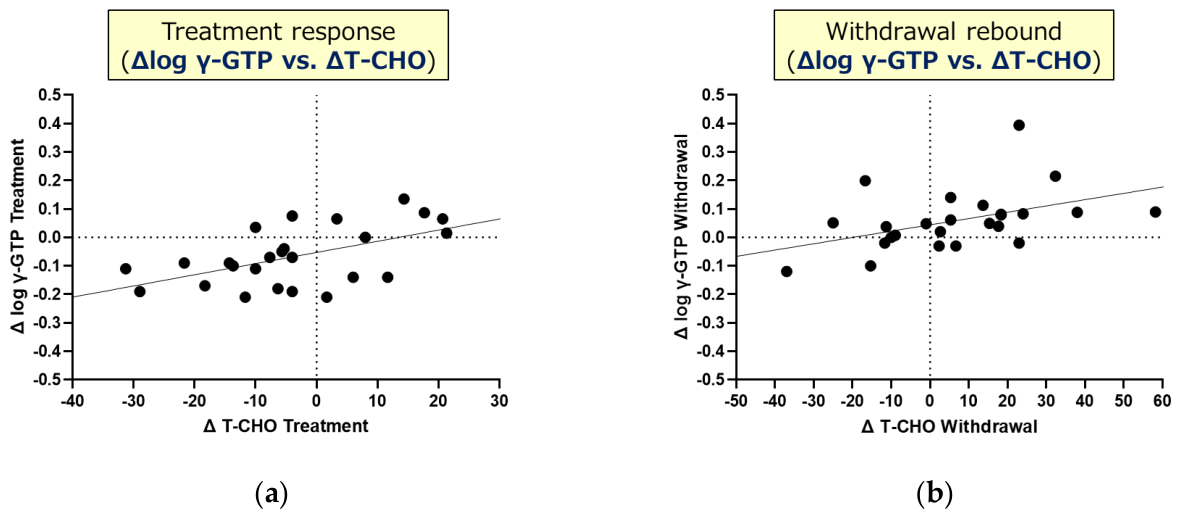
Table 2.
Correlations between individual treatment responses and withdrawal rebounds for clinical, metabolic, and hepatic parameters.
Table 2.
Correlations between individual treatment responses and withdrawal rebounds for clinical, metabolic, and hepatic parameters.
| Parameter | N | ΔTreatment vs ΔWithdrawal | |
|---|---|---|---|
| r | P value | ||
| γ-GTP | 25 | -0.480 | 0.015 |
| FBG | 25 | -0.027 | 0.899 |
| HbA1c | 25 | 0.183 | 0.381 |
| GA | 25 | -0.144 | 0.493 |
| BMI | 25 | -0.458 | 0.021 |
| ASL | 25 | -0.090 | 0.668 |
| ALT | 25 | 0.002 | 0.993 |
| T-CHO | 25 | -0.631 | <0.001 |
| HDL-C | 25 | -0.044 | 0.836 |
| FTG | 25 | -0.491 | 0.013 |
| TyG Index | 25 | -0.448 | 0.025 |
| FIB-4 Index | 25 | -0.391 | 0.053 |
Treatment response (ΔTreatment) was defined as the change from the Baseline Phase to the Late Treatment Phase, and withdrawal rebound (ΔWithdrawal) was defined as the change from the Late Treatment Phase to the Withdrawal Phase. Pearson's correlation coefficients (r) and corresponding P values are shown. Variables with skewed distributions (γ-GTP, AST, ALT, fasting triglycerides, and the FIB-4 index) were analyzed after log10 transformation.
Table 3.
Associations between changes in γ-GTP and corresponding changes in clinical and metabolic parameters during the treatment and withdrawal phases.
Table 3.
Associations between changes in γ-GTP and corresponding changes in clinical and metabolic parameters during the treatment and withdrawal phases.
| Parameter | N | ΔTreatment (log γ-GTP) | ΔWithdrawal (log γ-GTP) | |||
|---|---|---|---|---|---|---|
| r | P value | r | P value | |||
| T-CHO | 25 | 0.554 | 0.005 | 0.450 | 0.024 | |
| BMI | 25 | 0.314 | 0.024 | 0.355 | 0.081 | |
| FTG | 25 | 0.145 | 0.489 | 0.109 | 0.605 | |
| TyG Index | 25 | 0.280 | 0.175 | 0.038 | 0.855 | |
Treatment response (ΔTreatment) was defined as the change from the Baseline Phase to the Late Treatment Phase, and withdrawal rebound (ΔWithdrawal) was defined as the change from the Late Treatment Phase to the Withdrawal Phase. Pearson's correlation analyses were performed between ΔTreatment (log γ-GTP) or ΔWithdrawal (log γ-GTP) and the corresponding changes in clinical and metabolic parameters. γ-GTP and fasting triglycerides were analyzed after log10 transformation, whereas BMI, total cholesterol, and the TyG index were analyzed using their original values. Pearson's correlation coefficients (r) and corresponding P values are presented.
Disclaimer/Publisher’s Note: The statements, opinions and data contained in all publications are solely those of the individual author(s) and contributor(s) and not of MDPI and/or the editor(s). MDPI and/or the editor(s) disclaim responsibility for any injury to people or property resulting from any ideas, methods, instructions or products referred to in the content. |
© 2026 by the authors. Licensee MDPI, Basel, Switzerland. This article is an open access article distributed under the terms and conditions of the Creative Commons Attribution (CC BY) license (http://creativecommons.org/licenses/by/4.0/).
Copyright: This open access article is published under a Creative Commons CC BY 4.0 license, which permit the free download, distribution, and reuse, provided that the author and preprint are cited in any reuse.


