

Submitted:
26 June 2026
Posted:
30 June 2026
You are already at the latest version
Abstract
Purpose:To model treat and extend (TREX) therapy as a threshold-search problem and compare common extension and shortening rules using durability distributions derived from published studies. Design: Computational modelling study using Monte Carlo (MC) simulation and Pareto multi-objective optimisation analysis of TREX rules. Subjects: 10,000 simulated eyes per durability distribution. Methods: Each simulated eye was assumed to have a fixed maximum dry interval (Tmax), defined as the longest injection interval maintaining disease stability. Four TREX search rules were evaluated: +2/−2, +4/−4 with midpoint refinement, +4/−2, and a midpoint bracketing strategy. Deterministic pathways were enumerated for each Tmax from 4 to 16 weeks. Durability priors were derived from published maintenance interval data from TENAYA/LUCERNE, the FARIT study, and a real-world aflibercept 2 mg cohort, with intermediate weekly survival values interpolated using a piecewise constant hazard interpolation. Monte Carlo simulation of 10,000 eyes was used to estimate visits to maintenance interval, cumulative overshoot, and maximum single overshoot. Pareto analysis identified dominated and non-dominated strategies. Main outcome measures: Number of visits to find maintenance interval, cumulative and maximum overshoot beyond a disease-controlling interval. Results: Under TENAYA/LUCERNE priors, +4/−2 required the fewest visits to maintenance, while +2/−2 had the lowest overshoot. The midpoint strategy achieved similar efficiency to +4/−2 with lower overshoot. Across all three durability distributions, +4/−4 was consistently dominated. The Pareto-optimal set varied by durability prior: midpoint performed favourably under longer-durability distributions but carried greater overshoot risk under shorter-durability priors. Conclusion: TREX rule choice involves explicit trade-offs between search efficiency and overshoot. Pareto analysis provides a structured framework for comparing extension strategies and tailoring rule choice to expected durability and clinical risk tolerance.
Keywords:
age-related macular degeneration
; anti-vascular endothelial growth factor
; treat and extend
; neovascular age-related macular degeneration
1. Introduction
Treat-and-extend (TREX) is widely used for anti-VEGF therapy in macular disease. The injection interval is extended when disease remains stable and shortened when activity recurs. Despite widespread use, decisions about how much to extend or shorten the interval rely on rules of thumb, heuristics and clinical experience. Longer extensions are intuitive for longer-acting agents. Four-week adjustments have been shown to be safe and effective 1, but there is no explicit rationale for 4 weeks rather than other intervals. The posology for aflibercept 8 mg allows interval adjustments of 8–16 weeks after loading "at clinician discretion" 2 and UK consensus guidance recommends extensions of 2–4 weeks with larger extensions possible in selected patients 3. But what should guide these decisions? In prior work 4 , we showed that TREX is a threshold search problem. Each eye undergoing treatment can be considered to have a maximum dry interval (Tmax), the longest interval maintaining disease stability, which is unknown at the outset of treatment. Each interval extension tests this unknown threshold. Different extension rules are different search strategies, comparable using clinically relevant metrics: search efficiency (visits required to reach a maintenance interval) and overshoot (time spent beyond the disease-controlling interval). No single TREX rule is universally optimal and each represents a trade-off between these two metrics. Performance depends on the underlying Tmax, suggesting that rule choice should be informed by the expected durability distribution for a given disease and anti-VEGF agent. Our previous analysis assumed equal weighting of Tmax across the 4–16-week treatment range. In the present study, we replace this assumption with trial-derived durability priors, and use Monte Carlo simulation to model TREX rule performance across realistic Tmax distributions. We applied Pareto multi-objective optimisation analysis to identify dominated and non-dominated strategies. The goal is to present a framework for a structured, evidence-informed TREX rule comparison across different clinical contexts.
2. Methods
This was a deterministic modelling study. It did not involve human participants. Institutional Review Board approval was therefore not required.
2.1. Model Overview
We modelled a typical patient pathway under a TREX pathway for neovascular AMD (nAMD): the patient has received 4-weekly loading doses and disease stability has been achieved. They enter the extension phase of TREX. At each visit, if disease stability is maintained, the injection interval is increased, up to a pre-defined maximum of 16 weeks. If disease activity recurs, the injection interval is reduced to re-establish disease control. The aim is to maintain treatment at the longest possible disease-controlling interval, typically within 1-2 weeks of the shortest interval at which disease activity recurred. Once this maintenance interval is identified, the search phase is complete and the patient is maintained at that interval for a period of time (e.g. 6 months or 3 injections). This study modelled only the search phase up to the point that a maintenance interval was identified. The maintenance phase and any subsequent re-extension was not modelled.
2.2. Model Assumptions and Definitions
- Each eye was assumed to be stable after 4-week loading doses.
- Each eye was assumed to have a maximum dry interval (Tmax). This is the theoretical longest interval between injections that would maintain disease stability. Tmax is unknown at the outset of treatment. It was assumed to be a fixed property of each simulated eye that does not vary during the initial search phase of TREX.
- If a tested interval was less than or equal to Tmax, the interval was classified as “dry”. If a tested interval exceeded Tmax, the interval was classified as “wet”.
- Once a tested interval exceeded Tmax, all weeks beyond Tmax were counted as overshoot. The mechanics of disease activity, fluid recurrence, and resorption were not modelled.
These assumptions were chosen to clarify the structure of the search problem and allow TREX rules to be compared.
The shortest wet interval was denoted iw. For example, for a wet interval at 12 weeks, all longer intervals were also wet, and iw was 12 weeks. The longest dry interval was denoted id. At the start of TREX, id =4 weeks and iw was undetermined. Each time an interval was tested and found to be dry or wet, id or iw was updated accordingly. The maintenance interval (M) was the point at which the dry/wet threshold had been bracketed such that iw - id ≤ 2 weeks. A gap of 2 weeks was chosen as this represents typical clinical practice in settling at a maintenance interval. At this point the patient is maintained at this longest dry interval (id = M) as any interval longer than id has already been shown to be wet, aside from when the maximum permitted interval (16 weeks) was reached without recurrence.
2.3. TREX Search Strategies (Deterministic Rules)
Four example TREX rules were evaluated. We compared 2- and 4- week extension rules as well as a binary-like midpoint rule. The framework and model can accommodate any other search rules and our analysis is intended to demonstrate how TREX rules can be compared, rather than recommend a particular rule.
For each rule, injections continued until the criterion for the maintenance interval was reached (iw - id ≤ 2 weeks). Figure 1 shows example pathways for each rule for a Tmax of 12 weeks.
- 1)
- +2/−2 rule
When the macula is dry, the treatment interval is extended by 2 weeks. When wet, the interval is shortened by 2 weeks.
- 2)
- +4/−4 rule with midpoint refinement
When dry, the interval is extended by 4 weeks. When wet, the interval is shortened by 4 weeks back to the last known dry interval. A single midpoint refinement is then performed by testing an interval 2 weeks longer than this last dry interval (halfway between the dry and wet intervals). If this test was also wet, the interval was shortened to the last dry interval. If dry, this met the maintenance interval criterion.
- 3)
- +4/−2 rule
When dry, the interval is extended by 4 weeks. When a wet visit occurs, the interval is shortened in 2-week steps until a dry interval is re-established.
- 4)
- Midpoint (binary-like) rule using id and iw
We implemented a binary-like, midpoint bracketing strategy on a 1-week grid. Each eye has a search bracket, bounded by id and iw [id,iw]. At the start of treatment id = 4weeks and iw was assigned a notional upper bound of 16 weeks and the search bracket is [4,16]. At each visit, the next interval was chosen as the integer midpoint of the current bracket (e.g. [4,16] – next tested interval is 10 weeks). A dry event updated id and a wet event updated iw. Testing continued until iw - id ≤ 2 weeks and the maintenance interval was determined as id. A worked example is provided in Supplementary material S1 (available at https://www.ophthalmologyretina.org/).
The midpoint rule was included because midpoint bracketing is a theoretically efficient threshold-search strategy. With longer-acting agents and a wider search range, it requires fewer steps to find a threshold than a linear search.
For each TREX rule, deterministic pathways were enumerated for each Tmax from 4 to 16 weeks. For each value of Tmax and each TREX rule, the pathway showed the number of visits required to find the maintenance interval as well as the size of the cumulative and maximum overshoot. Full deterministic pathway tables are shown in Supplementary material S2 (available at https://www.ophthalmologyretina.org/).
2.4. Deriving a Tmax Distribution from Published Durability Data
The reported year 1 maintenance intervals from nAMD trial data and real-world cohort studies were used to derive durability priors for the Monte Carlo simulation. Primary analysis was done using year-1 data from the TENAYA and LUCERNE trials 5. Sensitivity analyses were conducted using maintenance data from the FARIT study 6 and a real-world aflibercept 2mg cohort study 7.
Maintenance intervals, the proportions of patients maintained at a particular injection interval, were taken as a pragmatic proxy for Tmax. This is an imperfect proxy and was used in the absence of more granular reactivation timing data.
Trial and cohort data report maintenance intervals at fixed time points (e.g. 8, 12 and 16 weeks). Intermediate weekly values were interpolated using a piecewise constant hazard model, assuming a constant hazard within each segment between reported maintenance intervals. The resulting survival curve (S(t)) was used to generate a discrete probability function for Tmax by taking the week-to-week decrease in S(t). A cumulative distribution function (CDF) was calculated from this and used to sample values of Tmax for simulated eyes using inverse transform sampling. Full interpolation workings, derived weekly survival values, and CDF tables for all three durability distributions are provided in Supplementary material S3 (available at https://www.ophthalmologyretina.org/).
2.5. Monte Carlo Simulation Wrapper
A Monte Carlo simulation (N=10,000 simulated eyes) was implemented in MS Excel as a wrapper around the deterministic pathways.
For each simulated eye, a value of Tmax was sampled from the derived CDF using inverse transform sampling. The deterministic outcome metrics for that Tmax and TREX rule were then retrieved from the pre-enumerated pathway table. Because outcome metrics are fully determined by Tmax and the search rule, the Monte Carlo simulation functions as a weighted sampling procedure, drawing Tmax values from the trial-derived CDF and aggregating the corresponding deterministic outcomes across N=10,000 simulated eyes. This was confirmed by computing weighted means directly from the pathway tables and CDF — results were consistent with MC simulation means to one decimal place across all analyses.
2.6. Outcome Measures
For each TREX rule and for each durability distribution (TENAYA/LUCERNE, FARIT, Aflibercept 2mg cohort), we calculated the following:
- Number of visits required to find maintenance interval – median/mean.
- Overshoot – for any tested interval (I) that exceeded Tmax, overshoot duration was defined as I-Tmax.
- Cumulative overshoot was the sum of overshoot across all visits for a given pathway, reported as median/mean.
- Maximum single overshoot was the largest single overshoot for a pathway.
The distribution of cumulative and maximum overshoots was reported e.g. % of eyes with 0, 1,2,3, etc weeks of cumulative/maximum overshoot for each TREX rule.
2.7. Pareto Analysis of Efficiency–Safety Trade-Offs
We used Pareto multi-objective optimisation to compare TREX rule performance. Each TREX rule was summarised as a point on a graph of mean visits to maintenance interval (x-axis) and mean cumulative overshoot (y-axis). Rules were classified as "dominated" or "non-dominated." A dominated rule is one for which an alternative exists that performs at least as well on both metrics and better on at least one. Dominated rules offer no objective advantage in regard to these metrics. Non-dominated rules form the Pareto frontier, representing a genuine trade-off, where improving on one metric necessarily worsens the other. The choice between them must be made on some other grounds, such as clinical context or preference. In our Pareto plot, maximum single overshoot, encoded as the marker shape, provides additional information to inform the choice between non-dominated strategies.
2.8. Results
Figure 2 shows the derived year-1 durability survival (S(t)) curves, with the proportion of eyes maintained at or beyond time t in weeks. Triangle markers show values taken from published year-1 maintenance intervals. All other time points represent interpolated values as described in Methods and Supplementary material. The FARIT survival curve showed a higher proportion of eyes maintained at longer intervals at year 1 than in the TENAYA/LUCERNE trials. Data from a real world aflibercept cohort study shows a distribution shifted to shorter overall durability with a steeper decline in S(t) with no patients being maintained at intervals beyond 14 weeks.
2.9. Primary Analysis - TENAYA/LUCERNE-Derived Faricimab Distribution for Treatment of nAMD
Table 1A summarises efficiency and overshoot metrics for the four search strategies using the TENAYA/LUCERNE-derived Tmax distribution (Monte Carlo N=10,000 simulated eyes).
A trade-off was observed between visit burden (visits to M) and overshoot (mean cumulative and maximum single overshoot). The +4/-2 rule required the fewest visits to find maintenance (mean 3.6 visits). The +2/-2 rule required the most visits to maintenance (mean 5.8) but had the lowest mean cumulative overshoot (0.8 weeks) and a maximum single overshoot of 2 weeks. The midpoint strategy showed similar efficiency to the +4/-2 rule (mean 3.9 visits to maintenance) but with a lower overshoot than the +4 rules (mean cumulative overshoot 0.9 weeks vs 1.9 weeks for + 4 rules, maximum single overshoot 3 weeks vs 4 weeks for +4 rules).
The +4 rules both had a less favourable overshoot distribution than +2/-2 and midpoint rules. For each of the +4 rules, 30% of simulated eyes had a cumulative overshoot ≥ 4 weeks compared with 0% and 5% for +2/-2 and midpoint rules respectively. For maximum single overshoot, 30% of eyes under the +4 rules had an overshoot of ≥ 3 weeks vs 0% and 5% for +2/-2 and midpoint rules respectively (full overshoot distributions for all three durability priors are provided in Supplementary Table S4, available at https://www.ophthalmologyretina.org/).
Figure 3A summarises these trade-offs in a Pareto plot (mean visits to maintenance vs mean cumulative overshoot). The +4/-4 rule was dominated by the midpoint rule (midpoint had both fewer mean visits and a lower mean cumulative overshoot). The remaining rules formed the Pareto frontier: +4/−2 had lowest visits but higher overshoot, midpoint showed intermediate visits with low overshoot, and +2/−2 had the lowest overshoot but highest visits. Maximum single overshoot, encoded as marker shape, was 2 weeks for +2/-2, 3 weeks for midpoint, and 4 weeks for both +4 rules.
2.10. Sensitivity Analysis 1 – FARIT Study-Derived Real World Faricimab Distribution (nAMD)
The +4/-2 rule was the fastest (mean 3.5 visits to maintenance). Midpoint and +4/-4 had similar speed (~4 visits to maintenance each) while +2/-2 was slowest (mean 6.1 visits). The midpoint rule had the lowest cumulative overshoot (mean 0.5 weeks) followed by +2/-2 (0.6 weeks). Both + 4 rules had just over 1 week of cumulative overshoot.
For the midpoint and +2/-2 rules, >98% of simulated eyes had between 0 and 2 weeks of cumulative or maximum single overshoot. By contrast, for both +4 rules, 10% of eyes had 6 weeks of cumulative overshoot and 10% had a maximum single overshoot of 4 weeks.
In the Pareto analysis (Figure 3B), +4/-4 and +2/-2 were dominated. The Pareto frontier was comprised of the +4/-2 and midpoint rules. +4/-2 was marginally faster (3.5 vs 4.0 visits to maintenance) but with notably worse overshoot metrics than the midpoint rule. The FARIT-derived durability distribution was the only analysis where the +2/-2 rule was dominated. This distribution provided the strongest case for the midpoint rule across all three durability distributions.
Sensitivity analysis 2 – real-world aflibercept 2mg durability distribution (nAMD)
Mean visits to maintenance were similar across all rules (3.6-4.6 visits). +2/-2 performed best on all overshoot metrics with a maximum cumulative or single overshoot of 2 weeks. Under both +4 rules, 33% of eyes had 6 weeks of cumulative overshoot and a 4-week maximum overshoot.
Under this shorter durability distribution, the midpoint rule performed poorly on overshoot with up to 9 weeks of cumulative and 6 weeks maximum single overshoot. 30% of eyes had a cumulative overshoot of ≥ 4 weeks and 18% had ≥4 weeks maximum single overshoot.
The Pareto analysis (Figure 3C) showed that both +4 rules were dominated. Midpoint and +2/-2 rules were both Pareto optimal on the primary axes (mean visits to maintenance and mean cumulative overshoot). This analysis illustrates how the choice between non-dominated strategies can be guided by additional metrics. In this case the maximum single overshoot of 6 weeks for midpoint vs 2 weeks for +2/-2 provides a clear rationale for preferring the +2/-2 rule under this durability distribution.
Across all three durability distributions, the +4/-4 rule was consistently dominated. The rules that remained as the Pareto frontier depended on the underlying durability distribution. This highlights that no TREX rule is universally optimal. Rule selection should be based on the expected treatment durability and the clinical consequences of overshoot.
2.11. Discussion
Different TREX rules represent different search strategies for locating the threshold between disease stability and recurrence. An unresolved question is how to compare and choose between different extension rules 8,9. The primary contribution of our study is to address this question by presenting a framework to analyse and compare TREX rules on different clinically-relevant metrics. The framework is disease- and agent-agnostic, and can be updated as improved durability data become available. The Pareto plots visualise the speed/overshoot trade-off, identify rules that are objectively inferior on these metrics, and show the set of non-dominated options. Choosing between non-dominated rules depends on clinical context, primarily the expected durability for that disease and agent, and the consequences of overshoot for that patient.
Across all three durability distributions, the +4/-4 rule was dominated. An alternative rule always achieved equal or better performance on both metrics. Where disease reactivation is minor, shortening by 2 weeks is more efficient than shortening by 4 weeks (the +4/-2 rule reaches the maintenance interval faster with identical overshoot metrics). However, where reactivation is more substantial, a larger shortening step may be clinically appropriate regardless of the modelled efficiency advantage of +4/-2. The dominance finding is most relevant when reactivation is mild, and should not be interpreted as a blanket recommendation against 4-week shortening steps.
The remaining rules (+2/-2, +4/-2, and midpoint) occupied different positions on the Pareto frontier depending on the durability distribution. Choosing between these non-dominated rules is broadly guided by two factors. First, a judgement on which axis metric to prioritise, speed or overshoot. For example, in an only-seeing eye with nAMD, minimising overshoot may be paramount, whereas in an eye being treated for a retinal vein occlusion with complete fluid resolution after a single injection, overshoot may be less of a concern and minimising injection burden may be prioritised. Second, where rules are similar on both primary axes, additional metrics, such as the maximum single overshoot, can inform the decision, as illustrated in the sensitivity analyses.
Framing TREX rule choice in terms of this trade-off makes the decision logic transparent, and may support clinical decision-making and discussions with patients regarding the benefits of one TREX strategy over another.
Where minimising overshoot is the priority (e.g. only-seeing eye, aggressive disease, previous significant reactivation), the +2/-2 rule caps the maximum single overshoot at 2 weeks across all durability distributions. This comes at the cost of additional visits, particularly when durability is long.
When longer durability is expected, as in faricimab-treated patients or potentially with newer agents such as aflibercept 8mg 10, the midpoint rule is a rational alternative, achieving comparable or lower overshoot metrics than +2/-2 while requiring substantially fewer visits. Under shorter-durability distributions, however, the midpoint rule carries a substantial risk of large single overshoot events (up to 6 weeks) which may be unacceptable in higher-risk eyes.
The observed differences in overshoot metrics can be understood by considering the survival curves in Figure 2. With a fixed 4-week extension rule, each +4-week extension is less likely to succeed than the last. Using the FARIT-derived curve as an illustrative durability prior, 100% of eyes remained dry extending from 4 to 8 weeks, 95% from 8 to 12 weeks, and just 60% when extending from 12 to 16 weeks. Fixed +4-week rules do not take into account this declining probability of successful extension. The midpoint rule behaves differently. As the search bracket narrows with each observation, step size reduces naturally, tracking the survival curve more closely. This explains its lower overshoot profile under longer-durability distributions and its higher overshoot risk under shorter-durability distributions where the initial large step is more likely to overshoot.
Patwardhan et al demonstrated that an immediate 8-week extension after faricimab loading (from 4 to 12 weeks) was safe and effective in treatment-naive eyes 11. A large first step is taken when the expected durability is long followed by shorter interval refinements thereafter. This can be interpreted as an empirically derived example of midpoint-like reasoning, with a large initial test interval when durability expectations are high, followed by shorter refinements thereafter. Our framework provides an explicit theoretical basis for why this approach is close to optimal under longer durability expectations.
Per-patient differences in visit burden are modest in absolute terms. At service scale, small reductions of 1-2 visits per patient during the search phase of TREX may translate to meaningful demand reductions 12. This is particularly relevant in capacity-constrained services where demand-capacity mismatch carries real risks of delayed treatment.
2.12. Limitations
The treatment pathways in our model are deterministic and Tmax was considered to be fixed during the TREX search phase. In reality, Tmax may drift over time or could possibly be influenced by initial treatment intensity. For the relatively short period of the TREX search phase, a fixed Tmax is a reasonable simplifying assumption. The model is designed for TREX rule comparison and although these assumptions may affect absolute values, relative rule performance is likely to be more stable. Our sensitivity analysis supports this with the +4/-4 rule being consistently dominated, and the midpoint rule being part of the Pareto optimal set for all analyses.
Overshoot is a process metric rather than a clinical outcome. Its relationship to visual acuity, hemorrhage or fluid recurrence is complex and likely non-linear. Adverse events require overshoot (i.e. a period where disease is not controlled) as a necessary precondition. As such, it is a reasonable upstream metric for rule comparison, even if its consequences vary between individuals. Clinical validation studies comparing TREX rule performance on clinical outcome measures are needed.
Durability priors were derived from year-1 maintenance intervals as a pragmatic proxy for Tmax. Year-1 maintenance intervals do not capture those patients who went on to be maintained at longer intervals beyond year one, trial extension and maintenance criteria may differ from those used in clinical practice, and real-world durability distributions may differ to those seen in clinical trials. Our framework should be understood as conditional on the priors used. The intermediate weekly hazards were imputed using a constant hazard assumption. The accuracy of the durability distribution assumptions would be improved by trials reporting intermediate time point reactivation data alongside end point maintenance intervals.
The model covers the 4-16-week range. The same framework and metrics could be applied to longer ranges, such as the 4-24 weeks permitted with aflibercept 8mg, with appropriate durability data.
Prospective studies comparing TREX rules with pre-specified efficiency and overshoot metrics, alongside clinical outcomes, are needed to validate this modelling. Individual predictors (e.g. age, gender, race, OCT biomarkers, initial response to treatment) may be useful to personalise the durability predictions for an individual eye – this may allow the treatment strategy to be tailored to an eye’s particular predicted durability effect. Lee et al showed an association between OCT biomarkers and year-1 maintenance interval, supporting this approach 13. In future, with improved priors, incorporating individual predictors, TREX could be framed as a personalised, data-informed threshold search. Prospective and retrospective validation studies are needed to determine whether these process metrics predict visual, anatomical, and service-level outcomes in routine practice.
Supplementary Materials
The following supporting information can be downloaded at the website of this paper posted on Preprints.org. Supplementary material S1, S2, S3, and Supplementary Table S4.
Author Contributions
KG conceived the study, developed the model, performed analysis, drafted and approved the manuscript.
Funding
No funding was received for this study.
Data Availability Statement
Full deterministic pathways and trial-derived durability distribution calculations are provided in Supplementary Materials S1, S2, and S3, and full overshoot distributions in Supplementary Table S4 (available at https://www.ophthalmologyretina.org/).
Conflicts of Interest
The authors declare no conflicts of interest.
Abbreviations/Acronyms
| anti-VEGF | anti-vascular endothelial growth factor |
| CDF | cumulative distribution function |
| id | longest observed dry interval |
| iw | shortest observed wet interval |
| M | maintenance interval |
| MC | Monte Carlo |
| nAMD | neovascular age-related macular degeneration |
| OCT | optical coherence tomography |
| Tmax | maximum dry interval |
| TREX | treat and extend |
References
- Ohji, M.; Takahashi, K.; Okada, A.A.; Kobayashi, M.; Matsuda, Y.; Terano, Y. Efficacy and safety of intravitreal aflibercept treat-and-extend regimens in exudative age-related macular degeneration: 52- and 96-week findings from ALTAIR: a randomized controlled trial. Adv. Ther. 2020, 37(3), 1173–87. [Google Scholar] [PubMed]
- Bayer plc. Eylea 114.3 mg/ml solution for injection in pre-filled syringe: Summary of Product Characteristics. Electronic Medicines Compendium (emc). 2026. Available online: https://www.medicines.org.uk/emc/product/15840/smpc.
- Gale, R.; Awad, M.H.; Bailey, C.; et al. Aflibercept 8 mg treat-and-extend pathway for the treatment of neovascular age-related macular degeneration: guidance from a UK expert panel. Eye 2026, 1–7. [Google Scholar]
- Gallagher, K. Treat-and-Extend as a Threshold Search Problem—A Deterministic Model of Injection Interval Strategies. Preprints Preprint. 2026, 2026050588. [Google Scholar] [CrossRef]
- Heier, J.S.; Khanani, A.M.; Ruiz, C.Q.; et al. Efficacy, durability, and safety of intravitreal faricimab up to every 16 weeks for neovascular age-related macular degeneration (TENAYA and LUCERNE): two randomised, double-masked, phase 3, non-inferiority trials. Lancet 2022, 399(10326), 729–40. [Google Scholar] [PubMed]
- Lupidi, M.; Iaculli, C.; Marco, L.; Rossi, S.; Sicari, E.; Villa, G.; Pirani, V. Faricimab in the treatment of exudative neovascular age-related macular degeneration and diabetic macular edema in Italy: the FARIT real world study. Ophthalmol. Ther. 2025, 14(9), 2197–214. [Google Scholar] [CrossRef] [PubMed]
- DeCroos, F.C.; Reed, D.; Adam, M.K.; Salz, D.; Gupta, O.P.; Ho, A.C.; Regillo, C.D. Treat-and-extend therapy using aflibercept for neovascular age-related macular degeneration: a prospective clinical trial. Am. J. Ophthalmol. 2017, 180, 142–50. [Google Scholar] [PubMed]
- Chaudhary, V. Treat and extend in neovascular age-related macular degeneration: how we got here and where do we go next? Eye 2023, 37(4), 581–3. [Google Scholar] [CrossRef] [PubMed]
- Chaudhary, V. The need for a pragmatic, individualized treat-and-extend treatment paradigm for centre-involving diabetic macular oedema. Eye 2023, 37(12), 2431–3. [Google Scholar] [PubMed]
- Lanzetta, P.; Korobelnik, J.F.; Heier, J.S.; et al. Intravitreal aflibercept 8 mg in neovascular age-related macular degeneration (PULSAR): 48-week results from a randomised, double-masked, non-inferiority, phase 3 trial. Lancet 2024, 403(10432), 1141–52. [Google Scholar] [PubMed]
- Patwardhan, A.; Ali, N.; Law, S. Intravitreal faricimab in treatment-naïve neovascular age-related macular degeneration: real-world outcome of 12-week extension after the loading dose from a UK centre. Eye 2025, 39(4), 766–70. [Google Scholar] [PubMed]
- Gallagher, K.; Al-Janabi, A. Evaluating the impact of follow-up interval selection on the demand–capacity gap in ophthalmology; Eye, 2026. [Google Scholar]
- Lee, J.H.; Lee, S.Y.; Jang, B.; et al. OCT biomarkers as predictors of treatment interval in neovascular age-related macular degeneration treated with intravitreal aflibercept using a treat-and-extend regimen. Sci. Rep. 2026. [Google Scholar] [PubMed]
Figure 1.
Example deterministic TREX pathways for each rule (Tmax = 12 weeks). Each panel shows the injection interval tested at each visit (x axis) against visit number (y axis). The vertical dashed line shows Tmax =12 weeks. Open circles represent dry visits, filled circles represent wet visit. The dotted horizontal line shows how the final maintenance interval criterion is met. id and iw are the longest dry and shortest wet intervals, respectively. Panel A: +2/-2 rule. Panel B: +4/-4 rule. Panel C: +4/-2 rule. Panel D: midpoint rule. Square parentheses [] show the current search bracket. Full deterministic pathways are provided in Supplementary material S2 (available at https://www.ophthalmologyretina.org/).
Figure 1.
Example deterministic TREX pathways for each rule (Tmax = 12 weeks). Each panel shows the injection interval tested at each visit (x axis) against visit number (y axis). The vertical dashed line shows Tmax =12 weeks. Open circles represent dry visits, filled circles represent wet visit. The dotted horizontal line shows how the final maintenance interval criterion is met. id and iw are the longest dry and shortest wet intervals, respectively. Panel A: +2/-2 rule. Panel B: +4/-4 rule. Panel C: +4/-2 rule. Panel D: midpoint rule. Square parentheses [] show the current search bracket. Full deterministic pathways are provided in Supplementary material S2 (available at https://www.ophthalmologyretina.org/).
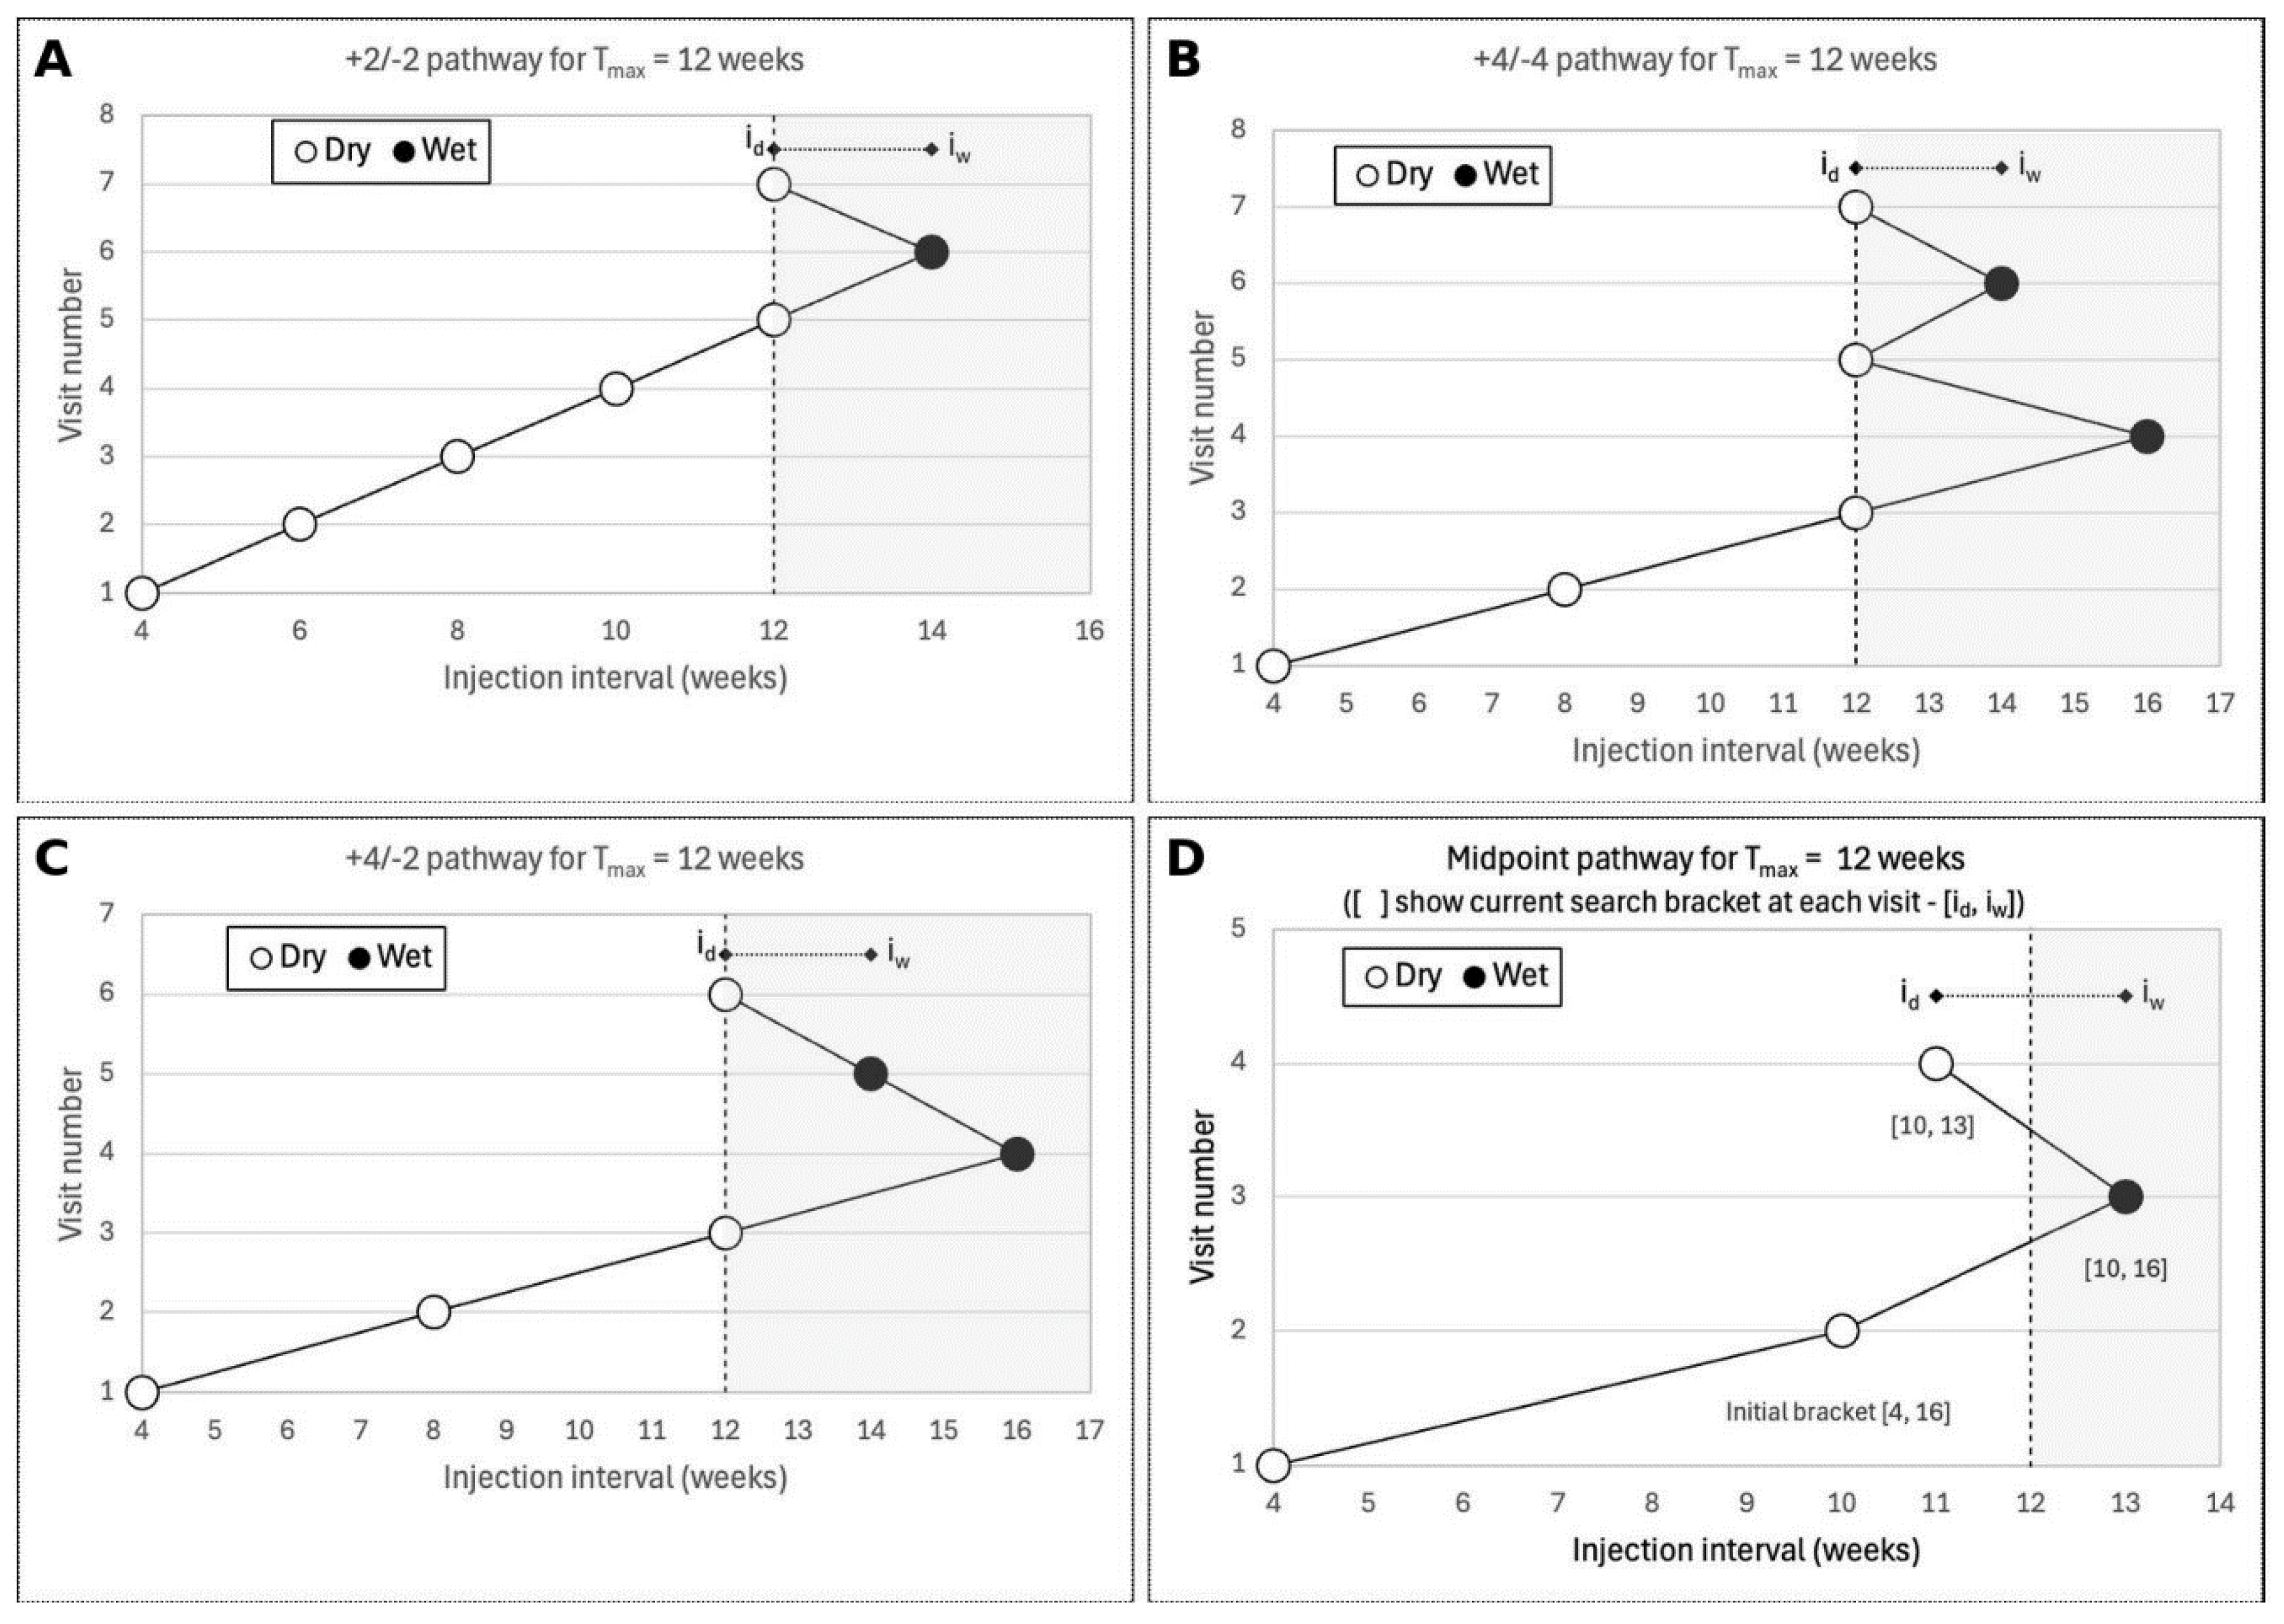
Figure 2.
Derived year-1 durability survival curves used to generate the Tmax distributions. The proportion of eyes maintained at or beyond each injection interval at year 1 (S(t)) is shown for each durability distribution. Triangle markers denote reported year-1 maintenance interval categories from published trial and cohort data. All other points represent interpolated weekly estimates of S(t) derived using the piecewise constant hazard method described in the Methods and Supplementary material. Tenaya/Lucerne: phase 3 faricimab trial data. FARIT: real-world faricimab cohort. Aflibercept 2mg: real-world cohort.
Figure 2.
Derived year-1 durability survival curves used to generate the Tmax distributions. The proportion of eyes maintained at or beyond each injection interval at year 1 (S(t)) is shown for each durability distribution. Triangle markers denote reported year-1 maintenance interval categories from published trial and cohort data. All other points represent interpolated weekly estimates of S(t) derived using the piecewise constant hazard method described in the Methods and Supplementary material. Tenaya/Lucerne: phase 3 faricimab trial data. FARIT: real-world faricimab cohort. Aflibercept 2mg: real-world cohort.
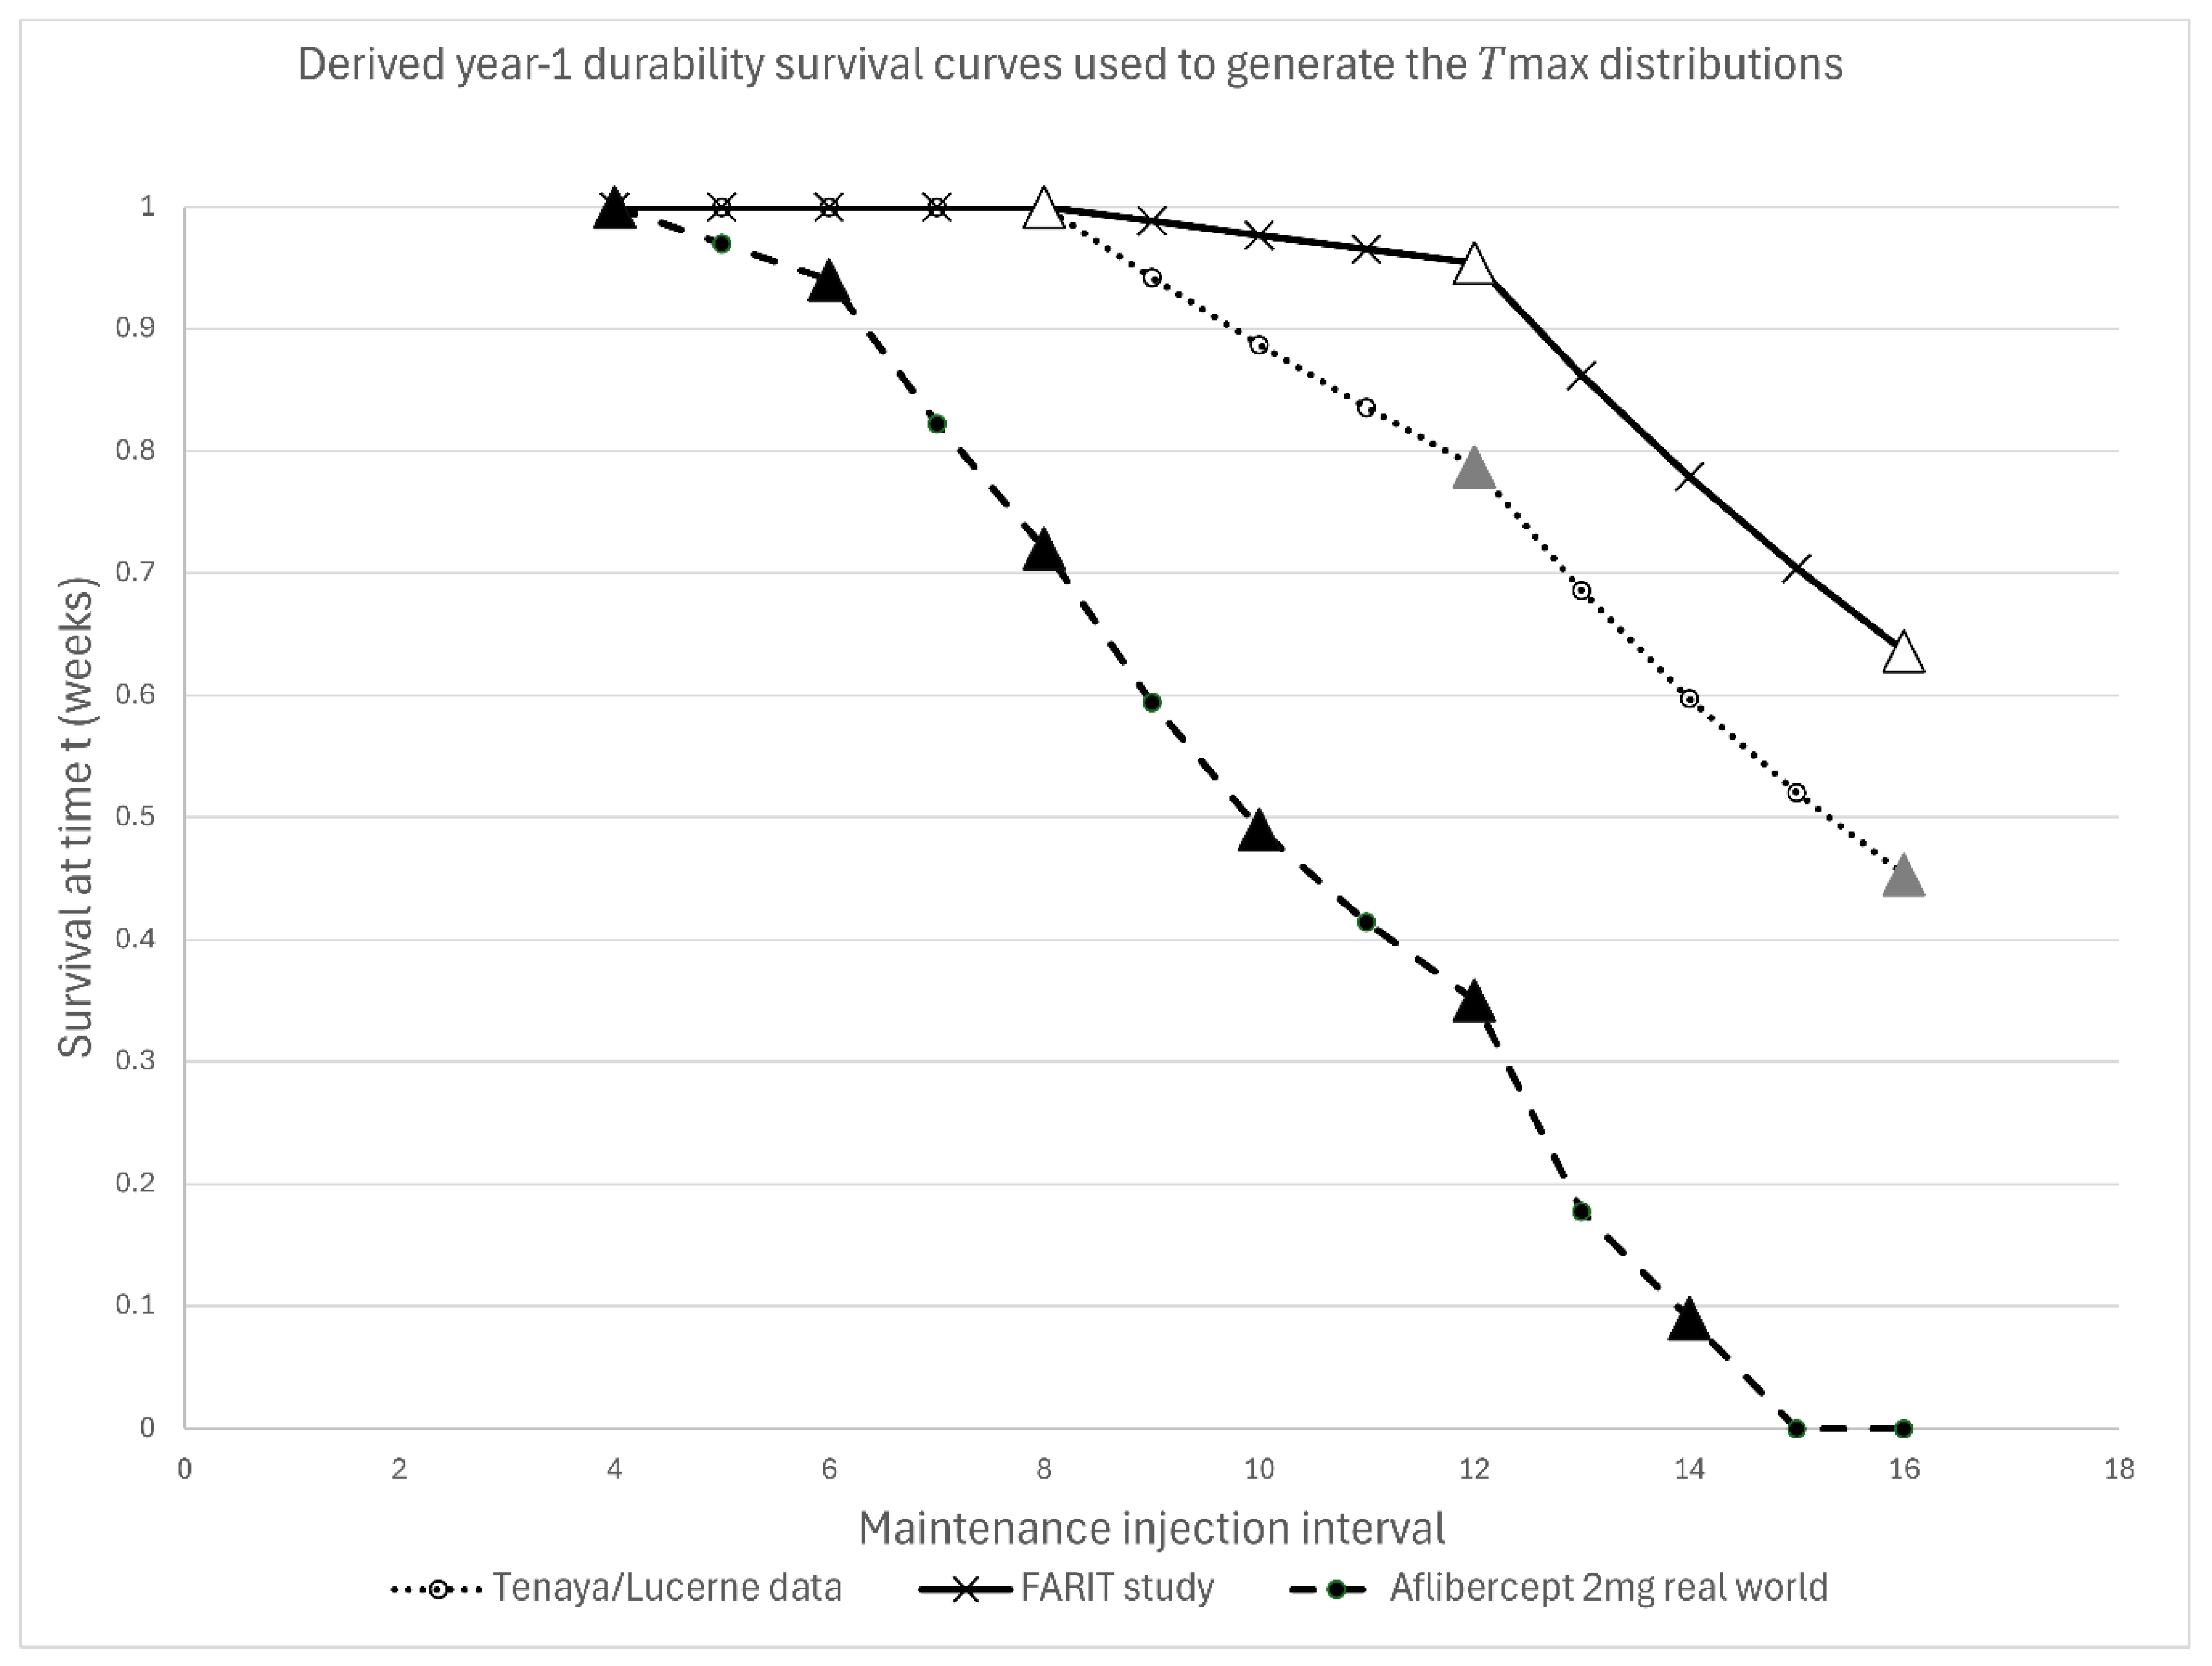
Figure 3.
Pareto analysis of TREX rule performance across three durability distributions. Each TREX rule is plotted as a point in two-objective space: mean visits to maintenance interval (x-axis) and mean cumulative overshoot (y-axis). Marker shape encodes maximum single overshoot. The dotted line connects non-dominated (Pareto-optimal) rules forming the Pareto frontier. Rules not on the frontier are dominated. Panel A: Tenaya/Lucerne-derived faricimab distribution. Panel B: FARIT real-world faricimab distribution. Panel C: Real-world aflibercept 2mg distribution.
Figure 3.
Pareto analysis of TREX rule performance across three durability distributions. Each TREX rule is plotted as a point in two-objective space: mean visits to maintenance interval (x-axis) and mean cumulative overshoot (y-axis). Marker shape encodes maximum single overshoot. The dotted line connects non-dominated (Pareto-optimal) rules forming the Pareto frontier. Rules not on the frontier are dominated. Panel A: Tenaya/Lucerne-derived faricimab distribution. Panel B: FARIT real-world faricimab distribution. Panel C: Real-world aflibercept 2mg distribution.
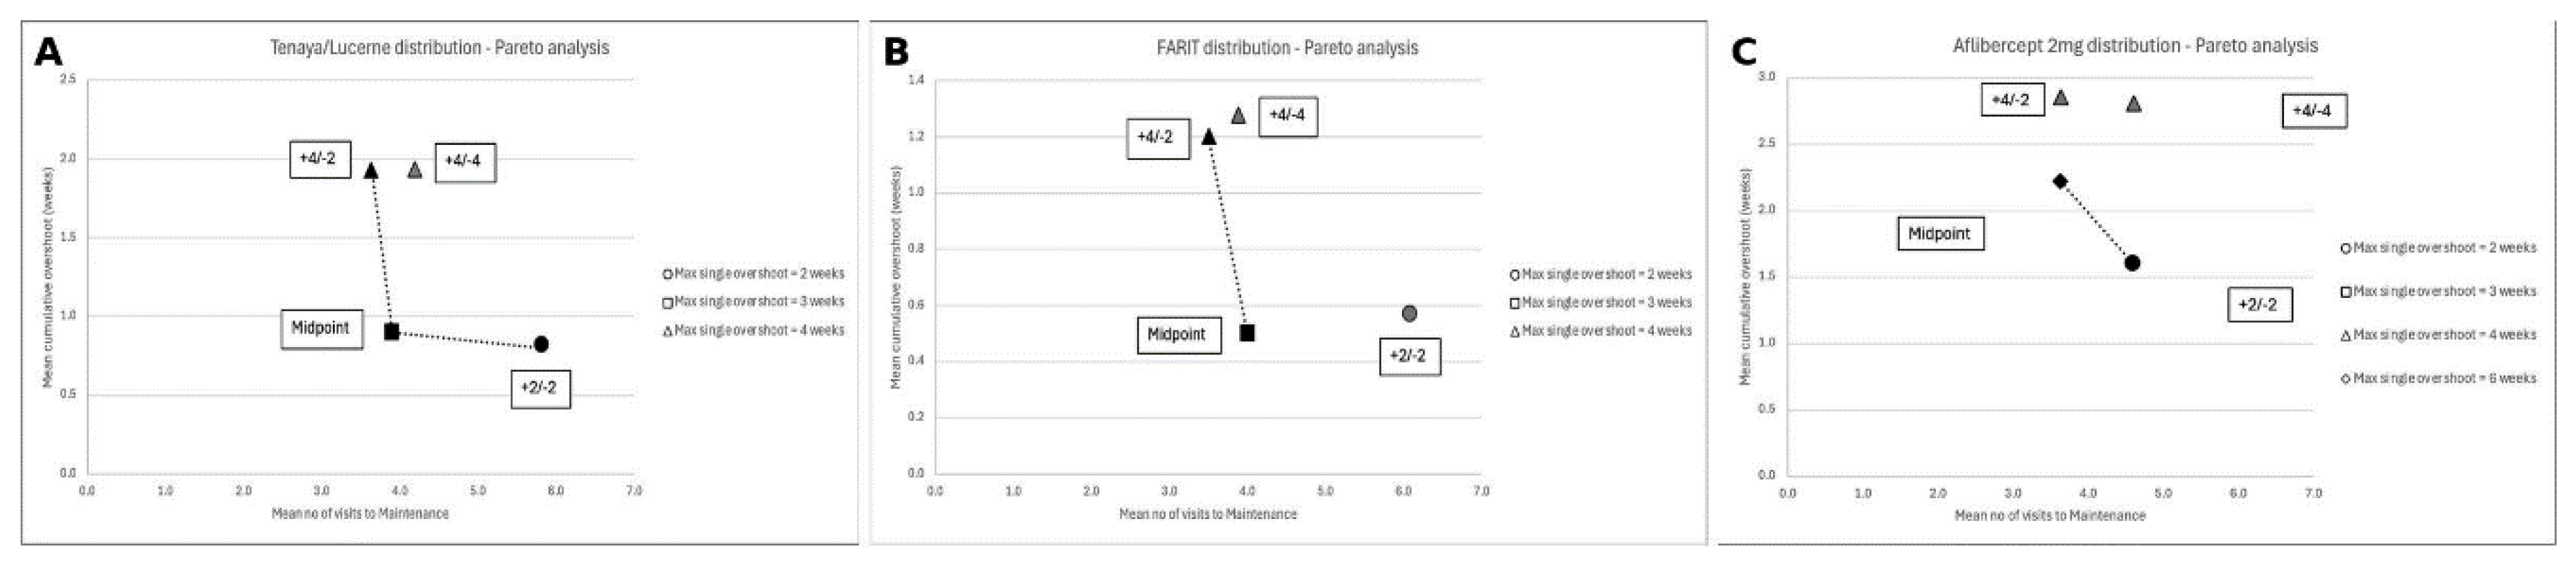

Table 1.
TREX rule performance under three durability priors.
| TREX rules | ||||
| Metric | +2/-2 | +4/-2 | +4/-4 | Midpoint |
| A. TENAYA/LUCERNE faricimab distribution | ||||
| Mean visits to M (SD) | 5.8 (0.8) | 3.6 (0.8) | 4.2 (1.2) | 3.9 (0.5) |
| Mean cumulative overshoot, weeks (SD) | 0.8 (0.8) | 1.9 (2.2) | 1.9 (2.3) | 0.9 (1.1) |
| Maximum cumulative overshoot, weeks | 2 | 6 | 6 | 4 |
| Maximum single overshoot, weeks | 2 | 4 | 4 | 3 |
| B. FARIT real-world faricimab distribution | ||||
| Mean visits to M (SD) | 6.1 (0.5) | 3.5 (0.8) | 3.9 (1.2) | 4.0 (0.4) |
| Mean cumulative overshoot, weeks (SD) | 0.6 (0.8) | 1.2 (2.0) | 1.3 (2.0) | 0.5 (0.8) |
| Maximum cumulative overshoot, weeks | 2 | 6 | 6 | 4 |
| Maximum single overshoot, weeks | 2 | 4 | 4 | 3 |
| C. Aflibercept 2 mg real-world distribution | ||||
| Mean visits to M (SD) | 4.6 (1.4) | 3.6 (1.1) | 4.6 (1.1) | 3.6 (0.5) |
| Mean cumulative overshoot, weeks (SD) | 1.6 (0.5) | 2.8 (1.8) | 2.8 (1.8) | 2.2 (1.9) |
| Maximum cumulative overshoot, weeks | 2 | 6 | 6 | 9 |
| Maximum single overshoot, weeks | 2 | 4 | 4 | 6 |
Monte Carlo simulation, N = 10,000 simulated eyes per distribution. Standard deviation (SD) shown in parentheses. Maximum cumulative and maximum single overshoot values represent the worst-case pathways observed across the 10,000 simulated eyes. Abbreviations: M = maintenance interval; SD = standard deviation; TREX = treat and extend.
Disclaimer/Publisher’s Note: The statements, opinions and data contained in all publications are solely those of the individual author(s) and contributor(s) and not of MDPI and/or the editor(s). MDPI and/or the editor(s) disclaim responsibility for any injury to people or property resulting from any ideas, methods, instructions or products referred to in the content. |
© 2026 by the authors. Licensee MDPI, Basel, Switzerland. This article is an open access article distributed under the terms and conditions of the Creative Commons Attribution (CC BY) license (http://creativecommons.org/licenses/by/4.0/).
Copyright: This open access article is published under a Creative Commons CC BY 4.0 license, which permit the free download, distribution, and reuse, provided that the author and preprint are cited in any reuse.