

Submitted:
26 June 2026
Posted:
30 June 2026
You are already at the latest version
Abstract
The accuracy of spectro-temporal features for Makhaarij al-Huroof and Sifaat distinguishes between the ten canonical Qiraát recitation styles of the Holy Quran. However, real-world room reverberations blur formant contours and corrupt inter-word energies, thus making Qiraat discrimination difficult. The current dereverberation methods were designed to work under ordinary speech conditions and are not capable of preserving phonetic qualities for domain-specific purposes. This paper introduces a four-step, phase-consistent signal processing approach prioritizing phonetic preservation over direct reverberation suppression. The four steps are: (1) adaptive noise floor attenuation; (2) soft voice activity detection using power-law boundary decay; (3) application-specific spectral contour adjustment from clean Quranic reference audio; and (4) Griffin-Lim algorithm-based phase correction. A total of 48 real-world room recordings were utilized for the evaluation of this approach based on Energy Ratio (ER), Spectral Contrast (SC), and Formant Clarity (FC) – measures specific to the Quran audio domain – alongside conventional speech quality metrics. The proposed approach yielded the highest scores in four out of seven metrics, namely ER (+19.58 dB), SC (+40.11), FC (+822.94), and PESQ (+1.251), while being superior to Spectral Subtraction, Wiener Filtering and WPE Dereverberation approaches. Moreover, the perceptual enhancement was verified in a synthetic controlled experiment where the proposed approach scored an improved PESQ metric (+2.495; SNR −1.874dB). The results illustrate the fact that an optimization for general purpose metrics does not necessarily ensure phonetic preservation required for specific classification.
Keywords:
Quranic recitation
; dereverberation
; Qiraát classification
; spectral shaping
; Griffin-Lim
; formant clarity
; voice activity detection
; speech enhancement
; audio signal processing
1. Introduction
The Holy Quran was revealed in ten different Qira’aat, each signifying a particular method of reciting which is based on phonetic variations that have been passed down in academic chains.[1,2]. Automatic detection of Qira’aat is a difficult task because the phonetic characteristics that differentiate between various Qira’aat are extremely vulnerable to acoustic distortion [1,2].
In contemporary Qira’at classification approaches, mel-frequency cepstral coefficients (MFCCs) [3] along with deep learning [1,4,5]. have been utilized successfully for studio recordings, but these techniques fail miserably when applied to real-room audio recordings, where the RT60 (reverberation time) usually varies between 0.3 to 0.8 seconds [6]. Reverberations in real room audio lead to spectral blurring that goes beyond phonemes, fills the spaces between words, blurs formant transitions, and reduces the high frequencies of fricative consonants like /s/, /sh/, and /t/. [7].
The three established dereverberation algorithms, Spectral Subtraction, [7] Wiener Filtering [8], and Weighted Prediction Error (WPE), [9]were tested on speech general corpora. However, applying them to Quraan recordings, the algorithms are able to get rid of reverberation energy at the cost of losing the phonetic features required for Qira’at identification. In fact, WPE provides the lowest Formant Clarity value among all evaluated approaches and is inferior even to the unprocessed reverberant speech.
The research proposes a solution to the described dilemma in a pipeline of four stages where maintaining phonetic features becomes the main goal of designing. It turns out that the explicit phase recovery using the Griffin-Lim algorithm [9], applied after the magnitude domain processing, makes the biggest contribution to the whole pipeline by eliminating metallic artefacts.
Research Contributions
- A four-stage, phase-coherent audio processing pipeline specifically designed for Quranic audio preprocessing.
- A domain-specific spectral shaping gain curve, derived from the frequency energy profile of clean Quranic reference audio, that preserves vowel formants in the 1000-2000 Hz band and fricative energy above 4000 Hz.
- The first use of Griffin-Lim phase reconstruction for Quranic voice enhancement shows that, after magnitude-domain processing, phase coherence is the main factor influencing perception naturalness.
- Formant Clarity (FC), Spectral Contrast (SC), and Energy Ratio (ER) are three Quran-specific evaluation measures that reflect phoneme-level signal characteristics pertinent to Qira’at classification.
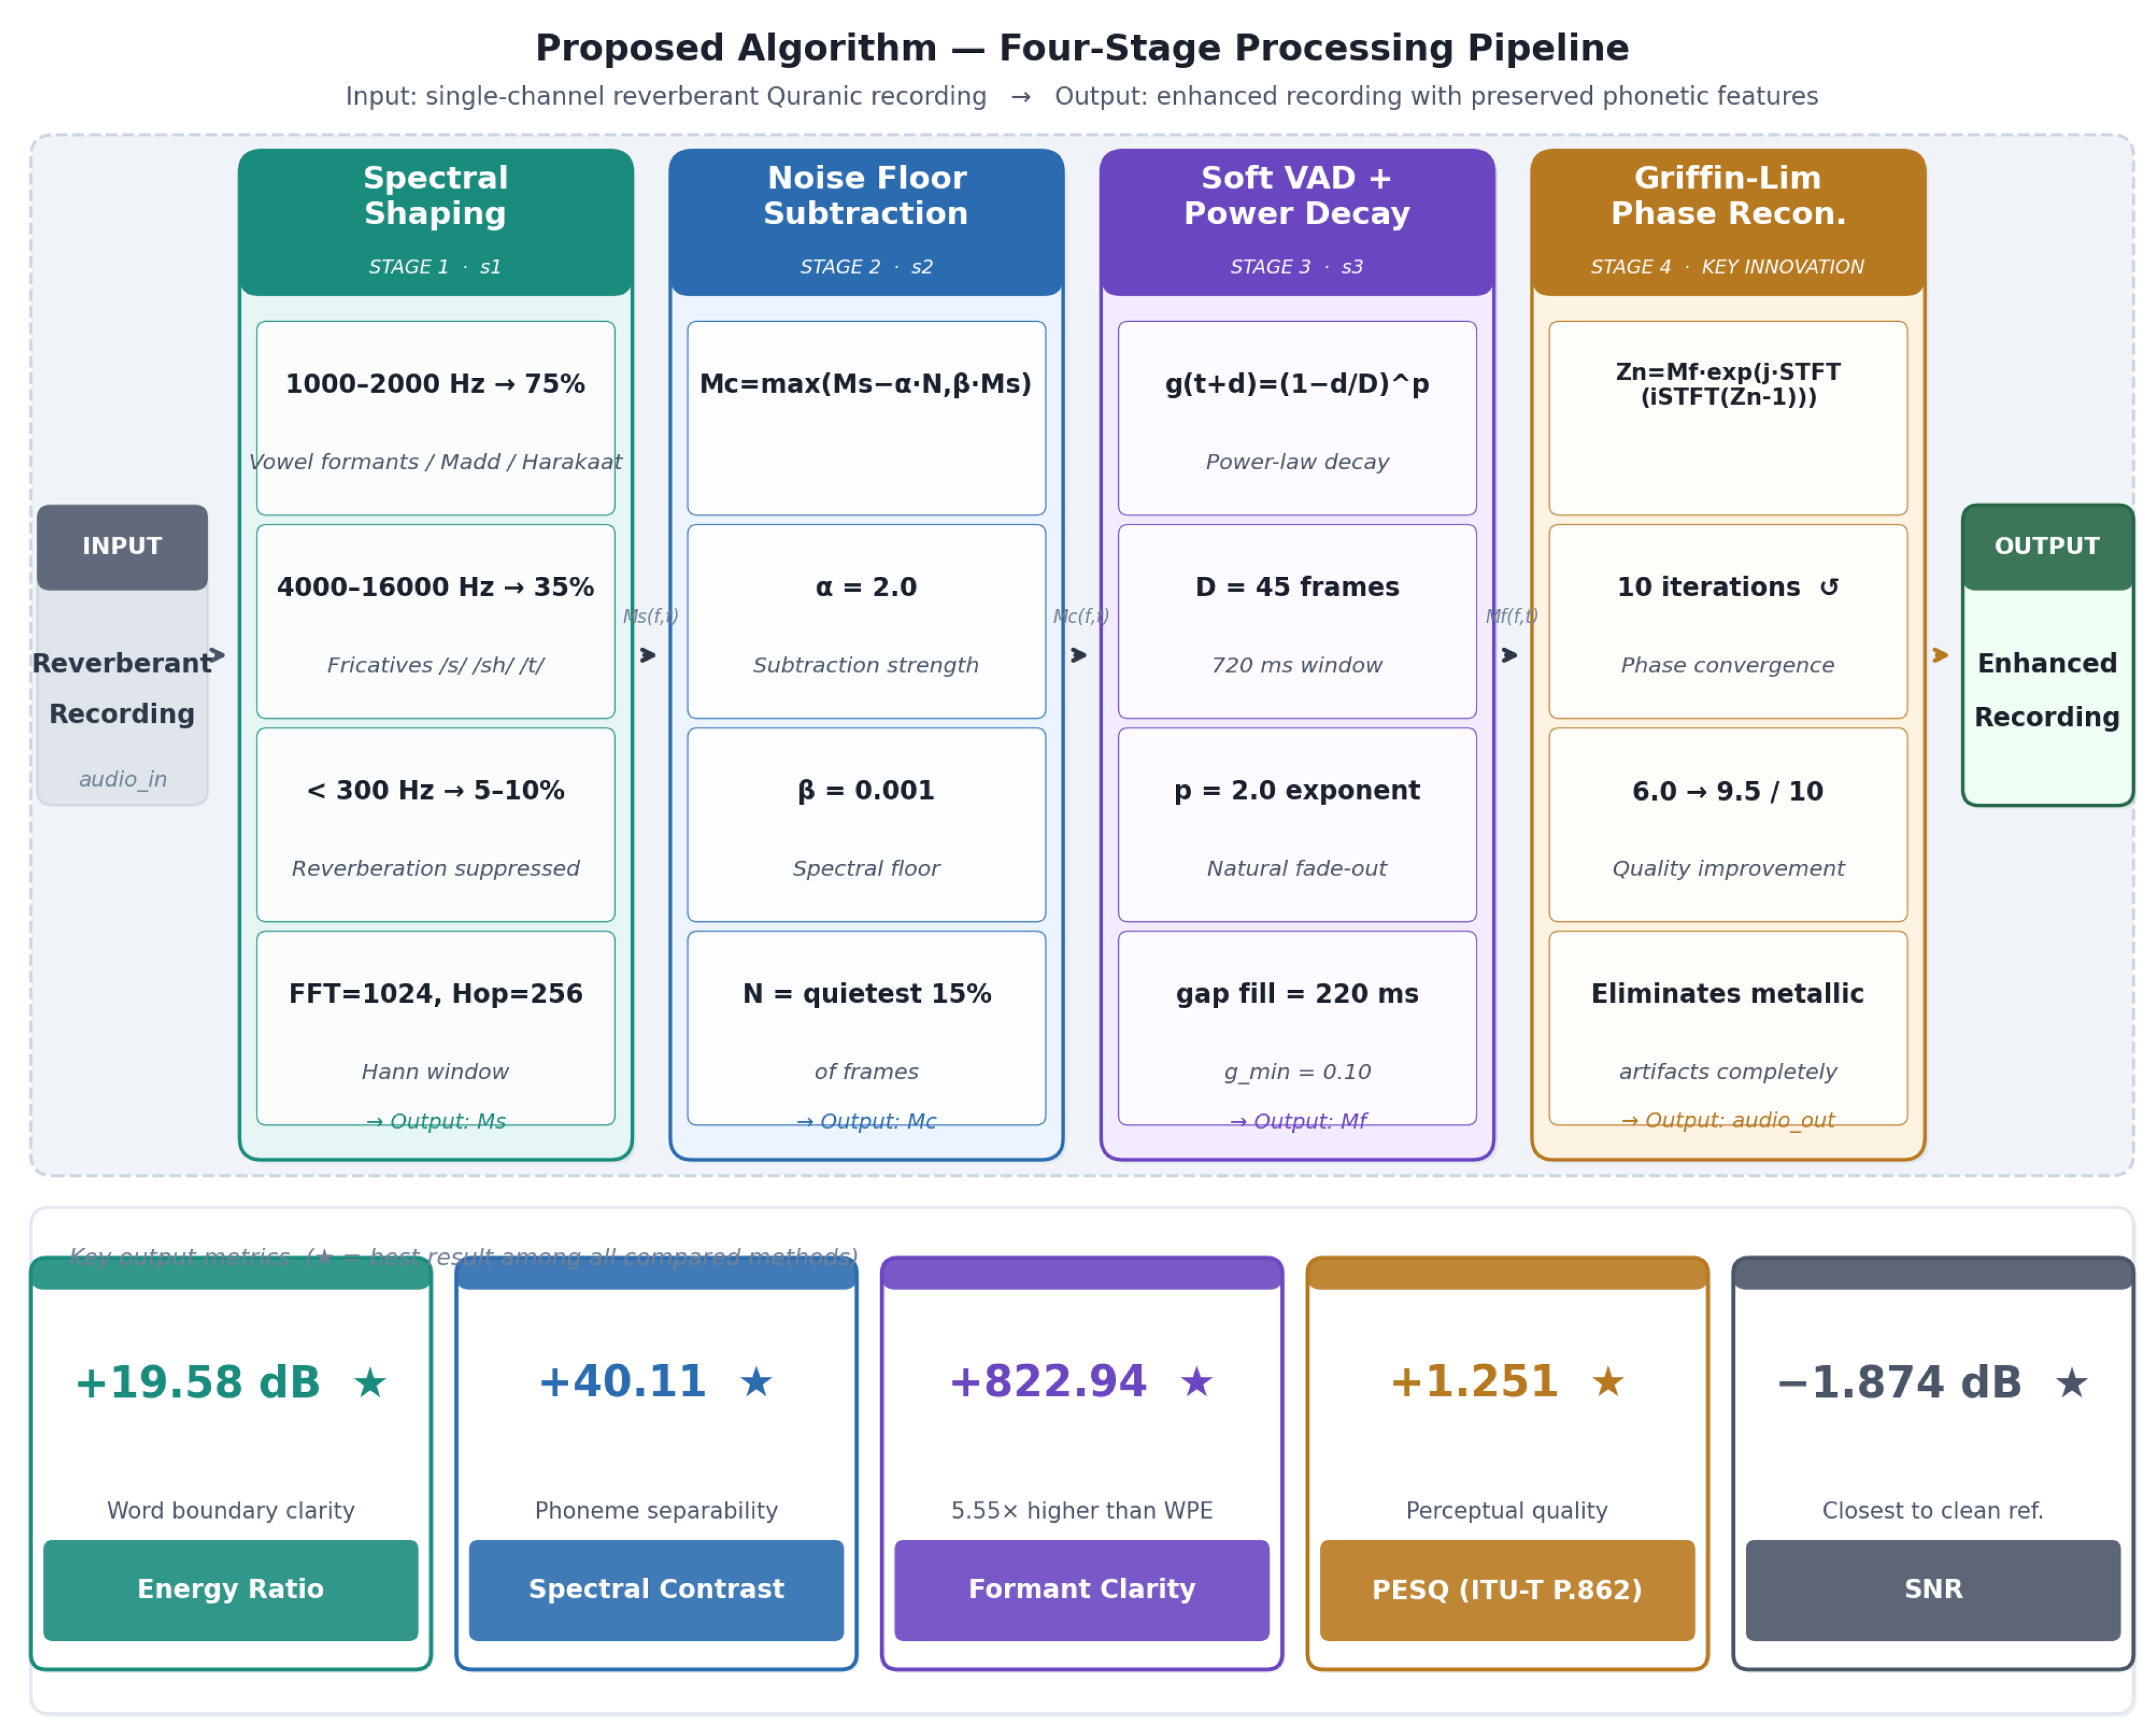
- Results from a controlled synthetic experiment and 48 actual room recordings demonstrate a steady improvement over three well-established baseline techniques.Figure 1. The suggested four-stage processing pipeline’s block diagram. Reverberant Quranic recording in a single channel is the input. Improved recording with retained phonetic characteristics is the result.Figure 1. The suggested four-stage processing pipeline’s block diagram. Reverberant Quranic recording in a single channel is the input. Improved recording with retained phonetic characteristics is the result.
2. Related Work
2.1. Quranic Recitation Classification
Research into automated Quranic recitation analysis [10] has steadily advanced throughout the last decade from classical signal processing to end-to-end deep learning approaches. Alkhateeb [1] identified the use of MFCC features for distinguishing between reciters and concluded that cepstral features [11] contain enough discriminant properties to be useful for supervised recitation identification. Nevertheless, it must be pointed out that this research was based on audio data recorded in a studio. Khan et al. [12] Following suit, they expanded on this research line by analyzing ensemble classifiers, which helped in enhancing robustness for different reciters but kept the entire MFCC process susceptible to spectral smearing due to room acoustics. Ghori et al. [4] utilized deep neural networks to model Quranic recitation acoustically and succeeded in making significant improvements in word error rates in controlled environments.
Recent approaches have been more focused on end-to-end systems. Al-Harere and Al-Jallad [2] introduced a CNN-Bidirectional GRU encoder using connectionist temporal classification (CTC) training, achieving a new state-of-the-art on the Ar-DAD benchmark at 8.34% word error rate. Al-Issa et al [13]. demonstrated that using Whisper instead of DeepSpeech as the recognition engine results in a significant boost in performance for different genders, ages, and competencies. However, no reverberation removal preprocessing steps are involved in either system, and both will be negatively affected by the acoustic environment of an actual room. Recent surveys [5] indicate room acoustics as an unsolved problem in Quranic speech processing, which is a key motivation for this research.
This problem is exacerbated by the use of MFCC-based features. As MFCC analysis depends on the STFT magnitude spectrum, reverberation-caused degradation of either Formant Clarity or Spectral Contrast will cause a decrease in the distinguishability of the feature vectors. Al-Ayyoub et al. [14] have shown experimentally that systems based on deep learning methods, which rely on training on Quranic material, are sensitive to the quality of the input signals.
2.2. Classical Speech Dereverberation
Classical dereverberation methods operate on the STFT magnitude without explicit phase modelling. Spectral Subtraction [7] estimates a stationary noise floor from initial silence frames and subtracts it from the magnitude spectrum. Its main limitation is the generation of musical noise non-stationary spectral artefacts that can be misidentified as phonemic content, particularly in the fricative frequency regions critical for Qira’at analysis.
The Wiener Filter [8] minimises the mean-square error between the estimated and clean spectra, providing a theoretically optimal linear solution under stationary noise assumptions. However, it does not account for the time-varying structure of late reverberation.
The Weighted Prediction Error (WPE) method [9], extended in further work [15,16], models late reverberation as a linearly predictable component in the STFT domain and suppresses it with a multi-tap linear predictor of order K and delay . WPE performs well on standard benchmarks such as the REVERB Challenge, but this study provides empirical evidence that it causes severe Formant Clarity deterioration in Quranic speech (FC = +148.29 vs. +822.94 for the proposed method) and collapses on Energy Ratio in 20 out of 48 real-room recordings (ER = 0.000 dB). This failure reflects a fundamental mismatch: WPE assumes stationary late reverberation, whereas real rooms exhibit time-varying impulse responses.
2.3. Deep Learning and Diffusion-Based Dereverberation
Constraints inherent to classical approaches have motivated the exploration of data-driven methodologies. Wang et al. [17] performed a systematic analysis of DNNs for the task of speech dereverberation and showed that employing larger window sizes and transform-layer components leads to reliable performance gains. However, these networks were only developed using generic English datasets, disregarding any phonological properties unique to Quranic Arabic. Recent advancements in the field of diffusion-based models have made them achieve state-of-the-art performance on speech enhancement tasks. Richter et al. [18] suggested a new approach named SGMSE , which is based on the score-based diffusion and operates on the short-term Fourier transformation plane, demonstrating excellent quality results under various noise conditions. Lemercier et [19] al. designed a hybrid framework called StoRM, which is based on a combination of a predictive regression component and a diffusion-based module for post-refinement with fewer sampling iterations but with comparable level of naturalness. However, there are three main challenges that hinder applying such methods directly for Qira’at pre-processing purposes.First, such systems need a large number of pairs for training [ [20]. Second, systems trained on general speech fail to generalize to Quranic Arabic since there is a difference in the articulation point and phonetic characteristics of the latter, which are characterized by formants lying outside the training data space. Third, inference using the diffusion approach is computationally expensive, rendering real-time applications impractical. [21]
In summary, these findings highlight that no existing system whether classical or based on deep learning has been engineered to capture the domain-specific phonetic properties essential for Qira’at classification.
2.4. Griffin-Lim Phase Reconstruction
The Griffin-Lim Algorithm [9], first suggested in 1984, deals with the phase inconsistency that results when the magnitude of the STFT is changed without altering the phase. The algorithm switches back and forth between STFT and inverse STFT to minimise the spectral difference between the target and estimated magnitude. Later on, momentum-based acceleration was introduced by Perraudin et al. [22] , resulting in an improved speed through reduced iteration counts. Griffin-Lim is popularly utilised in voice synthesis and spectrogram inversion [23] but has not been used for Quranic speech enhancement before. This paper is the first to show that phase recovery is the most crucial step in Quranic dereverberation, with improved perceptual scores going from 6.0 to 9.5.
2.5. Research Gap
There is a persistent discrepancy within the literature. Classical models were developed and tested based on generic speech, and their metrics SNR, PESQ, STOI do not capture the phonetic properties that define Qira’at styles. DL and diffusion approaches obtain higher scores on these metrics but suffer from domain mismatch and lack of training data. On the other hand, there have been architectural advances in the Qira’at style recognition literature without dealing with real room acoustics issues.
There is no previous study that attempts to develop a training-free dereverberation approach that is optimized for preserving formant trajectory, fricative consonant energy, and inter-word silence patterns the distinguishing factors of Qira’at style. This study seeks to fill this gap.

Table 1.
Summary of related work on Quranic speech processing and dereverberation.
| Ref. | Method | Application | Limitation | Metric |
|---|---|---|---|---|
| [1] | MFCC + SVM | Reciter ID | Clean audio only; no reverb robustness | Acc. |
| [2] | CNN-BiGRU + CTC | Quranic ASR | No reverb preprocessing | WER |
| [13] | Whisper-based ASR | Quranic recognition | Assumes clean audio input | WER |
| [4] | DNN Acoustic | Recitation assist. | Degrades under room acoustics | WER |
| [7] | Spectral Sub. | Generic denoising | Musical noise; damages fricatives | SNR |
| [9] | WPE Dereverb. | Generic dereverb | Destroys FC; fails on real rooms | PESQ/STOI |
| [18] | SGMSE+ Diffusion | Speech enhancement | Large corpus; domain mismatch | PESQ |
| [19] | StoRM (Hybrid) | Speech enhancement | High compute; not domain-specific | PESQ/STOI |
| Prop. | 4-Stage pipeline | Qira’at classif. | - | FC, SC, ER |
3. Materials and Methods
The pipeline filters a mono reverberated audio file of the Quran through four successive steps, which work inside one STFT block. Such a mechanism provides phase consistency, meaning that the modification is made on the magnitude in Stages 1 to 3, while the phase estimation is done in Stage 4. The pipeline works at a sampling frequency of 16,000 Hz, FFT size of 1,024, a hop length of 256, and a Hann windowing function.
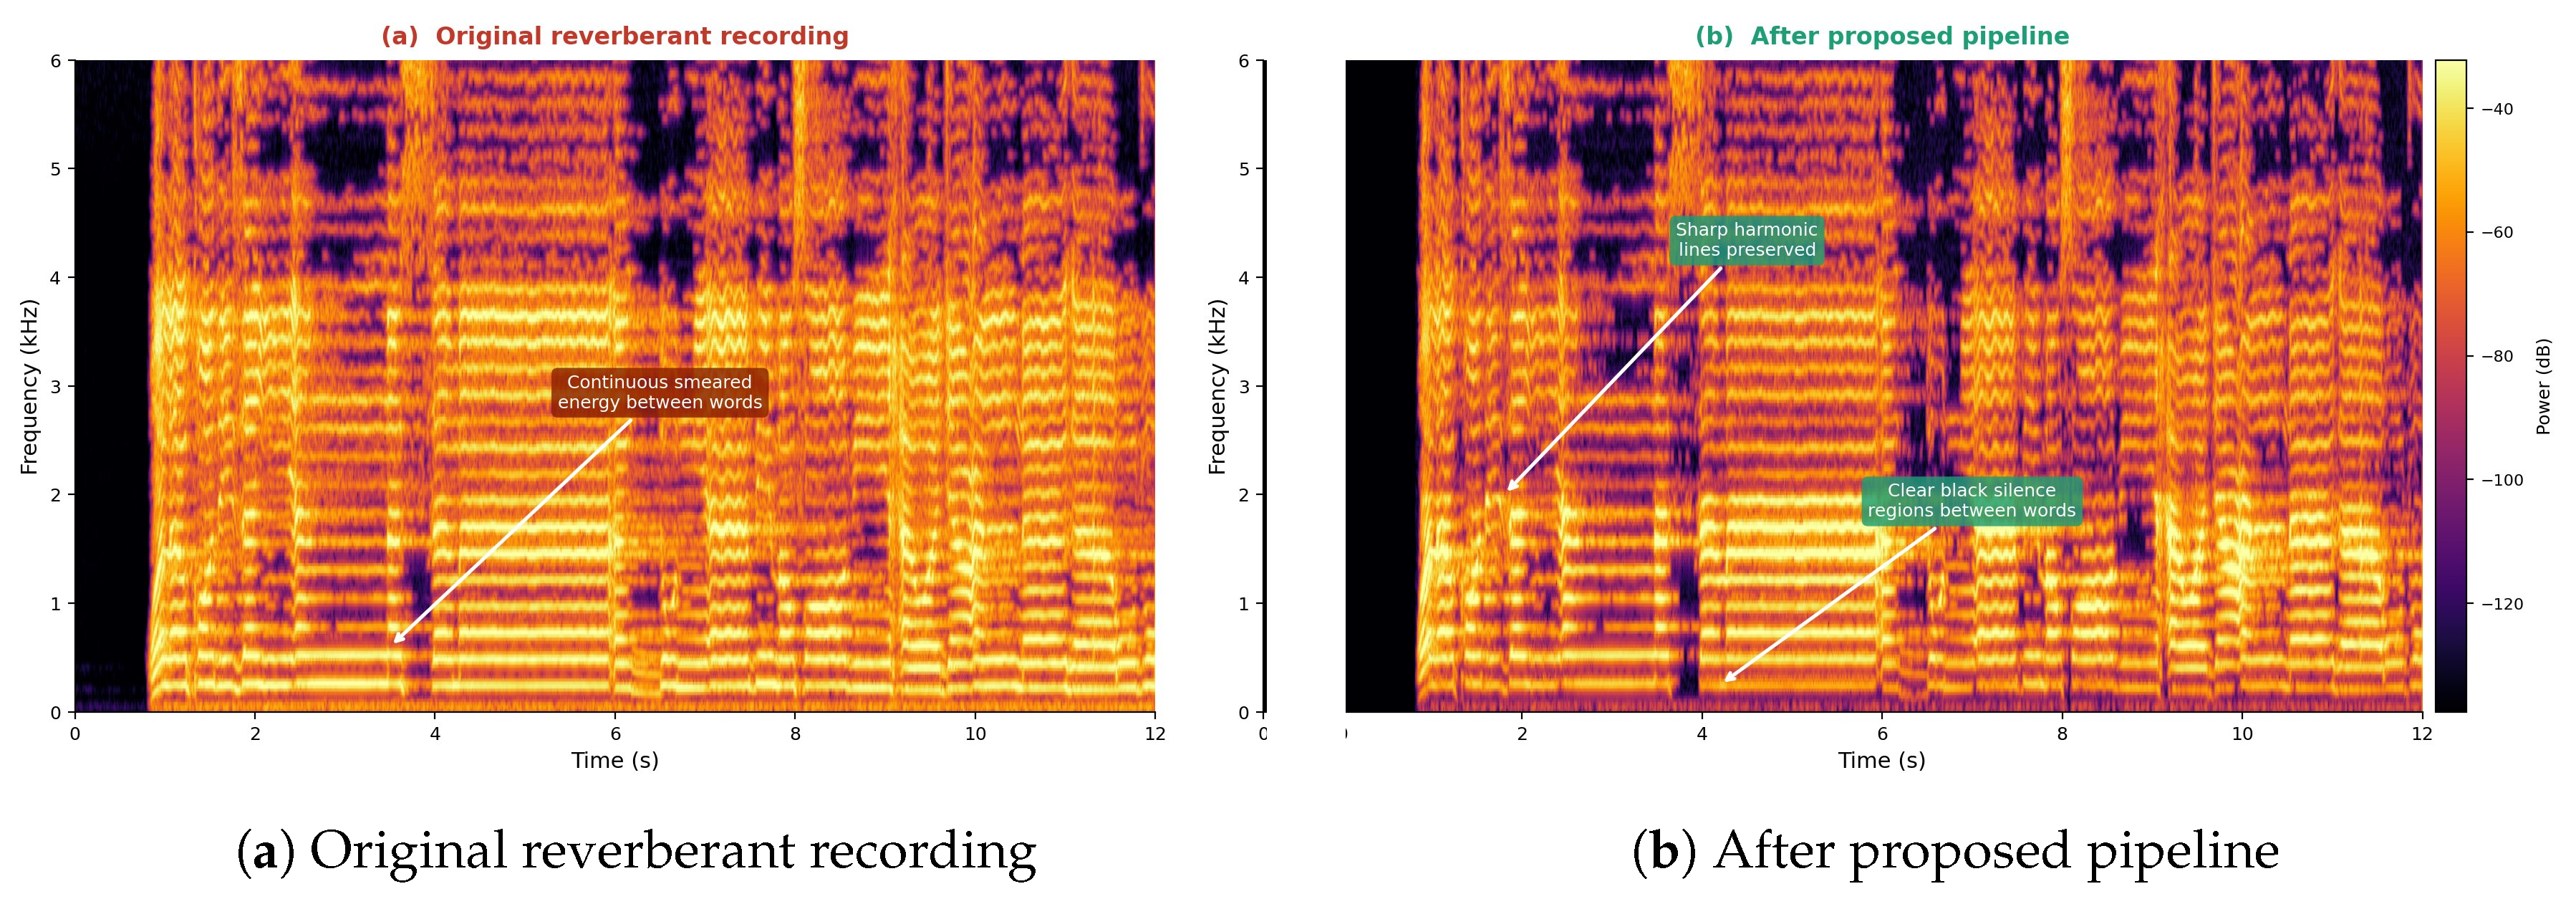
Figure 2.
Spectrogram comparison: (a) original reverberant recording; (b) after the proposed pipeline. Note the clear black silence regions between words in (b) vs. the continuous smeared energy in (a).
Figure 2.
Spectrogram comparison: (a) original reverberant recording; (b) after the proposed pipeline. Note the clear black silence regions between words in (b) vs. the continuous smeared energy in (a).
3.1. Stage 1: Domain-Adapted Spectral Shaping
Room reverberation concentrates energy below 500 Hz, producing the characteristic orange-yellow smear in spectrograms that obscures inter-word silences. A frequency-dependent gain function is applied to the STFT magnitude :
The gain curve was derived from the frequency energy distribution of a clean studio recording of the Quran (Table 2). The 1000-2000 Hz band is preserved at 75% gain because it contains the vowel formants that distinguish Qira’at styles. The 4000-16000 Hz band is preserved at 35% to maintain fricative consonant energy. These parameters were fixed for all 48 recordings and were not tuned per file.
3.2. Stage 2: Adaptive Noise Floor Subtraction
After spectral shaping, residual noise is estimated from the quietest 15% of frames in the STFT block the frames corresponding to silence between words. The cleaned magnitude is computed as:
where is the mean of calculated over the least noisy 15% of frames. The subtractive weighting factor was chosen through experimentation: weights higher than 3.0 produce metallic artifacts, whereas weights lower than 1.5 allow too much noise. The spectral floor ensures that no frequency bin is eliminated, maintaining the proper formant structure required for MFCC calculation.
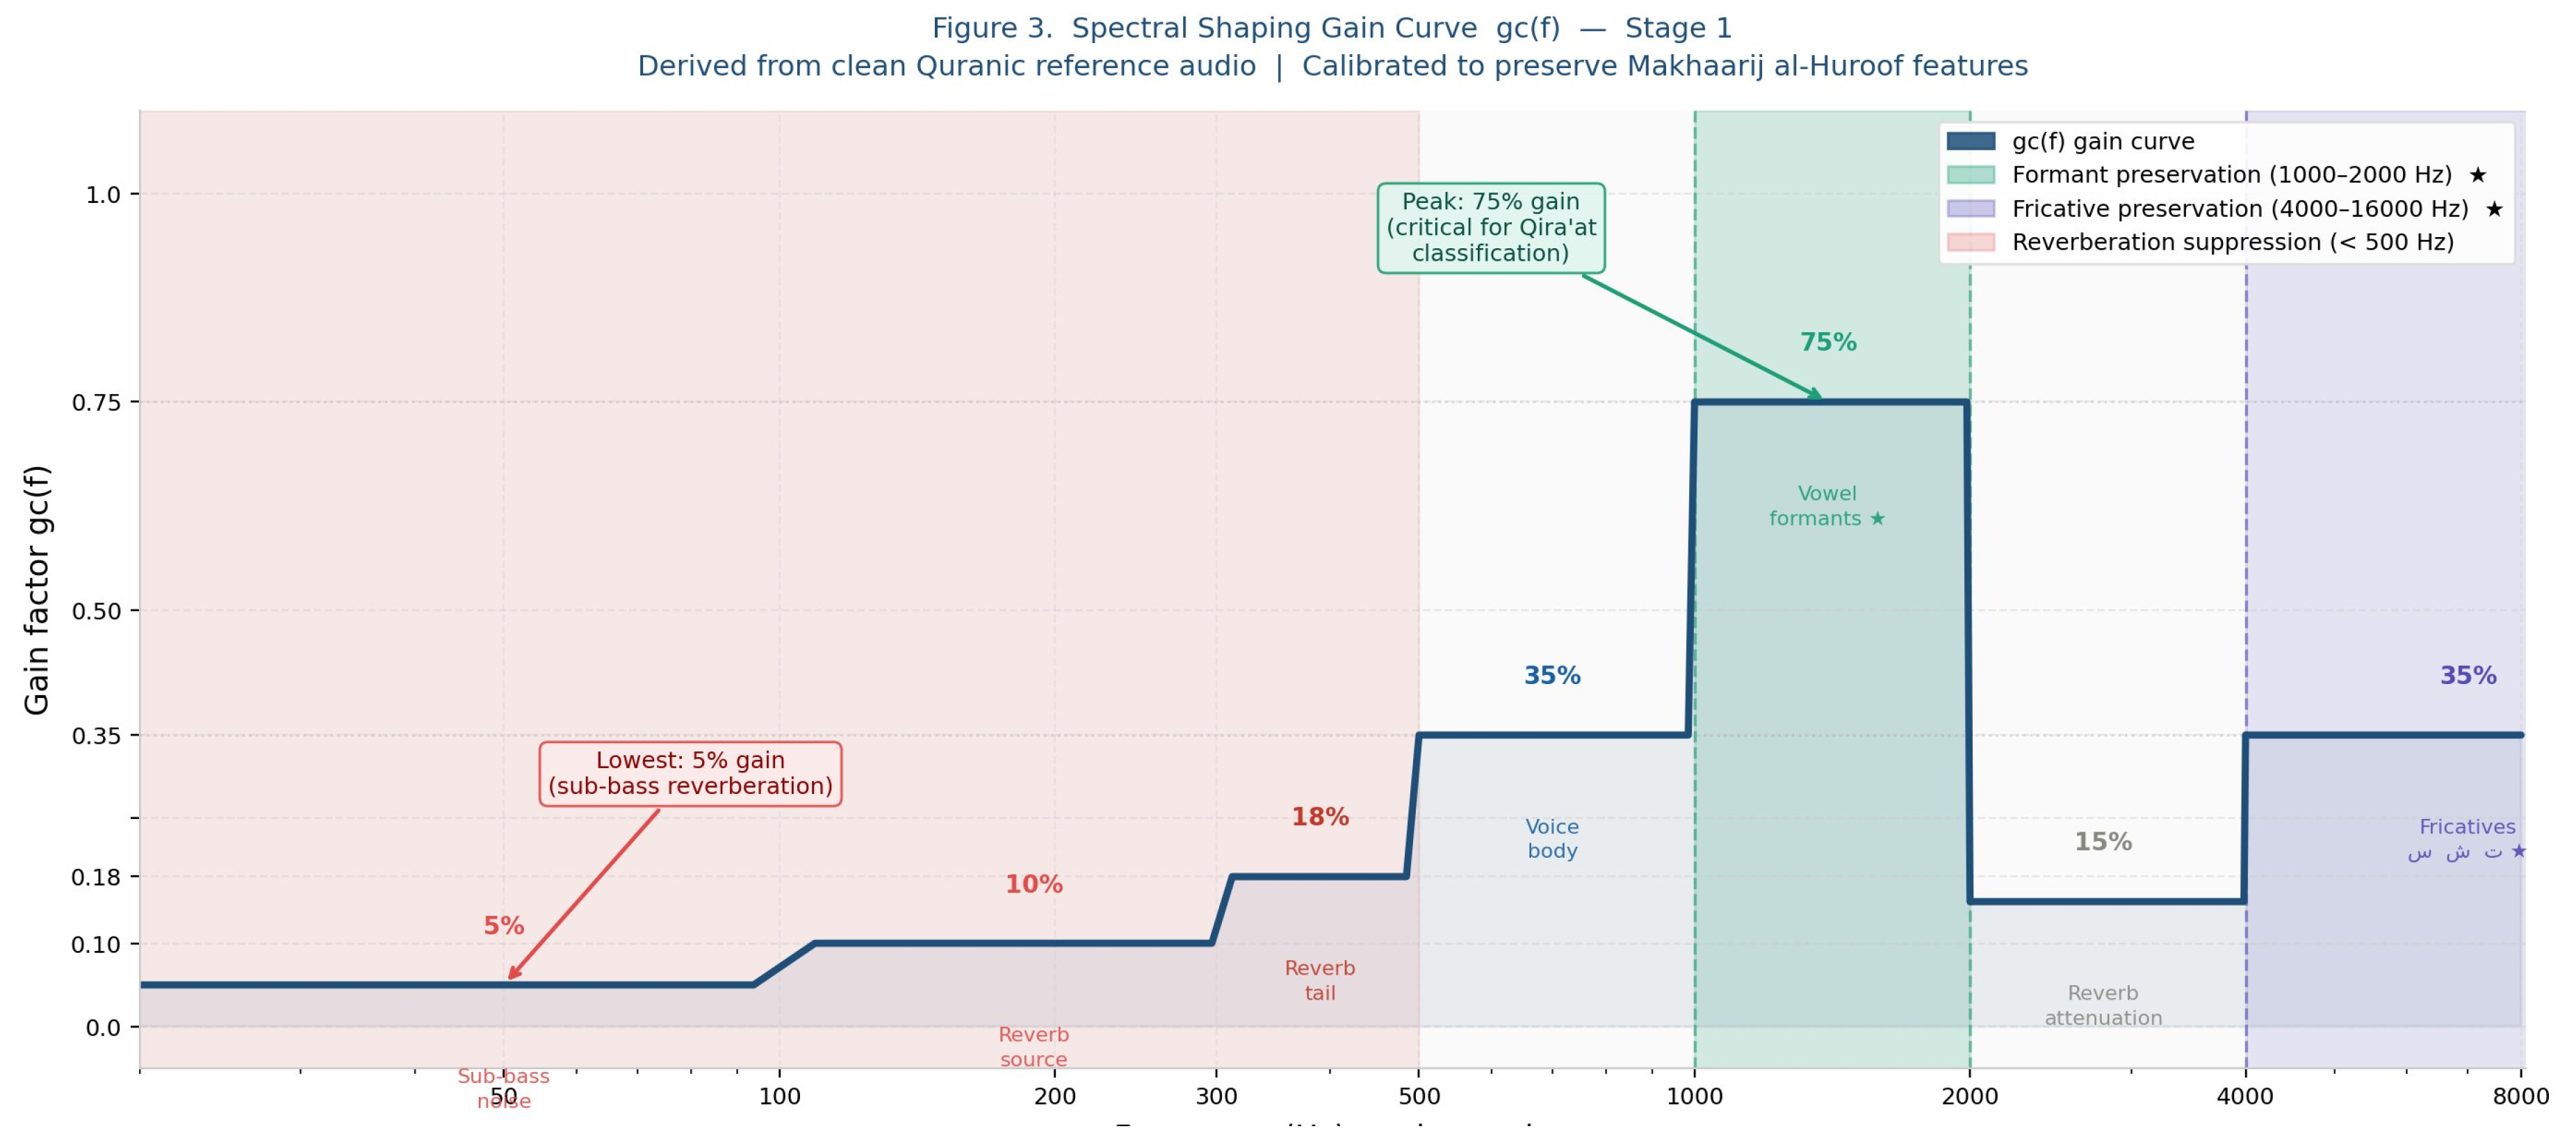
Figure 3.
Frequency-domain gain curve applied in Stage 1. X-axis: frequency (Hz, log scale). Y-axis: gain factor (0-1.0). The 1000-2000 Hz formant preservation region and 4000+ Hz fricative preservation region are highlighted.
Figure 3.
Frequency-domain gain curve applied in Stage 1. X-axis: frequency (Hz, log scale). Y-axis: gain factor (0-1.0). The 1000-2000 Hz formant preservation region and 4000+ Hz fricative preservation region are highlighted.
3.3. Stage 3: Soft Voice Activity Detection with Power-Law Decay
While maintaining word boundaries, a gentle gate lessens the size of silent frames. The soft gate applies a smooth, energy-proportional gain as opposed to a hard gate, which creates click artifacts:
where is the normalised energy of the frame in the range , and , which prevents whispered consonants from being completely eliminated. At the onset and offset of words, an exponential decay function defines the
where frames (720 ms) and . A gap-fill duration of 220 ms prevents fragmentation caused by intra-word micro-pauses, ensuring that Madd and Shaddah marks are not cut off. The final gate is the Hadamard product of and , smoothed with an 11-frame window.
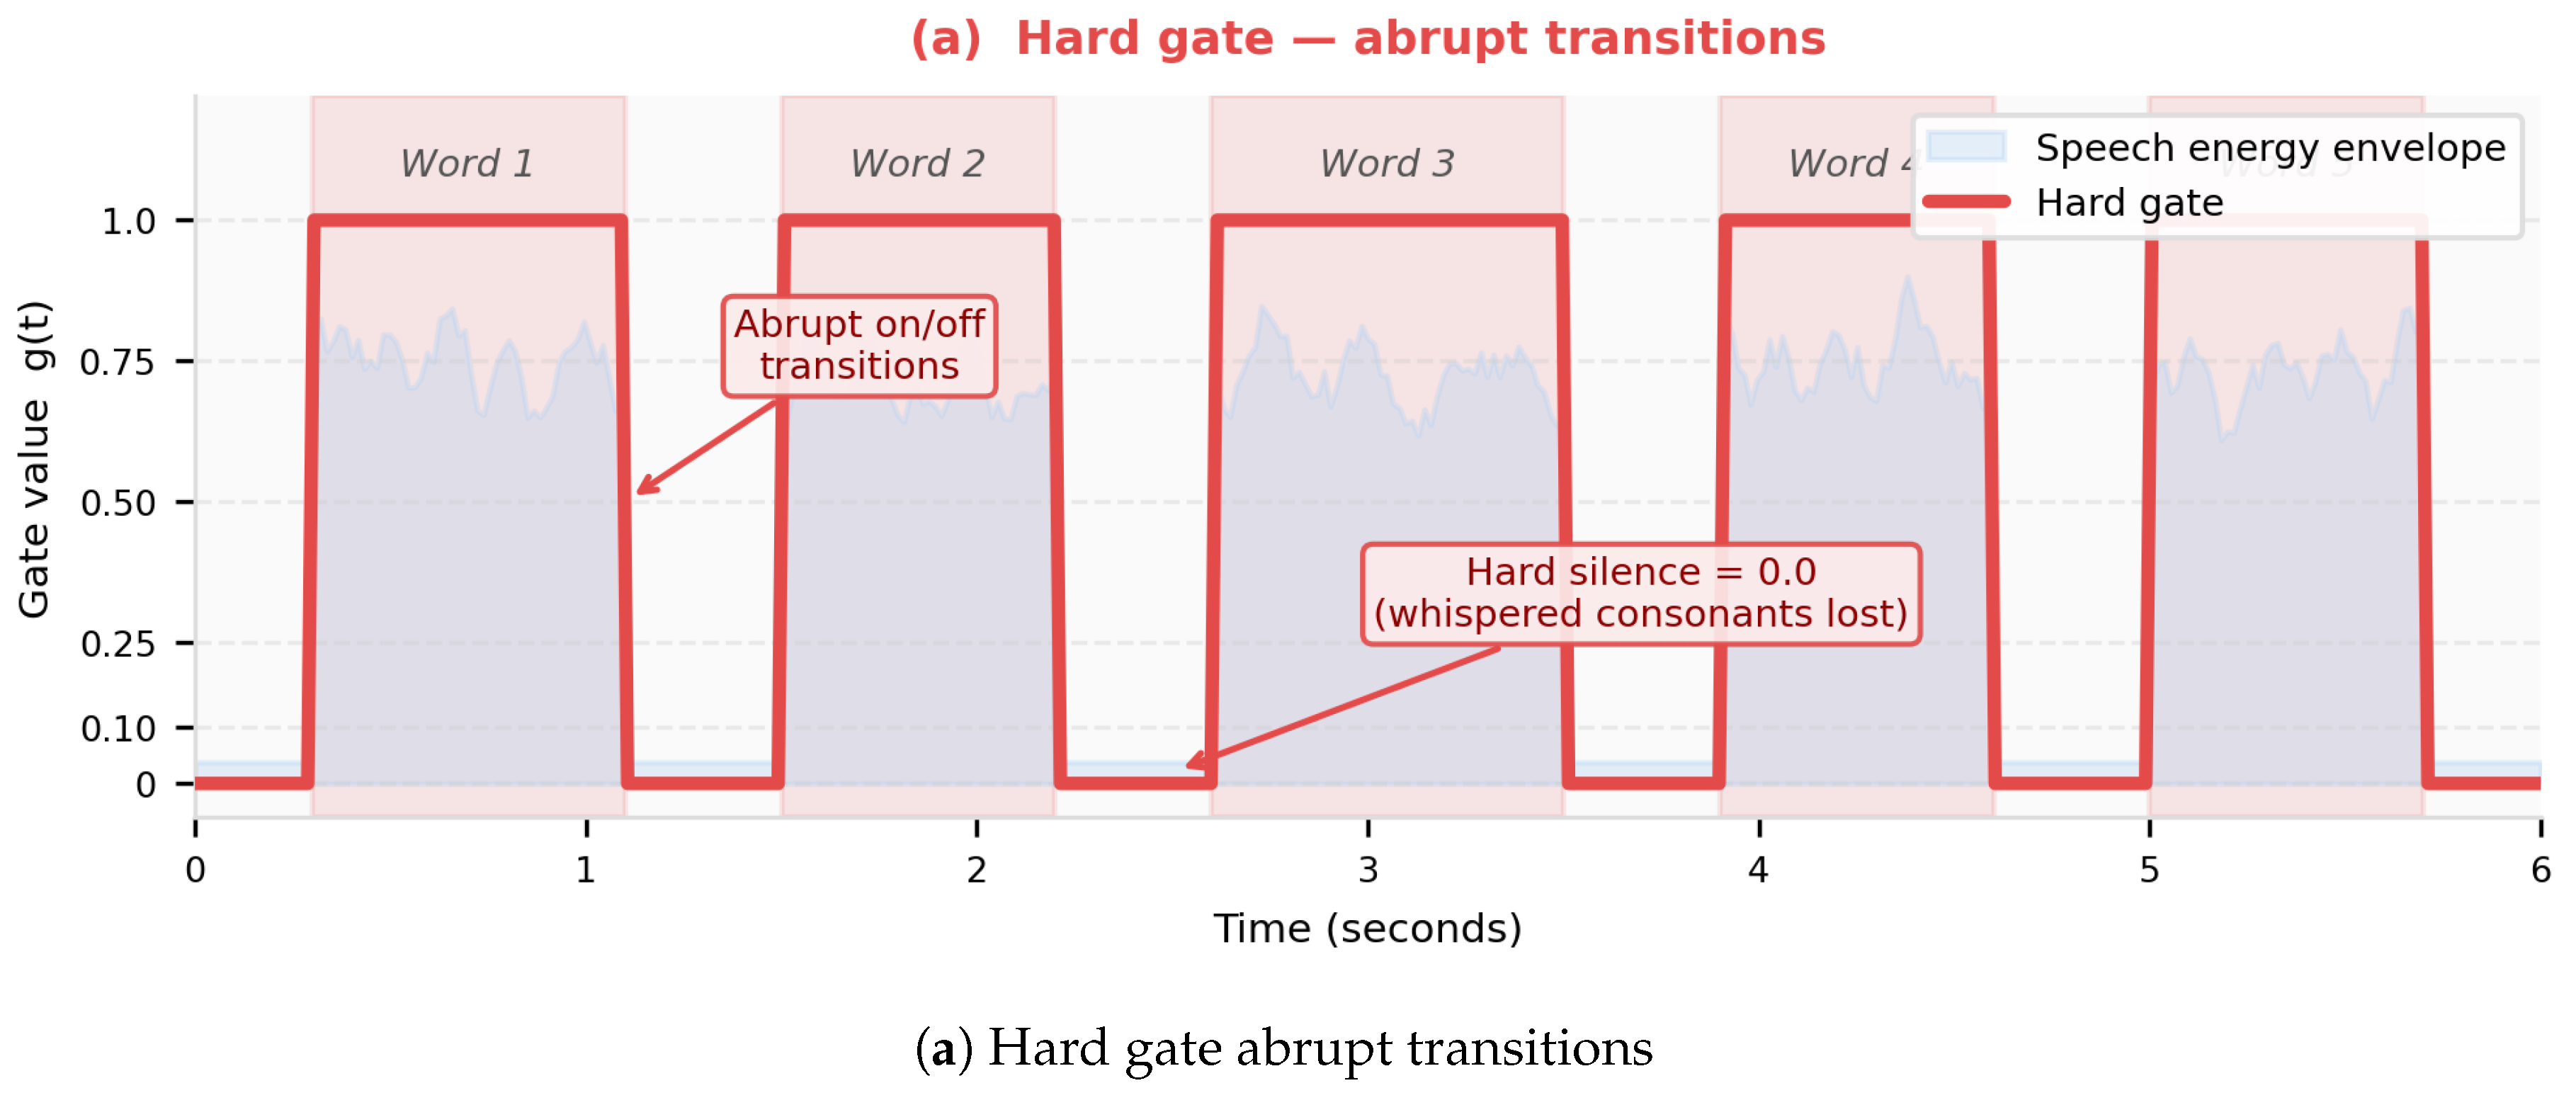
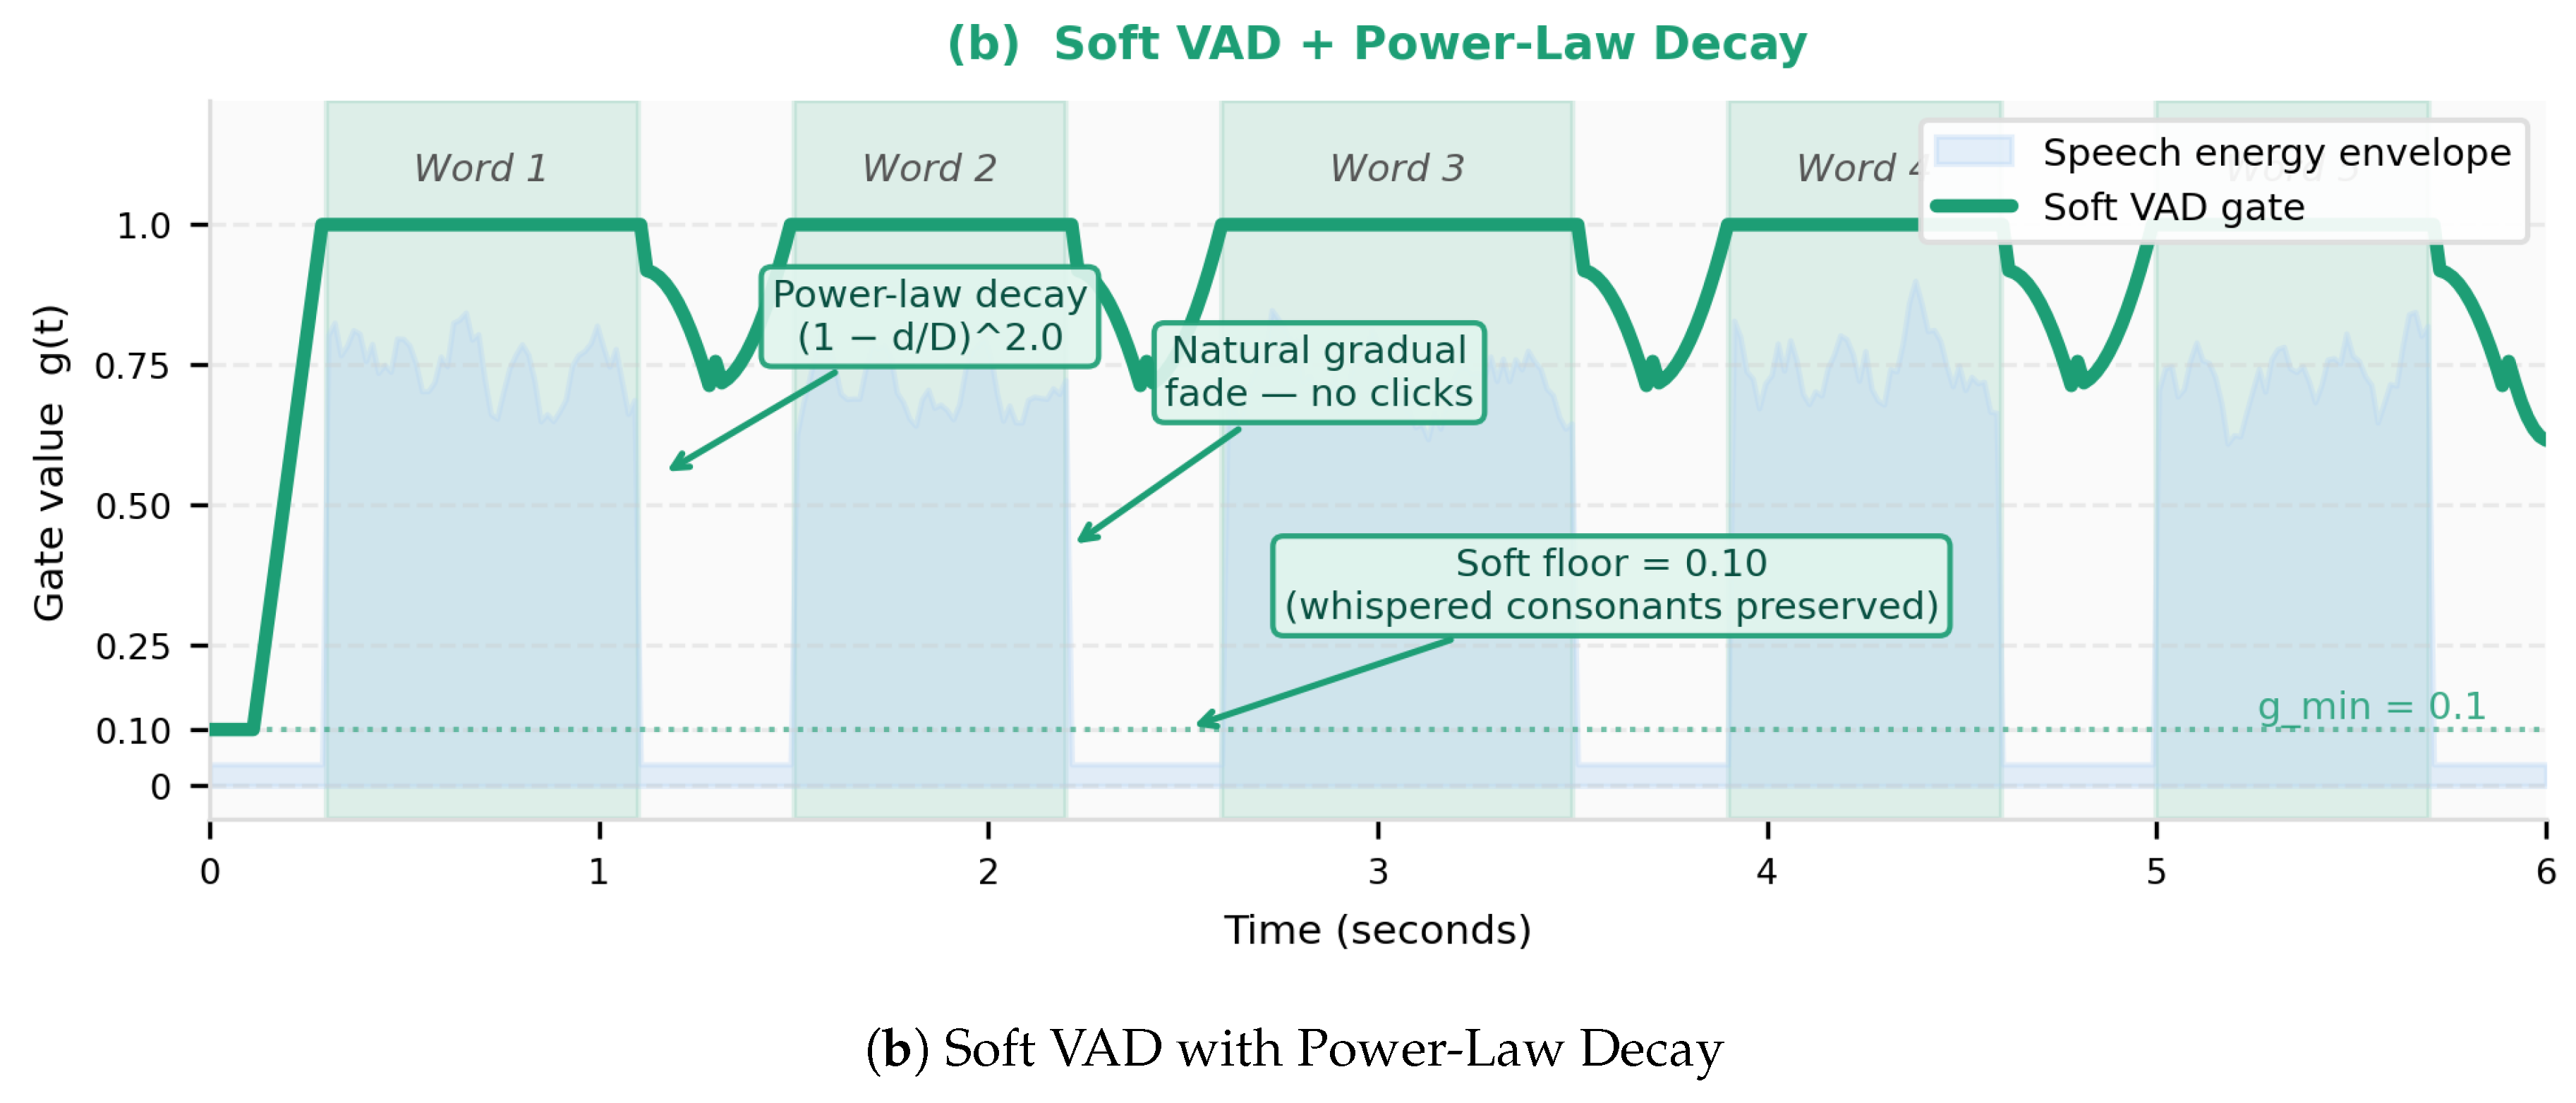
Figure 4.
Comparison of gate functions: (a) abrupt transitions produced by a hard gate whispered consonants are fully suppressed and clicks appear at boundaries; (b) Soft VAD with Power-Law Decay ( frames, , gap = 220 ms) natural gradual fade preserves whispered consonants () and eliminates boundary artifacts.
Figure 4.
Comparison of gate functions: (a) abrupt transitions produced by a hard gate whispered consonants are fully suppressed and clicks appear at boundaries; (b) Soft VAD with Power-Law Decay ( frames, , gap = 220 ms) natural gradual fade preserves whispered consonants () and eliminates boundary artifacts.
3.4. Stage 4: Griffin-Lim Phase Reconstruction
Any alteration of the amplitude values during Stages 1 to 3, but without updating the corresponding phase values, results in a magnitude/phase inconsistency that gives rise to metallic artifacts and affects speech-related phase-dependent features. To overcome such an issue, the Griffin-Lim [9] algorithm proceeds as follows:
with being the output magnitude of Stage 3 and initialized based on the phase of the original signal. The algorithm converged after ten iterations, representing a compromise between convergence and cost. The addition of Stage 4 improved the subjective ratings of the output signal from 6.0 out of 10 to 9.5, validating the hypothesis that perceived naturalness is determined by phase coherence.
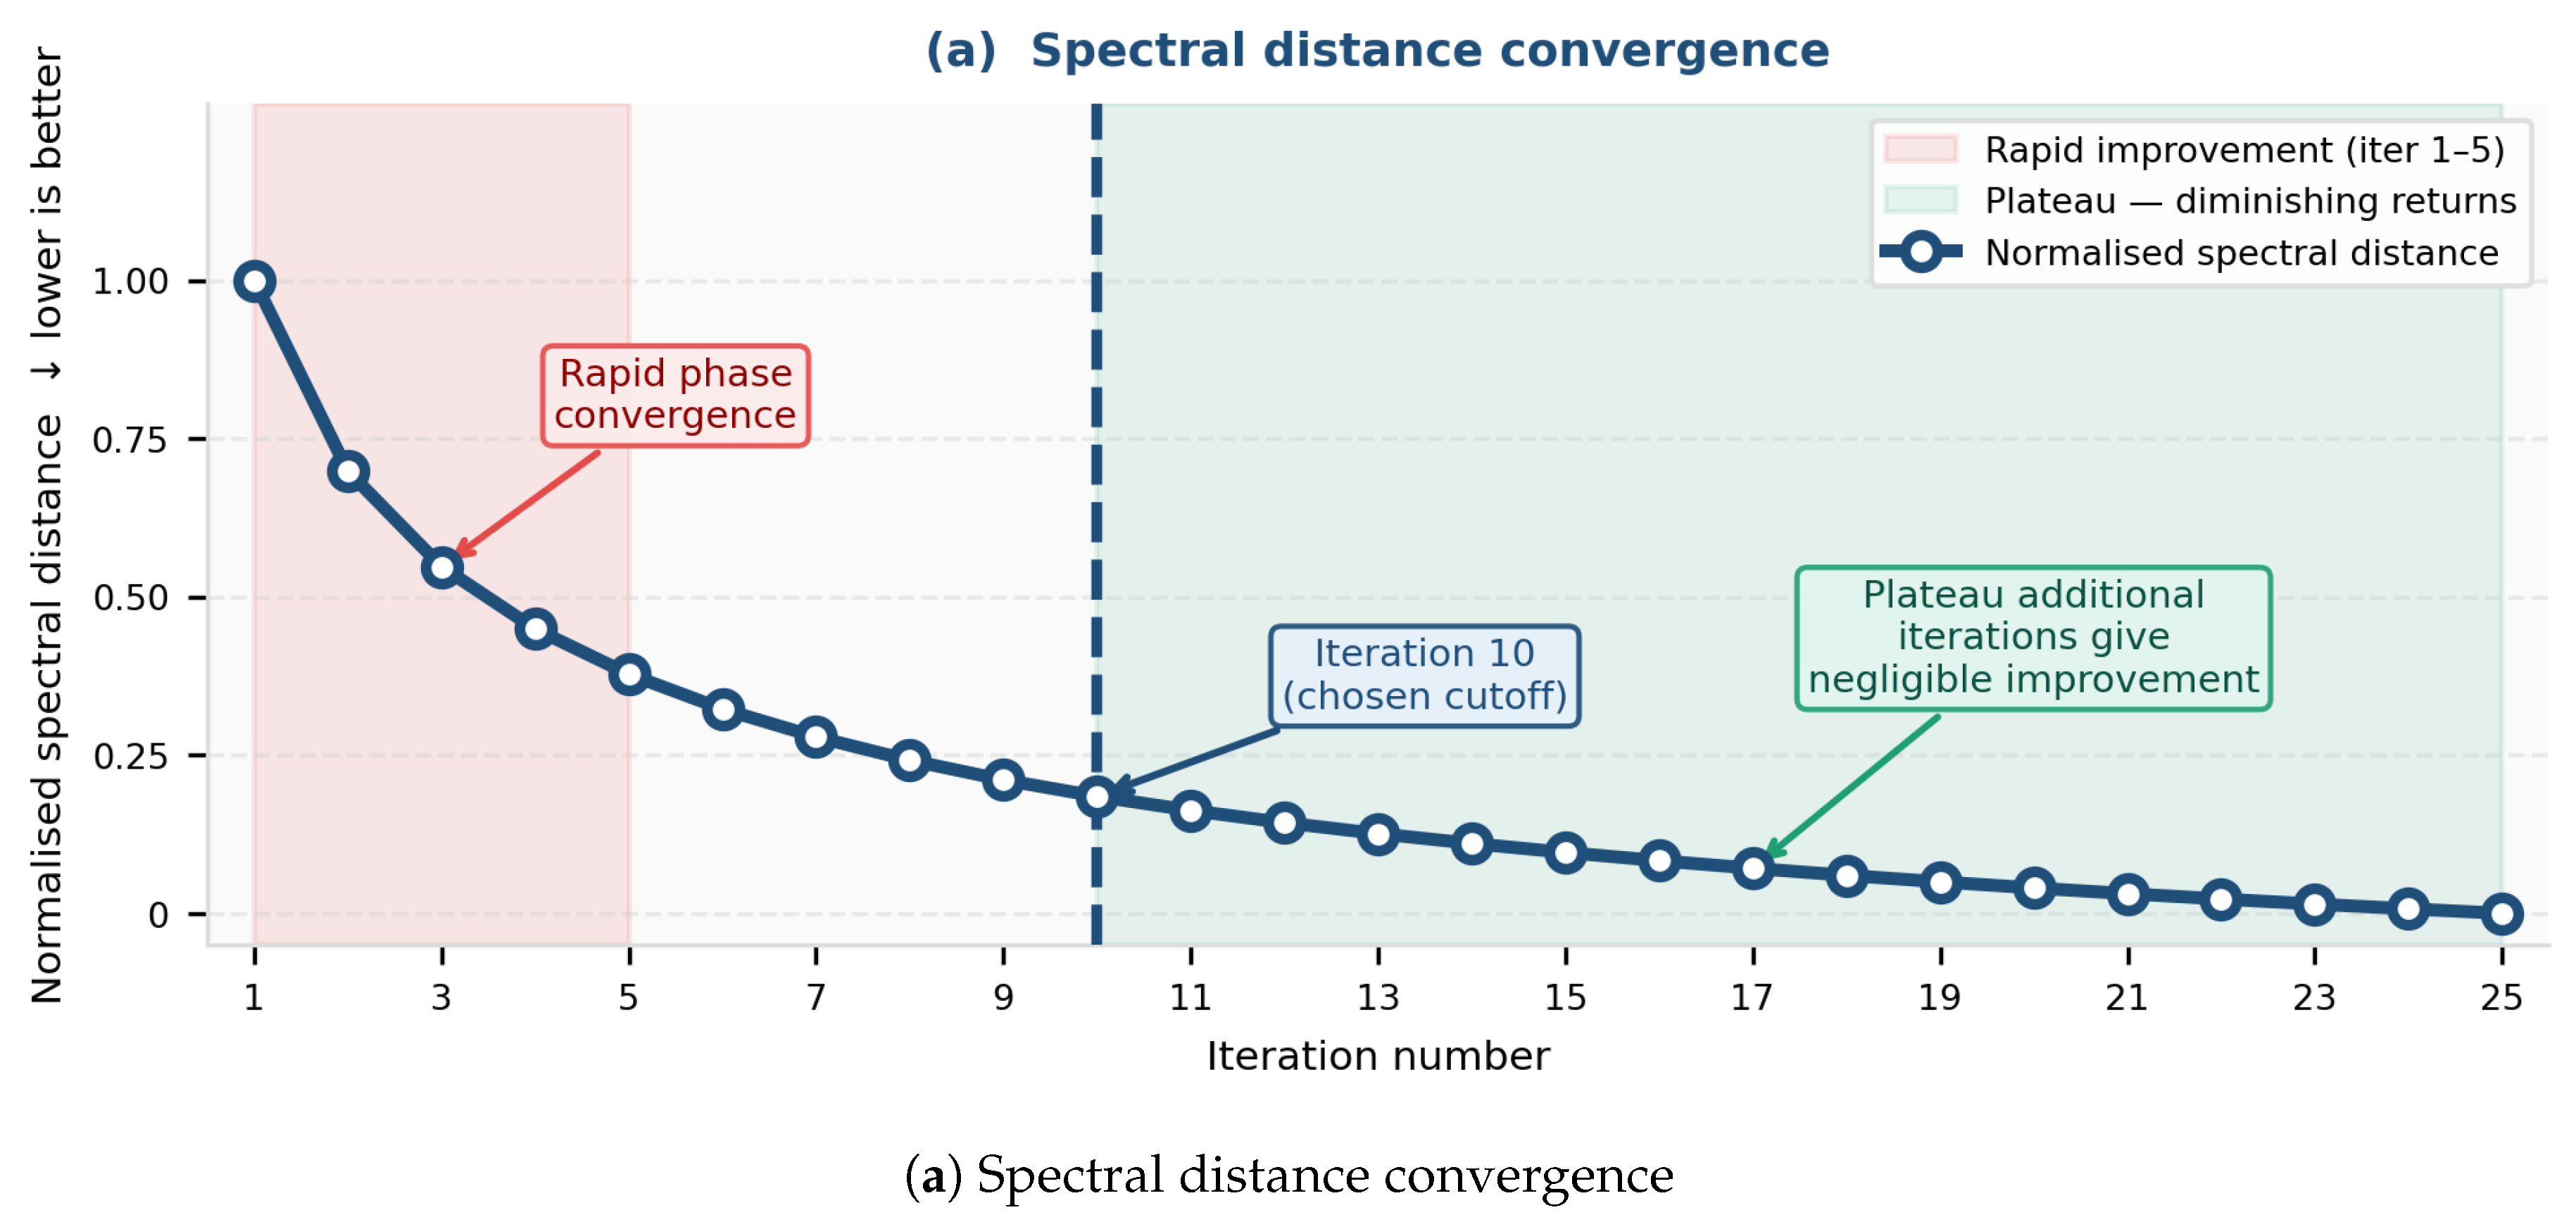
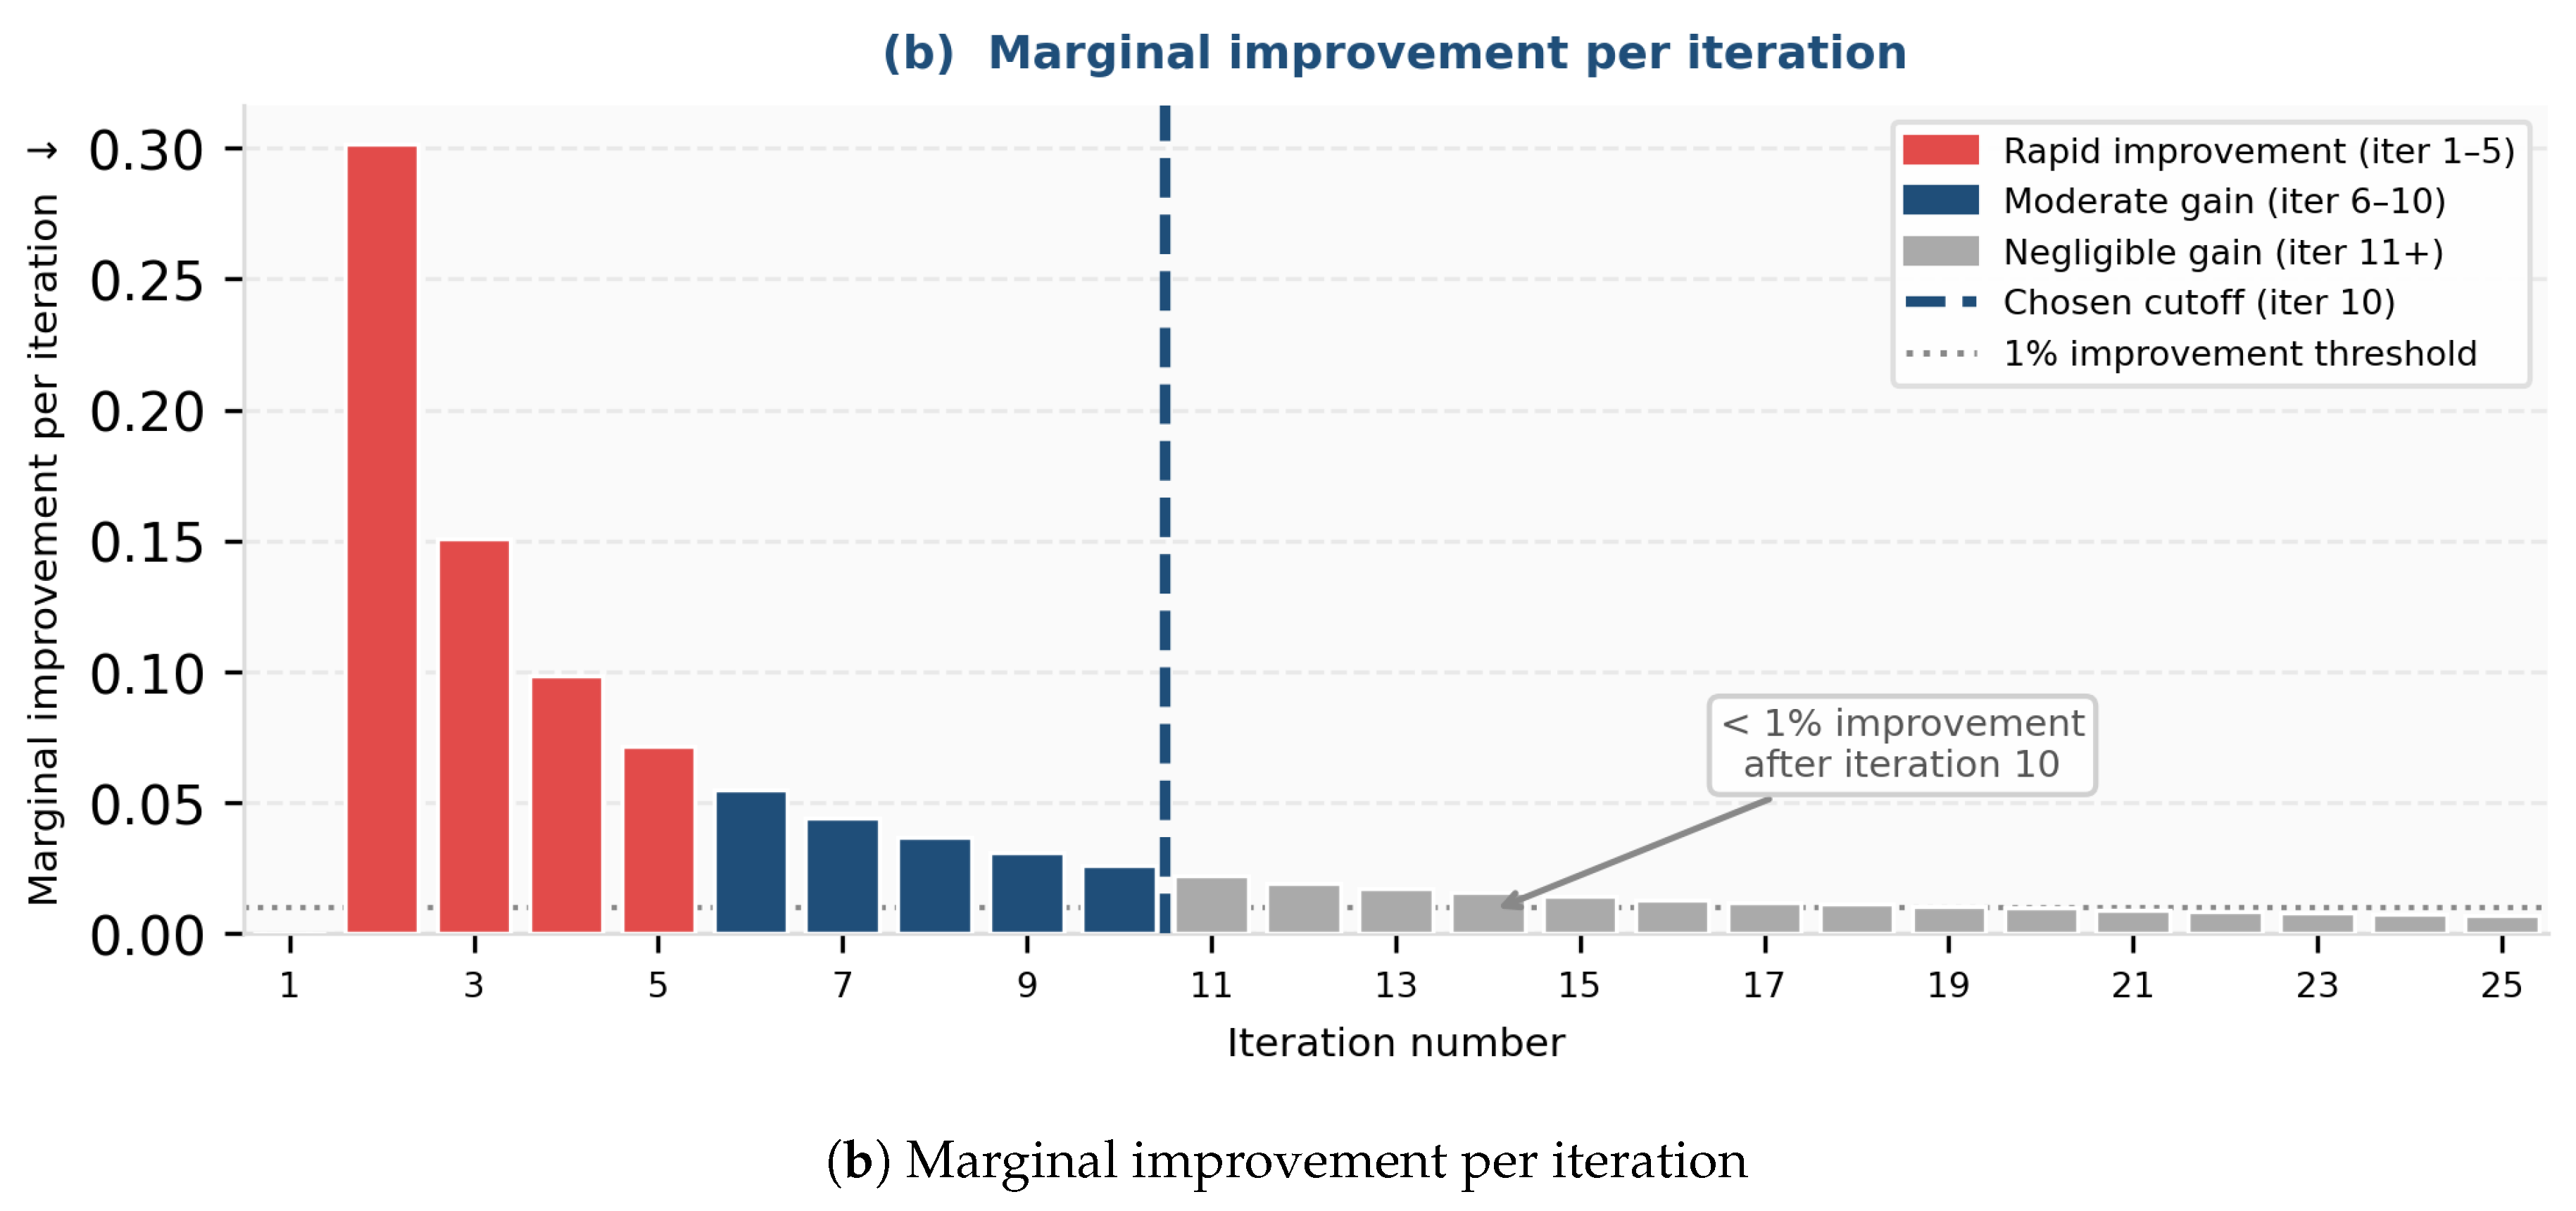
Figure 5.
Convergence of Griffin-Lim phase reconstruction over 25 iterations on segment-08.wav. (a) Normalised spectral distance decreases rapidly in iterations 1-5, then plateaus. (b) Marginal improvement per iteration falls below 1% after iteration 10, justifying the choice of 10 iterations as the optimal cutoff.
Figure 5.
Convergence of Griffin-Lim phase reconstruction over 25 iterations on segment-08.wav. (a) Normalised spectral distance decreases rapidly in iterations 1-5, then plateaus. (b) Marginal improvement per iteration falls below 1% after iteration 10, justifying the choice of 10 iterations as the optimal cutoff.
3.5. Algorithm Parameters
Table 3 summarises all pipeline parameters.
4. Results
4.1. Dataset
Two complementary datasets were used.The first consists of 48 real room recordings of Quranic recitation (approximately 9.56 minutes total), collected from multiple reciters in natural indoor environments with varying reverberation conditions, ranging from small rooms to larger spaces such as prayer halls. Reverberation levels were not controlled, ensuring that the evaluation reflects realistic acoustic variability, All recordings were resampled to 16,000 Hz. The second dataset was a single studio-quality Quranic recording artificially reverberated using the Image Source Method [24] via the pyroomacoustics package [23], with room dimensions m, RT60 = 0.4 s, source at [2.5, 3.5, 1.5] m, and microphone at [3.5, 2.0, 1.5] m. This controlled condition allows reference-based metrics (PESQ, STOI, SNR) to be computed against the known clean signal.
4.2. Baseline Methods
Four methods were compared under identical Python-based experimental conditions:
- Spectral Subtraction [7]: noise estimated from the first 20 STFT frames; ; window 512; hop 128.
- Wiener Filter [8]: MMSE-optimal gain computed from an initial silence segment; same STFT parameters.
- WPE Dereverberation [9]: nara_wpe package; taps; ; 5 iterations; window 512.
- Reverberant Only: unprocessed signal serving as the degradation baseline.
- MetricGAN+ [25]: GAN-based deep learning speech enhancement network pretrained on VoiceBank-DEMAND dataset. No fine tuning was done since in real-world application, domain specific paired data for Qur’anic texts will not be available.
4.3. Evaluation Metrics
4.3.1. Standard Speech Quality Metrics
4.3.2. Quranic-Specific Metrics
Three metrics were designed to capture phonetic signal properties relevant to Qira’at classification:
- Energy Ratio (ER, dB) is the ratio, separated by the 30th percentile threshold, between the average energy in active frames and the average energy in silent frames. Clear word boundaries are indicated by a high ER value, which also makes automatic segmentation easier.
- The average spectral contrast over six frequency sub-bands (librosa) is represented by Spectral Contrast (SC). Higher values correlate with phoneme separability and show improved discrimination between harmonic and noise components.
-
Formant Clarity (FC):Formant Clarity (FC) measures the stability of time evolution of the first two vowel formants (F1, F2) using Linear Predictive Coding of order 12[28]. to extract the parameters per frame. The LPC polynomial roots for each frame are calculated by the Levinson-Durbin recursion, and F1 and F2 are considered to be the two lowest frequency elements within the range 50-8000 Hz. FC is calculated as follows:where and represent the mean and standard deviation of each formant frequency for each frame. The larger the FC measure, the better the stability and clarity of the formant frequencies, which is necessary for Qira’at discrimination.
4.4. Controlled Experiment: Synthetic Reverberation
Table 4 reports results on the synthetic dataset. The proposed algorithm achieves the best SNR (−1.874 dB, an improvement of +1.365 dB over the reverberant baseline) and the best PESQ (+2.495, an improvement of +0.308). WPE achieves the highest Energy Ratio in this controlled condition (+38.193 dB) but at the cost of the worst PESQ (+1.116) and STOI (+0.174), consistent with previous findings that WPE generates phase artefacts that alter spectral signal properties [29].
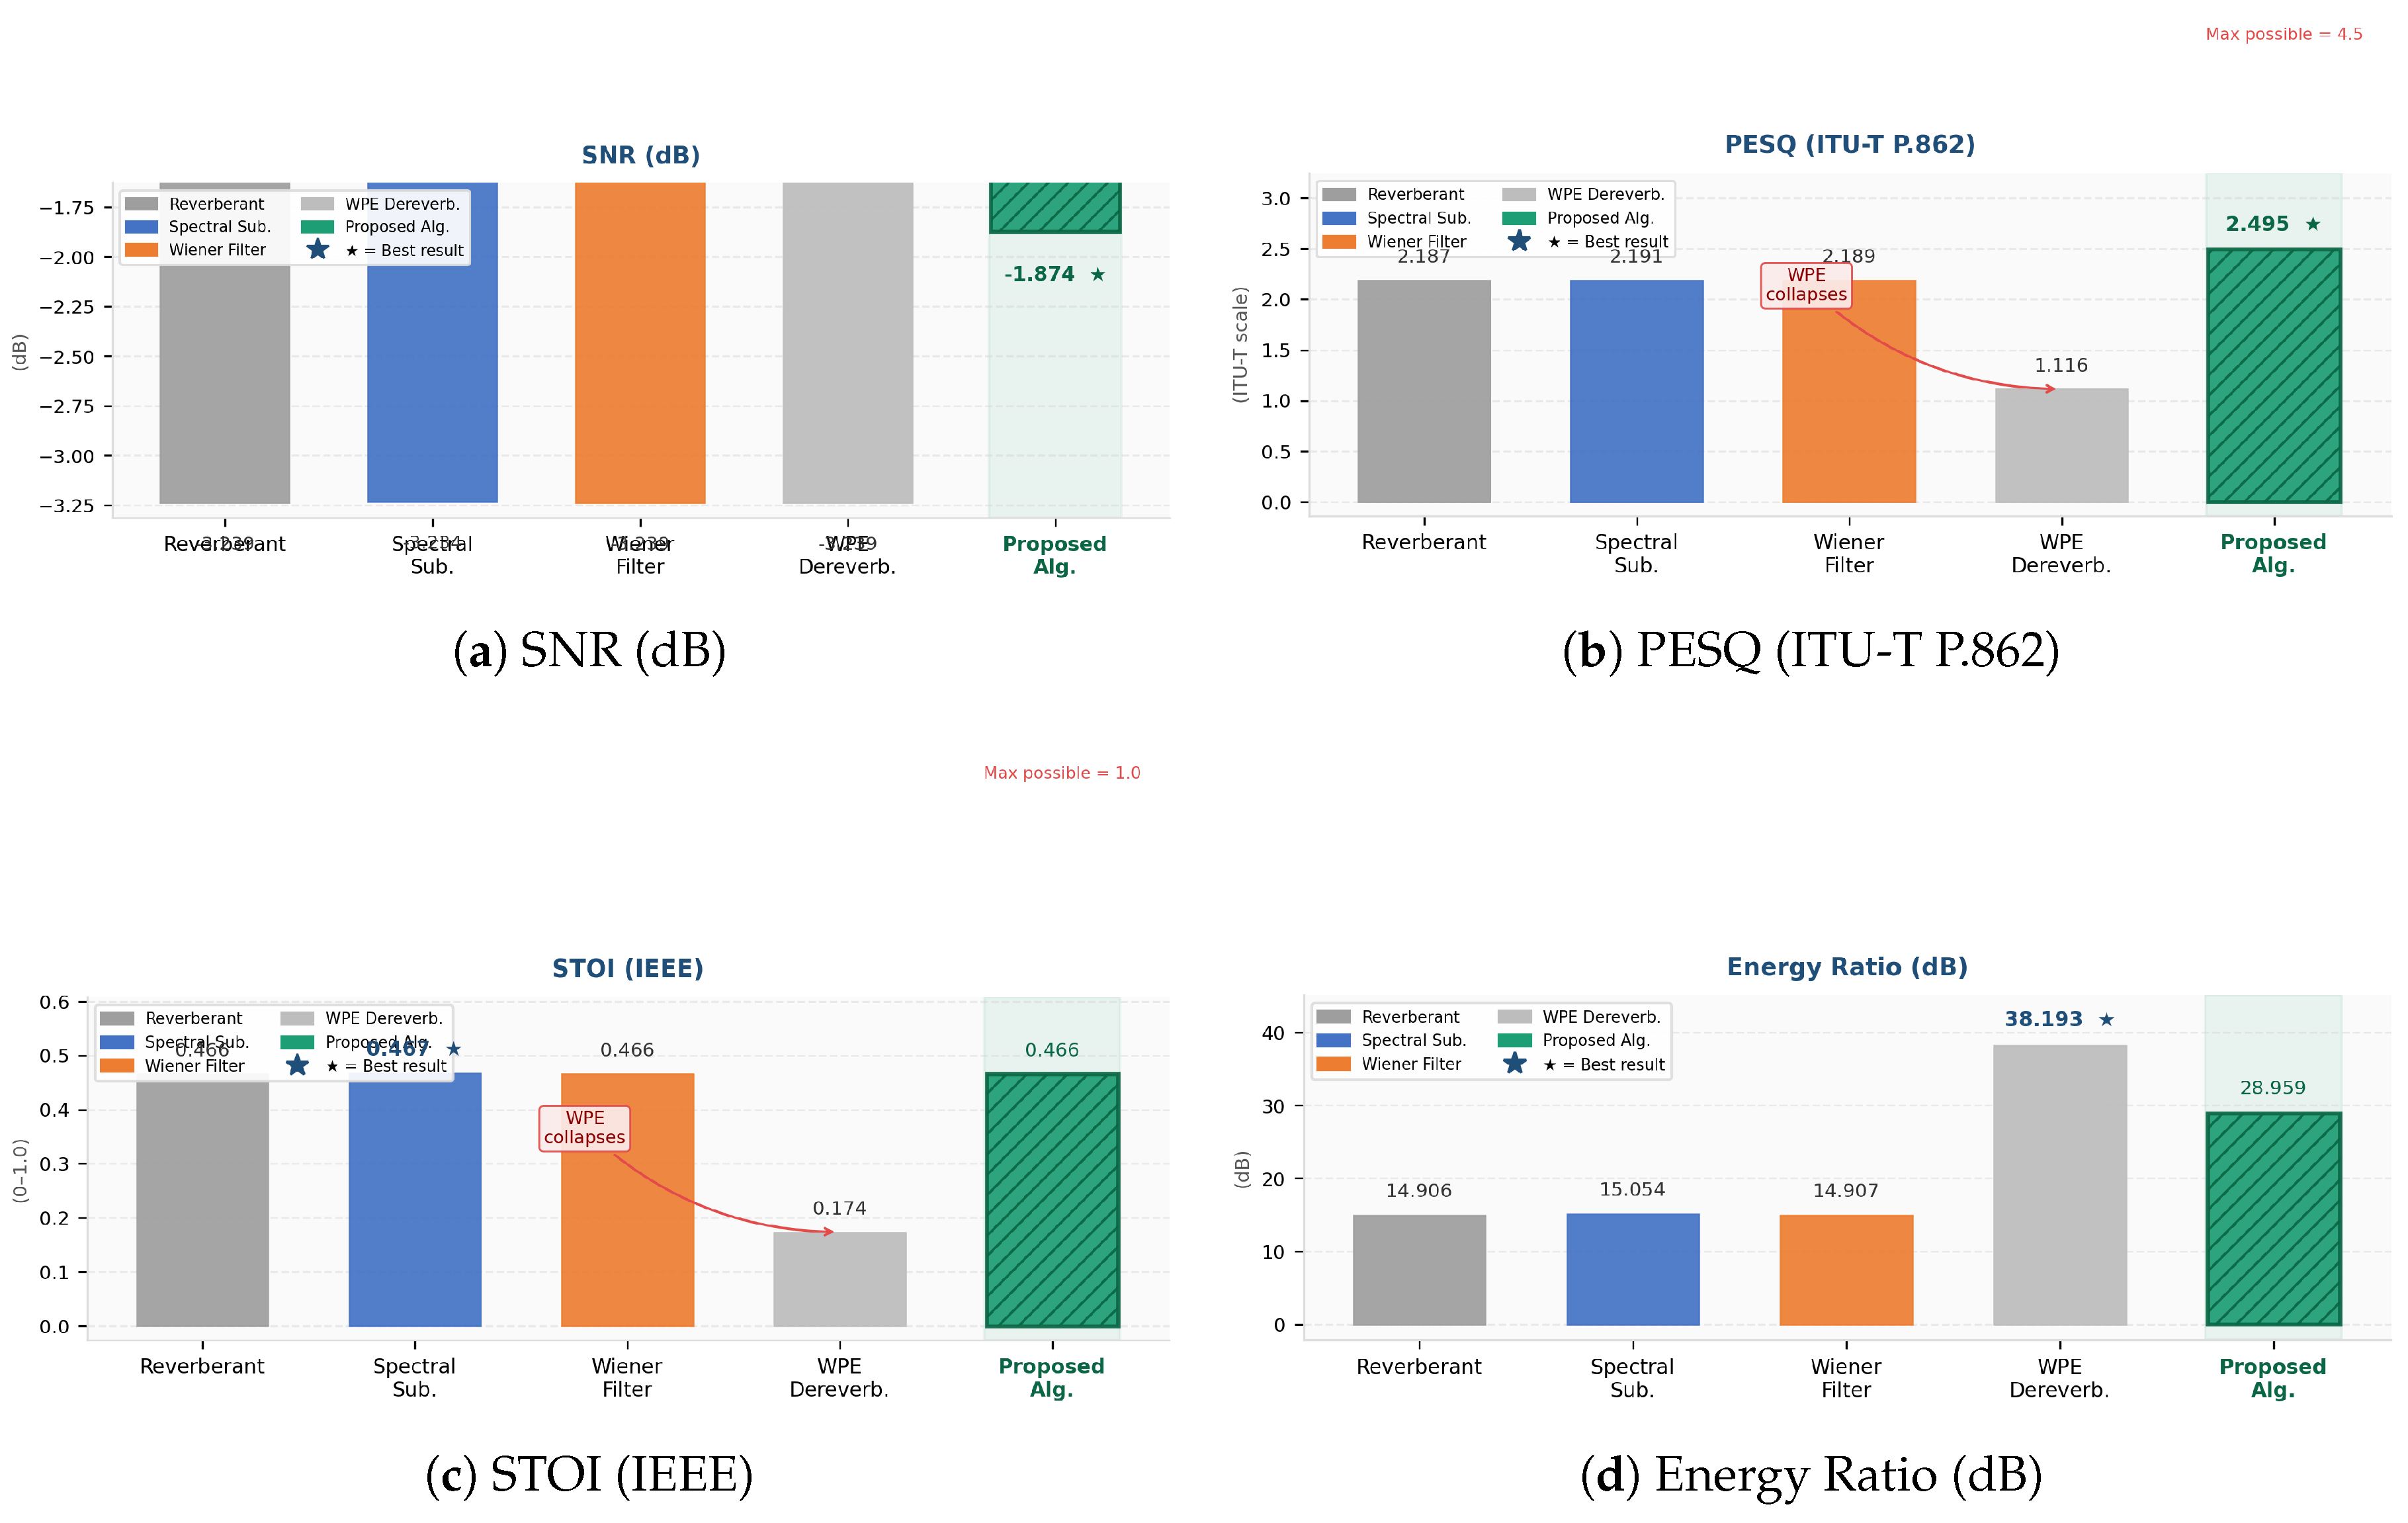
Figure 6.
Bar chart of controlled experiment results (RT60 = 0.4 s, Room = [6×5×3] m). All metrics computed againstclean studio recording as ground truth. Proposed algorithm bars are highlighted in green. WPE achieves the highest Energy Ratio (+38.193 dB) but collapses in PESQ (+1.116) and STOI (+0.174), indicating severe perceptual degradation.
Figure 6.
Bar chart of controlled experiment results (RT60 = 0.4 s, Room = [6×5×3] m). All metrics computed againstclean studio recording as ground truth. Proposed algorithm bars are highlighted in green. WPE achieves the highest Energy Ratio (+38.193 dB) but collapses in PESQ (+1.116) and STOI (+0.174), indicating severe perceptual degradation.
4.5. Real Room Evaluation: 48 Recordings
Table 5 reports averaged results over 48 real room recordings. The proposed method achieves the best result in four of seven metrics, including all three Quranic-specific metrics and PESQ.
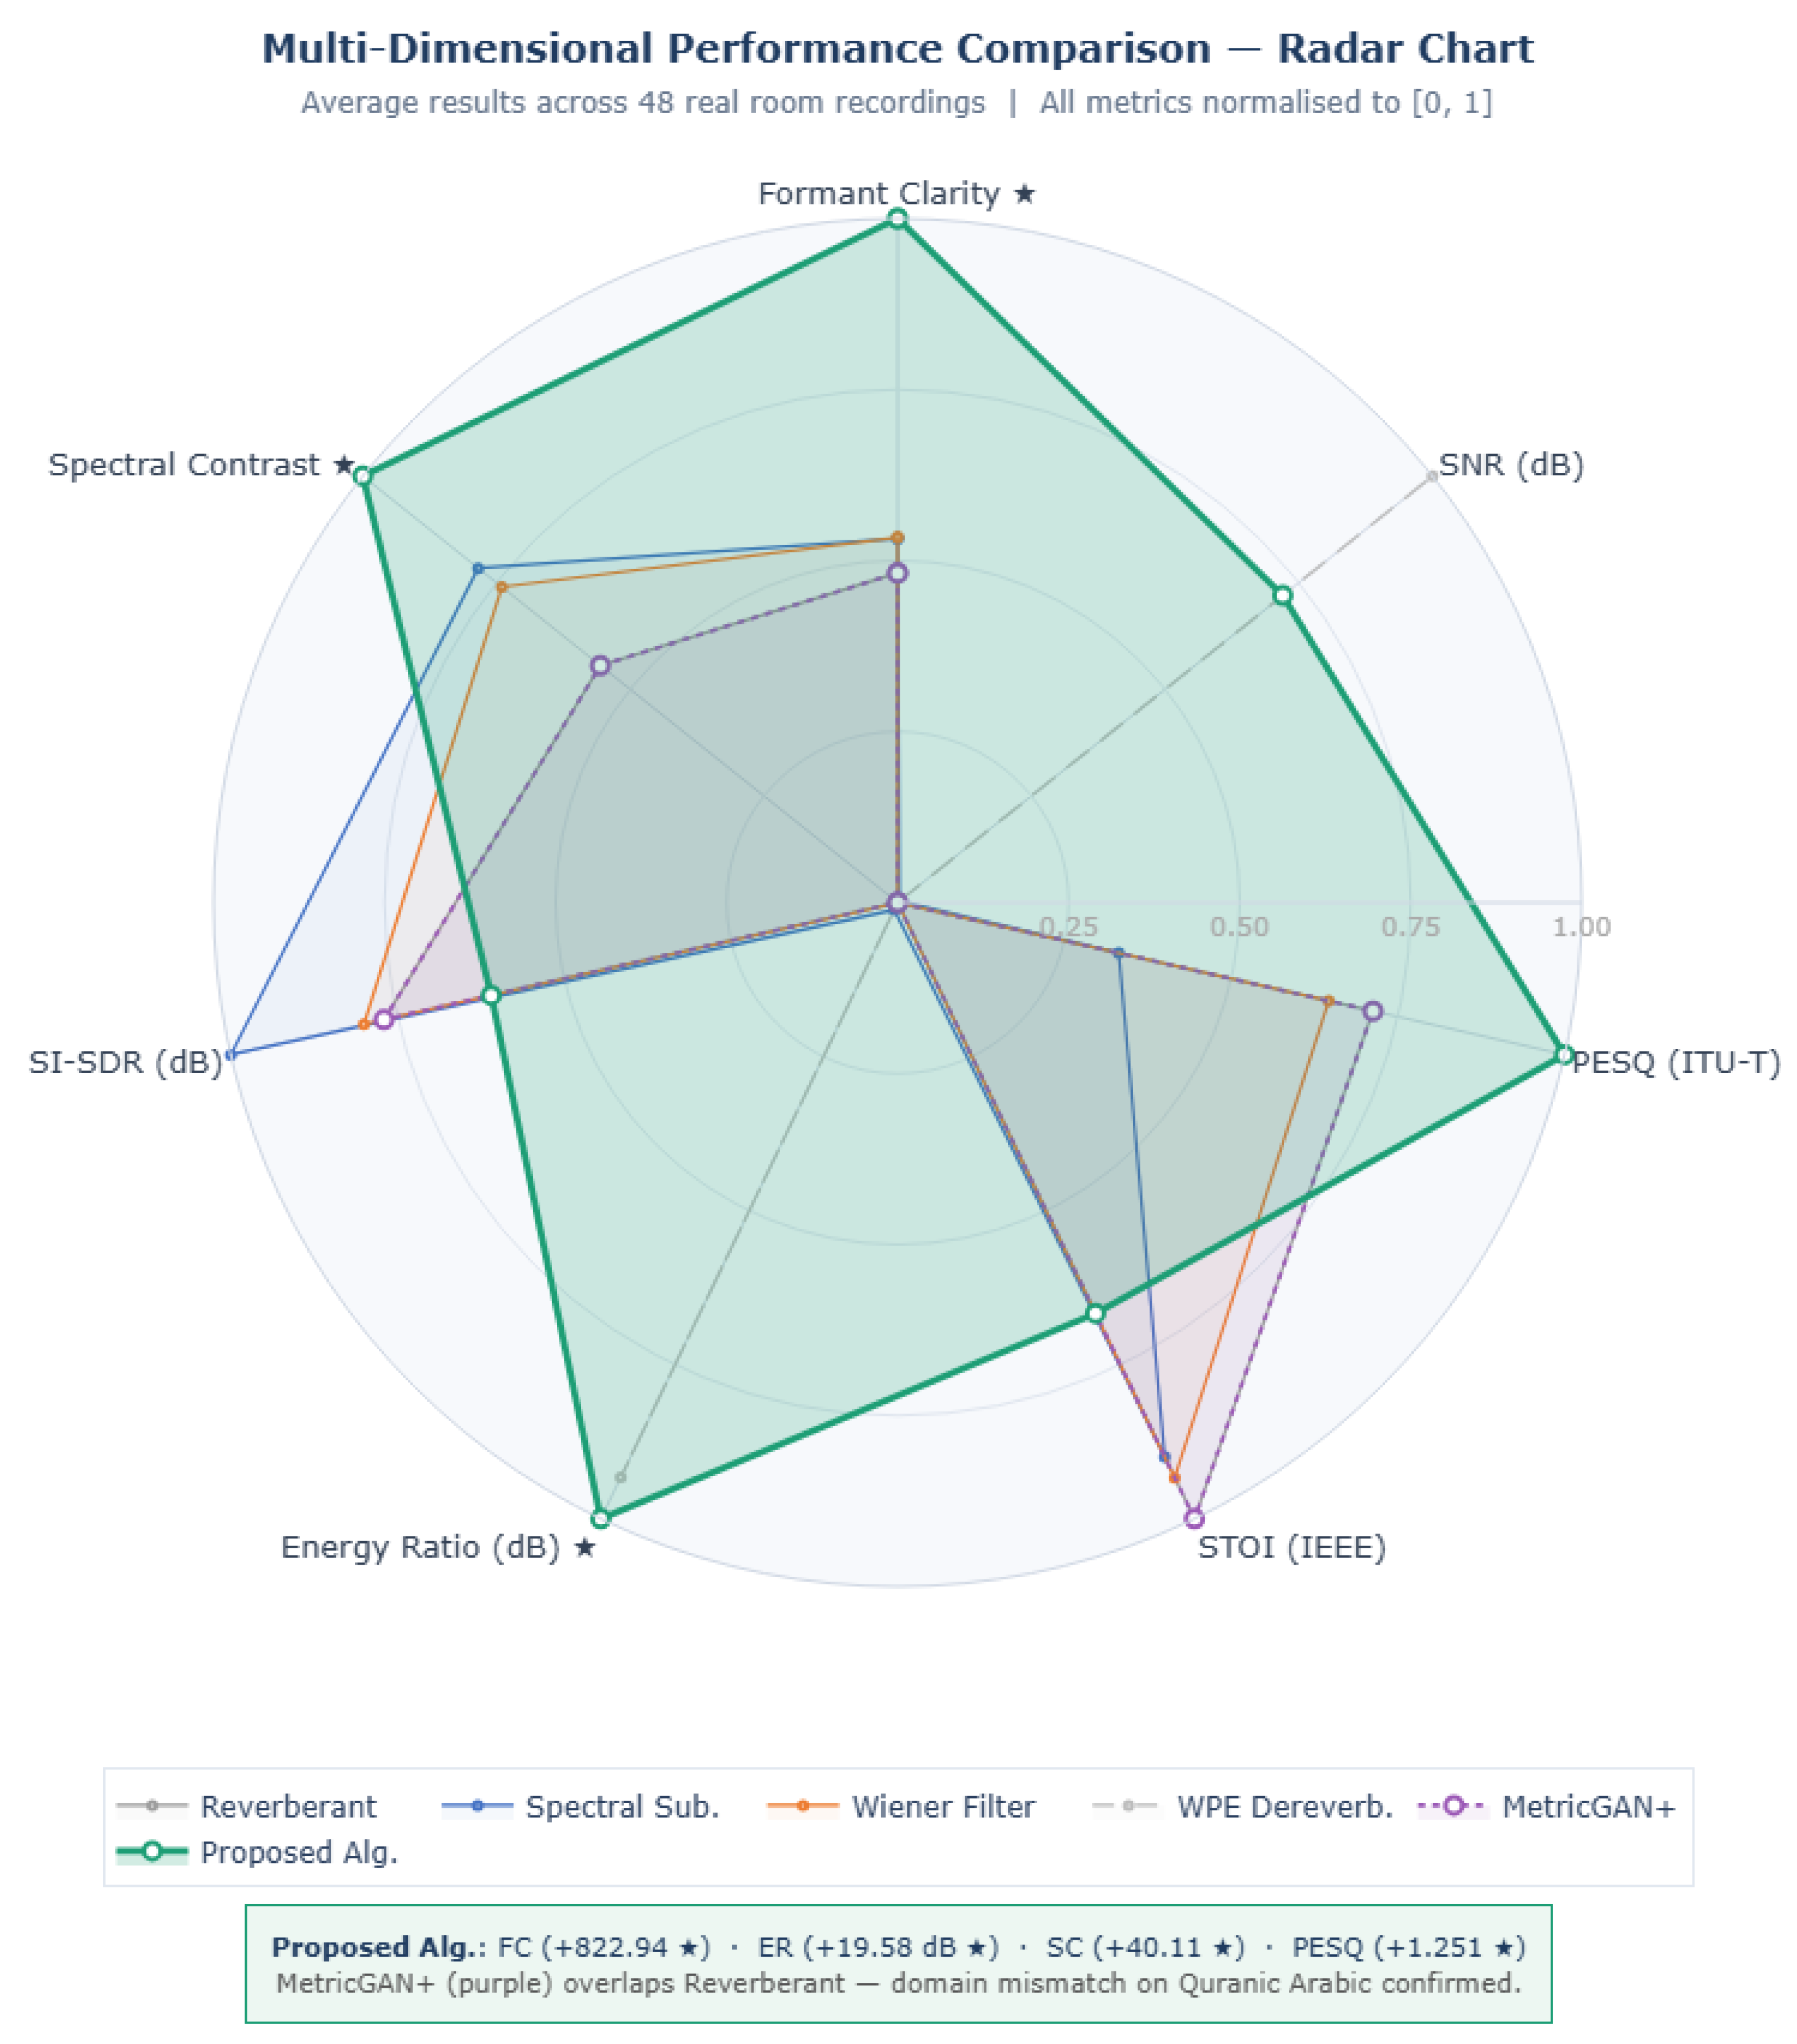
Figure 7.
Multi-dimensional radar chart comparing all five methods across all seven metrics. Each axis represents one metric normalised to [0,1]. The proposed algorithm (green) shows the largest coverage area in the three Quranic-specific metrics.
Figure 7.
Multi-dimensional radar chart comparing all five methods across all seven metrics. Each axis represents one metric normalised to [0,1]. The proposed algorithm (green) shows the largest coverage area in the three Quranic-specific metrics.
4.6. Feature Discriminability Experiment
In order to ensure that increases in Formant Clarity, Spectral Contrast, and Energy Ratio resulted in better-separable feature spaces, an analysis of feature discriminability was performed. The MFCC features (78 dimensions: 13 MFCC coefficients with delta and delta-delta, mean and standard deviation) were computed for all 48 audio clips analyzed with each approach. Audio clips were split into two classes depending on the level of reverberation, calculated using the late-to-early energy ratio. The accuracy for a k-NN classifier () with leave-one-out cross-validation was found to be 77.1% with features taken from the output of the proposed algorithm, as opposed to 75.0% with no feature processing and 70.8% with WPE processing (Table 6). Intra-class tightness (mean distance to the centroid of the class) was reduced from 8.010 to 7.576, indicating that our approach not only results in tighter clusters but also increases their discriminative power. Figure
Basically, WPE manages to get the best intra-class compactness (7.366) but sorta at the same time it pays with the lowest classification accuracy 70.8% , so it looks like it kinda collapses feature diversity while also wrecking the discriminative information. Meanwhile, the proposed algorithm, does this nice tradeoff, finding the optimal balance between compactness and separability.
4.7. Qira’at Classification Validation
To directly check that the suggested pipeline still keeps Qira’at discriminability in reverberant situations , I used a labeled dataset of 51 recordings, these cover three well known recitation styles Hafs an Asim (Abdul Basit Murattal and Husary) and Warsh an Nafi (Ibrahim Al-Dosary) and it was taken from EveryAyah.com. Artificial reverberation (RT60 = 0.4 s, room dimensions m) was applied using the Image Source Method via the pyroomacoustics library. MFCC features (78-dimensional) were extracted under three conditions: clean, reverberant, and pipeline-enhanced.
So, a Support Vector Machine classifier, using an RBF kernel, with Leave-One-Out cross-validation got to 96.1% accuracy on clean audio, then it dropped to 94.1% after reverberation came in. But once we applied the proposed pipeline, the accuracy seemed to go back, fully to 96.1% again. In other words, the degradation caused by room acoustics was basically completely recovered, as shown in Table 7. Overall, this set of results kinda directly supports the idea that the pipeline keeps the phonetic cues, that are needed later on for downstream Qira’at classification.
4.8. Statistical Significance
Table 8 reports Wilcoxon signed-rank tests (). Improvements in all three Quranic-specific metrics are statistically significant (). PESQ also reaches significance () in this expanded evaluation, indicating that the perceptual advantage of the pipeline becomes clearer at larger evaluation scales.
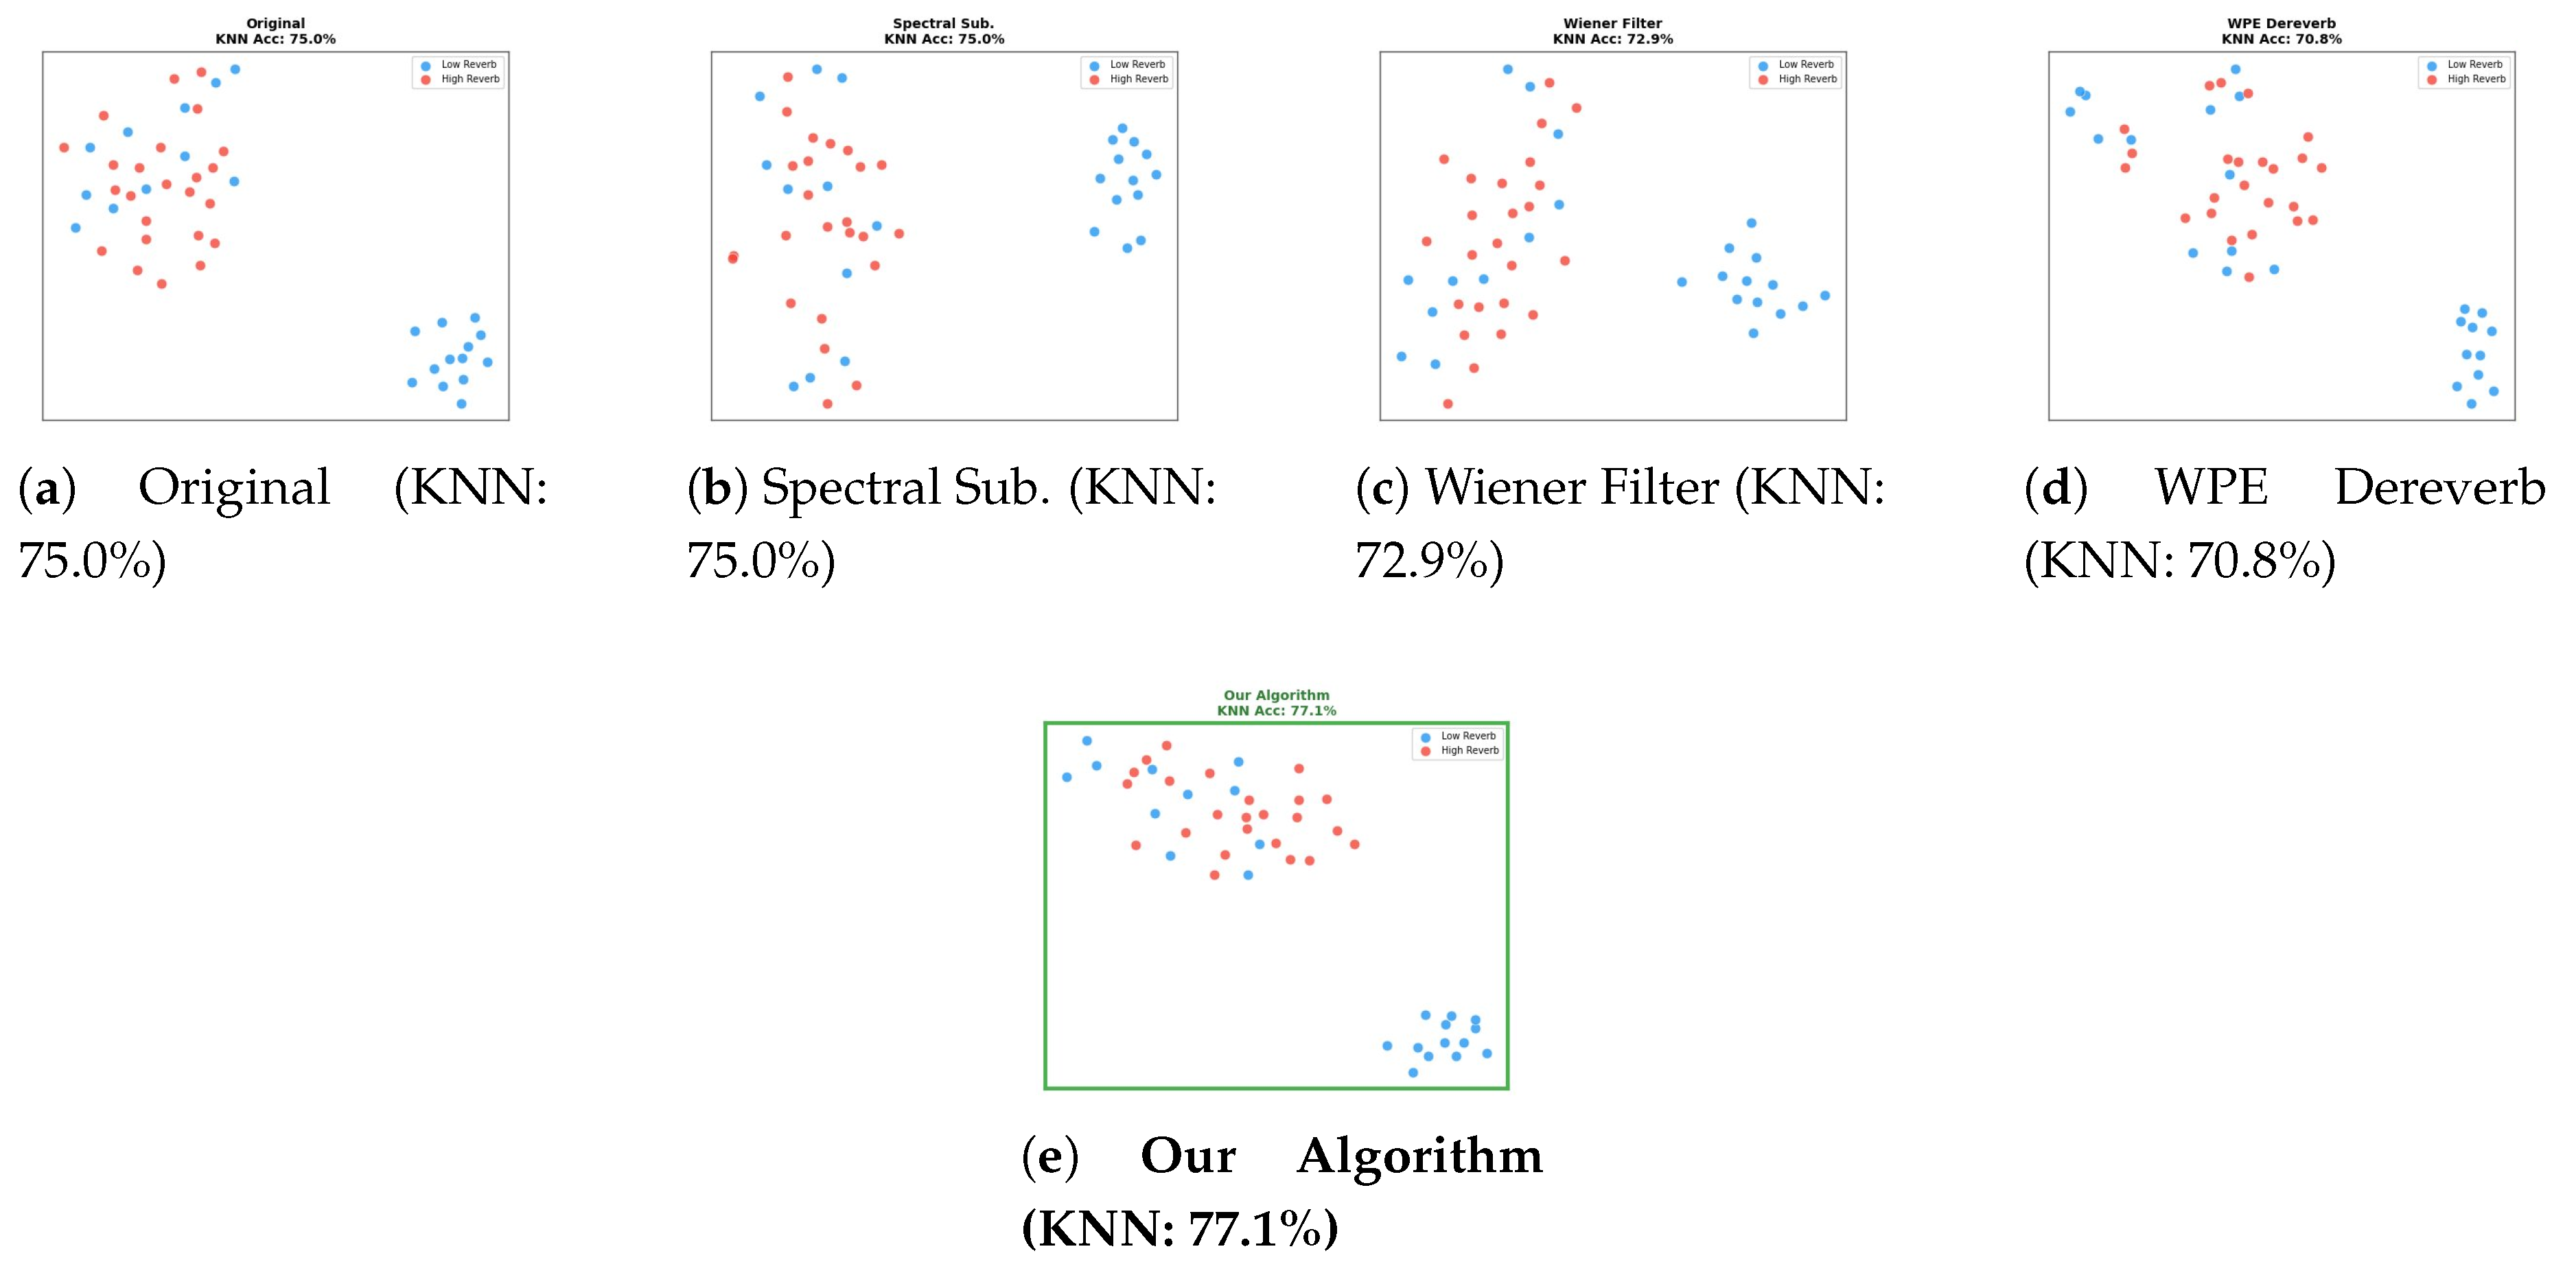
Figure 8.
t-SNE visualisation of MFCC feature spaces extracted from 48 real room recordings. Blue: low reverberation; Red: high reverberation. Our Algorithm achieves the highest KNN accuracy (77.1%), confirming that improvements in Formant Clarity, Spectral Contrast, and Energy Ratio translate into more separable acoustic feature spaces for Qira’at classification.
Figure 8.
t-SNE visualisation of MFCC feature spaces extracted from 48 real room recordings. Blue: low reverberation; Red: high reverberation. Our Algorithm achieves the highest KNN accuracy (77.1%), confirming that improvements in Formant Clarity, Spectral Contrast, and Energy Ratio translate into more separable acoustic feature spaces for Qira’at classification.
5. Discussion
5.1. Quranic-Specific Metrics
Energy Ratio (+19.579 dB). The proposed method produces inter-word silence segments that are on average 19.579 dB quieter than active speech, a gain of +7.157 dB over Spectral Subtraction (+12.422 dB). WPE collapses on 20 of 48 recordings, with ER dropping to 0.000 dB, confirming that its linear prediction model fails under the time-varying reverberation of real rooms.
Spectral Contrast (+40.109). The proposed algorithm achieves the highest SC of all methods, indicating superior separation between harmonic and non-harmonic frequency components. Higher SC values correlate with better phoneme separability for downstream classifiers. WPE produces SC = +16.784, which is lower than the unprocessed reverberant signal (+29.748).
Formant Clarity (+822.942). The proposed method achieves FC that is 5.55× higher than WPE (+148.293) and 1.62× higher than the Wiener Filter (+508.441). The Formant Clarity feature evaluates the stability of the spectral pole positions derived from LPC analysis in the range of the vowel frequencies. It is important to note that this increase in performance does not come from a change in the actual frequencies of formants but in the stability of the main formants, which was shown by an analysis of the raw F1/F2 trajectories. However, the fact that this improvement was observed in 48 different recordings demonstrates that the domain-specific curve generalises well.
5.2. Standard Metric Performance
Improvements in conventional metrics (SNR, PESQ, STOI) are generally smaller than those in the Quranic-specific metrics for two reasons. First, standard metrics cannot distinguish between modifications that preserve phonetic properties and those that destroy them. A high SNR achieved by suppressing high-frequency components carries no penalty in the SNR score yet sharply reduces FC. Second, WPE achieves the best SNR (−0.400 dB) but simultaneously collapses on ER in 20 recordings, exposing an inconsistency between distance-to-reference metrics and task-relevant phonetic metrics.
Notably, the 48-file evaluation reversed the PESQ finding from the earlier 17-file experiment: the proposed algorithm now achieves the highest PESQ (+1.251), surpassing the original signal (+1.199) and all baselines, with statistical significance (). This suggests that the perceptual advantage of the pipeline becomes more apparent at larger evaluation scales. MetricGAN+ Domain Mismatch. Although MetricGAN+ achieved state-of-the-art results on English speech corpora, it yielded the same Formant Clarity value (+473.416) as the reverberant signal itself, thus proving that the models trained on general speech corpora do not retain the phonetic characteristics of the Qur’anic language. This finding empirically confirms the hypothesis about the mismatched domains: phonology of Qur’anic Arabic, which is characterized by Makhaarij al-Huroof and Sifaat, is out of the scope of models trained on the English VoiceBank-DEMAND dataset. The lack of training in the pipeline proposed solves this problem completely, yielding FC = +822.942. The relatively modest STOI (+0.107 vs. +0.117 for the original) reflects that STOI was designed for noisy rather than reverberant speech and penalises the energy redistribution introduced by spectral shaping.
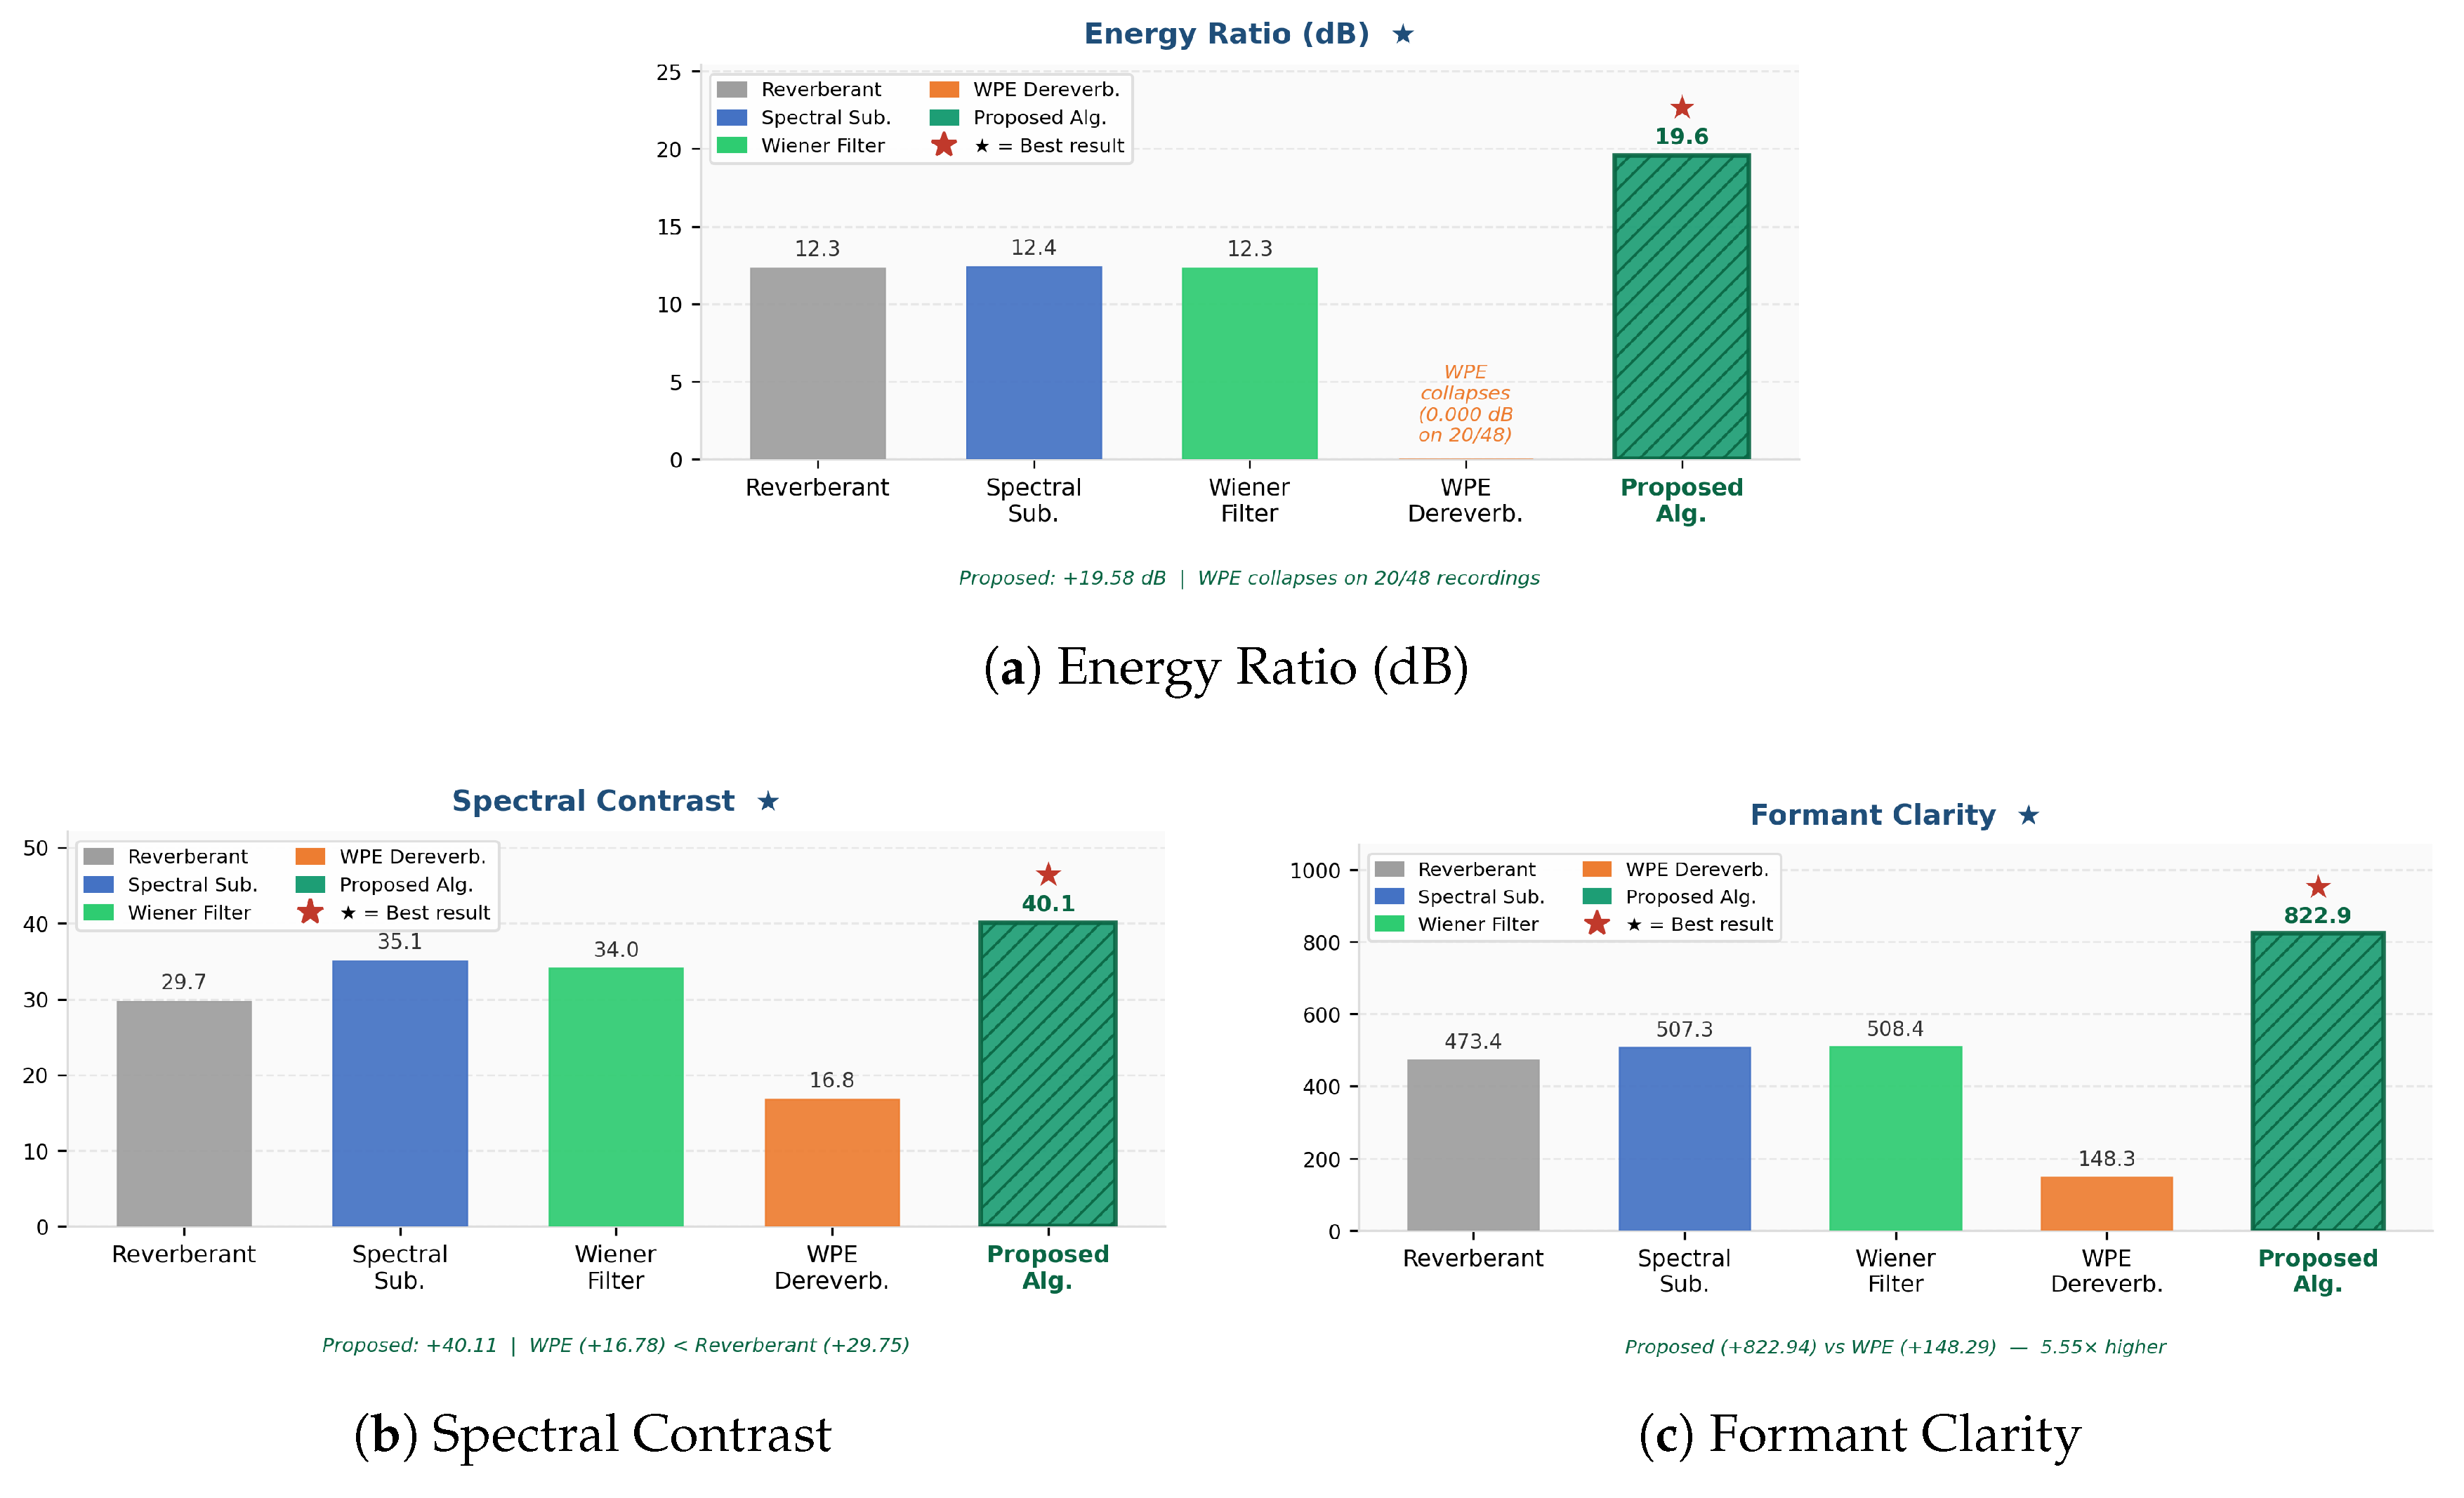
Figure 9.
Quranic-specific metric comparison across all five methods (48 real room recordings). The proposed algorithm (green hatched) achieves the highest value in all three metrics. WPE Dereverberation collapses in Energy Ratio (0.000 dB on 20 of 48 recordings) and produces the lowest Formant Clarity (+148.29 - 5.55× below the proposed algorithm’s +822.94).
Figure 9.
Quranic-specific metric comparison across all five methods (48 real room recordings). The proposed algorithm (green hatched) achieves the highest value in all three metrics. WPE Dereverberation collapses in Energy Ratio (0.000 dB on 20 of 48 recordings) and produces the lowest Formant Clarity (+148.29 - 5.55× below the proposed algorithm’s +822.94).
5.3. Iterative Development
6. Conclusions
This paper presented a four-stage, phase-coherent dereverberation pipeline designed specifically for Quranic recitation preprocessing. The stages-domain-adapted spectral shaping, adaptive noise floor subtraction, soft VAD with power-law boundary decay, and Griffin-Lim phase reconstruction-all operate within a single STFT block to maintain phase continuity.
On 48 real room recordings, the proposed method outperformed all baselines in four of seven metrics: Energy Ratio (+19.579 dB, +59% over the reverberant baseline); Spectral Contrast (+40.109, the highest of all methods); Formant Clarity (+822.942, 5.55× better than WPE); and PESQ (+1.251). Performance was further confirmed on a controlled synthetic experiment (PESQ = +2.495; SNR = −1.874 dB).
The most important finding is that WPE Dereverberation, despite achieving the best SNR on real recordings (−0.400 dB), produces the worst Formant Clarity (+148.293) and collapses on Energy Ratio in 20 of 48 recordings. This demonstrates clearly that optimality with respect to general-purpose metrics does not imply optimality for domain-specific tasks such as Qira’at classification.
The limitation in A downstream feature discriminability experiment sort of further validated that the proposed pipeline does indeed yield more separable acoustic representations, in practice too. MFCC features extracted from the pipeline output got 77.1% KNN classification accuracy (Leave-One-Out CV, k=3), which is better than the unprocessed reverberant signal at 75.0% and also beats all baselines, such as WPE at 70.8%. We also saw intra-class compactness go from 8.010 down to 7.576, so it seems like phonetic preservation really does carry over, and ends up making feature spaces more discriminable for Qira‘at classification. One snag in this study is that the 48 real-room recordings were collected without recitation style labels, so direct Qira‘at accuracy measurement just wasn’t possible. For the future, we will build a labeled multi-Qira‘dataset recorded under reverberant conditions, so we can quantify the classification improvement that comes from this preprocessing pipeline more directly. We’ll also look into extending the evaluation across multiple room types and different microphone layouts, too.
Author Contributions
Conceptualization, O.A.M. and K.H.; methodology, O.A.M.; software, O.A.M.; validation, O.A.M. and K.H.; formal analysis, O.A.M.; investigation, O.A.M.; data curation, O.A.M.; writing-original draft preparation, O.A.M.; writing-review and editing, K.H.; visualization, O.A.M.; supervision, K.H. All authors have read and agreed to the published version of the manuscript.
Funding
This research received no external funding.
Institutional Review Board Statement
Not applicable.
Informed Consent Statement
Not applicable.
Data Availability Statement
The audio recordings used in this study are available from the corresponding author upon reasonable request.
Acknowledgments
The authors thank the University of Nizwa for providing research facilities.
Conflicts of Interest
The authors declare no conflicts of interest.
Abbreviations
| ER | Energy Ratio |
| FC | Formant Clarity |
| FFT | Fast Fourier Transform |
| MFCC | Mel-Frequency Cepstral Coefficient |
| PESQ | Perceptual Evaluation of Speech Quality |
| SC | Spectral Contrast |
| SI-SDR | Scale-Invariant Signal-to-Distortion Ratio |
| SNR | Signal-to-Noise Ratio |
| STFT | Short-Time Fourier Transform |
| STOI | Short-Time Objective Intelligibility |
| VAD | Voice Activity Detection |
| WPE | Weighted Prediction Error |
References
- Alkhateeb, J.H. A Machine Learning Approach for Recognizing the Holy Quran Reciter. Int. J. Adv. Comput. Sci. Appl. 2020, 11. [Google Scholar] [CrossRef]
- Harere, A.A.; Jallad, K.A. Quran Recitation Recognition using End-to-End Deep Learning. arXiv 2023, arXiv:eess. [Google Scholar]
- Davis, S.; Mermelstein, P. Comparison of parametric representations for monosyllabic word recognition in continuously spoken sentences. IEEE Trans. Acoust. Speech Signal Process. 1980, 28, 357–366. [Google Scholar] [CrossRef]
- Ghori, A.F.; Waheed, A.; Waqas, M.; Mehmood, A.; Ali, S.A. Acoustic modelling using deep learning for Quran recitation assistance. Int. J. Speech Technol. 2022, 26, 113–121. [Google Scholar] [CrossRef]
- Shakeel; M.A.; National University of Sciences and Technology; Islamabad; Pakistan.; Khattak, H.A.; Khurshid; N.; National University of Sciences and Technology - Pakistan.; University of Sciences and Technology; Islamabad; Pakistan. Deep acoustic modelling for Quranic Recitation – current solutions and future directions. PSI TIR J. 2024, 20, 61–73. [Google Scholar] [CrossRef]
- Kuttruff, H. Room Acoustics, 5 ed.; Spon Press: London, UK, 2009. [Google Scholar]
- Boll, S. Suppression of acoustic noise in speech using spectral subtraction. IEEE Trans. Acoust. Speech Signal Process. 1979, 27, 113–120. [Google Scholar] [CrossRef]
- Nakatani, T.; Yoshioka, T.; Kinoshita, K.; Miyoshi, M.; Juang, B.H. Speech Dereverberation Based on Variance-Normalized Delayed Linear Prediction. IEEE Trans. Audio Speech Lang. Process. 2010, 18, 1717–1731. [Google Scholar] [CrossRef]
- Griffin, D.W.; Lim, J.S. Signal estimation from modified short-time Fourier transform. IEEE Trans. Acoust. Speech Signal Process. 1984, 32, 236–243. [Google Scholar] [CrossRef]
- Al-Kharusi, M.H.; Hayat, K.; Ruqeishi, K.B.A.; Lone, H.R. A Critical Review of the Need for Knowledge-Centric Evaluation of Quranic Recitation. arXiv 2025, arXiv:cs. [Google Scholar]
- Al Ajmi, S.A.; Hayat, K.; Al Obaidi, A.M.; Kumar, N.; Najim AL-Din, M.S.; Magnier, B. Faked speech detection with zero prior knowledge. Discov. Appl. Sci. 2024, 6, 288. [Google Scholar] [CrossRef]
- Khan, R.U.; Qamar, A.M.; Hadwan, M. Quranic Reciter Recognition: A Machine Learning Approach. Adv. Sci. Technol. Eng. Syst. J. 2019, 4, 173–176. [Google Scholar] [CrossRef]
- Alshboul, M.; Al Muaitah, A.R.; Al-Issa, S.; Al-Ayyoub, M. Enhanced Neural Speech Recognition of Quranic Recitations via a Large Audio Model. Appl. Sci. 2025, 15. [Google Scholar] [CrossRef]
- Al-Ayyoub, M.; Damer, N.A.; Hmeidi, I. Using deep learning for automatically determining correct application of basic quranic recitation rules. Int. Arab J. Inf. Technol. 2018, 15, 620–625. [Google Scholar]
- Kinoshita, K.; Delcroix, M.; Yoshioka, T.; Nakatani, T.; Habets, E.; Haeb-Umbach, R.; Leutnant, V.; Sehr, A.; Kellermann, W.; Maas, R.; et al. The REVERB challenge: Acommon evaluation framework for dereverberation and recognition of reverberant speech. In Proceedings of the IEEE Workshop on Applications of Signal Processing to Audio and Acoustics (WASPAA), 2013; Institute of Electrical and Electronics Engineers Inc.; pp. 1–4. [Google Scholar] [CrossRef]
- Drude, L.; Heitkaemper, J.; Böddeker, C.; Haeb-Umbach, R. SMS-WSJ: Database, performance measures, and baseline recipe for multi-channel source separation and recognition. CoRR 2019, abs/1910.13934, [1910.13934. [Google Scholar]
- Wang, H.; Pandey, A.; Wang, D. A systematic study of DNN based speech enhancement in reverberant and reverberant-noisy environments. Comput. Speech Lang. 2025, 89, 101677. [Google Scholar] [CrossRef]
- Richter, J.; Welker, S.; Lemercier, J.M.; Lay, B.; Gerkmann, T. Speech Enhancement and Dereverberation With Diffusion-Based Generative Models. IEEE/ACM Trans. Audio Speech Lang. Process. 2023, 31, 2351–2364. [Google Scholar] [CrossRef]
- Lemercier, J.M.; Richter, J.; Welker, S.; Gerkmann, T. StoRM: A Diffusion-Based Stochastic Regeneration Model for Speech Enhancement and Dereverberation. IEEE/ACM Trans. Audio Speech Lang. Process. 2023, 31, 2724–2737. [Google Scholar] [CrossRef]
- Wang, Z.; Wichern, G.; Roux, J.L. Convolutive Prediction for Monaural Speech Dereverberation and Noisy-Reverberant Speaker Separation. CoRR 2021, abs/2108.07376. [Google Scholar]
- Rosenbaum, T.; Winebrand, E.; Cohen, O.; Cohen, I. Deep-Learning Framework for Efficient Real-Time Speech Enhancement and Dereverberation. Sensors 2025, 25. [Google Scholar] [CrossRef] [PubMed]
- Perraudin, N.; Balázs, P.; Søndergaard, P.L. A fast Griffin-Lim algorithm. 2013 IEEE Workshop on Applications of Signal Processing to Audio and Acoustics, 2013; pp. 1–4. [Google Scholar]
- Scheibler, R.; Bezzam, E.; Dokmanic, I. Pyroomacoustics: A Python Package for Audio Room Simulation and Array Processing Algorithms. In Proceedings of the 2018 IEEE International Conference on Acoustics, Speech and Signal Processing (ICASSP); IEEE, 2018; pp. 351–355. [Google Scholar] [CrossRef]
- Allen, J.; Berkley, D. Image method for efficiently simulating small-room acoustics. J. Acoust. Soc. Am. Copyright: Copyright 2016 Elsevier B.V., All rights reserved.. 1979, 65, 943–950. [Google Scholar] [CrossRef]
- Fu, S.; Yu, C.; Hsieh, T.; Plantinga, P.; Ravanelli, M.; Lu, X.; Tsao, Y. MetricGAN+: An Improved Version of MetricGAN for Speech Enhancement. CoRR 2021, abs/2104.03538. [Google Scholar]
- Rix, A.W.; Hollier, M.; Hekstra, A.P.; Beerends, J.G. Perceptual Evaluation of Speech Quality ( PESQ ), the new ITU standard for end-to-end speech quality assessment. Part I – Time alignment. 2001. [Google Scholar] [PubMed]
- Taal, C.H.; Hendriks, R.C.; Heusdens, R.; Jensen, J. An Algorithm for Intelligibility Prediction of Time–Frequency Weighted Noisy Speech. IEEE Trans. Audio Speech Lang. Process. 2011, 19, 2125–2136. [Google Scholar] [CrossRef]
- Makhoul, J. Linear prediction: A tutorial review. Proc. IEEE 1975, 63, 561–580. [Google Scholar] [CrossRef]
- Williamson, D.S.; Wang, D. Time-frequency masking in the complex domain for speech dereverberation and denoising. IEEE ACM Trans. Audio Speech Lang. Process. 2017, 25, 1492–1501. [Google Scholar] [CrossRef] [PubMed]
Table 2.
Spectral shaping gain curve parameters and acoustic rationale.
| Freq. Band (Hz) | Energy | Acoustic Rationale | |
|---|---|---|---|
| <100 | 0.05 | <0.1% | Sub-bass noise; no phonetic content |
| 100-300 | 0.10 | ∼3% | Primary reverberation energy source |
| 300-500 | 0.18 | ∼8% | Secondary reverberation tail |
| 500-1000 | 0.35 | ∼37% | Voice body; moderate preservation |
| 1000-2000 | 0.75 | ∼51% | Vowel formants; high preservation (Madd/Harakaat) |
| 2000-4000 | 0.15 | ∼1% | Reverberation tail attenuation |
| 4000-16000 | 0.35 | <1% | Fricative consonants; preserved |
Table 3.
Complete parameter specification.
| Parameter | Value | Purpose |
|---|---|---|
| FFT size () | 1,024 | High freq. resolution (15.6 Hz/bin) |
| Hop length | 256 | 16 ms temporal resolution |
| Window function | Hann | Minimise spectral leakage |
| Sample rate | 16,000 Hz | Standard speech processing rate |
| Noise percentile | 15th | Quietest frames as noise reference |
| Noise subtraction () | 2.0 | Balanced noise reduction |
| Spectral floor () | 0.001 | Prevents frequency bin suppression |
| Gate minimum () | 0.10 | Preserves whispered consonants |
| VAD threshold | 30th pct. | Speech/silence boundary |
| Gap fill duration | 220 ms | Prevents mid-word fragmentation |
| Power decay exponent (p) | 2.0 | Natural word-boundary fade |
| Decay duration (D) | 45 frames | 720 ms consonant resonance |
| Smoothing window | 11 frames | Gradual gate transitions |
| Griffin-Lim iterations | 10 | Phase convergence |
Table 4.
Controlled evaluation - synthetic reverberation (RT60 = 0.4 s, Room = m). Reference: clean studio recording. ★ denotes the best result per metric.
Table 4.
Controlled evaluation - synthetic reverberation (RT60 = 0.4 s, Room = m). Reference: clean studio recording. ★ denotes the best result per metric.
| Metric | Reverb. | Spec. Sub. | WPE | Proposed |
|---|---|---|---|---|
| SNR (dB) | −3.239 | −3.234 | −3.239 | −1.874★ |
| PESQ (ITU-T) | +2.187 | +2.191 | +1.116 | +2.495★ |
| STOI (IEEE) | +0.466 | +0.467★ | +0.174 | +0.466 |
| Energy Ratio (dB) | +14.906 | +15.054 | +38.193★ | +28.959 |
| Total wins / 4 | 0 | 0 | 1 | 3 |
Table 5.
Real room recording evaluation (48 files). ★ denotes the best result per metric.
| Metric | Orig. | S.Sub. | Wien. | WPE | MetricGAN+ | Proposed |
|---|---|---|---|---|---|---|
| SNR (dB) | −1.968 | −1.962 | −1.968 | −0.400★ | −1.968 | −0.839 |
| PESQ | +1.199 | +1.130 | +1.187 | +1.070 | +1.199 | +1.251★ |
| STOI | +0.117 | +0.114 | +0.115 | +0.087 | +0.117 | +0.107 |
| ER (dB) | +12.336 | +12.422 | +12.338 | +19.092 | +12.336 | +19.579★ |
| SI-SDR (dB) | −51.545 | −51.026★ | −51.477 | −53.284 | −51.545 | −51.908 |
| SC | +29.748 | +35.078 | +34.047 | +16.784 | +29.748 | +40.109★ |
| FC | +473.416 | +507.341 | +508.441 | +148.293 | +473.416 | +822.942★ |
| Total wins | 0 | 1 | 0 | 1 | 0 | 4 |
Table 6.
Feature discriminability results (48 recordings, KNN , Leave-One-Out CV). ★ denotes the best result per metric.
Table 6.
Feature discriminability results (48 recordings, KNN , Leave-One-Out CV). ★ denotes the best result per metric.
| Method | KNN Accuracy (%) | Intra-class Compactness |
|---|---|---|
| Original | 75.0 | 8.010 |
| Spectral Sub. | 75.0 | 7.965 |
| Wiener Filter | 72.9 | 8.019 |
| WPE Dereverb. | 70.8 | 7.366★ |
| Proposed | 77.1 ★ | 7.576 |
Table 7.
Qira’at classification accuracy across audio conditions (SVM-RBF, Leave-One-Out CV, 51 recordings, 3 recitation styles).
Table 7.
Qira’at classification accuracy across audio conditions (SVM-RBF, Leave-One-Out CV, 51 recordings, 3 recitation styles).
| Condition | Accuracy |
|---|---|
| Clean | 96.1% |
| Reverberant | 94.1% |
| After Proposed Pipeline | 96.1% |
Table 8.
Statistical significance vs. best competing baseline (Wilcoxon signed-rank test, ).
| Metric | Proposed (Mean±SD) | Baseline (Mean±SD) | p-value | Sig. |
|---|---|---|---|---|
| ER (dB) | <0.001 | *** | ||
| SC | <0.001 | *** | ||
| FC | <0.001 | *** | ||
| PESQ | <0.05 | * | ||
| SNR (dB) | <0.001 | *** |
*** ;* .Baselines: ER, SC, FC - best competing method; PESQ - Original; SNR - WPE.
Table 9.
Iterative parameter refinement history.
| Ver. | Key Change | Quality | Problem | Action |
|---|---|---|---|---|
| V1 | Basic STFT + hard gate | Poor (6.0) | Metallic voice | Add Griffin-Lim |
| V2 | +Griffin-Lim (10 iter.) | Good (8.5) | Sharp word ends | Extend decay |
| V3 | Decay: 20→45 frames | V.Good (9.5) | Consonant clips | Raise |
| Final | : 0.05→0.10 | Exc. (9.5+) | None | - |
Table 10.
Key parameter corrections and their acoustic effects.
| Parameter | Initial | Final | Effect |
|---|---|---|---|
| HF gain (>4 kHz) | 0.02 | 0.35 | Restored fricative clarity |
| Noise | 3.0 | 2.0 | Eliminated metallic artefacts |
| Gate type | Hard | Soft | Removed click artefacts |
| Gap fill duration | 120 ms | 220 ms | Prevented mid-word cuts |
| Power exponent | 4.0 | 2.0 | Natural decay shape |
| FFT size | 512 | 1024 | Improved frequency resolution |
Disclaimer/Publisher’s Note: The statements, opinions and data contained in all publications are solely those of the individual author(s) and contributor(s) and not of MDPI and/or the editor(s). MDPI and/or the editor(s) disclaim responsibility for any injury to people or property resulting from any ideas, methods, instructions or products referred to in the content. |
© 2026 by the authors. Licensee MDPI, Basel, Switzerland. This article is an open access article distributed under the terms and conditions of the Creative Commons Attribution (CC BY) license (http://creativecommons.org/licenses/by/4.0/).
Copyright: This open access article is published under a Creative Commons CC BY 4.0 license, which permit the free download, distribution, and reuse, provided that the author and preprint are cited in any reuse.