

Submitted:
25 June 2026
Posted:
26 June 2026
You are already at the latest version
Abstract
Introduction: Neuromonitoring during general anesthesia (GA) is recommended to reduce the incidence of postoperative delirium and intraoperative awareness, particularly during total intravenous anesthesia. Guidelines emphasize that anesthesiologists should not rely solely on processed depth-of-anesthesia indices such as the Bispectral Index or Patient State Index but should also interpret the raw electroencephalographic (EEG) waveform and the density spectral array (DSA). While EEG patterns associated with individual anesthetic agents or combinations of hypnotics and opioids have been described, limited evidence exists regarding EEG activity during multimodal anesthetic regimens. This review aimed to evaluate DSA patterns as pharmacodynamic markers of the cortical effects of GABAergic anesthetics, opioids, and ketamine. Methods: PubMed, Embase, and the Cochrane Library were searched without temporal limitation up to September 2025. Eligible studies included adult patients undergoing general anesthesia and reporting raw EEG data or specific DSA patterns associated with the investigated drugs. Results: Out of 273 papers screened, two studies met the inclusion criteria, comprising 53 patients. Both studies achieved an appropriate and stable effect-site concentration of propofol-remifentanil GA, demonstrated by a baseline DSA recorded before ketamine administration. Ketamine administration produced a shift from the baseline alpha-delta pattern to a beta-delta DSA pattern. Conclusion: Ketamine administration during stable propofol-remifentanil anesthesia produces a characteristic shift towards a beta-delta DSA pattern which may increase in processed EEG indices, leading to misinterpretation of anesthetic depth. Further studies are needed to characterize DSA signatures associated with multimodal anesthesia and to identify patterns indicative of adequate anesthetic depth when multiple agents are administered.
Keywords:
electroencephalography
; general anesthesia
; propofol
; ketamine
; opioid analgesics
; remifentanil
; pharmacodynamics
; pharmacokinetics
; consciousness monitors
Key points:
- -
- The DSA is still underutilized for DOA monitoring regardless of the current guidelines and extensive evidence supporting it.
- -
- Ketamine administration during GABAergic and opioid anesthesia renders the processed indices useless since it increases their number, signaling a false arousal.
- -
- Correctly interpreting ketamine’s specific effect on the DSA allows to reliably monitor the patients’ DOA during GABAergic and opioid anesthesia.
1. Introduction
Depth of anesthesia (DOA) monitoring during general anesthesia (GA) is currently recommended by the European Society of Anaesthesiology and Intensive Care (ESAIC) to reduce the risk of intraoperative awareness and postoperative delirium as it allows for a more tailored anesthetic management strategy. Current guidelines emphasize that anesthesiologists must be able to interpret raw electroencephalography (EEG) signals and density spectral array (DSA) patterns, as processed indices alone are insufficient for optimal management of patients under GA [1]. DSA represents a time–frequency representation of EEG power across different frequency bands, allowing real-time visualization of anesthetic-induced cortical oscillations. Specific DSA patterns have been described for various anesthetic agents [1,2]. However, evidence describing EEG activity during multimodal anesthesia remains limited. Importantly, EEG features vary substantially according to patient age and neurocognitive reserve [3], reinforcing the need for individualized interpretation of EEG and DSA patterns.
Volatile anesthetics have historically been titrated using the Minimum Alveolar Concentration (MAC), defined as the anesthetic’s alveolar concentration at which 50% of patients do not respond to a standardized surgical stimulus [4]. Although MAC correlates with the partial pressure of the anesthetic agents in the central nervous system, it remains an empirical measure derived from healthy volunteer [4] and based primarily on behavioral responses rather than neurophysiological markers. Moreover, MAC is influenced by multiple factors such as age, body temperature, comorbidities, and the concomitant use of opioids or sedatives. Consequently, relying solely on MAC may not accurately reflect the true hypnotic state of the brain and may lead to excessive sedation or even burst suppression, particularly in elderly or vulnerable patients, since the alveolar concentration needed to induce unconsciousness may differ from the MAC value [3]. DOA monitoring therefore allows clinicians to tailor volatile anesthetic dosing according to each patient’s neurophysiological response [5], thus improving patient safety.
Intravenous anesthetics such as propofol and remifentanil are increasingly delivered using Target-Controlled Infusion (TCI) systems based on pharmacokinetic/pharmacodynamic (PK/PD) models [6,7]. These systems aim to achieve specific plasma or effect-site concentrations in order to provide adequate hypnosis or analgesia while minimizing adverse effects associated with drug accumulation or excessive dosing, such as hypotension or burst suppression. Early models, derived from relatively small cohorts of healthy volunteers [6,8], linked plasma concentrations to clinical effects and were later updated to incorporate effect-site targeting based on processed DOA indices [9]. However, these models often failed to account for interindividual variability, particularly in specific populations such as obese patients or children, as they relied primarily on compartmental analysis and assumed linear pharmacokinetics across all patients [10].
More recently, population-based nonlinear mixed-effects models (NONMEM) have been developed to better account for interpatient variability and improve predictive accuracy [7,11]. The integration of pharmacological modeling and neurophysiological monitoring has significantly advanced the understanding and control of anesthetic depth [12]. When combined with EEG and DSA monitoring, TCI systems enable real-time correlation between predicted drug concentrations and brain electrical activity, thereby supporting individualized drug titration and reducing the risks of hypotension, awareness, and burst suppression.
The integration of DSA with conventional processed EEG indices has allowed researchers to link effect-site drug concentrations with characteristic DSA signatures. At adequate concentrations, propofol produces a frontal alpha–delta pattern, characterized by alpha oscillations (8-12 Hz) superimposed on a slow delta background (0.5-4 Hz) [2,13].
In contrast, volatile anesthetics (i.e., sevoflurane, isoflurane, etc.) typically induce a theta-delta pattern, reflecting a broader cortical depression effect [2,4]. This slower frontal background rhythm may reflect differences in PD mechanisms or anesthetic potency compared with propofol [14]. Additionally, because MAC values were historically established based on clinical responsiveness rather than neurophysiological monitoring, anesthetic concentrations considered clinically adequate may in some cases correspond to deeper the necessary levels of cortical suppression [15].
Evidence regarding opioid-related EEG signatures remains inconsistent. Some authors have suggested that increases in theta power (4-7 Hz) may represent a marker of adequate analgesia [16]. When combined with GABAergic anesthetics, opioids may contribute to the maintenance of stable alpha–delta rhythms by reducing nociception-driven cortical arousal (i.e., preventing abrupt shifts towards beta-delta patterns) [17] (Figure 1 and Figure 2).
N-methyl-D-aspartate (NMDA) receptor antagonists, particularly ketamine, produce distinct electrophysiological signatures. When administered at induction doses (i.e., 1-2 mg/kg iv), ketamine typically produces a gamma burst pattern (> 30 Hz) superimposed on a mixed-frequency background. In contrast, subanesthetic doses (i.e., < 1 mg/kg) or the waning phase following an induction dose are associated with a low beta–delta pattern [18] (Figure 3).
Most available studies have focused on characterizing DSA patterns associated with single agents or combinations of GABAergic agents and opioids [1,2]. However, contemporary anesthetic practice increasingly relies on multimodal approaches combining hypnotics, analgesics, NMDA-antagonists, and other adjuncts [19]. In this context, understanding how multiple drug classes interact pharmacodynamically, and how these interactions manifest on DSA becomes increasingly important. Real-time visualization of these combined electrophysiological effects may help guide drug titration to optimize hypnosis, analgesia, and cortical stability, particularly in elderly or neurologically vulnerable patients. Once this step is completed, subsequent studies should focus on determining whether specific DSA alterations, such as reduction in band-specific power or shift in dominant oscillatory frequencies, correlate with clinically relevant outcomes including increased risk of delirium or mortality.
This narrative review therefore aims to investigate the DSA patterns associated with the combined administration of GABAergic anesthetics, opioids, and ketamine during general anesthesia, given the increasing use of multimodal anesthetic techniques and the current lack of detailed characterization of their combined electrophysiological effects.
2. Materials and Methods
A literature review was conducted to identify studies evaluating EEG and DSA patterns associated with the combined use of GABAergic anesthetics, opioids, and ketamine during general anesthesia. Two authors independently screened all retrieved articles and applied the predefined inclusion and exclusion criteria. In cases of disagreement, a third author resolved the issue while blinded to the initial assessments. Full-text analysis was performed for all potentially eligible articles to further assess study eligibility. Data extraction from the included studies was performed independently by two authors, with discrepancies resolved as described above.
The primary objective of this review was to analyze specific DSA patterns associated with the combined administration of GABAergic anesthetics, opioids, and ketamine.
A comprehensive search of Embase, MEDLINE, and the Cochrane Library was performed without time restriction up to September 2025. The search strategy used combination of the following keywords:
- (((propofol OR GABAergic) AND (remifentanil OR opioid)) AND (ketamine)) AND (EEG OR electroencephalography OR BIS OR “Bispectral index” OR SEF95 OR “spectral edge frequency” OR PSI OR “Patient State Index” OR neuromonitoring OR “theta wave” OR “beta wave” OR “depth of anesthesia monitoring”)
- (((propofol OR GABAergic) AND (remifentanil OR opioid)) AND (ketamine)) AND (((EEG OR electroencephalography OR BIS OR “Bispectral index” OR SEF95 OR “spectral edge frequency” OR PSI OR “Patient State Index” OR neuromonitoring OR “theta wave” OR “beta wave” OR “depth of anesthesia monitoring”)) OR (“Intraoperative Neurophysiological Monitoring”))
The inclusion criteria were: adult patients (>18 years), retrospective studies or prospective clinical trials conducted under general anesthesia, studies reporting raw EEG data or specific DSA patterns associated with the studied drugs, and articles published in English.
The exclusion criteria were: pediatric populations, case series or case reports, studies reporting only numerical EEG indices without DSA patterns, studies involving light sedation, non-human studies, and non-English language articles.
The screening process of the articles was performed independently by two authors. Any discrepancies between reviewers was resolved by a third author who was blinded to the initial decision. All eligible articles underwent full-text review to confirm inclusion. Data extraction from the included articles was conducted independently by two authors, with disagreement resolved through the process mentioned above. The relevant data from each included study were summarized in Table 1.
3. Results
A total of 454 articles were identified through the search strategy. After removal of 181 duplicate records, 273 articles were screened based on abstract information. Of these, 264 were excluded according to the inclusion criteria described in the Methods section. Nine articles underwent full-text review, of which seven did not meet the inclusion criteria. Ultimately, two articles were included in the final analysis. The results are summarized in Figure 4.
Linassi et al. [20] conducted a single-center prospective observational trial including 14 adult female patients classified as ASA I who underwent oncologic breast surgery between March 2022 and January 2023 [20]. The primary outcome was the dose-dependent effect of ketamine on the Bispectral Index (BIS), Spectral Edge Frequency (SEF), and the Surgical Pleth Index (SPI), a marker of intraoperative nociception, during stable propofol and remifentanil target-controlled infusion total intravenous anesthesia (TCI-TIVA). Propofol was administered using the Eleveld TCI model with an effect-site concentration of 2–3 μg/mL in patients > 50 years and 3–4 μg/mL in patients < 50 years. Remifentanil was administered using the Minto model with effect-site concentrations of 2 ng/mL (> 50 years) or 3 ng/mL (< 50 years). Adequate anesthesia was assessed by loss of consciousness (LOC) and achieving the desired infusion concentration, while BIS monitoring (range 40–60) was used during maintenance. Ketamine was administered using the Domino TCI model. The infusion was started at 1 μg/mL and once this target concentration had been reached, it was subsequently reduced to 0 μg/mL. Although DSA was not included as a predefined outcome, it was calculated based on their collected data, allowing a qualitative description of the spectral changes observed. Key findings included increases in both BIS and SEF values, with no significant changes in SPI. Notably, during propofol-remifentanil anesthesia, the authors described a characteristic increase in alpha-delta band oscillatory patterns. Following ketamine administration, low beta oscillatory activity appeared, which gradually returned to an alpha pattern as ketamine plasma concentration decreased. The risk of bias for this study was assessed with using the ROBINS-I tool and is summarized in Table 2.
The overall risk of bias was classified as serious, mainly due to the absence of a control group and the lack of covariate adjustment or mixed-effects modeling, which the authors reported was not feasible due to a small sample size. Potential residual confounders included age, sex (all participants were female), and nociceptive stimuli during surgery. Furthermore, the high exclusion rate (78%) introduced significant selection bias, as the cohort represents a highly selected population of pharmacodynamic responders, thus limiting the generalizability of the findings. According to the GRADE framework, the overall certainty of evidence was considered very low.
Araujo et al. [21] conducted a randomized controlled trial (RCT) including 39 adults patients undergoing elective spine surgery [21]. General anesthesia was induced and maintained using a TCI-TIVA protocol for both propofol and remifentanil. After stable anesthesia was achieved, patients were randomized to receive a ketamine bolus of 0.1 mg/kg (group 1), 0.5 mg/kg (group 2), or 1 mg/kg (group 3). Following ketamine administration, SEF increased by 1.34 ± 0.99 in group 1 (P < 0.001). In group 2, SEF increased by 3.03 ± 2.04 (P < 0.01) and BIS by 6.65 ± 7.40 (P = 0.008). In group 3, SEF and BIS increased by 3.30 ± 2.77 (P = 0.01) and 6.85 ± 10.35 (P = 0.034), respectively. Additionally, an increase in higher- frequency components on the DSA compared with baseline was reported, although neither the baseline DSA pattern nor the specific EEG frequency bands showing increased power were described. The risk of bias was assessed using the RoB 2 Assessment tool, with the results summarized in Table 3.
The resulting overall risk of bias was classified as “some concerns”, primarily because no surgical stimulus was present during the observation period. The GRADE certainty of evidence was rated as very low. Although the observed effect appears to be dose-related, their magnitude and clinical relevance remain unclear.
Overall, both studies reported an increase in higher-than-alpha frequencies following ketamine administration during propofol-remifentanil anesthesia, consistent with the observed increases in BIS and SEF values.
4. Discussion
DOA monitoring is commonly performed using specialized devices that process raw EEG signals through proprietary algorithm to generate a dimensionless numerical index. Manufacturers typically provide recommended index ranges for either light sedation or general anesthesia [22]. Most society guidelines endorse monitoring DOA using these recommended index ranges, and the majority of published articles follow those indications. However, in recent years a more in-depth approach has been proposed, involving qualitative analysis of drug-associated DSA patterns, which represent a more informative processed EEG parameter. By evaluating the prevalence and intensity of specific EEG frequencies and patterns, clinicians can better assess the adequacy of anesthesia [2,23]. A major limitation of processed indices arises during ketamine administration. Ketamine increases beta-wave activity when administered during stable GABAergic anesthesia, which elevates the processed index and falsely suggests a lighter depth of anesthesia. This phenomenon can render processed indices unreliable for clinical monitoring [11,24]. In contrast, correct interpretation of the DSA can overcome this limitation by revealing a visible characteristic shift from the stable alpha-delta pattern associated with GABAergic anesthesia to a higher beta-delta pattern following ketamine administration. As ketamine’s effect wanes, the DSA gradually returns to the baseline GABAergic pattern [18,25], closely reflecting the drug’s pharmacokinetic profile. Recently, the ESAIC issued a guideline on perioperative delirium prevention emphasizing that reliance on processed indices alone is insufficient for accurate monitoring of anesthetic depth [1]. These guidelines highlight the importance of anesthesiologists being able to interpret raw EEG signals and drug-specific DSA patterns in order to reduce the risk of burst suppression from over-sedation and, consequently, postoperative delirium. However, most drug-specific DSA patterns described in the literature involve either single hypnotic agents or combinations of two drugs administered simultaneously [26]. Such studies do not fully reflect the growing multimodal anesthesia practice, which relies on the simultaneous administration of several drugs (i.e., opioids, ketamine, alpha-2 agonists, Magnesium sulfate, etc.), which may substantially alter DSA patterns [19].
Linassi et al. [20] conducted a prospective observational study aimed at investigating the effects of adding a ketamine bolus to stable propofol-remifentanil general anesthesia [20]. Propofol was administered using the Eleveld model, currently one of the most comprehensive TCI models available for propofol. However, the authors did not specify whether they used the version of the model that accounts for the simultaneous administration of remifentanil. Propofol and remifentanil are known to act synergistically [27], and the Eleveld model was specifically developed to account for this interaction. Despite this, the authors chose to administer remifentanil using the Minto model instead. Furthermore, ketamine was administered using the Domino model with an effect-site target. This is probably a typographical error, since the Domino model provides only plasma target concentrations, and, currently, no model provides an effect-site target concentration for ketamine. The absence of an effect-site model may reflect the fact that a clear DSA pattern corresponding to ketamine effect-site concentrations had been described primarily for anesthetic doses, whereas subanesthetic doses typically produce a beta-delta pattern that does not allow reliable differentiation between dissociated and aware state [25,28].
The results of the study showed that administration of a TCI bolus of ketamine during stable propofol-remifentanil general anesthesia, resulted in a DSA shift from an alpha-delta to a beta-delta pattern, while no apparent DSA changes were attributable to the remifentanil infusion. To our knowledge, this represents the first prospectively study to investigate the specific DSA patterns associated with the combined administration of these three drugs in a clinical setting. As such, it should be considered an initial exploratory study that may serve as the basis for future investigations focusing specifically on DSA patterns as a primary endpoint.
The main strength of the study lies in the administration of all three agents using their respective TCI pharmacokinetic models, which helps limit variability associated with drug accumulation and overshoot of target plasma concentrations. Nevertheless, several methodological limitations weaken the strength of its conclusions. First, DSA analysis was designated as a secondary rather than a primary outcome, despite increasing recommendations emphasizing its clinical relevance. Second, the exclusion of neuromuscular blocking agents limits the generalizability of the findings, as these agents are commonly used in general anesthesia and improve EEG signal quality by cancelling muscle artifacts. Third, the combination of the Eleveld TCI model for propofol and the Minto model for remifentanil was not clearly justified and lacks a strong clinical rationale, given that the Eleveld model was specifically to account for the coadministration of remifentanil. Fourth, propofol induction dose was based primarily on patient age, and loss of responsiveness was assessed clinically rather than through DSA-guided titration to achieve a characteristic alpha-delta pattern confirming adequate DOA. Finally, the sample size of the study was relatively small and limited to a single type of surgery, further limiting the generalizability of the results.
Araujo et al. [21] conducted a RCT involving patients undergoing elective spine surgery [21]. Anesthesia was induced with Propofol administered via TCI at a rate of 200 mL/h until LOC, while Remifentanil delivered using TCI with an effect-site concentration of 3 ng/mL. Once a stable BIS value was achieved, patients were randomized to receive a ketamine bolus of 0.1, 0.5 or 1 mg/kg. The primary outcomes were changes in BIS, SEF and DSA. The results indicated a significant increase in both BIS and SEF values compared with baseline, accompanied by increases in higher- frequency components on the DSA. However, several methodological limitations ere noted. Specifically, the baseline DSA pattern was not reported and the specific EEG frequency bands that increased following ketamine administration were not described. Additionally, the authors did not specify the TCI models used for propofol and remifentanil, nor did they report the selected target effect-site concentration for propofol. Finally, stable anesthesia was assessed using BIS values rather than DSA patterns, despite current international recommendation guidelines [1]. These limitations introduce substantial bias and require that the findings be interpreted with caution.
Overall, the results of the present systematic review suggest that DSA patterns may allow anesthesiologists to properly monitor DOA, even in the presence of ketamine bolus administration. Adequate DOA may be inferred by recognizing the shift from an alpha-delta pattern to a beta-delta pattern corresponding to the peak pharmacodynamic effect of ketamine, regardless of the processed indices. The subsequent return to the baseline DSA likely reflects declining ketamine concentrations.
Interestingly, this review highlights the scarcity of studies relying solely on DSA interpretation as a marker of DOA, despite the growing body of literature [29] and recent ESAIC guidelines suggesting that processed indices alone are insufficient for accurate anesthetic depth monitoring. This discrepancy likely reflects the typical delay between the publication of updated best-practice guidelines and their actual implementation in clinical practice, particularly given that anesthesiologists are required to learn how to interpret EEG spectrograms and raw EEG signals.
Future research should aim to validate these EEG and DSA patterns in larger and more diverse cohorts, including older and more medically complex patients undergoing a broader range of surgical procedures, in order to enhance the clinical applicability of the findings. Additionally, exploring the different effects of ketamine administered as a single bolus versus continuous infusion may reveal distinct DSA patterns, as continuous infusions could exhibit context-sensitive pharmacokinetics that are not observed with bolus dosing. Further studies should also investigate different TCI models and combinations of effect-site concentrations in order to identify optimal strategies for achieving the desired DOA and DSA patterns while minimizing adverse effects. Incorporating these insights into anesthetic depth monitoring algorithms could improve their accuracy, reduce misinterpretation of cortical arousal, and ultimately enhance patient safety during anesthesia. Nevertheless, several barriers remain to the widespread implementation of these novel approaches and monitoring devices. The demands of routine clinical practice and the specialized nature of neuromonitoring currently hinder their rapid adoption. For this reason, anesthesia residency programs and continuing medical education programs should incorporate dedicated lectures and hands on training focused on EEG based DOA monitoring. Such educational efforts would help anesthesiologists remain aligned with rapidly evolving practice guidelines and emerging neurophysiological markers of anesthetic depth.
5. Conclusions
In conclusion, the present review suggests that the addition of ketamine to stable propofol-remifentanil anesthesia produces a shift in DSA patterns from an alpha-delta pattern to a beta-delta pattern, corresponding to ketamine’s peak effective concentration. These findings indicate that future studies should focus on DSA pattern analysis as a primary outcome rather than relying solely on processed EEG indices. Furthermore, the DSA signatures associated with different combinations of anesthetic and analgesic agents should be further investigated, particularly as multimodal and opioid-sparing anesthetic strategies become increasingly common and may complicate the interpretation of conventional DOA monitoring.
Author Contributions
Conceptualization, A.G., P.V., R.P., and F.V.; methodology, A.G., P.V. and R.P.; investigation, A.G., P.V., F.S, D.S., and G.S.; data curation, A.G.; writing—original draft preparation, A.G., P.V., and F.V.; writing—review and editing, A.G., P.V., F.S., D.S., G.S., and R.P. All authors have read and agreed to the published version of the manuscript.
Funding
This research received no external funding.
Data Availability Statement
Data will be available upon reasonable request to the corresponding author.
Acknowledgments
The authors wish to thank Cristiano Chiappa and Christian Fortunato for their help designing the study.
Conflicts of Interest
The authors declare no conflicts of interest.
Abbreviations
The following abbreviations are used in this manuscript:
| GA | General Anesthesia |
| EEG | Electroencephalographic |
| DSA | Density Spectral Array |
| DOA | Depth of Anesthesia |
| ESAIC | European Society of Anaesthesiology and Intensive Care |
| MAC | Minimum Alveolar Concentration |
| TCI | Target-Controlled Infusion |
| PK/PD | pharmacokinetic/pharmacodynamic |
| NONMEM | Nonlinear Mixed-Effects Models |
| NMDA | N-methyl-D-aspartate |
| BIS | Bispectral Index |
| SEF | Spectral Edge Frequency |
| SPI | Surgical Pleth Index |
| TCI-TIVA | Target-Controlled Infusion Total Intravenous Anesthesia |
References
- Aldecoa, et al. Update of the European Society of Anaesthesiology and Intensive Care Medicine evidence-based and consensus-based guideline on postoperative delirium in adult patients. Eur. J. Anaesthesiol. EJA 2024, 41(2), 81. [Google Scholar]
- Purdon, et al. Clinical Electroencephalography for Anesthesiologists: Part I: Background and Basic Signatures. Anesthesiology 2015, 123(4), 937–960. [Google Scholar] [PubMed]
- Purdon, et al. The Ageing Brain: Age-dependent changes in the electroencephalogram during propofol and sevoflurane general anaesthesia. Br. J. Anaesth. 2015, 115 Suppl 1 (Suppl 1), i46–i57. [Google Scholar] [CrossRef] [PubMed]
- Eger, et al. Minimum Alveolar Anesthetic Concentration: A Standard of Anesthetic Potency. Anesthesiology 1965, 26(6), 756–763. [Google Scholar] [CrossRef] [PubMed]
- Kumar, et al. A study of the relationship between Bispectral index and age-adjusted minimum alveolar concentration during the maintenance phase of general anesthesia in elective surgery. J. Anaesthesiol. Clin. Pharmacol. 2024, 40(4), 626–632. [Google Scholar] [CrossRef] [PubMed]
- Minto, et al. Pharmacokinetics and Pharmacodynamics of Remifentanil: II. Model Application. Anesthesiology 1997, 86(1), 24–33. [Google Scholar] [PubMed]
- Vellinga, et al. Prospective clinical validation of the Eleveld propofol pharmacokinetic-pharmacodynamic model in general anaesthesia. Br. J. Anaesth. 2021, 126(2), 386–394. [Google Scholar] [CrossRef] [PubMed]
- Schnider; Minto. Pharmacokinetic models of propofol for TCI. Anaesthesia 2008, 63(2), 206–206. [Google Scholar] [CrossRef] [PubMed]
- Gambús; Trocóniz. Pharmacokinetic–pharmacodynamic modelling in anaesthesia. Br. J. Clin. Pharmacol. 2015, 79(1), 72–84. [Google Scholar] [PubMed]
- Gepts. Pharmacokinetic concepts for TCI anaesthesia. Anaesthesia 1998, 53(s1), 4–12. [Google Scholar] [CrossRef] [PubMed]
- Van Heusden, et al. Effect of ketamine on the NeuroSENSE WAVCNS during propofol anesthesia; a randomized feasibility trial. J. Clin. Monit. Comput. 2021, 35(3), 557–567. [Google Scholar] [PubMed]
- Zhang, et al. Reviews of Modeling Techniques for Neuromonitoring Depth of Anesthesia. Crit. Rev. BioMed Eng. 2017, 45(1-6), 219–261. [Google Scholar] [CrossRef] [PubMed]
- Adam, et al. Modulatory dynamics mark the transition between anesthetic states of unconsciousness. Proc. Natl. Acad. Sci. 2023, 120(30), e2300058120. [Google Scholar] [CrossRef] [PubMed]
- Bruelle, et al. Comparative Electrophysiologic and Hemodynamic Effects of Several Amide Local Anesthetic Drugs in Anesthetized Dogs. Anesth. Analg. 1996, 82(3), 648–656. [Google Scholar] [CrossRef] [PubMed]
- Blanchard, et al. Minimal alveolar concentration for deep sedation (MAC-DS) in intensive care unit patients sedated with sevoflurane: A physiological study. Anaesth. Crit. Care Pain Med. 2020, 39(3), 429–434. [Google Scholar] [CrossRef] [PubMed]
- Malver, et al. Electroencephalography and analgesics. Br. J. Clin. Pharmacol. 2014, 77(1), 72–95. [Google Scholar] [PubMed]
- García, et al. Effects of noxious stimulation on the electroencephalogram during general anaesthesia: a narrative review and approach to analgesic titration. Br. J. Anaesth. 2021, 126(2), 445–457. [Google Scholar] [CrossRef] [PubMed]
- Akeju, et al. Electroencephalogram signatures of ketamine anesthesia-induced unconsciousness. Clin. Neurophysiol. Off. J. Int. Fed. Clin. Neurophysiol. 2016, 127(6), 2414–2422. [Google Scholar] [CrossRef]
- Léger, et al. Opioid-free Anesthesia Protocol on the Early Quality of Recovery after Major Surgery (SOFA Trial): A Randomized Clinical Trial. Anesthesiology 2024, 140(4), 679–689. [Google Scholar] [PubMed]
- Linassi, et al. Effect of Ketamine on the Bispectral Index, Spectral Edge Frequency, and Surgical Pleth Index During Propofol-Remifentanil Anesthesia: An Observational Prospective Trial. Anesth. Analg. 2025, 140(6), 1276–1285. [Google Scholar] [PubMed]
- 9th International Update on Neuroanesthesia and Neurointensive Care EURONEURO 2016: Barcelona, Spain, April 14–16, 2016. J. Neurosurg. Anesthesiol. 2016, 28(2), S1–S51. [PubMed]
- Prichep, et al. The Patient State Index as an indicator of the level of hypnosis under general anaesthesia. Br. J. Anaesth. 2004, 92(3), 393–399. [Google Scholar] [CrossRef] [PubMed]
- Adam, et al. Modulatory dynamics mark the transition between anesthetic states of unconsciousness. Proc. Natl. Acad. Sci. 2023, 120(30), e2300058120. [Google Scholar] [CrossRef] [PubMed]
- Hans, et al. Comparative effects of ketamine on Bispectral Index and spectral entropy of the electroencephalogram under sevoflurane anaesthesia. Br. J. Anaesth. 2005, 94(3), 336–340. [Google Scholar] [PubMed]
- Tian, et al. Characterizing brain dynamics during ketamine-induced dissociation and subsequent interactions with propofol using human intracranial neurophysiology. Nat. Commun. 2023, 14(1), 1748. [Google Scholar] [CrossRef] [PubMed]
- Bojak, et al. Ketamine, Propofol, and the EEG: A Neural Field Analysis of HCN1-Mediated Interactions. Front Comput Neurosci. 2013, 7, 22. [Google Scholar] [CrossRef] [PubMed]
- Bouillon, et al. Pharmacodynamic Interaction between Propofol and Remifentanil Regarding Hypnosis, Tolerance of Laryngoscopy, Bispectral Index, and Electroencephalographic Approximate Entropy. Anesthesiology 2004, 100(6), 1353–1372. [Google Scholar] [CrossRef] [PubMed]
- Chamadia, et al. Ketamine induces EEG oscillations that may aid anesthetic state but not dissociation monitoring. Clin. Neurophysiol. 2021, 132(12), 3010–3018. [Google Scholar] [CrossRef] [PubMed]
- Lin, et al. Electroencephalographic spectrogram–guided total intravenous anesthesia using dexmedetomidine and propofol prevents unnecessary anesthetic dosing during craniotomy: a propensity score–matched analysis. Korean J. Anesthesiol. 2024, 77(1), 122–132. [Google Scholar] [PubMed]
Figure 1.
A: DSA pattern of Propofol and Remifentanil.
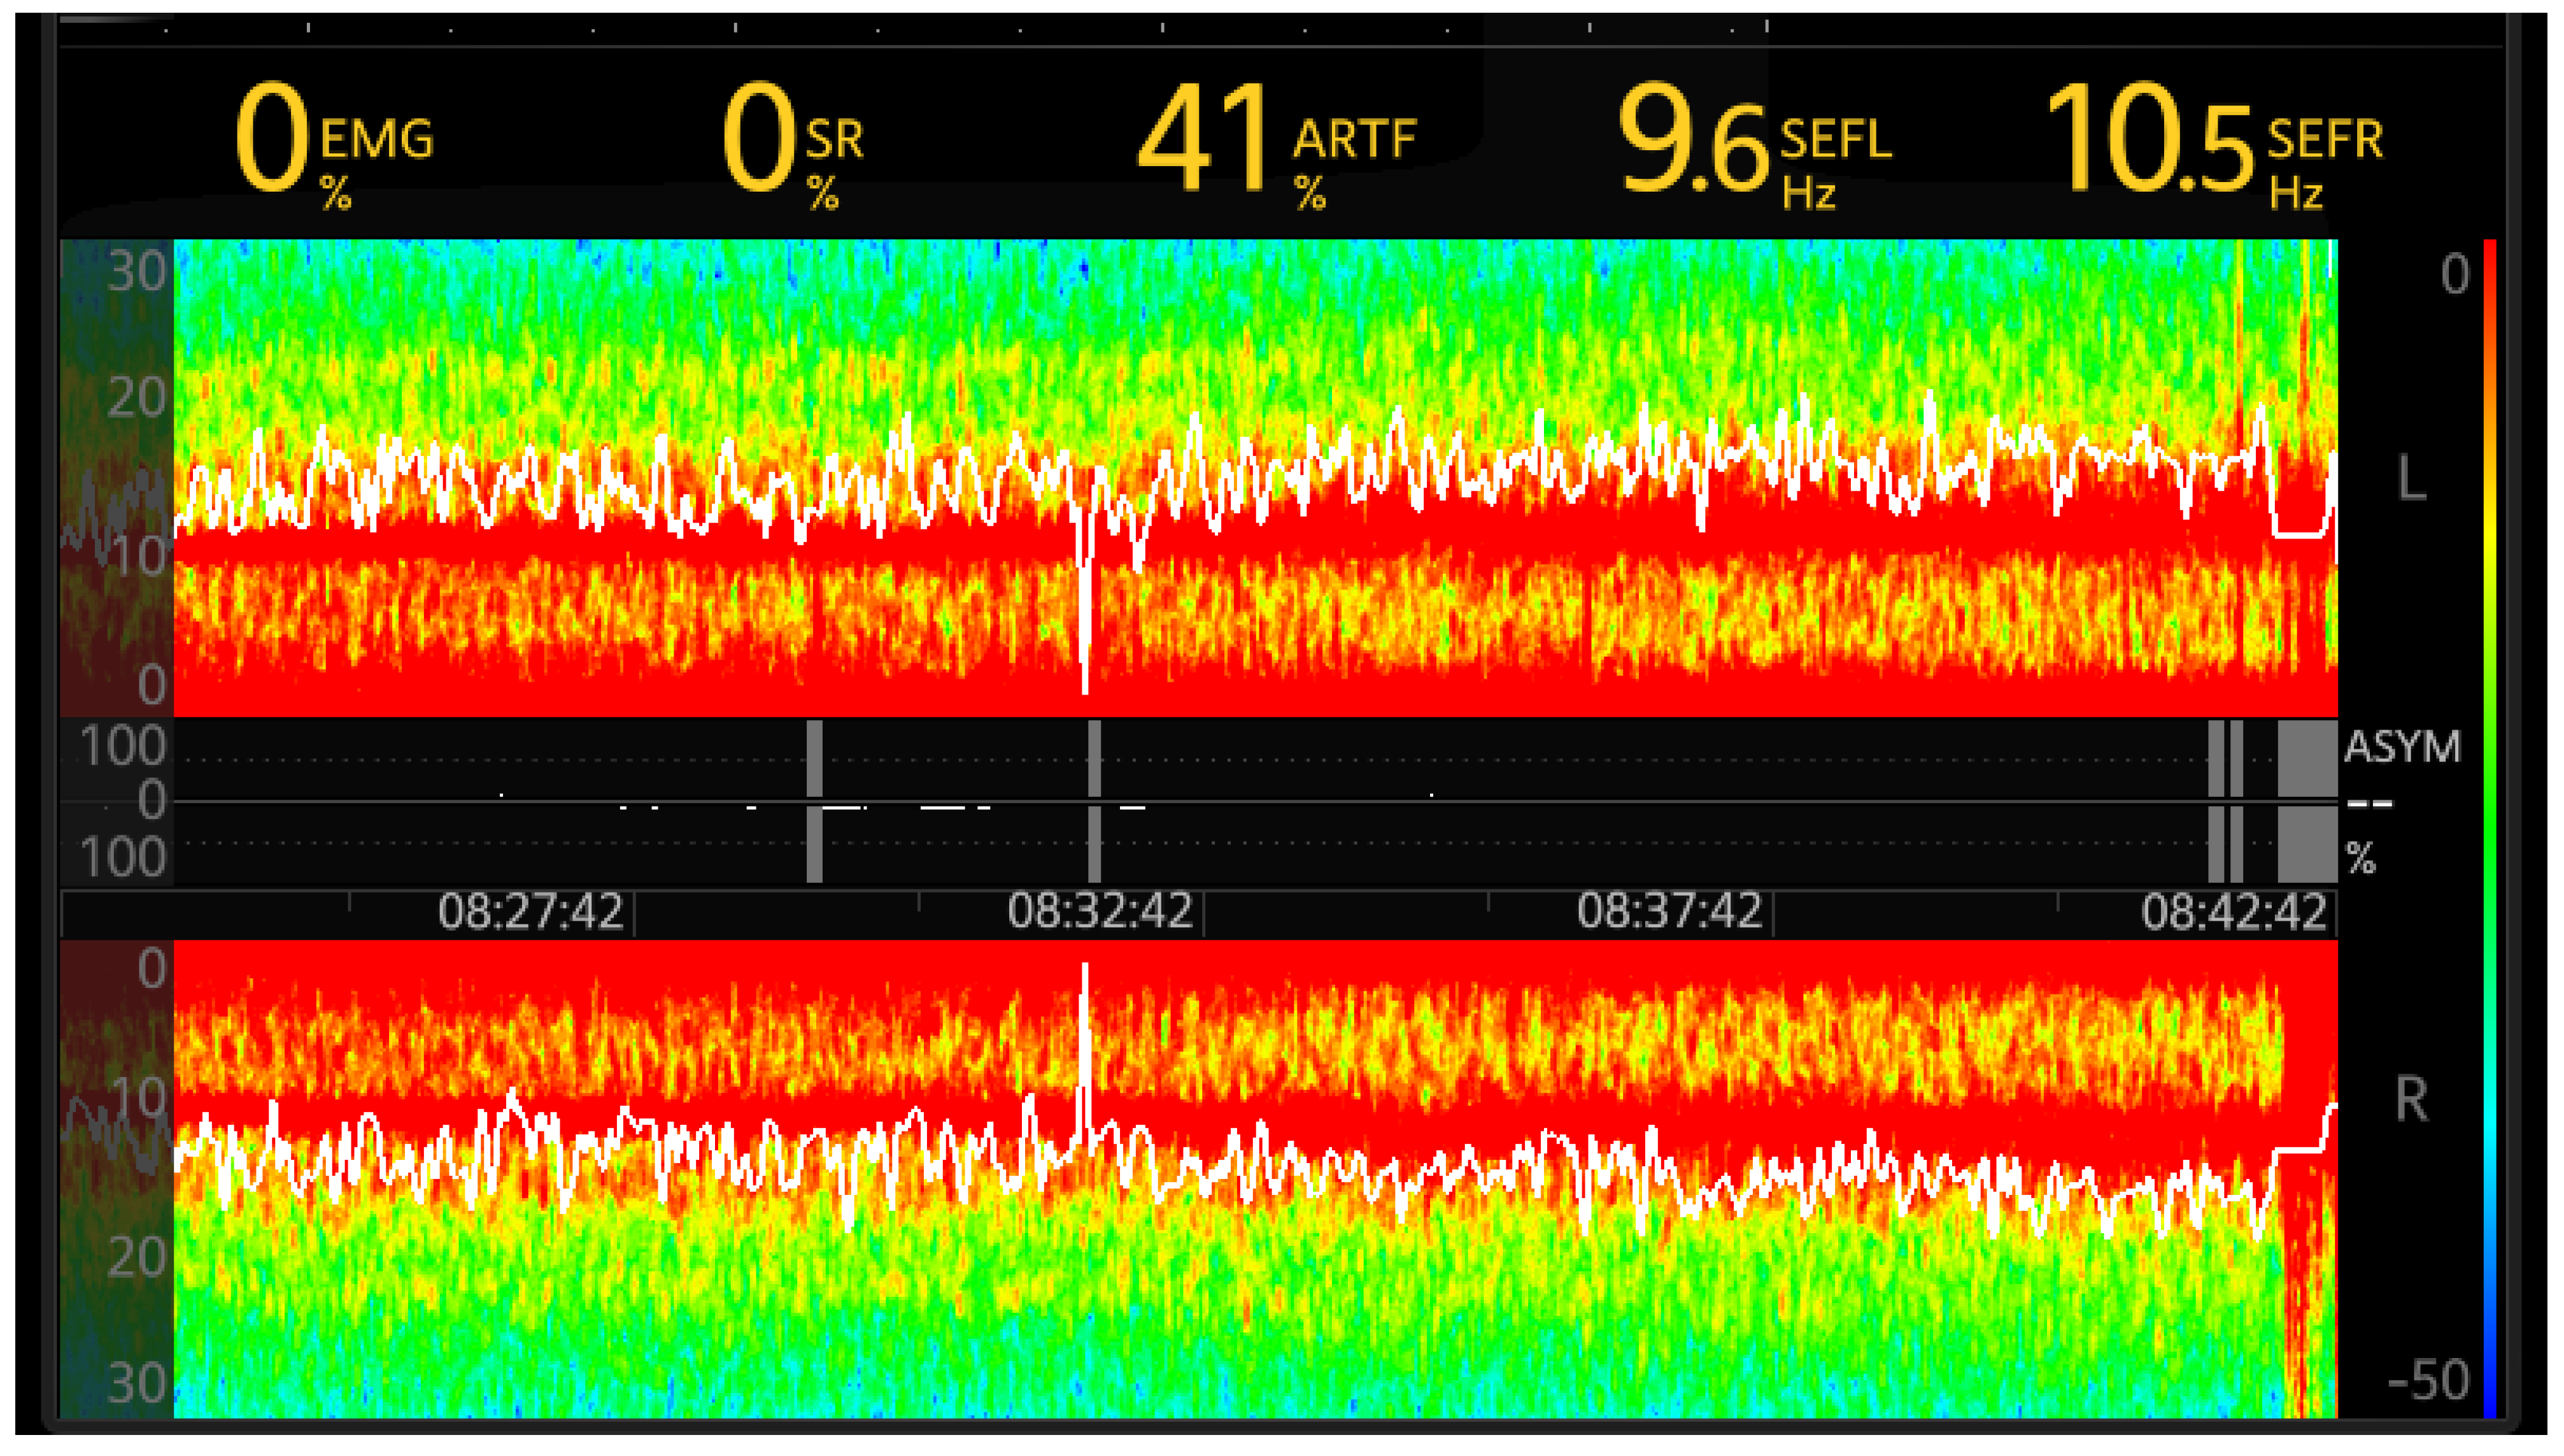
Figure 2.
A: DSA pattern of Sevoflurane and Remifentanil.
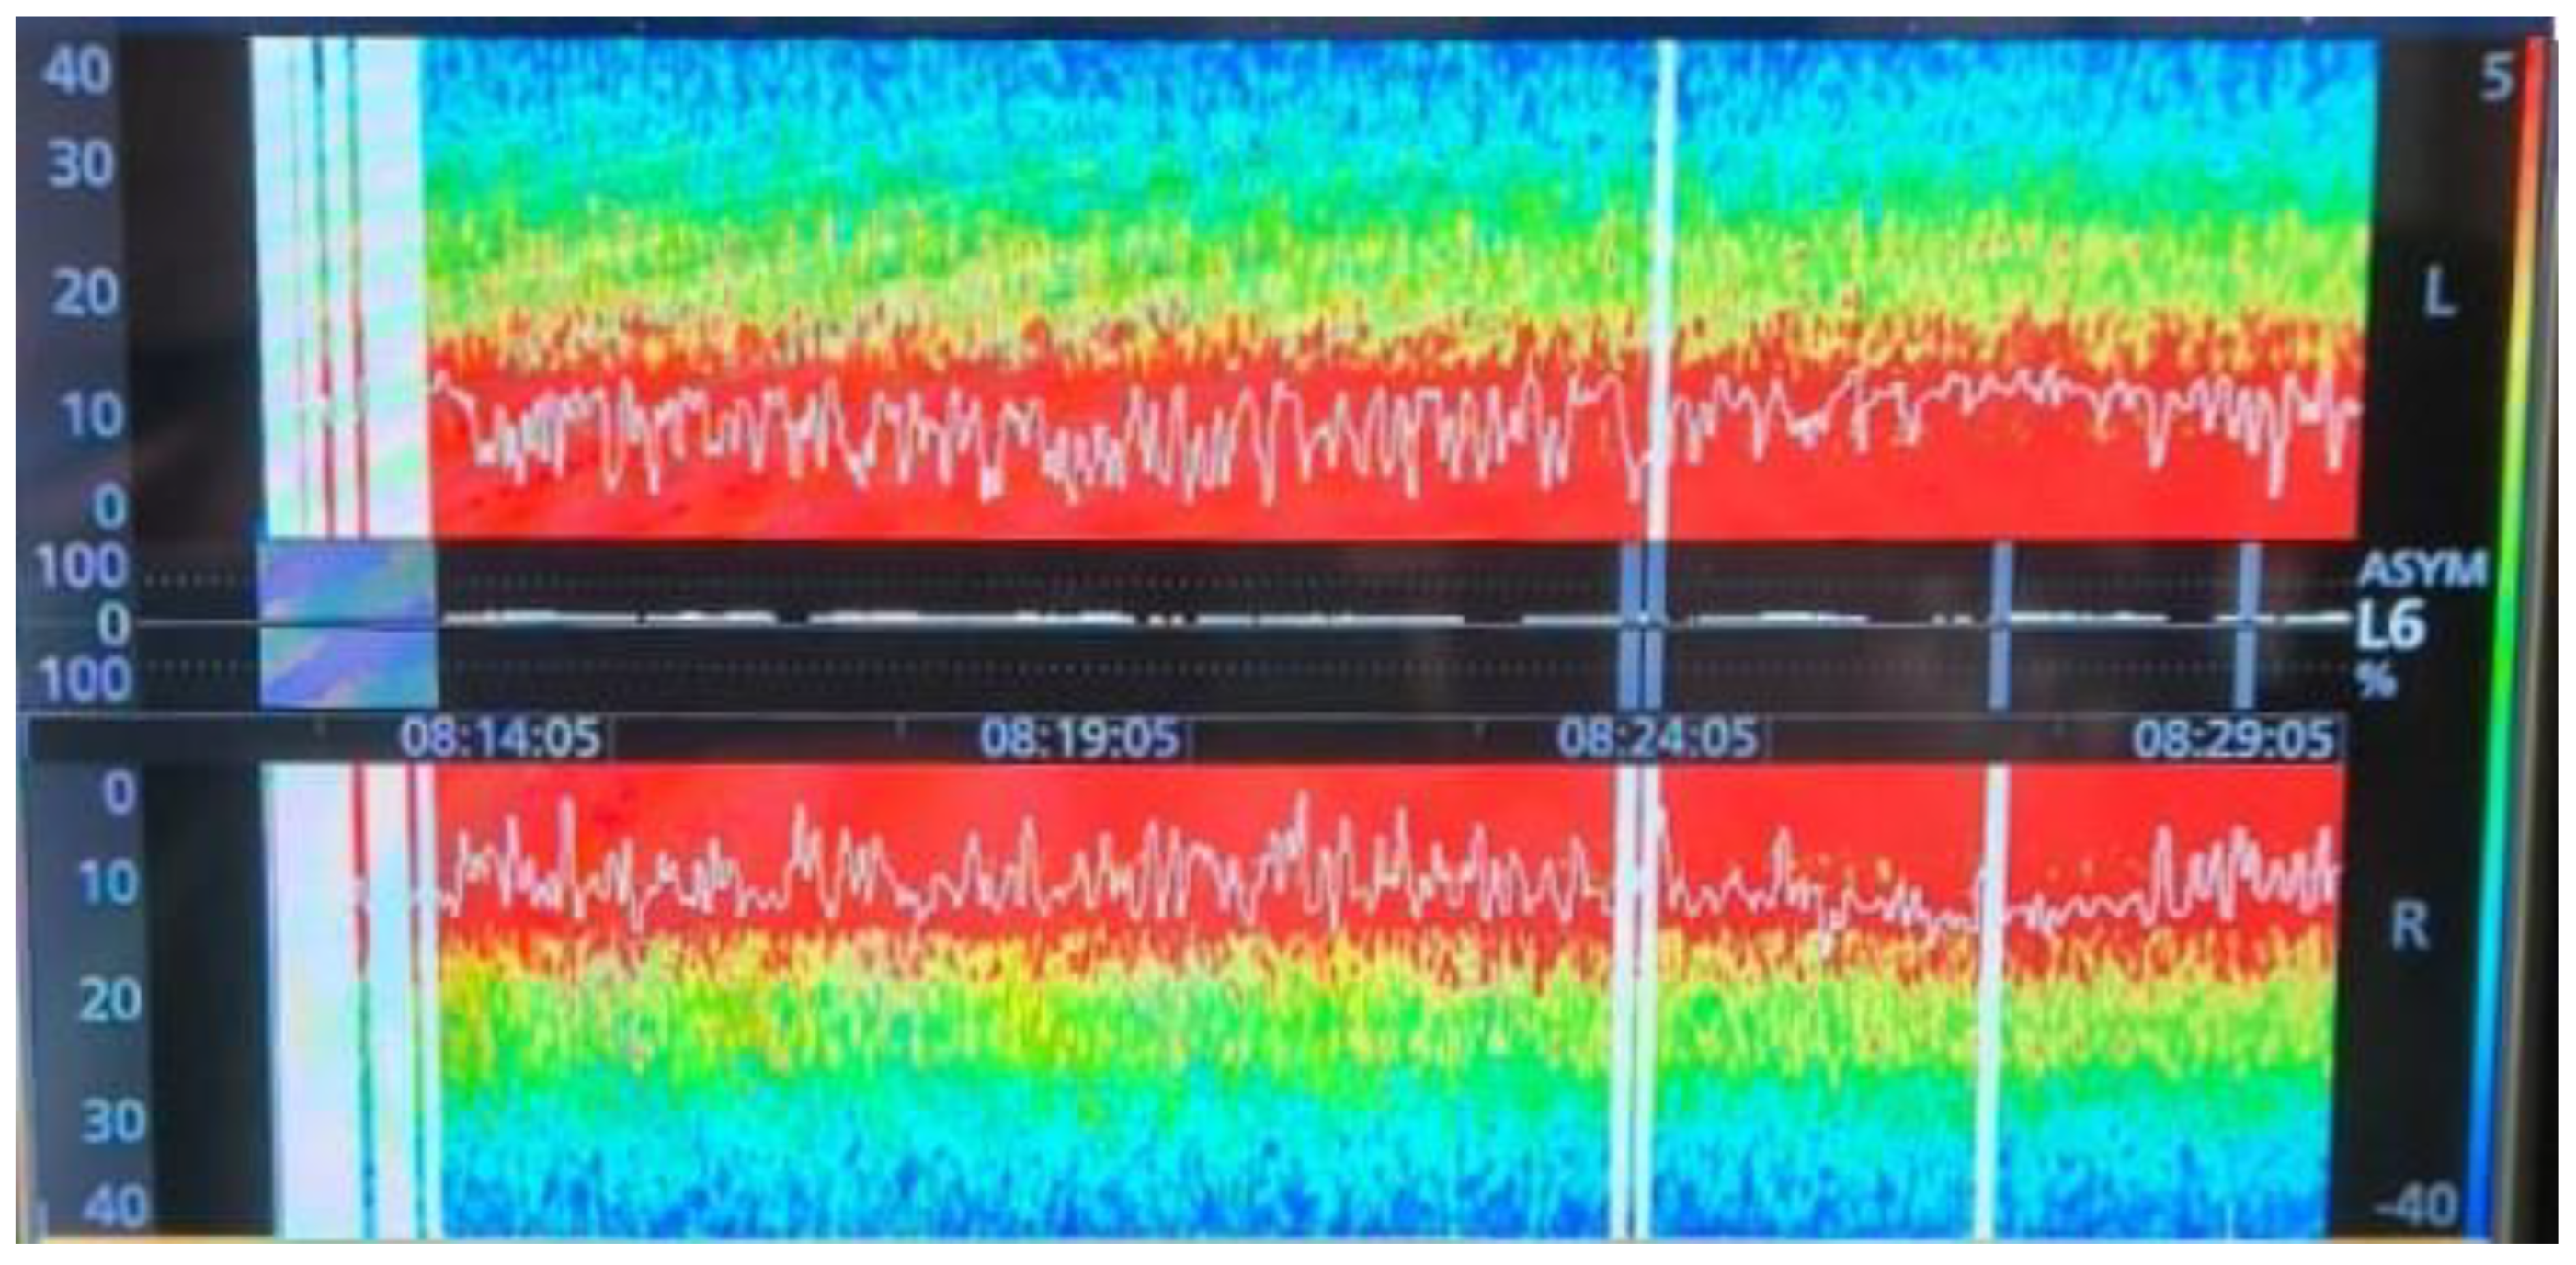
Figure 3.
A: DSA pattern of 1mg bolus dose of Ketamine followed by Sevoflurane 0.6 MAC.
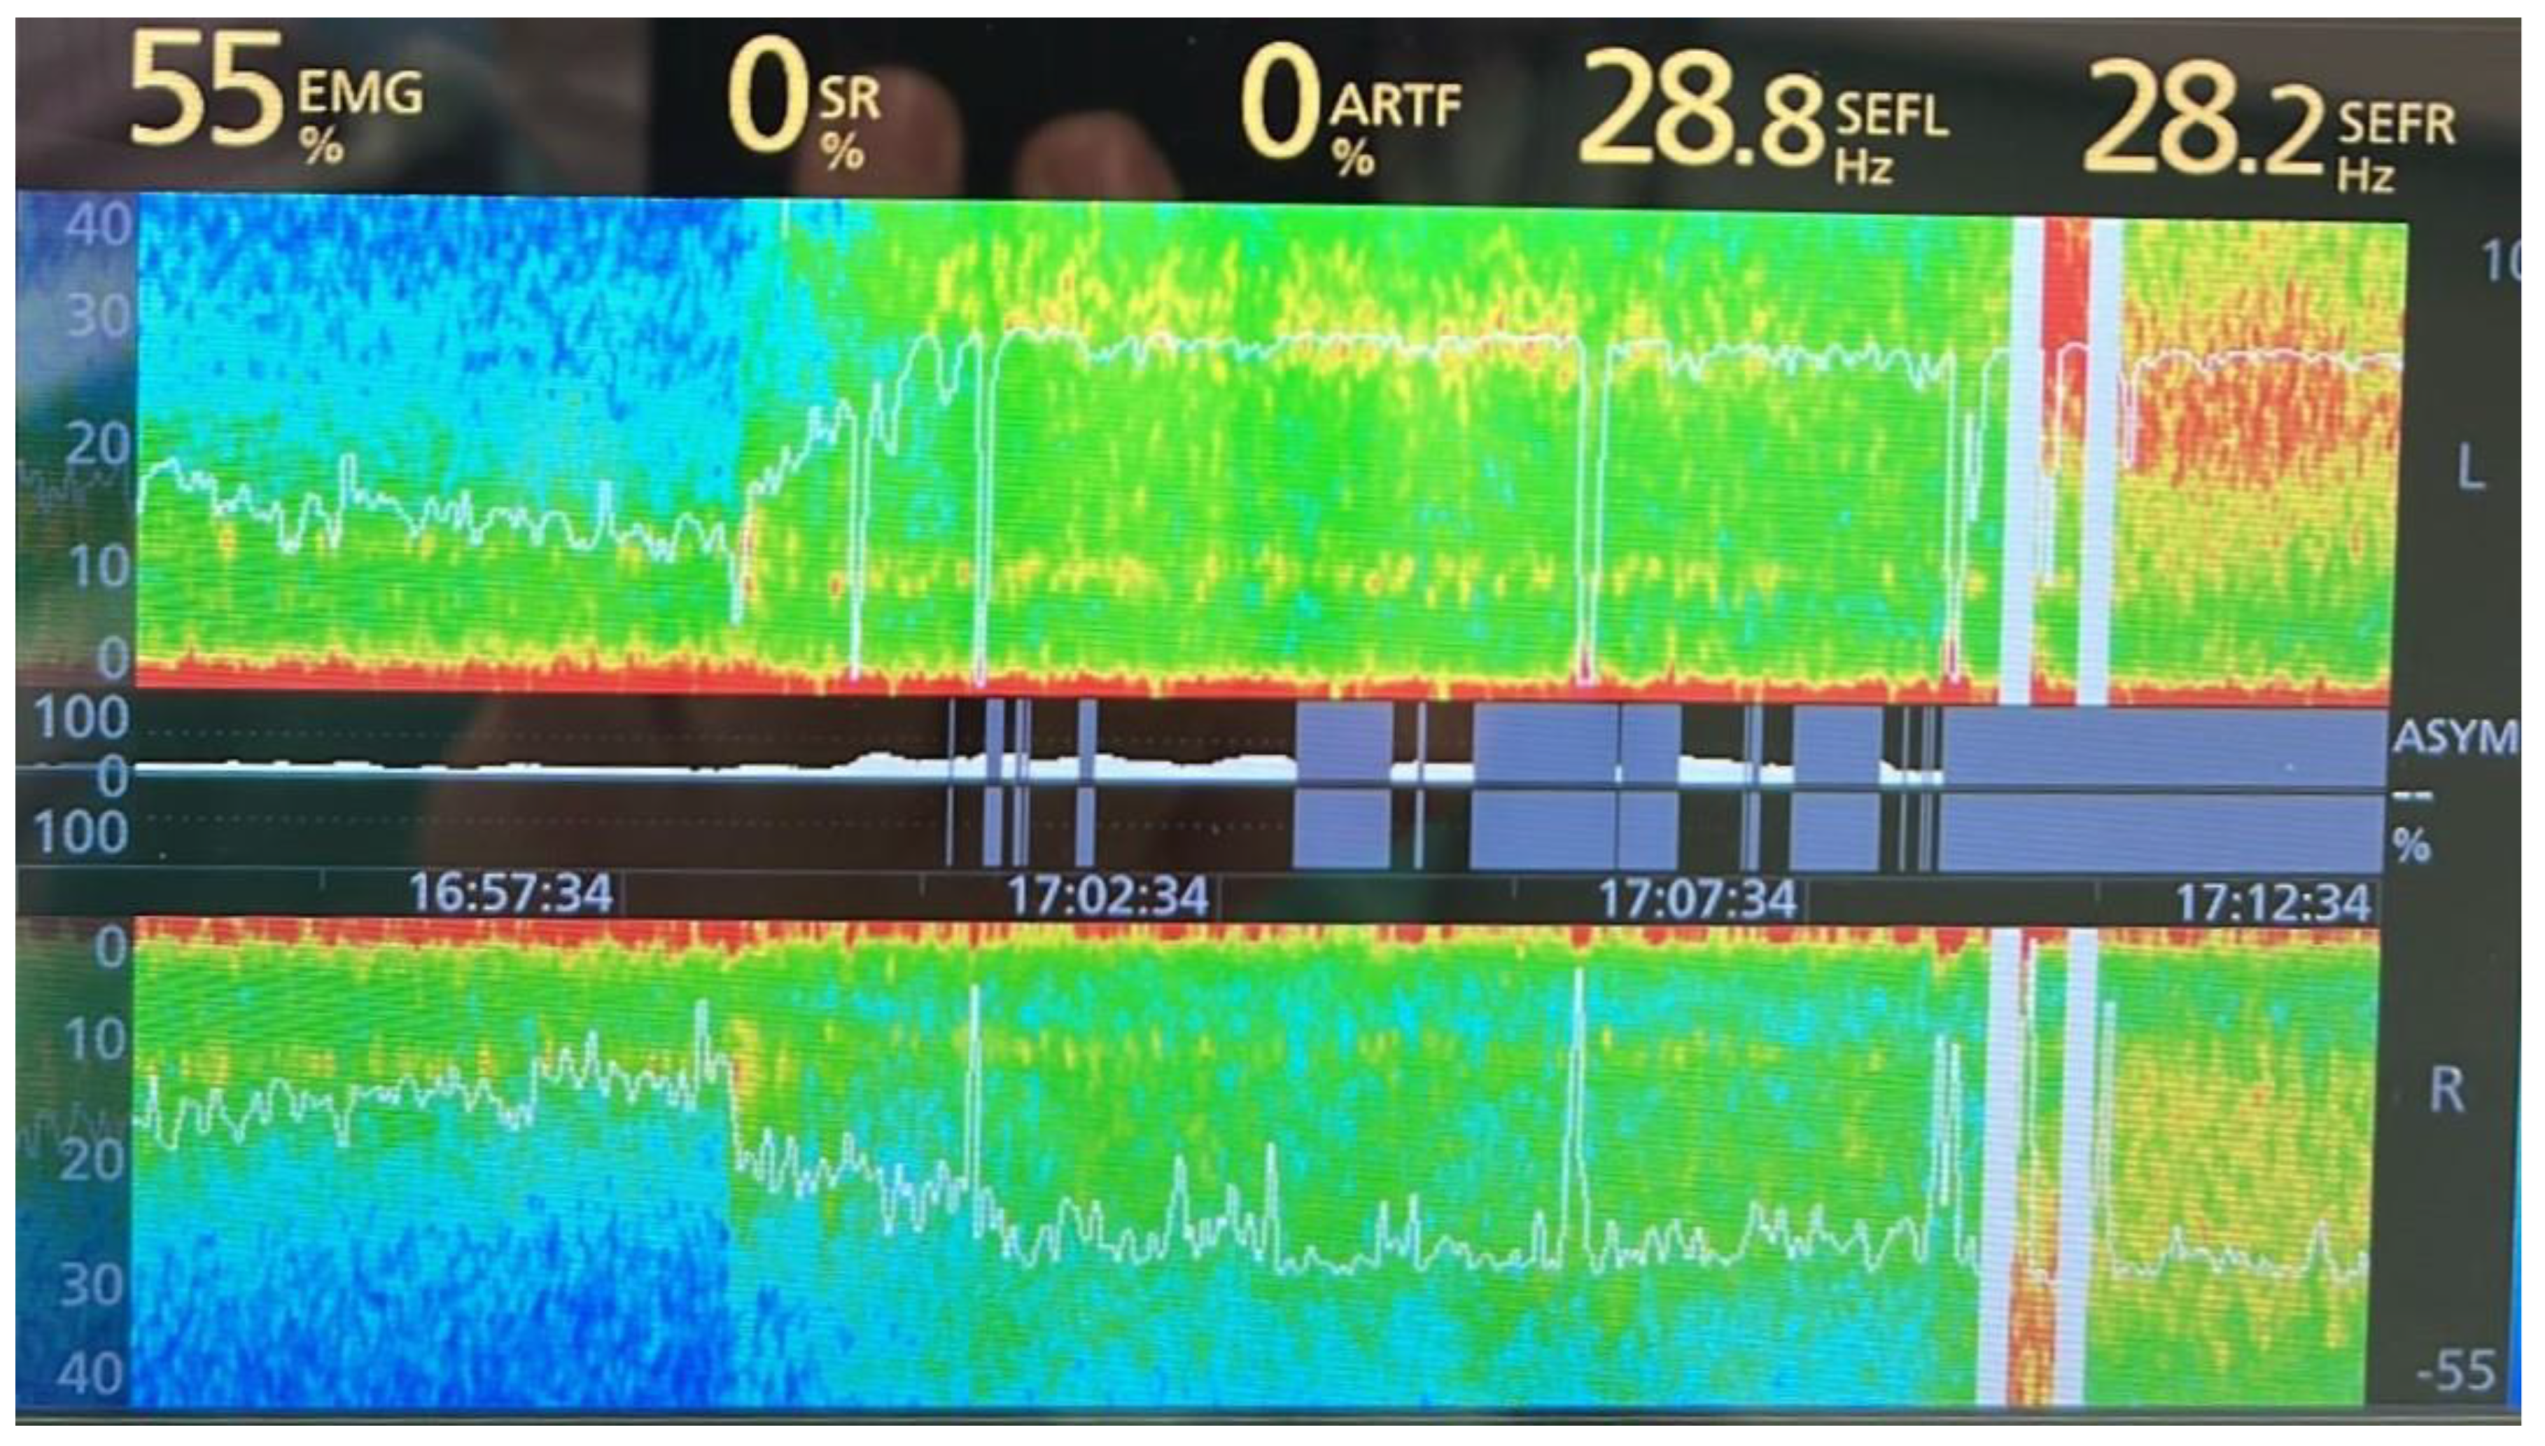
Figure 4.
PRISMA 2020 flow diagram.
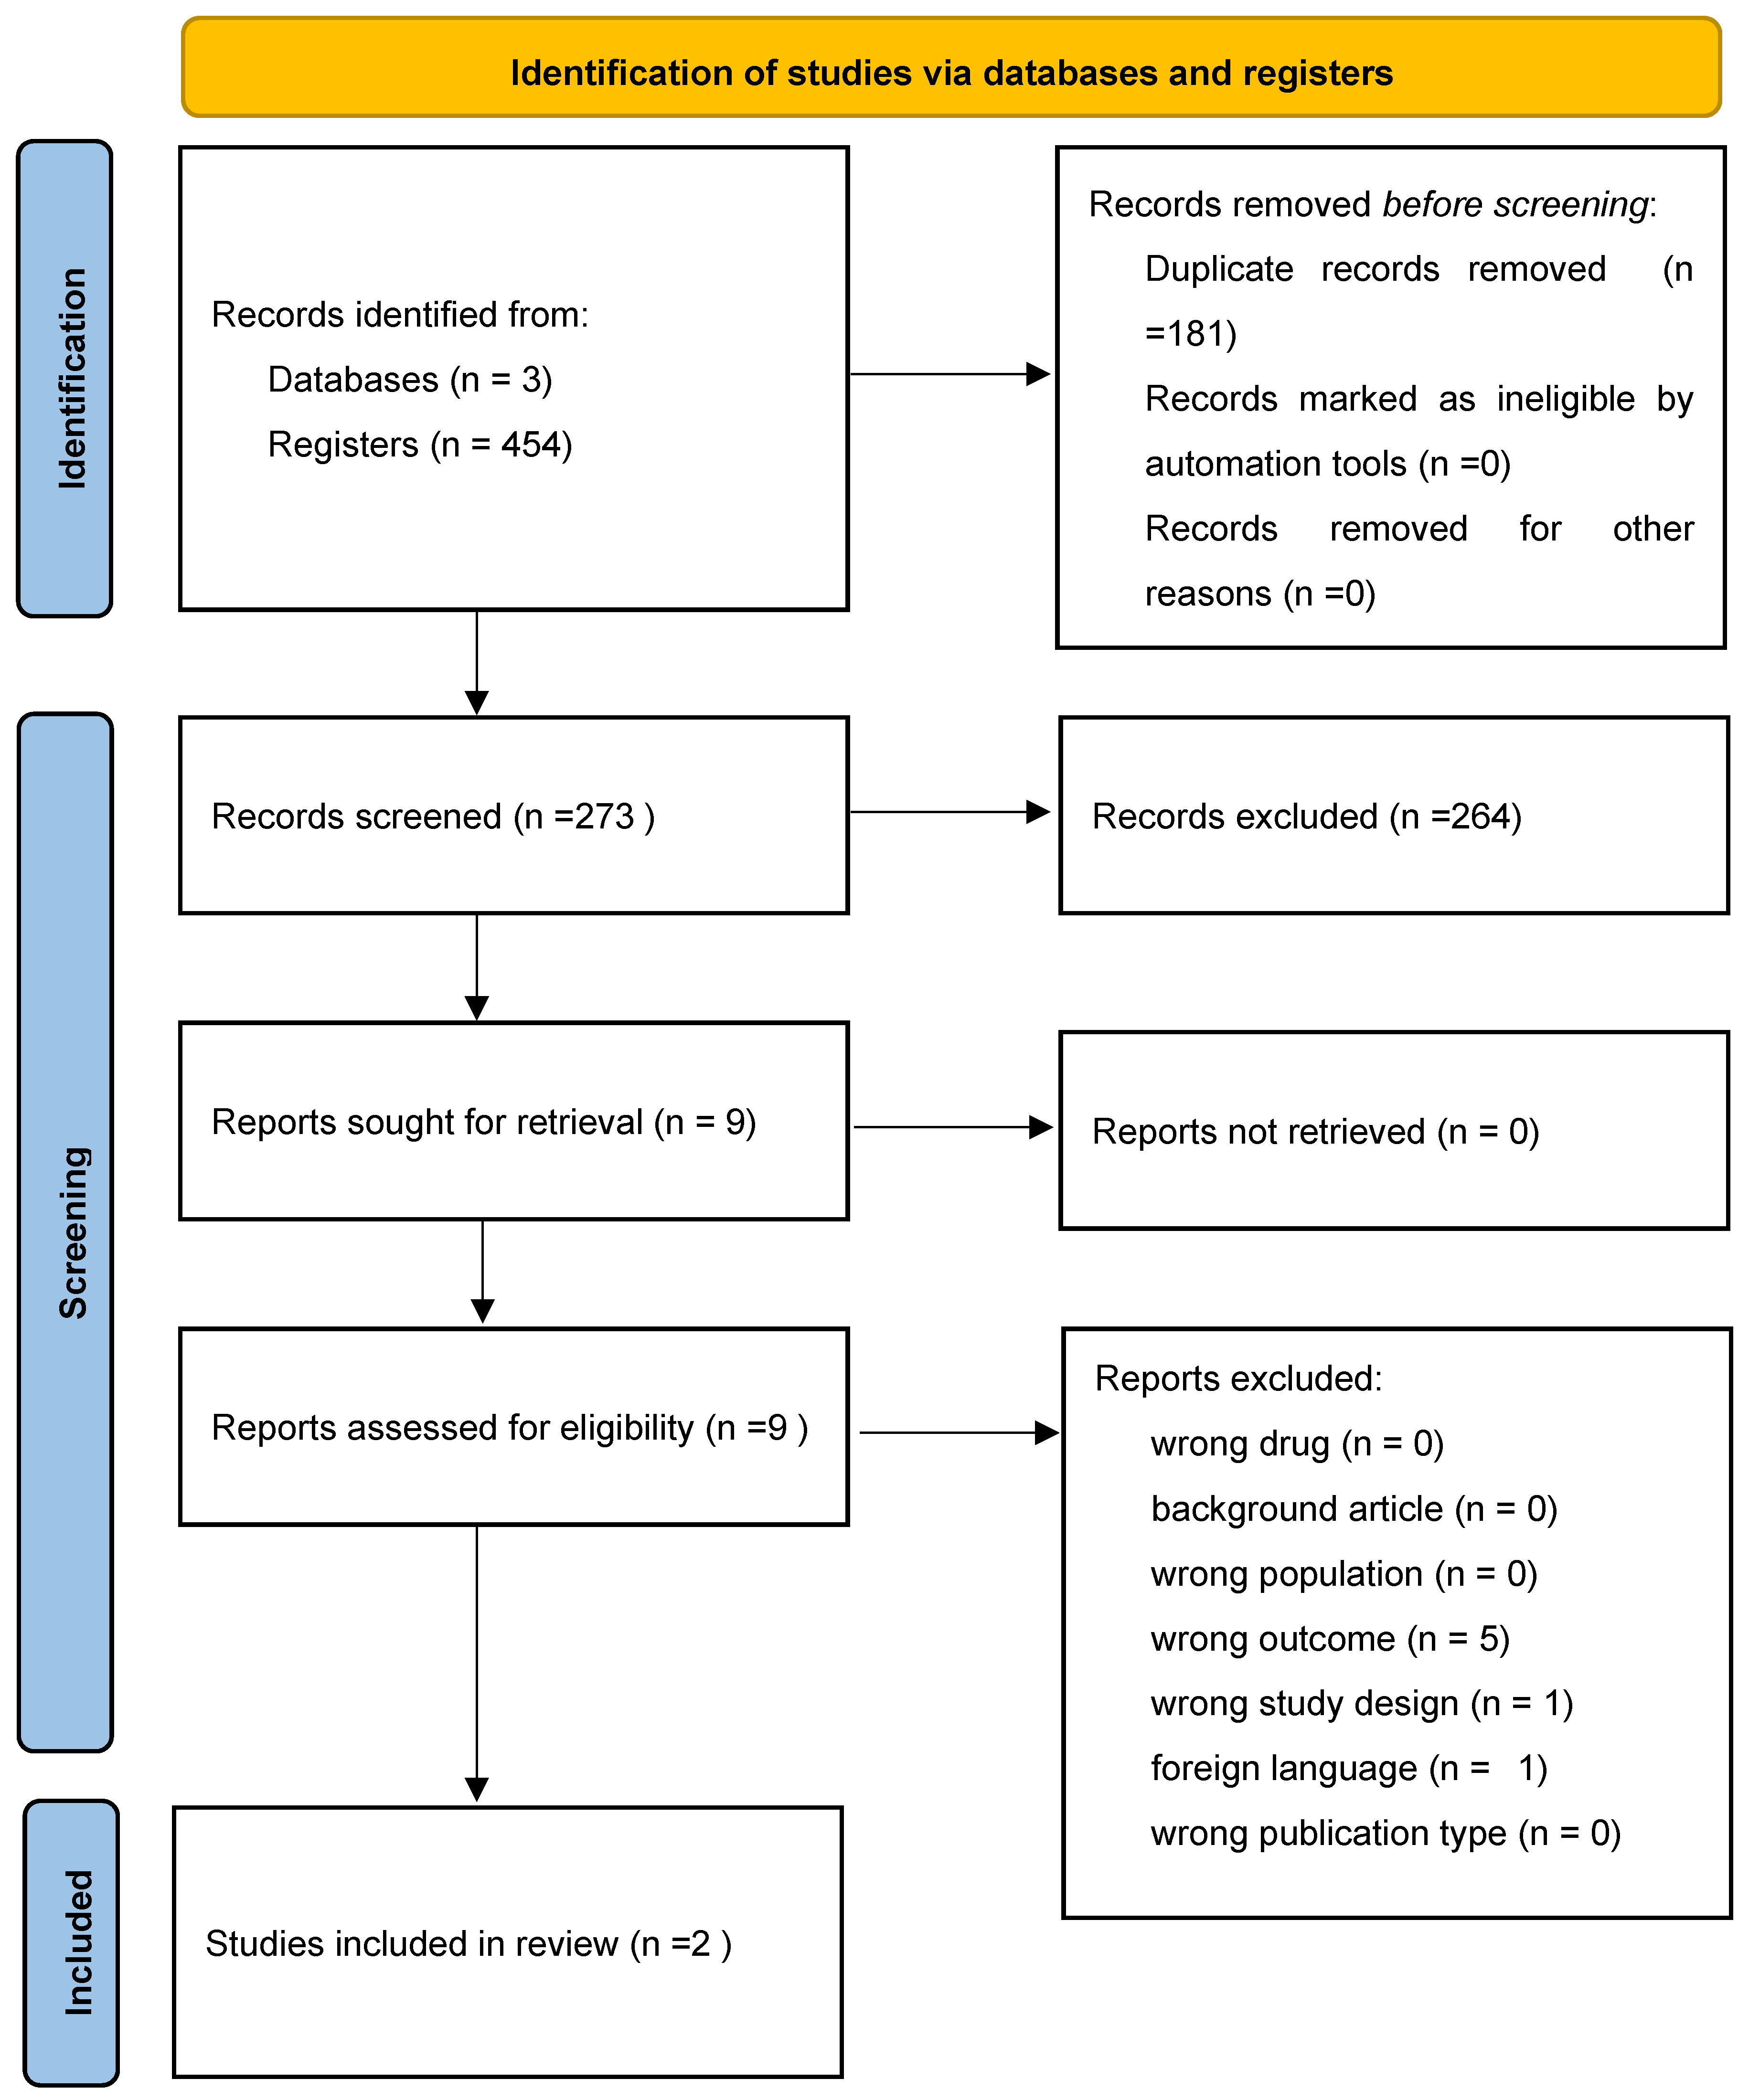

Table 1.
summary of the included trials. Values are reported as mean ± SD or median (interquartile range) when available. TCI: target-controlled infusion; CeP: propofol effect-site concentration; CeR: remifentanil effect-site concentration; BIS: bispectral index; SEF: spectral edge frequency; SPI: surgical pleth index; DSA: density spectral array.
Table 1.
summary of the included trials. Values are reported as mean ± SD or median (interquartile range) when available. TCI: target-controlled infusion; CeP: propofol effect-site concentration; CeR: remifentanil effect-site concentration; BIS: bispectral index; SEF: spectral edge frequency; SPI: surgical pleth index; DSA: density spectral array.
| Study | Design | Population | Anesthesia Protocol | Ketamine Protocol | Outcomes | Main Findings | Limitations |
|---|---|---|---|---|---|---|---|
| Linassi et al. [20], 2025 | Prospective single- center, Observational study | 14 adult females undergoing breast cancer surgery | Propofol TCI (Eleveld model; median effect-site CeP 2.75 µg/mL [1.92–3.48]); Remifentanil TCI (Minto model; median effect-site CeR 3 ng/mL [3,3]) | Single ketamine bolus targeting effect-site concentration CeK 1 µg/mL (Domino model; median dose 0.57 mg/kg) | BIS and SEF95 showed CeK-dependent biphasic changes; SPI unchanged. | Peak BIS/SEF95 occurred at lower CeK (0.2–0.5 µg/mL) several minutes post-bolus; clinical BIS may be misleading | No control; female only; no ketamine plasma levels measured; DSA was generated and analyzed but not included in the outcomes |
| Araujo et al. [21], 2017 | Prospective, single-blind randomized controlled study | 39 adults undergoing elective spine surgery | Propofol at 200 mL/h until LOC via TCI; Remifentanil TCI at effect-site CeR 3 ng/mL; Rocuronium 0.6 mg/kg | Randomized ketamine boluses: 0.2, 0.5, or 1 mg/kg | BIS, SEF, and DSA recorded during 9 min baseline and 9 min post-ketamine; ketamine increased both BIS and SEF dose-dependently | Dose-related increases in BIS and SEF; DSA showed shift toward higher frequency power; BIS/SEF increase not reflecting lighter hypnosis | Single-blind; no surgical stimulus during observation; age differences between groups |
Table 2.
ROBINS-I Risk of Bias Assessment for Linassi et al. [20].
Table 2.
ROBINS-I Risk of Bias Assessment for Linassi et al. [20].
| Domain | Judgment |
|---|---|
| D1—Confounding | 🔴 Serious |
| D2—Selection of participants | 🔴 Serious |
| D3—Classification of interventions | 🟡 Moderate |
| D4—Deviations from intended interventions | 🟢 Low |
| D5—Missing outcome data | 🟢 Low |
| D6—Measurement of outcomes | 🟡 Moderate |
| D7—Selection of reported result | 🟡 Low–Moderate |
| Overall | 🔴 Serious |
Table 3.
RoB2 for Aroujo et al.
| Domain | Judgment |
|---|---|
| D1—Randomization | 🟡 Some Concerns araujo.pdf |
| D2—Deviations | 🟢 Low |
| D3—Missing data | 🟢 Low |
| D4—Outcome measurement | 🟡 Some Concerns araujo.pdf |
| D5—Reported result | 🟡 Some Concerns araujo.pdf |
| Overall | 🟡 Some Concerns |
Disclaimer/Publisher’s Note: The statements, opinions and data contained in all publications are solely those of the individual author(s) and contributor(s) and not of MDPI and/or the editor(s). MDPI and/or the editor(s) disclaim responsibility for any injury to people or property resulting from any ideas, methods, instructions or products referred to in the content. |
© 2026 by the authors. Licensee MDPI, Basel, Switzerland. This article is an open access article distributed under the terms and conditions of the Creative Commons Attribution (CC BY) license (http://creativecommons.org/licenses/by/4.0/).
Copyright: This open access article is published under a Creative Commons CC BY 4.0 license, which permit the free download, distribution, and reuse, provided that the author and preprint are cited in any reuse.


