

Submitted:
22 June 2026
Posted:
23 June 2026
You are already at the latest version
Abstract
Context and objectives: Lung ultrasound (LUS) is a safe low-cost tool that enables diagnosis, monitoring and guidance for interventional procedures at the patient's bedside. However, its expansion is hindered by a lack of training programs and the inherent difficulty of interpreting ultrasound images. In this context, Artificial Intelligence (AI) is emerging as a supportive tool for LUS interpretation, ensuring diagnostic efficacy and mitigating the shortage of experts. This systematic review aims to summarize and analyse recent advances in AI-based tools to support LUS interpretation. Methods: A systematic literature search was conducted across Web of Science, IEEE Xplore, and PubMed databases to identify peer-reviewed original journal articles published between 2015 and November 2025 that employed AI for the identification and localization of lung artifacts, anatomical structures, and pathological findings. Results: Twenty-four studies were included, identifying three main strategies: segmentation (10 studies), object detection (4 studies), and the generation of visual explanations through saliency maps (10 studies). All employed CNN-based architectures. The evaluation metrics used were heterogeneous. Conclusions: The development of AI systems to support LUS interpretation shows high potential; however, current studies exhibit significant heterogeneity in their objectives, methodologies, and evaluation metrics. It is necessary to move towards solutions designed for specific clinical environments and to adopt standardized protocols and evaluations that facilitate their implementation in clinical practice.
Keywords:
lung ultrasound
; artificial intelligence
; deep learning
; segmentation
; object detection
; saliency maps
1. Introduction
In recent years, ultrasound has emerged as an essential tool for diagnosing respiratory pathologies, guiding interventional procedures, and monitoring therapeutic response [1]. Unlike chest radiography or computed tomography (CT), lung ultrasound (LUS) enables rapid and safe bedside assessment using low-cost portable devices [2,3]. Although its use initially stood out in specific specialized fields such as radiology or emergency medicine, its application in pulmonology is no longer merely anecdotal [4,5].
LUS interpretation is based on the identification of anatomical findings and pulmonary artifacts. The latter arise from the difference in acoustic impedance between the pleura (tissue) and the lung (air/fluid) [6]. Under normal conditions, an air-filled lung generates reverberation artifacts at the pleural line, resulting in horizontal hyperechoic artifacts known as A-lines [6,7,8,9]. Likewise, the movement between the visceral and parietal pleura results in lung sliding, producing a “seashore sign” visible on M-mode imaging [8,9]. On the contrary, the absence of lung sliding generates a “barcode sign” [6,8,10,11]. Moreover, various pathological conditions lead to reduced lung aeration, which appears on ultrasound images as vertical hyperechoic artifacts known as B-lines. The presence of three or more B-lines is considered clinically relevant and may indicate conditions such as interstitial disease or pneumonia [12]. Further loss in air content leads to the appearance of pulmonary consolidations [11], characterized by hypoechoic tissue areas and punctate hyperechoic images [10,13], suggesting the presence of pneumonia and other conditions such as bronchoalveolar carcinoma [14]. Finally, the presence of pleural effusions (PE) is characterized by the appearance of an anechoic or hyperechoic layer in between pleural layers [15].
Despite its great utility, LUS expansion in pulmonology faces certain challenges. Ramos-Hernández et al. [16] conclude that, although 91.3% of pulmonologists use LUS for the identification and assessment of PE, its use in other applications remains limited due to the lack of specific and formal training, with only 5.7% of professionals considered experts [16]. Likewise, the inherent difficulty in interpreting ultrasound images, whose quality is influenced by the operator’s experience, patient’s anatomy, and equipment settings, results in a labour-intensive procedure with high interobserver variability.
In this context, artificial intelligence (AI)-based tools can help mitigate the impact of these barriers and ensure the use of LUS in pulmonology. Deep learning (DL) models, specifically convolutional neural networks (CNNs), have demonstrated remarkable success in the analysis of ultrasound images [17]. Although general reviews exist [18,19,20,21,22], no systematic review has focused on AI tools supporting LUS interpretation.
This systematic review aims to summarize and analyse recent advances in AI-based tools for the identification and localization of pulmonary artifacts, anatomical structures and pathological findings to support LUS interpretation, identify key trends and limitations, highlight gaps in the literature and propose a framework for the development of new tools to facilitate their implementation in clinical practice.
2. Materials and Methods
2.1. Study design
A systematic review of the literature was conducted with the aim of providing a summary of the use of AI-based tools for the detection and localization of pulmonary artifacts, anatomical structures and pathological findings in LUS. Additionally, trends and limitations in the literature were identified to provide a framework that encourages future research in this field.
This study was conducted following the Preferred Reporting Items for Systematic Reviews and Meta-Analyses (PRISMA) [23] guidelines. The protocol is available at PROSPERO with Record ID CRD420261322517.
2.2. Inclusion and exclusion criteria
Peer-reviewed journal articles published between 2015 and 2025 in English or Spanish, with full text available, were included. Studies were required to describe the development of AI tools for the detection and localization of pulmonary artifacts, anatomical structures, or pathological findings in images or videos of LUS scans performed on humans.
Studies that did not explicitly apply AI techniques or did not detail the development and architecture of the tool were excluded. Additionally, studies limited solely to classification or quantification tasks, those that did not specify the type of artifact identified, or those using data from paediatric patients, animals, or synthetic sources were also excluded.
2.3. Search Strategy
A comprehensive search was conducted in Web of Science, PubMed, and IEEE Xplore databases to identify articles using AI for the detection and localization of pulmonary artifacts, anatomical structures, and pathological findings to support LUS interpretation. The search strategy employed the following keywords: (“Artificial Intelligence” OR “Machine Learning” OR “Deep Learning” OR “Neural Networks” OR “Automated Analysis” OR “Automated Detection” OR “Intelligent System”) AND (“Lung Ultrasound” OR “Pulmonary Ultrasound” OR “Lung Ultrasonography” OR “Chest Ultrasound” OR “Thoracic Ultrasound”) AND (“B-Lines” OR “A-Lines” OR “Lung Sliding” OR “Pleural Line” OR “Pleural Artifacts” OR “Ultrasound Artifacts” OR “Pleural Effusion”). The search was limited to articles published between January 2015 and November 25, 2025.
After manually removing duplicates, study selection was carried out in two stages: first, by screening titles and abstracts, and subsequently, by reviewing the full text. This process was conducted by two independent reviewers (J.L.-C. and M.C.-G.). In case of disagreement, a third reviewer (A.F.-V.) was consulted.
2.4. Synthesis of the Results
Data extracted from the studies were organized into four summary tables highlighting key methodological features and main results. The aspects analysed included study location, data origin and source, sample size, and equipment and probes used. Additionally, information on the AI model employed, input data, identified elements, validation strategy, and the most representative performance evaluation metrics according to the type of study were reported. These metrics included the Dice Similarity Coefficient (DSC), the Jaccard Index or Intersection over Union (IoU), mean Average Precision (mAP), sensitivity (recall), specificity, precision, and the area under the ROC curve (AUC).
Given the obtained results, conducting a meta-analysis was not possible due to the heterogeneity among the included studies in terms of data, methodologies, identified artifacts, and model evaluation metrics.
3. Results
3.1. Study selection
A total of 278 articles were identified (112 in Web of Science, 87 in IEEE Xplore, and 78 in PubMed), in addition to one article identified manually. After removing duplicates, 194 articles remained.
3.2. Characteristics of the included studies
The included studies, whose main descriptive characteristics are shown in Table 1, were published between 2020 and 2025, covering a wide geographic distribution. The common objective of these studies was the development of intelligent support systems for LUS interpretation, based on the detection and localization of pulmonary artifacts, anatomical structures, and pathological findings.
There is substantial variability in the data used across studies. Among the 21 studies that reported participant numbers, sample sizes ranged from 10 to 3,966 patients. Also, cohort characteristics were heterogenous, with COVID-19 being the most prevalent condition [24,25,26,27,28,29,30].
Common clinical settings were the emergency department (ED) (4 studies [31,32,33,34]), intensive care unit (ICU) (4 studies [30,32,33,34]), and internal medicine (3 studies [32,33,35]). Other settings included thoracic surgery [36,37], nephrology [38], and general hospital settings.
A marked heterogeneity was observed in sample handling: some studies extracted frames from LUS videos, while others worked directly with LUS images. In terms of origin, 14 studies used single-centre data and 10 were multicentre.
The recurrent use of shared databases was identified. Researchers used data from Puerta de Hierro University Hospital (Spain) in 3 studies [26,29,39]. Similarly, Wuhan Huoshenshan Hospital (China) also provided data for 3 studies [27,28,30]. Other collaborations included Shanghai Pulmonary Hospital [40,41], Jessenius Faculty of Medicine in Slovakia [36,37], and two Canadian tertiary hospitals [32,33].
Regarding the equipment, most studies used a single ultrasound device; however, some studies utilized data from up to four different devices. The type of probe was specified in 21 studies, ranging from convex, linear, to phased array probes, with 9 studies using multiple probe types.
3.3. Main results
Three approaches were identified for AI-assisted identification and localization of pulmonary artifacts, anatomical structures, and pathological findings: image segmentation [24,25,26,27,31,35,36,38,44,46], object detection [28,29,39,49], and saliency maps [30,32,33,34,37,40,41,50,51,52]. The results for each category are summarized below.
3.3.1. Image segmentation studies
This category comprises 10 articles [24,25,26,27,31,35,36,38,44,46], summarized in Table 2. All studies employed CNNs, with U-Net [53] predominating in 7 studies [24,26,31,35,36,44,46]. This architecture, originally developed for biomedical applications but now widely adopted across multiple domains, employs a symmetric encoder–decoder structure that enables effective feature extraction and precise localization for semantic segmentation.
Two studies [36,46] opted for the conventional architecture, while others employed optimized variants. Howell et al. [24] implemented a lightweight U-Net with fewer filters, LeakyReLU activations, and bilinear upsampling for faster processing. Meanwhile, Muñoz et al. [44] employed Attention U-Net [54], integrating attention gates to focus on target structures, thereby optimizing sensitivity and precision.
Other innovations in this field include the use of Vision Transformers (ViT). Abbasi et al. [26] designed TransBound-UNet, a lightweight version of the TransUNet [55] architecture. Similarly, Lucassen et al. [31] employed EfficientNet-18 in the encoder, while Vukovic et al. [35] combined U-Net with a Spatial Transformer Network (STN) to optimize segmentation by mapping regions of interest.
Additional innovations include the use of the DeepLabV3++ architecture [56] by Frank et al. [25], aimed at addressing the loss of spatial resolution through atrous convolutions, and the implementation of hybrid models such as Mask R-CNN and YOLACT by Tan et al. [38] to achieve real time instance segmentation. Finally, Xing et al. [27] developed a three-level cascaded encoder–decoder architecture.
Eight studies employed grayscale B-mode images as input [24,26,31,35,36,38,44,46]. A notable exception is the work by Frank et al. [25], who used a three-channel input enriched with vertical artifact masks and pleural distance maps. Additionally, Xing et al. [27] preprocessed the images by extracting a region of interest (ROI) using a Faster R-CNN [57] prior to segmentation.
Studies applied both binary and multiclass approaches. Among the latter, highly complex models are presented, such as that of Howell et al. [24], where up to six different classes were identified, distinguishing background, ribs, pleural line, pulmonary consolidation, and simple and complex PE. Meanwhile, Frank et al. [25] proposed a four-level categorization differentiating background, continuous pleural line with A-lines, pleural alterations with few vertical artifacts, and two severity levels for the presence of B-lines and consolidations (minor and major). Finally, Abbasi et al. [26] focused on multiclass segmentation of pulmonary artifacts, distinguishing A-lines, B-lines, and background.
On the other hand, binary approaches either used multiple independent segmentation models or targeted a single landmark or artifact. In the latter, pleural line segmentation stands out, addressed in two studies [27,46].
Finally, the validation strategies exhibited considerable heterogeneity. Six studies [25,27,31,35,38,44] ensured patient-level splits to avoid bias. Also, 5-fold cross-validation was the most used split strategy [26,27,31,35]. Performance was mainly assessed using the DSC and the IoU index. The DSC was reported in seven studies [24,25,26,27,35,44,46] with values ranging from 0.2 to 0.99, while IoU ranged from 0.61 to 0.98 in four studies [26,36,44,46].
3.3.2. Object detection studies
This group includes 4 articles [28,29,39,49], summarized in Table 3, that implement object detection strategies to support LUS interpretation. All approaches are based on CNNs, with two dominant architectures: single-stage networks and region-based networks (R-CNNs).
Within single-stage architectures, YOLO (You Only Look Once) [58] networks were used in 2 studies [29,39]. These networks treat object detection as a single regression problem, enabling the simultaneous prediction of bounding boxes and class probabilities through global image processing. This makes them highly efficient, facilitating their integration into applications requiring real-time processing. Regarding the variants used, Bottino et al. [49] employed a pretrained CSPDarkNet53 as the backbone, while Joseph et al. [29] used YOLOv5s [59], an optimized version to improve speed and accuracy.
As an alternative, the use of R-CNNs [60] was identified. This approach operates in two stages: the identification of ROIs and their subsequent classification using CNNs. Specifically, Xing et al. [28] implemented a Faster R-CNN [57], which incorporates a Region Proposal Network (RPN) to speed up processing and ensure efficient execution in clinical settings. Additionally, the approach by Tripathi et al. [39] stands out, as they employ an architecture for keypoint detection.
Regarding the scope of detection, proposals with different levels of complexity were identified. On one hand, 2 studies [28,49] developed models aimed at detecting a single element. In contrast, Joseph et al. [29] and Tripathi et al. [39] implemented multiclass approaches.
Finally, model evaluation showed heterogeneity in validation strategies and reported metrics. Two studies [28,49] used 5-fold cross-validation, with Xing et al. [28] implementing a patient-level data split. In terms of metrics, precision and sensitivity emerged as the primary indicators in 3 studies [29,39,49], with precision ranging from 68.5% to 99.0% and sensitivity from 67.0% to 92.0%. It is worth noting that the mAP, a standard metric in object detection, was reported only by Joseph et al. [29], who achieved a value of 66.0% using an IoU threshold of 0.5.
3.3.3. Studies that employed saliency maps
This group includes 10 studies [30,32,33,34,37,40,41,50,51,52], summarized in Table 4. The primary focus of these studies lies in building classification models for detecting artifacts, anatomical structures, and pathological findings using CNNs to support LUS interpretation. The main mechanism, the CNN, does not directly detect the location of a finding in a specific area of the image; rather, it indicates whether the feature is present or not, performing a classification. The significance of these approaches lies in the integration of visual explainability mechanisms based on saliency maps, which allow the identification of specific regions of the image that underlie the model’s prediction.
Eight studies [30,32,33,34,40,41,50,51] used 2D CNNs combined with gradient-based activation maps (Grad-CAM) [61]. On the other hand, 2 studies [37,52] opted for spatiotemporal approaches using 3D CNNs. Among these, Kolarik et al. [37] specified the construction of activation maps using Vanilla Saliency Maps [62] and SmoothGrad [63].
Most authors used grayscale B-mode LUS images [30,32,34,41,50,51] as input. However, notable variations were identified: VanBerlo et al. [33] processed M-mode images to assess pleural motion, while Ni et al. [40] proposed a three-channel input combining the original image with two views optimized through K-means clustering and vertical linear adjustment. Finally, studies based on 3D architectures [37,52] directly used LUS video sequences.
The sample of studies is evenly divided between those that performed binary classification [32,33,34,37,50] and those that opted for multiclass classification [30,40,41,51,52]. Within the first group, two studies focused on detecting the absence of lung sliding [33,37]. Two others addressed the presence of B-lines [34,37]. Finally, Chaudhary et al. [32] focused their approach on the detection of PE.
Among the multiclass models, 2 studies [40,41] proposed a four-category classification: A-lines, B-lines, pulmonary consolidations, and PE. Erfanian Ebadi et al. [52] simplified this division with a three-class model that groups consolidations and PE into a single category. The remaining studies [30,51] focused on artifact identification.
In terms of model validation, 7 studies [30,32,33,34,37,40,51] employed patient-level data splits. AUC values were reported in 8 studies, ranging from 0.874 to 0.9989. Similarly, sensitivity was reported in all studies, with values between 83.0% and 98.76%, while specificity was reported in eight studies, ranging from 69.7% to 99.41%.
4. Discussion
4.1. Main findings
As the first systematic review in this area, this study identified 24 research articles applying AI methods for the detection and localization of pulmonary artifacts, anatomical structures, and pathological findings to aid clinical decision-making in LUS. The identified studies were categorized into three different methodological approaches: semantic segmentation [24,25,26,27,31,35,36,38,44,46], object detection [28,29,39,49], and classification incorporating visual explainability mechanisms through saliency maps[30,32,33,34,37,40,41,50,51,52].
All approaches are based on DL strategies using CNN implementations. In the field of segmentation, the U-Net architecture has become the reference standard, while YOLO-based architectures dominate in object detection. Meanwhile, most models focused on visual explainability employ 2D CNNs coupled with Grad-CAM activation maps.
The studies focused primarily on the localization and detection of B-lines, [25,26,29,30,31,34,39,40,41,44,49,50,51,52] A-lines [25,26,29,30,34,39,40,41,44,52], and the pleural line [24,25,27,28,29,36,39,44,46], which are key elements for the diagnosis of various pulmonary conditions.
The performance of segmentation models was evaluated using metrics such as the DSC, reported in seven studies, and the IoU, used in four studies. DSC values ranged from 0.2 to 0.99, while IoU values ranged from 0.61 to 0.98. In object detection studies, precision was reported in three studies, ranging from 67.0% to 92.0%, sensitivity in two studies, ranging from 68.5% to 99.0%, and mAP (with an IoU threshold of 0.5) in one study, with a value of 66.0%. Finally, classification studies reported AUC in eight studies, with values ranging from 0.874 to 0.9989; sensitivity was reported in all studies, ranging from 83.0% to 98.76%, while specificity was reported in eight studies, ranging from 69.7% to 99.41%.
4.2. Limitations of the included studies
The studies included in this review present several methodological and design limitations. First, there is considerable heterogeneity in the strategies used to detect and localize the elements of interest, with up to three different technical approaches coexisting to support the interpretation of LUS.
Similarly, there is substantial variability in the data used, with sample sizes ranging from 10 to 3,966 patients. Most studies focus on COVID-19 cases, which introduces bias and limits the generalizability of these systems to other pathologies.
The studies were conducted in diverse clinical settings (EDs, ICUs, internal medicine, thoracic surgery, and various hospitals), with a notable absence of research in pulmonology services, where these tools could have a significant impact in promoting their adoption in routine clinical practice. Additionally, there is heterogeneity in the type of source data: some studies use ultrasound videos for frame extraction or direct processing, while others rely exclusively on static images.
Several studies have shown that the acquisition protocol, equipment, and type of transducer used have a major clinical impact [64,65]. However, there is currently no international consensus on how lung ultrasound should be performed [1], which is reflected in the analysed studies, where diverse equipment, probes, and protocols are used. While some studies rely on data from a single device and a specific probe, others use heterogeneous datasets obtained from multiple manufacturers and transducers.
Finally, it is important to highlight the absence of standard evaluation metrics in several studies. This issue is particularly critical in object detection models, where mAP, a standard metric for this type of architecture, is often not reported. Similarly, models that employ activation maps evaluate performance on classification tasks but do not allow precise quantification of the localization quality of the identified elements in those maps.
4.3. Clinical implications
LUS is a low-cost, safe, and effective tool for real-time assessment of pulmonary conditions. Although its use has increased notably in critical settings such as EDs, its integration into pulmonology services has been limited by the technical complexity required for interpreting ultrasound images and videos, as well as by the scarcity of specialized training programs. This technological gap has hindered the adoption of lung ultrasound in an area where its clinical impact could be decisive for the management of multiple respiratory pathologies, the guidance of interventional procedures, and the monitoring of treatment response.
In this context, the development of AI tools designed to support the interpretation of LUS through the detection and localization of artifacts, anatomical structures, and pathological findings represents a crucial step toward facilitating their use in pulmonology. The studies analysed demonstrate that it is possible to automatically identify key elements using segmentation techniques, object detection, or activation map generation, thereby providing objective visual guidance for clinicians.
By ensuring a more accurate and reproducible diagnosis, these applications enhance the reliability of ultrasound, transforming it into a comprehensive and accessible tool that optimizes clinical workflow and improves decision-making based on direct bedside examination evidence.
4.3.1. Practical implementation and workflow integration
The tools identified in this review will facilitate the expansion of lung ultrasound use and ensure its diagnostic efficiency through effective integration into clinical practice. On the one hand, these systems can be implemented directly into ultrasound equipment, providing real-time support during patient examination. This assistance enables precise localization of pulmonary artifacts, anatomical structures, and pathological findings simultaneously with image acquisition, which not only significantly reduces interobserver variability but also facilitates access to the technique for less experienced professionals.
Likewise, AI-assisted interpretation of the examination ensures greater diagnostic accuracy, minimizing errors due to incorrect interpretation of the test. In academic and professional settings, these tools can be integrated into specialized training programs, enabling continuous learner support and a considerable reduction in the ultrasound learning curve.
Finally, the consolidation of these systems in pulmonology services would help optimize healthcare resource management. By strengthening the diagnostic capability of lung ultrasound, it is possible to reduce reliance on other imaging tests that are more costly or involve radiation, such as CT or chest X-Ray.
4.3.2. Adoption barriers and enablers
The main barriers lie in the difficulty of acquiring data for training these systems, as well as in the lack of data obtained from pulmonology services, where these tools could provide substantial benefit. Moreover, the presence of multiple commercial devices may hinder the implementation of these solutions across different services, compounded using diverse probes and configurations and the absence of standardized protocols. Additionally, heterogeneity in the literature regarding objectives constitutes an added challenge, as there is no consensus on which elements should be identified to ensure correct lung ultrasound interpretation across a wider range of pathologies. Furthermore, the use of very heavy deep learning models complicates the real-time implementation of these systems.
Facilitating factors for their adoption include access to some open databases, as well as the wide variety of available architectures to address this task, enabling selection of the most appropriate ones. Additionally, the ability to achieve precise localization of structures stands out, as it not only facilitates ultrasound interpretation but also enables the development of specialized training programs. This would promote the expansion of lung ultrasound use in services such as pulmonology, where its application remains limited in certain areas that still rely on more complex diagnostic tests.
4.4. Future opportunities
Currently, the use of AI tools to support LUS interpretation remains limited. Therefore, future research should focus on strategic areas to consolidate their clinical application.
First, it is essential to develop lightweight DL models capable of operating in real time, so they can assist clinicians during patient examinations. The main barrier to LUS expansion continues to be its operator dependence. Therefore, future systems should not be limited to identifying and localizing ultrasound findings but also actively guide image acquisition. This approach will enable the capture of high-quality images and facilitate the integration of these systems into both clinical practice and training programs.
Likewise, the growing interest in using LUS in specific clinical settings, such as pulmonology, should be accompanied by studies focused on these contexts, ensuring that the models are applicable and effective in clinical practice.
Another key aspect is moving towards a multimodal approach, integrating ultrasound images with relevant clinical information. This will enable a more precise analysis, advance to personalized medicine, and improve model performance.
Finally, current studies are based on single-point diagnoses. There is an opportunity to develop algorithms capable of comparing examinations over time, which would allow for the objective quantification of therapeutic response and support the monitoring of multiple respiratory pathologies.
4.5. Limitations of this review
This systematic review has several limitations. First, the methodological heterogeneity of the identified studies, together with the small number of investigations within each group and the diversity of reported metrics, hindered the conduct of a meta-analysis. Although the inclusion and exclusion criteria were rigorously defined, it is possible that a relevant article was omitted if its methodology was not described in sufficient detail.
Likewise, the search was limited to publications in Spanish and English, which introduces language bias. Only journal articles were included, excluding proceedings and conference papers. In addition, although many well-recognized databases reflecting the interdisciplinary nature of the topic were used (Web of Science, IEEE Xplore, and PubMed), other sources could have been explored.
Finally, due to the exploratory scope and the heterogeneity of the studies, tools like PROBAST were not used.
5. Conclusions
This systematic review demonstrates the effectiveness of applying AI techniques to support LUS interpretation. The identified studies are based on DL strategies, revealing three distinct approaches: segmentation, object detection, and activation map generation.
Despite the growing interest in this field, several limitations remain. First, the studies are highly heterogeneous in both their objectives and the methodologies employed. Additionally, there is variability in the reported metrics, and many studies do not perform an appropriate evaluation of model performance using standard metrics.
Future research should focus on developing systems specifically designed for its use in pulmonology services, where factors such as time constraints, the complexity of ultrasound interpretation, and the lack of specialized training are hindering the adoption of this tool. Additionally, it will be necessary to advance towards systems that not only assist in interpretation but also guide the operator, integrate relevant clinical information, and allow for the comparison of studies over time, with the aim of improving diagnostic accuracy and the clinical utility of these systems.
Author Contributions
Conceptualization, M.C.-G. and A.F.-V.; methodology, J.L.-C., M.C.-G. and A.F.-V.; investigation, J.L.-C., M.C.-G., C. R.-H., A.F.-G., M.B.-R. and A.F.-V.; writing—original draft preparation, J.L.-C. and M.C.-G.; writing—review and editing, A.F.-V. All authors have read and agreed to published version of the manuscript.
Funding
This research received no external funding.
Conflicts of Interest
The authors declare no conflict of interest.
Declaration of generative AI and AI-assisted technologies in the manuscript preparation process: During the preparation of this work the author(s) used ChatGPT-5 (OpenAI) in order to assist language translation, language editing and grammar. After using this tool/service, the author(s) reviewed and edited the content as needed and take(s) full responsibility for the content of the published article.
References
- Laursen, C.B.; Clive, A.; Hallifax, R.; Pietersen, P.I.; Asciak, R.; Davidsen, J.R.; Bhatnagar, R.; Bedawi, E.O.; Jacobsen, N.; Coleman, C.; et al. European Respiratory Society Statement on Thoracic Ultrasound. Eur. Respir. J. 2021, 57, 2001519. [Google Scholar] [CrossRef] [PubMed]
- Marini, T.J.; Rubens, D.J.; Zhao, Y.T.; Weis, J.; O’Connor, T.P.; Novak, W.H.; Kaproth-Joslin, K.A. Lung Ultrasound: The Essentials. Radiol. Cardiothorac. Imaging 2021, 3, e200564. [Google Scholar] [CrossRef] [PubMed]
- Demi, L.; Egan, T.; Muller, M. Lung Ultrasound Imaging, a Technical Review. Appl. Sci. 2020, 10, 462. [Google Scholar] [CrossRef]
- Lichtenstein, D.; Goldstein, I.; Mourgeon, E.; Cluzel, P.; Grenier, P.; Rouby, J.-J. Comparative Diagnostic Performances of Auscultation, Chest Radiography, and Lung Ultrasonography in Acute Respiratory Distress Syndrome. Anesthesiology 2004, 100, 9–15. [Google Scholar] [CrossRef] [PubMed]
- Smargiassi, A.; Soldati, G.; Torri, E.; Mento, F.; Milardi, D.; Del Giacomo, P.; De Matteis, G.; Burzo, M.L.; Larici, A.R.; Pompili, M.; et al. Lung Ultrasound for COVID-19 Patchy Pneumonia. J. Ultrasound Med. 2021, 40, 521–528. [Google Scholar] [CrossRef] [PubMed]
- Miller, A. Practical Approach to Lung Ultrasound. BJA Educ. 2016, 16, 39–45. [Google Scholar] [CrossRef]
- Demi, L.; Wolfram, F.; Klersy, C.; De Silvestri, A.; Ferretti, V.V.; Muller, M.; Miller, D.; Feletti, F.; Wełnicki, M.; Buda, N.; et al. New International Guidelines and Consensus on the Use of Lung Ultrasound. J. Ultrasound Med. 2023, 42, 309–344. [Google Scholar] [CrossRef] [PubMed]
- Bhoil, R.; Ahluwalia, A.; Chopra, R.; Surya, M.; Bhoil, S. Signs and Lines in Lung Ultrasound. J. Ultrason. 2021, 21, e225–e233. [Google Scholar] [CrossRef] [PubMed]
- Saraogi, A. Lung Ultrasound: Present and Future. Lung India 2015, 32, 250. [Google Scholar] [CrossRef] [PubMed]
- Bouhemad, B.; Zhang, M.; Lu, Q.; Rouby, J.-J. Clinical Review: Bedside Lung Ultrasound in Critical Care Practice. Crit. Care 2007, 11, 205. [Google Scholar] [CrossRef] [PubMed]
- Gargani, L.; Volpicelli, G. How I Do It: Lung Ultrasound. Cardiovasc. Ultrasound 2014, 12, 25. [Google Scholar] [CrossRef] [PubMed]
- Di Serafino, M.; Notaro, M.; Rea, G.; Iacobellis, F.; Delli Paoli, V.; Acampora, C.; Ianniello, S.; Brunese, L.; Romano, L.; Vallone, G. The Lung Ultrasound: Facts or Artifacts? In the Era of COVID-19 Outbreak. Radiol. Med. 2020, 125, 738–753. [Google Scholar] [CrossRef] [PubMed]
- Yang, P.C.; Chang, D.B.; Yu, C.J.; Lee, Y.C.; Kuo, S.H.; Luh, K.T. Ultrasound Guided Percutaneous Cutting Biopsy for the Diagnosis of Pulmonary Consolidations of Unknown Aetiology. Thorax 1992, 47, 457–460. [Google Scholar] [CrossRef] [PubMed]
- Yang, P.-C.; Luh, K.-T.; Chang, D.-B.; Yu, C.-J.; Kuo, S.-H.; Wu, H.-D. Ultrasonographic Evaluation of Pulmonary Consolidation. Am. Rev. Respir. Dis. 1992, 146, 757–762. [Google Scholar] [CrossRef] [PubMed]
- Pneumatikos, I.; Bouros, D. Pleural Effusions in Critically Ill Patients. 2008, 76, 241–248. [Google Scholar] [CrossRef] [PubMed]
- Ramos-Hernández, C.; Botana-Rial, M.; Cordovilla-Pérez, R.; Núñez-Delgado, M.; Fernández-Villar, A. Results from a Spanish National Survey on the Application of Ultrasound in Pulmonology Services. Ultrasound J. 2021, 13, 38. [Google Scholar] [CrossRef] [PubMed]
- van Sloun, R.J.G.; Cohen, R.; Eldar, Y.C. Deep Learning in Ultrasound Imaging. Proc. IEEE 2020, 108, 11–29. [Google Scholar] [CrossRef]
- Yang, T.; Karakus, O.; Anantrasirichai, N.; Achim, A. Current Advances in Computational Lung Ultrasound Imaging: A Review. IEEE Trans. Ultrason. Ferroelectr. Freq. Control 2023, 70, 2–15. [Google Scholar] [CrossRef] [PubMed]
- Malík, M.; Dzian, A.; Števík, M.; Vetešková, Š.; Al Hakim, A.; Hliboký, M.; Magyar, J.; Kolárik, M.; Bundzel, M.; Babič, F. Lung Ultrasound Reduces Chest X-Rays in Postoperative Care after Thoracic Surgery: Is There a Role for Artificial Intelligence?—Systematic Review. Diagnostics 2023, 13, 2995. [Google Scholar] [CrossRef] [PubMed]
- Trovato, G.; Russo, M. Artificial Intelligence (AI) and Lung Ultrasound in Infectious Pulmonary Disease. Front. Med. . 2021, 8. [Google Scholar] [CrossRef] [PubMed]
- Mika, S.; Gola, W.; Gil-Mika, M.; Wilk, M.; Misiołek, H. Overview of Artificial Intelligence in Point-of-Care Ultrasound. New Horizons for Respiratory System Diagnoses. Anaesthesiol. Intensive Ther. 2024, 56, 1–8. [Google Scholar] [CrossRef] [PubMed]
- Chu, D.; Liteplo, A.; Duggan, N.; Hutchinson, A.B.; Shokoohi, H. Artificial Intelligence in Lung Ultrasound. Curr. Pulmonol. Rep. 2024, 13, 127–134. [Google Scholar] [CrossRef]
- Page, M.J.; McKenzie, J.E.; Bossuyt, P.M.; Boutron, I.; Hoffmann, T.C.; Mulrow, C.D.; Shamseer, L.; Tetzlaff, J.M.; Akl, E.A.; Brennan, S.E.; et al. The PRISMA 2020 Statement: An Updated Guideline for Reporting Systematic Reviews. BMJ 2021, 372. [Google Scholar] [CrossRef] [PubMed]
- Howell, L.; Ingram, N.; Lapham, R.; Morrell, A.; Mclaughlan, J.R. Deep Learning for Real-Time Multi-Class Segmentation of Artefacts in Lung Ultrasound. Ultrasonics 2024, 140, 107251. [Google Scholar] [CrossRef] [PubMed]
- Frank, O.; Schipper, N.; Vaturi, M.; Soldati, G.; Smargiassi, A.; Inchingolo, R.; Torri, E.; Perrone, T.; Mento, F.; Demi, L.; et al. Integrating Domain Knowledge into Deep Networks for Lung Ultrasound with Applications to Covid-19. IEEE Trans. Med. Imaging 2022, 41, 571–581. [Google Scholar] [CrossRef] [PubMed]
- Abbasi, S.; Wahd, A.S.; Ghosh, S.; Ezzelarab, M.; Panicker, M.; Chen, Y.T.; Jaremko, J.L.; Hareendranathan, A. Improved A-Line and B-Line Detection in Lung Ultrasound Using Deep Learning with Boundary-Aware Dice Loss. Bioengineering 2025, 12, 311. [Google Scholar] [CrossRef] [PubMed]
- Xing, W.; He, C.; Ma, Y.; Liu, Y.; Zhu, Z.; Li, Q.; Li, W.; Chen, J.; Ta, D. Combining Quantitative and Qualitative Analysis for Scoring Pleural Line in Lung Ultrasound. Phys. Med. Biol. 2024, 69, 095008. [Google Scholar] [CrossRef] [PubMed]
- Xing, W.; Li, G.; He, C.; Huang, Q.; Cui, X.; Li, Q.; Li, W.; Chen, J.; Ta, D. Automatic Detection of A-line in Lung Ultrasound Images Using Deep Learning and Image Processing. Med. Phys. 2023, 50, 330–343. [Google Scholar] [CrossRef] [PubMed]
- Joseph, J.; Raveendranatha Panicker, M.; Tung Chen, Y.; Chandrasekharan, K.; Chacko Mondy, V.; Ayyappan, A.; Valakkada, J.; Vishnu Narayan, K. LungEcho—Resource Constrained Lung Ultrasound Video Analysis Tool for Faster Triaging and Active Learning. Biomed. Eng. Adv. 2023, 6, 100094. [Google Scholar] [CrossRef]
- Huang, Q.; Lei, Y.; Xing, W.; He, C.; Wei, G.; Miao, Z.; Hao, Y.; Li, G.; Wang, Y.; Li, Q.; et al. Evaluation of Pulmonary Edema Using Ultrasound Imaging in Patients With COVID-19 Pneumonia Based on a Non-Local Channel Attention ResNet. Ultrasound Med. Biol. 2022, 48, 945–953. [Google Scholar] [CrossRef] [PubMed]
- Lucassen, R.T.; Jafari, M.H.; Duggan, N.M.; Jowkar, N.; Mehrtash, A.; Fischetti, C.; Bernier, D.; Prentice, K.; Duhaime, E.P.; Jin, M.; et al. Deep Learning for Detection and Localization of B-Lines in Lung Ultrasound. IEEE J. Biomed. Health Inform. 2023, 27, 4352–4361. [Google Scholar] [CrossRef] [PubMed]
- Chaudhary, R.; Ho, J.; Smith, D.; Hossain, S.; Hargun, J.; VanBerlo, B.; Murphy, N.; Prager, R.; Rikhraj, K.; Tschirhart, J.; et al. Diagnostic Accuracy of an Automated Classifier for the Detection of Pleural Effusions in Patients Undergoing Lung Ultrasound. Am. J. Emerg. Med. 2025, 90, 142–150. [Google Scholar] [CrossRef] [PubMed]
- VanBerlo, B.; Wu, D.; Li, B.; Rahman, M.A.; Hogg, G.; VanBerlo, B.; Tschirhart, J.; Ford, A.; Ho, J.; McCauley, J.; et al. Accurate Assessment of the Lung Sliding Artefact on Lung Ultrasonography Using a Deep Learning Approach. Comput. Biol. Med. 2022, 148, 105953. [Google Scholar] [CrossRef] [PubMed]
- Arntfield, R.; Wu, D.; Tschirhart, J.; VanBerlo, B.; Ford, A.; Ho, J.; McCauley, J.; Wu, B.; Deglint, J.; Chaudhary, R.; et al. Automation of Lung Ultrasound Interpretation via Deep Learning for the Classification of Normal versus Abnormal Lung Parenchyma: A Multicenter Study. Diagnostics 2021, 11, 2049. [Google Scholar] [CrossRef] [PubMed]
- Vukovic, D.; Wang, A.; Antico, M.; Steffens, M.; Ruvinov, I.; van Sloun, R.J.; Canty, D.; Royse, A.; Royse, C.; Haji, K.; et al. Automatic Deep Learning-Based Pleural Effusion Segmentation in Lung Ultrasound Images. BMC Med. Inform. Decis. Mak. 2023, 23, 274. [Google Scholar] [CrossRef] [PubMed]
- Jaščur, M.; Bundzel, M.; Malík, M.; Dzian, A.; Ferenčík, N.; Babič, F. Detecting the Absence of Lung Sliding in Lung Ultrasounds Using Deep Learning. Appl. Sci. 2021, 11, 6976. [Google Scholar] [CrossRef]
- Kolárik, M.; Sarnovský, M.; Paralič, J. Detecting the Absence of Lung Sliding in Ultrasound Videos Using 3D Convolutional Neural Networks. Acta Polytech. Hung. 2023, 20, 47–60. [Google Scholar] [CrossRef]
- Tan, G.F.L.; Du, T.; Liu, J.S.; Chai, C.C.; Nyein, C.M.; Liu, A.Y.L. Automated Lung Ultrasound Image Assessment Using Artificial Intelligence to Identify Fluid Overload in Dialysis Patients. BMC Nephrol. 2022, 23, 410. [Google Scholar] [CrossRef] [PubMed]
- Tripathi, A.; Panicker, M.R.; Rakkunedeth Hareendranathan, A.; Jaremko, J.; Chen, Y.T.; Narayan, K.V.; C., K. Unsupervised Landmark Detection and Classification of Lung Infection Using Transporter Neural Networks. Comput. Biol. Med. 2023, 152, 106345. [Google Scholar] [CrossRef] [PubMed]
- Ni, Y.; Cong, Y.; Zhao, C.; Yu, J.; Wang, Y.; Zhou, G.; Shen, M. Active Learning Based on Multi-Enhanced Views for Classification of Multiple Patterns in Lung Ultrasound Images. Comput. Med. Imaging Graph. 2024, 118, 102454. [Google Scholar] [CrossRef] [PubMed]
- Chen, J.; Shen, M.; Hou, S.; Duan, X.; Yang, M.; Cao, Y.; Qin, W.; Niu, Q.; Li, Q.; Zhang, Y.; et al. Intelligent Interpretation of Four Lung Ultrasonographic Features with Split Attention Based Deep Learning Model. Biomed. Signal Process. Control 2023, 81, 104228. [Google Scholar] [CrossRef]
- Lichtenstein, D.A.; Mezière, G.A. Relevance of Lung Ultrasound in the Diagnosis of Acute Respiratory Failure*: The BLUE Protocol. Chest 2008, 134, 117–125. [Google Scholar] [CrossRef] [PubMed]
- Roy, S.; Menapace, W.; Oei, S.; Luijten, B.; Fini, E.; Saltori, C.; Huijben, I.; Chennakeshava, N.; Mento, F.; Sentelli, A.; et al. Deep Learning for Classification and Localization of COVID-19 Markers in Point-of-Care Lung Ultrasound. IEEE Trans. Med. Imaging 2020, 39, 2676–2687. [Google Scholar] [CrossRef] [PubMed]
- Muñoz, M.; Rubio, A.; Cosarinsky, G.; Cruza, J.F.; Camacho, J. Deep Learning-Based Algorithms for Real-Time Lung Ultrasound Assisted Diagnosis. Appl. Sci. 2024, 14. [Google Scholar] [CrossRef]
- Camacho, J.; Muñoz, M.; Genovés, V.; Herraiz, J.L.; Ortega, I.; Belarra, A.; González, R.; Sánchez, D.; Giacchetta, R.C.; Trueba-Vicente, Á.; et al. Artificial Intelligence and Democratization of the Use of Lung Ultrasound in COVID-19: On the Feasibility of Automatic Calculation of Lung Ultrasound Score. Int. J. Transl. Med. 2022, 2, 17–25. [Google Scholar] [CrossRef]
- Uchida, T.; Tanaka, Y.; Suzuki, A. Automatic Detection of Pleural Line and Lung Sliding in Lung Ultrasonography Using Convolutional Neural Networks. Heliyon 2024, 10, e34700. [Google Scholar] [CrossRef] [PubMed]
- Cid-Serra, X.; Royse, A.; Canty, D.; Johnson, D.F.; Maier, A.B.; Fazio, T.; El-Ansary, D.; Royse, C.F. Effect of a Multiorgan Focused Clinical Ultrasonography on Length of Stay in Patients Admitted With a Cardiopulmonary Diagnosis. JAMA Netw. Open 2021, 4, e2138228. [Google Scholar] [CrossRef] [PubMed]
- Ford, J.W.; Heiberg, J.; Brennan, A.P.; Royse, C.F.; Canty, D.J.; El-Ansary, D.; Royse, A.G. A Pilot Assessment of 3 Point-of-Care Strategies for Diagnosis of Perioperative Lung Pathology. Anesth. Analg. 2017, 124, 734–742. [Google Scholar] [CrossRef] [PubMed]
- Bottino, A.; Botrugno, C.; Casciaro, E.; Conversano, F.; Lay-Ekuakille, A.; Lombardi, F.A.; Morello, R.; Pisani, P.; Vetrugno, L.; Casciaro, S. Automatic Approach for B-Lines Detection in Lung Ultrasound Images Using You Only Look Once Algorithm. J. Ultrasound 2025, 28, 985–992. [Google Scholar] [CrossRef] [PubMed]
- van Sloun, R.J.G.; Demi, L. Localizing B-Lines in Lung Ultrasonography by Weakly Supervised Deep Learning, In-Vivo Results. IEEE J. Biomed. Health Inform. 2020, 24, 957–964. [Google Scholar] [CrossRef] [PubMed]
- Pare, J.R.; Gjesteby, L.A.; Tonelli, M.; Leo, M.M.; Muruganandan, K.M.; Choudhary, G.; Brattain, L.J. Transfer Learning-Based B-Line Assessment of Lung Ultrasound for Acute Heart Failure. Ultrasound Med. Biol. 2024, 50, 825–832. [Google Scholar] [CrossRef] [PubMed]
- Erfanian Ebadi, S.; Krishnaswamy, D.; Bolouri, S.E.S.; Zonoobi, D.; Greiner, R.; Meuser-Herr, N.; Jaremko, J.L.; Kapur, J.; Noga, M.; Punithakumar, K. Automated Detection of Pneumonia in Lung Ultrasound Using Deep Video Classification for COVID-19. Inform. Med. Unlocked 2021, 25, 100687. [Google Scholar] [CrossRef] [PubMed]
- Ronneberger, O.; Fischer, P.; Brox, T. U-Net: Convolutional Networks for Biomedical Image Segmentation. 2015. [Google Scholar] [CrossRef]
- Oktay, O.; Schlemper, J.; Folgoc, L. Le; Lee, M.; Heinrich, M.; Misawa, K.; Mori, K.; McDonagh, S.; Hammerla, N.Y.; Kainz, B.; et al. Attention U-Net: Learning Where to Look for the Pancreas; 2018. [Google Scholar]
- Chen, J.; Lu, Y.; Yu, Q.; Luo, X.; Adeli, E.; Wang, Y.; Lu, L.; Yuille, A.L.; Zhou, Y. TransUNet: Transformers Make Strong Encoders for Medical Image Segmentation; 2021. [Google Scholar]
- Chen, L.-C.; Papandreou, G.; Schroff, F.; Adam, H. Rethinking Atrous Convolution for Semantic Image Segmentation. 2017. [Google Scholar] [CrossRef] [PubMed]
- Ren, S.; He, K.; Girshick, R.; Sun, J. Faster R-CNN: Towards Real-Time Object Detection with Region Proposal Networks. IEEE Trans. Pattern Anal. Mach. Intell. 2017, 39, 1137–1149. [Google Scholar] [CrossRef] [PubMed]
- Redmon, J.; Divvala, S.; Girshick, R.; Farhadi, A. You Only Look Once: Unified, Real-Time Object Detection. In Proceedings of the 2016 IEEE Conference on Computer Vision and Pattern Recognition (CVPR); IEEE, June 2016; pp. 779–788. [Google Scholar]
- 2015.
- Girshick, R.; Donahue, J.; Darrell, T.; Malik, J. Rich Feature Hierarchies for Accurate Object Detection and Semantic Segmentation. In Proceedings of the 2014 IEEE Conference on Computer Vision and Pattern Recognition; IEEE, June 2014; pp. 580–587. [Google Scholar]
- Selvaraju, R.R.; Cogswell, M.; Das, A.; Vedantam, R.; Parikh, D.; Batra, D. Grad-CAM: Visual Explanations from Deep Networks via Gradient-Based Localization. Proc. Proc. IEEE Int. Conf. Comput. Vis. 2017, Vol. 2017-October, 618–626. [Google Scholar]
- Simonyan, K.; Vedaldi, A.; Zisserman, A. Deep Inside Convolutional Networks: Visualising Image Classification Models and Saliency Maps; 2014. [Google Scholar]
- Omeiza, D.; Speakman, S.; Cintas, C.; Weldermariam, K. Smooth Grad-CAM++: An Enhanced Inference Level Visualization Technique for Deep Convolutional Neural Network Models; 2019. [Google Scholar]
- Ketelaars, R.; Gülpinar, E.; Roes, T.; Kuut, M.; van Geffen, G.J. Which Ultrasound Transducer Type Is Best for Diagnosing Pneumothorax? Crit. Ultrasound J. 2018, 10, 27. [Google Scholar] [CrossRef] [PubMed]
- Helland, G.; Gaspari, R.; Licciardo, S.; Sanseverino, A.; Torres, U.; Emhoff, T.; Blehar, D. Comparison of Four Views to Single-view Ultrasound Protocols to Identify Clinically Significant Pneumothorax. Acad. Emerg. Med. 2016, 23, 1170–1175. [Google Scholar] [CrossRef] [PubMed]
Figure 1.
PRISMA flow-chart of the study selection process.
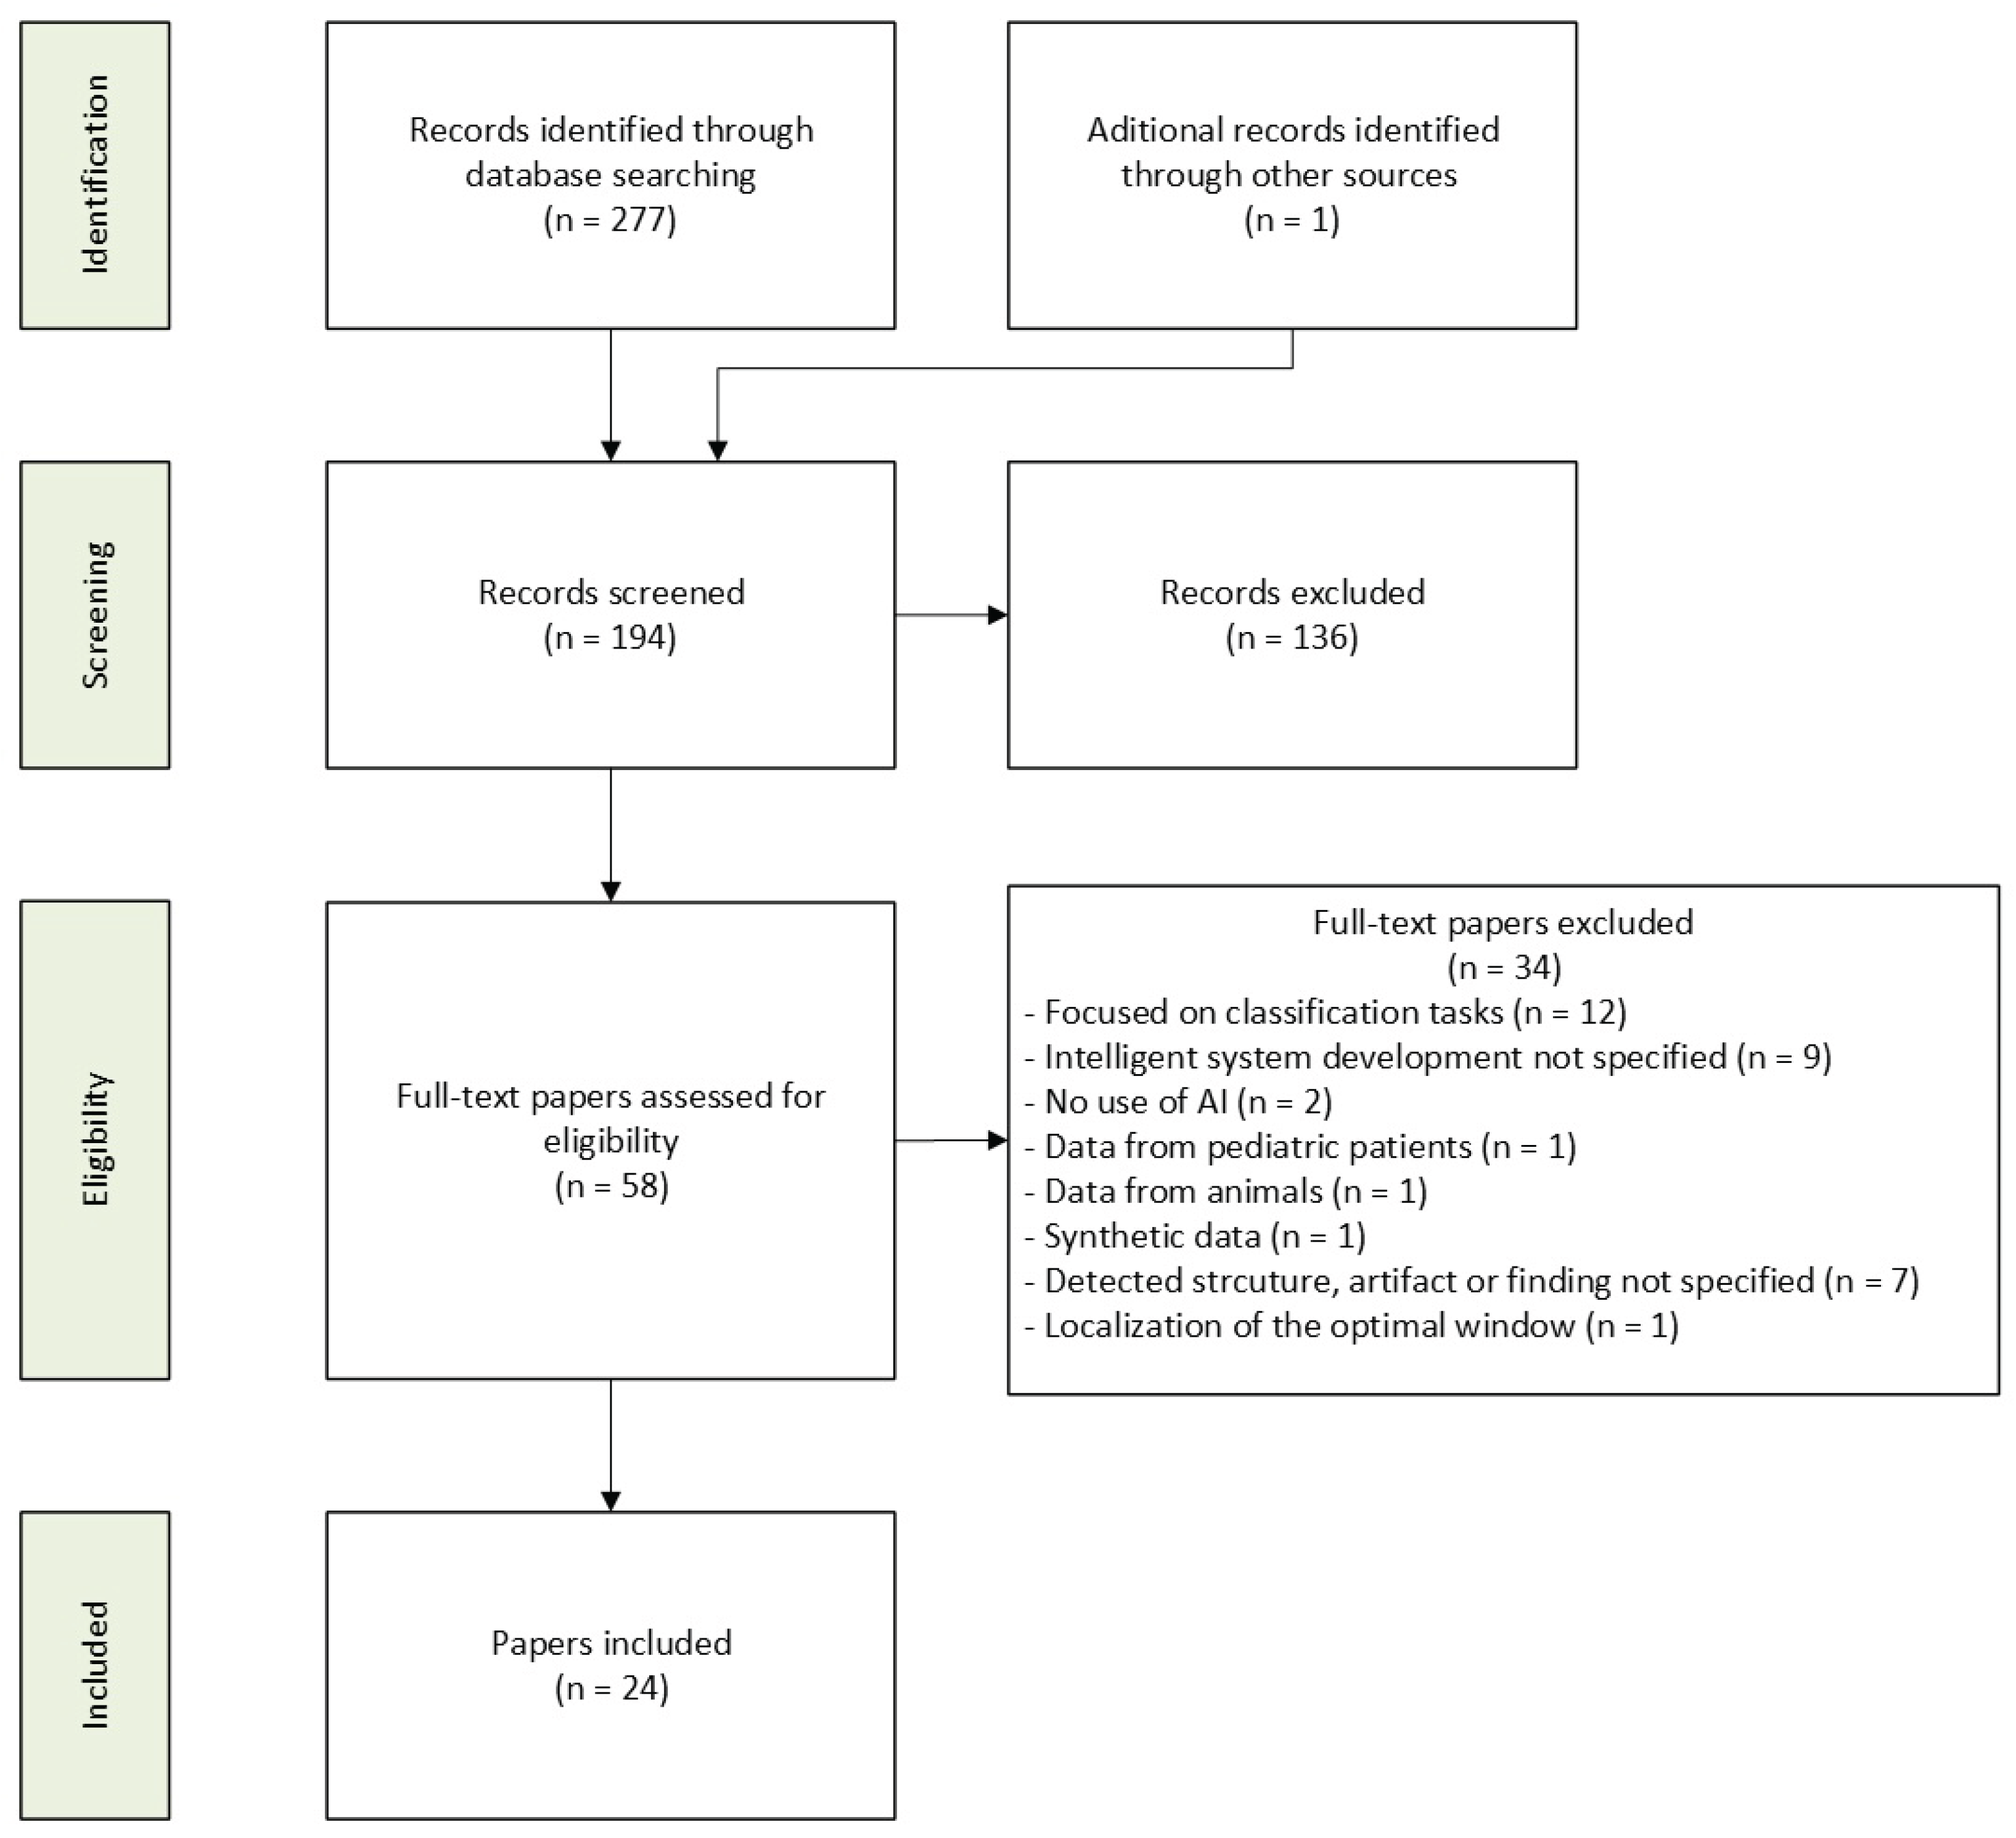

Table 1.
Descriptive characteristics of the studies.
| Author | Country | Study population | Data source/ setting | Sample size | No. of devices | Probe type | Scanning protocol |
| Howell et al. [24] | United Kingdom (UK) | 41 patients with COVID-19 pneumonia | 8 hospitals (Leeds Hospitals Trust, UK) | 57 images | - | - | - |
| Frank et al. [25] | Israel | 33 patients (confirmed/suspected COVID-19; healthy controls) | ICLUS [43] database (5 medical centres, Italy) | 2,154 images | 3 | Lineal and convex | - |
| Muñoz et al. [44] | Spain | 30 patients | ULTRACOV [45] clinical trial | 689 videos | 1 | Convex | 12-zone |
| Uchida et al. [46] | Japan | - | Jichi Medical University Hospital (Japan) | 10,140 images | 1 | Lineal and convex | - |
| Abbasi et al. [26] | Canada | Patients with COVID-19 | Puerta de Hierro University Hospital (Spain) | 4,599 images | 1 | Phased array and convex | - |
| Lucassen et al. [31] | United States of America (USA) | 113 patients with flu-like symptoms | ED (Brigham and Women’s Hospital, USA) | 719 videos; 10,755 images | 1 | Convex | BLUE [42] |
| Jašcur [36] | Slovakia | 48 post-thoracic surgery patients | Thoracic Surgery (Jessenius Faculty of Medicine, Slovakia) | 545 videos; 6,400 images |
1 |
Lineal | 4-zone |
| Vukovic et al. [35] |
Australia | 24 patients with PE [47] | Internal Medicine (Royal Melbourne Hospital, Australia) | 51 videos; 3,041 images | 1 | Phased array | iLungScan [48] |
| Xing et al. [27] | China | 31 patients with COVID-19 pneumonia | Wuhan Huoshenshan Hospital (China) | 740 videos; 3,770 images | 1 | Convex | 12-zone |
| Tan et al. [38] | Singapore | 76 dialysis patients (60 haemodialysis; 16 peritoneal dialysis) | Nephrology (Khoo Teck Puat Hospital, Singapore) | 1,385 images |
1 |
Convex | 8-zone |
| Xing et al. [28] | China | 61 patients (31 COVID-19 pneumonia; 30 pneumothorax) | Wuhan Huoshenshan Hospital (China) and First Affiliated Hospital of Zhejiang University School of Medicine | 4,930 images | 2 | Convex and lineal | - |
| Bottino et al. [49] |
Italy | 46 patients | Vito Fazzi Hospital; Butterfly and GrepMed platforms | 386 images | 1 | Convex | 14-zone |
| Tripathi et al. [39] | India | 40 patients (hypertension, diabetes, cardiovascular disease, fever, dyspnoea and weakness) | Govern Medical College Kottayam Hospital (India) and Puerta de Hierro University Hospital (Spain) | 230 videos | 4 | Phased array and convex | - |
| Joseph et al. [29] | India | 100 patients with COVID-19 | Puerta de Hierro University Hospital (Spain); Sree Chitra Tirunal Institute of Medical Sciences and Technology (India) and Government Medical College (India) | 1,200 videos | 3 | Phased array and convex | 14-zone; 12-zone and 16-zone |
| van Sloun et al. [50] | Netherlands | 10 patients | CEAVNO study | 12 videos; 4,218 images | 1 | Lineal | - |
| Chaudhary et al. [32] | Canada | 785 patients | ED, ICU and Internal Medicine (2 third level hospitals, Canada) | 1,664 videos; 313,109 images | 4 | Phased array and convex | BLUE [42] |
| VanBerlo et al. [33] | Canada | 738 patients | ED, ICU and Internal Medicine (2 third level hospitals, Canada) | 3,075 videos | 3 | Phased array, convex and lineal | - |
| Kolarik et al. [37] | Slovakia | 48 patients | Thoracic Surgery (Jessenius Faculty of Medicine, Slovakia) | 48 videos | - | Lineal | - |
| Ni et al. [40] | China | 3,966 patients | Shanghai Pulmonary Hospital (China) | 5,267 images | - | - | 6-zone |
| Chen et al. [41] | China | 3,966 patients | Ultrasound department (Shanghai Pulmonary Hospital, China) | 5,545 images | 1 | Convex | 6-zone |
| Arntfield et al. [34] | Canada | - | ED and ICU (Ottawa University archives, Canada) and Qpath E database | 1,276 videos | 3 | Phased array, convex and lineal | - |
| Huang et al. [30] | China | 31 patients with COVID-19 | ICU (Wuhan Huoshenshan Hospital, China) | 2,062 images | 1 | Convex | 12-zone |
| Pare et al. [51] | USA | 90 patients treated for acute heart failure | CRUSH study | 716 videos | 1 | Phased array | 8-zone |
| Erfanian Ebadi et al. [52] | Canada | 300 patients | Multicentric | 1,530 videos; 287,549 images | - | - | - |
Table 2.
Summary of segmentation studies.
| Author | Model | Input | Classes | Validation | DSC | IoU |
| Howell et al. [24] | Lightweight U-Net | B-mode LUS images 256x256x1 | (1) Background/ (2) Ribs/ (3) Pleural line/ (4) Pulmonary consolidation/ (5) Simple PE/ (6) Complex PE | 90% (51 images) train; 10% (6 images) test | 0.20 | - |
| Frank et al. [25] | DeepLabV3++ [56] (ResNet-50) |
3 channel images: (1) B-mode LUS image (2) Vertical artifacts mask (3) Signed distance to pleural line mask |
(0) Continuous pleural line and A-lines/ (1) Pleural line alterations and few B-lines / (2) B-lines and small consolidations/ (3) B-lines and big consolidations/ (4) Background |
Patient level: ~74% (1,601 images) train; ~26% (553 images) test |
0.70 | - |
| Muñoz et al. [44] | Attention U-Net [54] | B-mode LUS images 256x128 | (1) Pleural line/ (2) Background | Patient level: 90% (27 patients) train (70% images train/ 30% images validation); 10% (3 patients) test |
0.83 | 0.72 |
| (1) A-lines/ (2) Background | 0.40 | 0.56 | ||||
| (1) B-lines/ (2) Background | 0.87 | 0.84 | ||||
| (1) Consolidations/ (2) Background | 0.96 | 0.95 | ||||
| Uchida et al. [46] | U-Net | B-mode LUS images 240x240x1 | (1) Pleural/ (2) Background | ~98.6% (1000 images) train; ~1.4% (140 images) test | 0.99 | 0.98 |
| Abbasi et al. [26] | TransBound-UNet | B-mode LUS images | (1) A-lines/ (2) B-lines/ (3) Background | 5-fold cross-validation | 0.8 | 0.73 |
| Lucassen et al. [31] | EfficientNet-18 + U-Net | B-mode LUS images 384x256 | (1) B-lines origin/ (2) Background | Patient level: 80% train with 5-fold cross-validation; 20% test |
- | - |
| Jašcur et al. [36] | U-Net | B-mode LUS images 480x480 | (1) Lung/ (2) Background | 50% (3,400 images) train; 25% (1,600 images) validation; 25% (1,600 images) test | - | 0.75 |
| (1) Pleural line/ (2) Background | - | 0.61 | ||||
| (1) Rib shadow/ (2) Background | - | 0.81 | ||||
| Vukovic et al. [35] |
STN + U-net | B-mode LUS images 806×550 | (1) Background / (2) PE | Patient level: ~67% (16 patients, 1,831 images) train; ~12% (3 patients, 610 images) 5-fold cross-validation; ~21% (5 patients, 600 images) test |
0.7 | - |
| Xing et al. [27] | Three-level cascaded encoder–decoder model based on convolution and multilayer perceptron (MLP) | ROI pleural line images | (1) Pleural line/ (2) Background | Patient level: ~87.7% (31 patients, 1,420 images) train with 5-fold cross-validation; ~12.3% (25 patients, 200 images) test. |
0.87 | - |
| Tan et al. [38] | Mask-RCNN and YOLACT | B-mode LUS images | (1) B-lines/ (2) Background | Patient level: ~80.2% (61 patients, 1,003 images) train; ~19.8% (15 patients, 382 images) test |
- | - |
Table 3.
Summary of object detection studies.
| Author | Model | Input | Classes | Validation |
mAP (IoU 0.5) |
Sensitivity | Precision |
| Xing et al. [28] | Faster R-CNN (ResNet-50) |
B-mode LUS images | Pleural line bounding box | Patient level: ~64% (39 patients, 3,000 images) train with 5-fold cross-validation; ~36% (22 patients, 1,930 images) test |
- | - | - |
| Bottino et al. [49] |
YOLO (CSPDarkNet53) |
B-mode LUS images 224x224 | B-lines bounding box | 80% (309 images) train; 20% (77 images) 5-fold cross-validation | - | 81.0% | 92.0% |
| Joseph et al. [29] | YOLOv5s [59] | B-mode LUS images 416x416 | Bounding box: (1) pleura/ (2) ribs/ (3) shadow/ (4) A-lines/ (5) B-lines/ (6) B-patches/ (7) pulmonary consolidations/ (8) air bronchograms | ~70% (570 images) train; ~20% (163 images) validation; ~10% (83 images) test | 66.0% | 68.5% | 67.0% |
| Tripathi et al. [39] | KeyNet | LUS image pairs 256x256x10: 10 channels generated by the RT-FPM acoustic feature map (5 for horizontal features + 5 for vertical features) | 10 keypoints: (i) Pleura (ii) A-lines (iii) B-lines |
1,024 image pairs train; 512 image pairs validation; 1000 images test | - | 99.0% | 83.0% |
Table 4.
Summary of studies that employed saliency maps.
| Author | Model | Input | Classes | Validation | AUC | Sensitivity | Specificity |
| van Sloun et al. [50] | CNN + Grad-CAM | B-mode LUS images 256x352x1 | (1) B-lines presence/ (2) B-lines absence | 67% (8 videos) train; 33% (4 videos) 3-fold cross-validation | 0.874 | 85.6% | 69.7% |
| Chaudhary et al. [32] | CNN (EfficientNetB0) + Grad-CAM | B-mode LUS images | (1) PE presence/ (2) PE absence | Patient level: 85% (668 patients, 266,670 images) train with 10-fold cross-validation; 15% (117 patients, 46,439 images) test | 0.939 | 85.9% | 89.3% |
| VanBerlo et al. [33] | CNN (EfficientNetB0) + Grad-CAM | M-mode LUS images 180x224 | (1) Lung sliding presence/ (2) Lung sliding absence | Patient level: 85% (614 patients, 2,535 videos) train with 10-fold cross-validation; 15% (124 patients, 540 videos) test | 0.973 | 93.5% | 87.3% |
| Kolarik et al. [37] | 3D CNN (Resnet3D-18) + Vanilla Saliency Map [62] and SmoothGrad [63] | B-mode LUS videos 30x30x3 | (1) Lung sliding presence/ (2) Lung sliding absence | Patient level: 70% (5,442 videos) train; 30% (2,332 videos) test | - | 93.60% | 78.53% |
| Ni et al. [40] | MEVAL CNN (ResNet50) + Grad-CAM | 3 channel images 641x395x3: (1) LUS images (2) Enhanced view via K-means clustering (3) Enhanced view via vertical linear adjustment |
(1) A-lines/ (2) B-lines/ (3) Pulmonary consolidations/ (4) PE | Patient level: 74% (2,751 patients) train with 5-fold cross-validation; 17% (688 patients) active learning test: 9% (527 patients) test | 0.9989 | 98.76% | 98.6% |
| Chen et al. [41] | CNN (ResNet) + Grad-CAM | B-mode LUS images | (1) A-lines/ (2)B-lines/ (3) Pulmonary consolidations/ (4) PE | 80% (4,436 images) train; 20% (1,109 images) test | 0.9976 | 98.27% | 99.41% |
| Arntfield et al. [34] | CNN (VGG16) + Grad-CAM | B-mode LUS images | (1) A-lines/ (2) B-lines | Patient level: 10-fold cross-validation; internal test; external test | 0.93 | 83.0% | 82.0% |
| Huang et al. [30] | CNN (NCA-ResNet) + Grad-CAM | B-mode LUS images 300×300 | (0) A-lines presence and B-lines absence/ (1) B-lines presence (separated 7 mm)/ (2) Confluent B-lines presence/ (3) Coalescent B-lines presence | Patient level: 80% (25 patients, 1,735 images) train; 20% (6 patients, 327 images) test | - | 90.43% | - |
| Pare et al. [51] | CNN (ResNet18) + Grad CAM | B-mode LUS images 224x224 | (0) B-lines absence/ (1) 1 or 2 B-lines (each occupies <10% of the field)/ (2) > 2 B-lines (each occupies <10% of the field) (3) B-lines occupy 10-49% of the field/ (4) B-lines occupy >50% of the field | Patient level: - Development (30 patients, 49,952 images): 80% train; 10% 10-fold cross-validation; 10% test - Evaluation (60 patients, 476 videos) |
0.967 | 96.3% | 92.4% |
| Erfanian Ebadi et al. [52] | 3DCNN + saliency maps | LUS videos 224×224x3 | (1) A-lines | 80% (1225 videos) train; 20% (306 videos) 5-fold cross-validation | 0.94 | 91.0% | - |
| (2) B-lines | 0.91 | 86.0% | - | ||||
| (3) Consolidations and/or PE | 0.96 | 92.0% | - |
Disclaimer/Publisher’s Note: The statements, opinions and data contained in all publications are solely those of the individual author(s) and contributor(s) and not of MDPI and/or the editor(s). MDPI and/or the editor(s) disclaim responsibility for any injury to people or property resulting from any ideas, methods, instructions or products referred to in the content. |
© 2026 by the authors. Licensee MDPI, Basel, Switzerland. This article is an open access article distributed under the terms and conditions of the Creative Commons Attribution (CC BY) license.
Copyright: This open access article is published under a Creative Commons CC BY 4.0 license, which permit the free download, distribution, and reuse, provided that the author and preprint are cited in any reuse.


