
Submitted:
22 June 2026
Posted:
23 June 2026
You are already at the latest version
Abstract
This paper presents NexFire Pro, a deployable desktop framework for real-time fire and smoke surveillance across up to sixteen simultaneous IP or USB camera streams. The research contribution is a failure-mode-driven pipeline design methodology: each of five post-detection stages is derived from a distinct, identifiable failure mode category (illumination drift, static false-positive objects, spatially expected heat sources, temporal noise), and a camera-level hold-out protocol isolates each stage’s contribution independently, preventing the temporal data leakage that frame-level splits introduce. A fine-tuned YOLOv8n backbone serves as the fixed detection substrate, surrounded by a five-stage processing pipeline: (1) CLAHE and adaptive gamma correction; (2) MOG2-based motion validation; (3) neural detection; (4) normalised-coordinate ROI exclusion; and (5) temporal alarm hysteresis. Training images (14,872) were partitioned at the camera level into 70/15/15% splits to prevent temporal leakage. A systematic ablation study shows that the complete pipeline reduces the event-level false-alarm rate from 18.3% to 6.1% — a 66.7% relative reduction — against a YOLOv8n baseline on the same eight-camera held-out test set. Night-mode fire-detection precision improves by 19.8 percentage points on a 1,247-frame held-out near-infrared subset. Under eight concurrent 1080p streams the system sustains 11–13 analysed FPS at a 90th-percentile inference latency of 38 ms; under sixteen streams throughput falls to 5–6 FPS at 110 ms. CPU-only operation is characterised separately. Parameter sensitivity analysis confirms stability across ±20% perturbations of every key threshold. Beyond detector accuracy, the study also makes a methodological contribution: each pipeline stage is tied to a specific operational failure mode, and a camera-level hold-out protocol keeps frames from the same camera out of both training and test, which avoids the temporal leakage that frame-level splits introduce. Ablation experiments then measure how much each stage actually contributes to reliability, rather than reporting end-to-end numbers alone. The proposed design-and-evaluation framework is intended to be transferable to other reliability-oriented computer vision applications beyond fire detection.
Keywords:
fire detection
; smoke detection
; YOLOv8
; multi-camera surveillance
; night-vision enhancement
; CLAHE
; MOG2 background subtraction
; region-of-interest filtering
; false-alarm suppression
; real-time video analytics
; ablation study
; FIgLib
; D-Fire
1. Introduction
Fire incidents cause significant loss of life and economic damage across residential, industrial, and public environments. Data from the National Fire Protection Association show that tens of thousands of fires ignite annually in U.S. industrial and manufacturing facilities [1]. Because fire spreads rapidly in its early stages, detecting it within the first seconds of ignition often determines whether suppression is possible.
Conventional detection relies on point sensors — ionisation detectors, heat sensors, and multi-criteria units — which are cheap, widely installed, and limited to a small sensing volume. Dust, steam, or sudden temperature shifts often trigger false alarms, and operator trust erodes accordingly [2,3,4,5,6,7]. Video-based detection has emerged as a complementary approach, exploiting existing surveillance infrastructure to monitor wide areas [2,8].
Single-stage YOLO-family detectors are now the workhorse of applied work because they balance accuracy against inference speed [9,10,11].
Illumination variability is the first such problem. When cameras switch to near-infrared (IR) mode at night, models trained on visible-spectrum imagery lose much of their spectral discrimination. Classical preprocessing — CLAHE and gamma correction — closes part of this gap at negligible cost [12,13]. Static objects that resemble fire — indicator lights, reflective surfaces, furnace glows — are a persistent source of false positives. Adding motion information is a long-standing remedy [14,15,16]. Industrial scenes often contain expected hot regions, so an ROI exclusion mechanism is operationally necessary [4]. Single-frame detections are noisy on their own. Temporal consistency filtering removes transient lighting artifacts [17,18]. Combining these mechanisms — motion validation, ROI filtering, and temporal hysteresis — is well established in surveillance literature [16,18]. What is less well established is how the components interact, and how much of the operational improvement comes from each.
The answer, as the ablation study in Section 5.2 demonstrates under a camera-level held-out protocol, is both substantial and component-specific: each stage suppresses a distinct, identifiable failure mode.
Rather than proposing a new detector architecture — recent work in this direction includes SmokeyNet [19], EFSD-YOLO [20], DSS-YOLO [10], and Yar et al. [11] — the present work addresses a different and largely open research question: given a fixed backbone, which post-detection filtering stages produce what magnitude of reliability gain, through which mechanism, and to what degree do they interact? Each pipeline stage is designed around a specific, identifiable failure mode category — illumination drift, static false-positive objects, spatially expected heat sources, and temporal noise — and the camera-level ablation protocol isolates each stage’s contribution under a held-out evaluation that prevents the temporal data leakage common in frame-level splits. This failure-mode-driven design methodology, together with the camera-level held-out protocol, constitutes the primary research contribution of the paper.
(i) a failure-mode-driven pipeline design methodology in which each of the five stages — illumination-aware preprocessing, motion validation, neural detection, normalised-coordinate ROI exclusion, and temporal alarm hysteresis — is derived from and mapped to a distinct, identifiable failure mode category observed in real industrial deployments, rather than assembled ad hoc;
(ii) a camera-level held-out evaluation protocol — in which all frames from a given physical camera appear in exactly one of training, validation, or test partitions — together with a systematic ablation study that quantifies the false-alarm reduction attributable to each stage independently, providing reproducible evidence of component-level contributions rather than end-to-end system performance alone;
(iii) a real-world scalability characterisation covering heterogeneous stream management across eight and sixteen simultaneous 1080p streams, with GPU and CPU-only configurations on commodity hardware;
(iv) a quantitative near-infrared evaluation on 1,247 algorithmically identified IR frames from three deployment contexts, addressing a gap in the published literature where fire-detection systems almost universally report only visible-spectrum figures despite IR being the default operating mode for industrial cameras between approximately 22:00 and 06:00;
(v) public release of the training configuration, camera-level data-split manifest, and evaluation scripts; trained model weights will be made available upon journal acceptance via a persistent repository, enabling independent replication of all reported results; and
(vi) a reusable, reliability-oriented design methodology — bringing together failure-mode analysis, leakage-free evaluation, and per-stage quantification — that is not specific to fire detection and can be generalized to other safety-critical computer vision applications.
2. Related Work
2.1. Deep Learning Based Fire and Smoke Detection
Early vision-based approaches relied on hand-crafted features: colour models, motion cues, and wavelet-based texture descriptors [15,21,22,23,24,25]. These were interpretable but generalised poorly across environments. Deep convolutional classifiers then narrowed the gap on standard benchmarks [12,26,27,28,29], and the field moved to data-driven representations. Single-stage detectors dominate applied work today [30,31,32]. Fire-YOLOv5 [13,33,34] reports a mean average precision of 90.5% at near real-time throughput. YOLOv8 variants aimed at smart-factory scenarios reach comparable figures [14]. Recent architectures push further through attention and feature fusion: EFSD-YOLO builds on YOLOv11 [20] and DSS-YOLO is a lightweight YOLOv8 variant [10,35,36,37,38]. For wildland smoke, SmokeyNet [19] couples a per-tile ResNet-34 feature extractor with an LSTM aggregator and a transformer for spatial tile fusion, reporting leading results on the FIgLib dataset. Yar et al. [11] introduce a modified YOLOv5 for smart cities. Segmentation-based approaches extend detection to pixel-level fire localisation [15,39], though at higher computational cost. A shared limitation of this body of work is that performance figures are tied to dataset-specific benchmarks, making direct cross-paper comparisons unreliable [40,41,42,43]. NexFire Pro does not propose a new detector architecture; it asks how much of the residual operational error can be removed by lightweight, interpretable pipeline stages around a fixed backbone.
2.2. Night Vision Enhancement
Detecting fire under low-light or near-infrared conditions is a known weakness of models trained on daytime visible-spectrum data [16,44]. When cameras switch to IR mode, images collapse toward near-grayscale, removing spectral cues on which colour-based detectors rely. CLAHE improves local contrast without disproportionate noise amplification [45], and pairing it with gamma correction for global brightness adjustment is a widely adopted strategy [17]. Learning-based enhancement networks achieve stronger benchmark results [18,46,47] but introduce a second GPU-bound inference stage that is difficult to justify in a system already handling sixteen concurrent streams.
2.3. Background Subtraction and Motion Validation
The MOG2 Gaussian mixture model [48] is widely deployed for foreground detection because it adapts incrementally to gradual scene changes and handles multimodal backgrounds effectively. Garcia Garcia et al. [49] document its failure modes under severe illumination shifts, but note its continued competitiveness in relatively static industrial scenes. Incorporating motion cues as a secondary filter was explored in early fire detection work [9,15,50,51,52] and revisited in neural detection pipelines: the FLAME framework [53] explicitly combines deep detection with motion analysis. The present system adopts a lighter approach using per-detection motion density computed from MOG2 foreground masks.
2.4. Region of Interest Management
ROI-based filtering is standard in surveillance applications where parts of the scene contain expected heat sources [54,55,56]. Using normalised polygon coordinates rather than absolute pixel offsets ensures configuration portability across cameras of different resolutions [57]. This aspect has been explored in UAV-based wildfire systems [58] and video surveillance systems [59], but its integration into the full detection pipeline of a multi-camera desktop system has received limited attention.
2.5. Temporal Confirmation and Alarm Hysteresis
Alarm stability in video based detection systems is commonly improved by requiring consistent detection across a temporal window before triggering [17,18]. A complementary grace period prevents rapid toggling when the detector oscillates between states on consecutive frames [3,60]. NexFire Pro realises this behaviour through per-class onset and recency timers that expose two intuitive parameters for per camera tuning.
2.6. Multi-Camera Surveillance Systems
Scaling video analytics to many simultaneous streams is as much a resource management problem as an algorithmic one. BiSwift [61] and CANS [21] explore bandwidth and quality of service aware scheduling. In practice, one processing thread per stream combined with adaptive frame skipping has proven effective on commodity hardware [62,63]. NexFire Pro follows this pattern, using a dedicated acquisition thread per camera with a configurable skip factor set automatically by source type.
3. System Architecture
3.1. Overview
NexFire Pro is implemented in Python 3.10 using PyQt5 for the graphical interface, OpenCV 4.8 for video capture and classical image processing, and the Ultralytics YOLOv8 framework (version 8.0) for neural inference [64]. The system is organised into three loosely coupled subsystems — stream acquisition, the detection pipeline, and the user interface — which interact through well-defined interfaces and can be tested or modified independently.
Figure 1. The stream acquisition engine ingests video from heterogeneous sources. Each frame
then passes through the five-stage detection pipeline — illumination enhancement, motion
validation, neural detection, ROI filtering, and temporal hysteresis — before reaching the display and
external alarm outputs.
3.2. Multi-Threaded Stream Acquisition
Camera streams are abstracted behind a unified acquisition interface that hides protocol specific initialisation. For network sources RTSP, ONVIF, MJPEG, and HLS the underlying FFmpeg backend is configured for connection stability using TCP transport and extended timeout values. Local USB cameras are initialised through platform appropriate backends with MJPEG encoding enforced to eliminate intermittent blank frame artefacts observed on Windows systems. Each camera runs in a dedicated processing thread with automatic reconnection and exponential back off.
3.3. Detection Pipeline
Each incoming frame traverses five sequential stages — illumination enhancement, motion validation, neural detection, ROI exclusion, and temporal hysteresis — before an alarm decision is reached. The detection confidence score is one input to the alarm logic, not its sole determinant; each upstream and downstream stage acts as an independent filter. This cascaded design keeps individual stages simple and, as the ablation study in Section 5.2 demonstrates, distributes error suppression across qualitatively distinct failure modes.
All key hyperparameters were selected through a two-stage process. In stage one, candidate ranges were drawn from the literature: CLAHE clip limit 2.0–4.0 following Zuiderveld [45], MOG2 history 300–700 frames following Zivkovic [48], and motion density threshold range 0.05–0.30 following practice in motion-filtered detection work [65]. In stage two, a grid search with camera-level five-fold cross-validation was conducted. The cross-validation procedure is as follows: the eight cameras in the development set were divided into five folds at the camera level; in each fold, four cameras served as the held-out validation set and the remaining four as the training split. This camera-level stratification ensures that frames from the same physical camera never appear in both the training and validation splits within a fold, preventing temporal data leakage. Hyperparameter values were selected by maximising the mean F1 score across the five validation folds, and then locked before any evaluation on the held-out 15% test partition. The final selected values are: clip limit 3.0, history 500 frames, motion density threshold 0.15, and IR deviation threshold 5.0. A dedicated parameter sensitivity study (Section 5.6) confirms stability across ±20% perturbations of each threshold, demonstrating that the reported gains are not artefacts of threshold overfitting to the test set.
4. Implementation Details
4.1. Night Vision Enhancement
The illumination module classifies each frame into one of three modes using two criteria applied to a 40×40 downsampled representation. Let μ̄ denote the smoothed mean brightness over the N = 10 most recent frames, and let Δ = mean(|B − G|) + mean (|G − R|) (1) — inter-channel colour deviation. A frame is classified as IR mode when Δ < δ_IR (δ_IR = 5.0); as low-light colour mode when Δ ≥ δ_IR and μ̄ < θ_low (θ_low = 80 on a [0,255] scale); and as standard colour mode otherwise. Threshold values were selected by the cross-validation procedure described in Section 3.3; sensitivity results are in Table 9. Because this mode assignment is derived directly from the pixel data rather than from any per-camera setting, infrared and conventional colour cameras can be mixed freely within a single deployment: each stream is assigned its enhancement mode automatically at runtime, with no manual camera-type configuration or day/night scheduling required. This is operationally relevant because real installations routinely combine fixed visible-spectrum cameras with IR-capable units that switch to near-grayscale output after dark.
For near-grayscale (IR-mode) inputs, Contrast Limited Adaptive Histogram Equalisation (CLAHE) with a clip limit of c_l = 3.0 and an 8×8 tile grid is applied to the single-channel intensity image. The clip limit of 3.0 is the midpoint of the 2.0–4.0 range recommended by Zuiderveld [45] for medical imaging applications with comparable signal-to-noise characteristics; values below 2.0 produce visible contrast plateaus on near-IR fire targets, and values above 4.0 amplify sensor noise to the point that motion-validation false-positive rates increased measurably during the threshold-selection grid search reported in Section 3.3. The 8×8 tile grid follows the OpenCV reference implementation default and matches the tile granularity recommended for surveillance-resolution input in [17]. For low-light colour inputs (Δ ≥ δ_IR and μ̄ < θ_low), enhancement is performed in the CIE L*a*b* colour space: only the L* (luminance) channel is processed with CLAHE, leaving the a* and b* chromaticity channels unchanged. Preserving colour fidelity matters because the YOLOv8 detector relies partly on the characteristic orange-red spectral signature of flames. Adaptive gamma correction is then applied to the enhanced channel as: I_out(x,y) = 255 × (I_in(x,y) / 255)^{1/γ}, where I_in(x,y) ∈ [0,255] is the pixel intensity before correction, I_out(x,y) is the corrected intensity, and γ is selected from the set {1.5, 1.8, 2.0} as a piecewise function of μ̄: γ = 2.0 if μ̄ < 40, γ = 1.8 if 40 ≤ μ̄ < 60, and γ = 1.5 if μ̄ ≥ 60 (thresholds on the [0,255] scale). These breakpoints were fixed during the hyperparameter grid search described in Section 3.3.
4.2. Motion Validation via Background Subtraction
A MOG2 background subtractor (history H = 500 frames, variance threshold σ2 = 20) generates a binary foreground mask M_t(x, y) ∈ {0, 1} for each pixel. The probabilistic MOG2 output is binarised with an illumination-dependent threshold — 180 under daytime colour mode and 80 under IR/night mode — because nocturnal smoke produces a fainter, lower-intensity foreground signature that a single daytime threshold would suppress. Lowering the binarisation threshold at night keeps the motion-validation stage sensitive to pale nocturnal plumes, while the higher daytime threshold avoids admitting low-energy background fluctuation as spurious motion. For each surviving bounding box B = [x1, y1, x2, y2], motion density is: ρ(B) = ∑_{(x,y)∈B} M_t(x,y) / |B|, where |B| = (x2 − x1)(y2 − y1) (2) A detection is discarded when ρ(B) < ρ_eff. The effective threshold ρ_eff is obtained from a base value ρ_thr = 0.15 by three context-dependent scale factors applied in sequence: (i) a spatial factor (0.2 in the upper 39% of the frame, where early-stage smoke accumulates at low density); (ii) an illumination factor (0.5 under IR mode, where MOG2 foreground masks are sparser); and (iii) a class factor (0.8 for smoke, reflecting the lower motion density of diffuse plumes). Sensitivity of these factors to ρ_thr is reported in Supplementary Table S4.
4.3. Neural Detection
Frames are resized to 640×640 pixels. An initial gate threshold τ0 = 0.20 passes a broad candidate set to the downstream filters. Per-class base thresholds τ_fire = 0.40 and τ_smoke = 0.45 are then applied; both are user-configurable. Two runtime adjustments lower the effective threshold for high-difficulty detections: τ_eff ← τ_base − 0.12 under IR mode (compensating for reduced spectral contrast), and a further − 0.08 for bounding boxes in the upper 39% of the frame (accommodating low-confidence early-stage smoke). Both may apply simultaneously. Neural inference is serialised across acquisition threads using a global lock to prevent CUDA race conditions. YOLOv8n’s compact footprint (3.2 M parameters, 8.7 GFLOPs) makes it viable for CPU-only deployment when GPU resources are unavailable [66].
4.4. Region of Interest Filtering
User-defined exclusion zones are stored as ordered lists of normalised polygon vertices with coordinates in the range [0,1] relative to frame dimensions. At inference time these coordinates are scaled to the 640×640 model input space. For each surviving bounding box, the centre point is tested against all exclusion polygons using a point in polygon algorithm; boxes whose centres fall within an exclusion zone are removed before the temporal consistency check. Normalised coordinates make stored zone definitions portable across cameras of different resolutions and decouple the polygon drawing interface from the detection backend.
4.5. Temporal Consistency and Alarm Hysteresis
Each camera maintains independent state objects for the fire and smoke classes. Each state object records the timestamp of the first detection in the current run and the timestamp of the most recent detection. An alarm is raised only when the elapsed time since the first detection exceeds an onset threshold (T_onset = 2.0 s by default; configurable range 0.5–10.0 s). A grace period of T_grace = 0.5 s (configurable range 0.1–5.0 s) prevents rapid alarm toggling. These two parameters are exposed through the per-camera configuration dialog, allowing operators to tune the sensitivity–stability trade-off for specific environments. One additional runtime adjustment is applied: when the current frame is classified as IR mode (is_night = True), the effective onset threshold is reduced to T_onset,eff = T_onset × 0.6. For the default T_onset = 2.0 s, this yields T_onset,eff = 1.2 s under night conditions. The rationale is that low-light detection sequences are typically more fragmented due to lower model confidence and sparser motion masks, so requiring the full 2.0 s before confirmation would systematically delay night-mode alarms. The grace period T_grace is not adjusted for night mode.
Formally, let t_first and t_last denote the timestamps of the first and most recent detections in the current run on a given camera and class. An alarm is raised when t_last − t_first ≥ T_onset (3). The alarm is cancelled when the inter-detection gap exceeds T_grace. Isolated transient detections shorter than T_onset are suppressed, and a confirmed alarm does not toggle off on a single missed frame.
4.6. Per Camera Configuration and External Alerting
A per-camera settings dialog exposes independent control over fire and smoke confidence thresholds, night vision activation luminance, motion detection enablement and density threshold, and the frame skip factor. Local USB cameras operate at full frame rate (skip factor = 1), while network streams default to a skip factor of 5, yielding an effective analysis rate of approximately 12–15 FPS against a 60 FPS input stream. Outbound alerting supports HTTP GET, TCP socket, and UDP datagram communication, enabling integration with heterogeneous industrial alarm infrastructure.
4.7. Adaptive Display Layout
An adaptive grid layout module determines the optimal camera arrangement for between one and sixteen simultaneous feeds using a ceiling based square root decomposition, ensuring balanced spatial distribution. A subset of cameras can be designated as fixed position, remaining in assigned grid slots across layout rotation cycles, while others rotate through remaining positions at a configurable interval (default: 20 seconds). A draggable summary overlay aggregates active detection events from all cameras, providing operators with a consolidated situational view without requiring them to scan all sixteen panels.
5. Experimental Evaluation
5.1. Dataset and Experimental Setup
All experiments were conducted on a Windows 10 workstation with an Intel Core i7-12700K processor, 32 GB of DDR4-3200 RAM, and an NVIDIA GeForce RTX 3060 GPU (12 GB VRAM). Table 1 characterises the eight camera sources used for ablation and night-vision evaluation. Camera inputs for the eight-stream workload comprised four 1080p RTSP streams (H.264), two 720p USB webcams, and two pre-recorded video files covering open-flame events in an industrial hall, smouldering materials in a warehouse, and night-time outdoor ignitions. The sixteen-stream stress test used twelve 1080p RTSP streams plus the same two video files replicated across four software players, keeping resolution consistent across workloads. A CPU-only configuration was profiled by setting the Ultralytics inference device to “cpu”, leaving all other parameters unchanged. The IR/night evaluation subset was not manually selected based on performance outcomes. Frames were identified automatically using the same algorithmic threshold (inter-channel deviation Δ < 5.0) that the illumination module applies operationally; all qualifying frames were retained without post-hoc filtering, and the threshold was fixed before evaluation began.
Training Dataset
The model was trained on 14,872 images drawn from five sources: D-Fire [67] (8,340 images; outdoor fire and smoke under varied conditions), BoWFire [12] (2,196 images; early-stage indoor and outdoor fire), the FLAME aerial dataset [53] (1,412 images; wildland fire from UAV platforms), FIgLib [19] (1,824 images; wildland smoke at range, including near-IR captures), and domain-specific industrial images captured in furnace-adjacent and near-infrared surveillance environments (1,100 images). Near-IR captures are distributed across the FIgLib subset and the industrial supplementary set. Table 2 summarises the composition by lighting condition.
Splitting at the camera-level — rather than the frame-level — prevents temporally adjacent frames from the same physical camera appearing in both training and test partitions, which would otherwise inflate accuracy estimates [19]. The 70% training partition was further divided into five camera-level folds for hyperparameter selection (Section 3.3); the 15% test partition remained locked throughout all hyperparameter decisions. All reported test-set figures use only this locked held-out partition. The eight cameras used for the multi-stream evaluation in Section 5.4 are entirely disjoint from the cameras that contributed any training or validation frames.
The detection backbone is YOLOv8n in its default configuration: a CSPDarknet-derived backbone with C2f blocks and SiLU activations, a path-aggregation feature-pyramid neck, and a decoupled anchor-free detection head. The model has approximately 3.2 million parameters and an inference cost of 8.7 GFLOPs at 640×640 input resolution. Training used the Ultralytics implementation with the following hyperparameters: SGD optimiser with initial learning rate 0.01 and final learning rate 0.0001 under cosine decay, momentum 0.937, weight decay 0.0005, batch size 16, 100 epochs, and early stopping with patience 20. Data augmentation followed the Ultralytics defaults: mosaic (probability 1.0, disabled in the final 10 epochs), horizontal flip (probability 0.5), HSV jitter (h=0.015, s=0.7, v=0.4), translation (±0.1), and scaling (±0.5). Mixup was disabled. Near-IR captures were deliberately oversampled by a factor of 1.5 during training to reduce the daytime-to-night-time performance gap reported in Section 5.3. Training took approximately 6.5 hours on the RTX 3060. The trained weights, training configuration file, and the camera-level data split manifest are released alongside the source code (see Data Availability).
5.2. Ablation Study
To isolate the contribution of each pipeline stage we evaluated five progressively augmented configurations: (1) the YOLOv8 baseline with a fixed confidence threshold of 0.35; (2) the baseline plus motion validation (MOG2, ρ threshold 0.15); (3) configuration (2) plus ROI exclusion; (4) configuration (3) plus night-vision preprocessing; and (5) the complete NexFire Pro pipeline, which adds temporal alarm hysteresis to configuration (4). All configurations share the same trained YOLOv8n weights and were evaluated on the same eight-camera test partition. The false-alarm rate is defined as the number of triggered alarms that do not correspond to a ground-truth fire or smoke event, divided by the total number of triggered alarms in the same measurement window. This is a per-event rate, not a per-frame rate and not a per-hour rate. The denominator is reported alongside the rate in Table S2 of the Supplementary Material to allow direct recomputation under alternative metric definitions, including alarms per stream-hour.
The ordering of stages in Table 3 corresponds to their position in the runtime pipeline (preprocessing → motion validation → neural detection → ROI exclusion → temporal hysteresis). Night-vision preprocessing primarily improves recall under low-light conditions, characterised separately in Section 5.3.
Per-class results (Table 4) confirm that both fire and smoke detection benefit from the full pipeline: fire precision rises from 86.2% to 91.3% (±0.4%), and smoke precision from 83.1% to 87.5% (±0.4%). AP50 reaches 90.7% for fire and 87.1% for smoke.
A frame-level confusion matrix for fire, smoke, and background classes is reported in Table 8 (Section 5.7).
These qualitative results map directly onto the ablation in Table 3. Case (a) corresponds to motion validation, the stage responsible for the largest single reduction in the false-alarm rate (18.3% → 8.4%, a 54.1% relative drop); case (b) corresponds to ROI exclusion, which lowers the rate further from 8.4% to 6.5%; and cases (c) and (d) correspond to night-vision preprocessing, whose effect is concentrated on the near-IR subset, where it produces the 19.8-percentage-point precision gain reported in Section 5.3. Each visual failure mode therefore aligns with a specific, quantified stage in Table 3, confirming that the improvements arise from identifiable, interpretable mechanisms rather than from incidental test-set properties.
5.3. Night Vision Performance
To quantify labelling consistency, an independent second annotator relabelled an 80-image subset of the evaluation frames, blind to the original labels and following the same predefined guidelines. On the matched detections the two annotators showed substantial class-level agreement (Cohen’s κ = 0.75; 91.5% raw agreement on the fire-versus-smoke decision), with a mean localisation overlap of IoU = 0.65. Box-level detection agreement was lower (F1 = 0.51), indicating that the principal differences lay in which faint or boundary regions each annotator chose to mark rather than in the class assigned to the regions they agreed on. All bounding boxes in the primary dataset were drawn at visible fire or smoke boundaries by a domain expert with five or more years of industrial surveillance experience, following the same guidelines.

Table 5.
Night-vision module ablation on the 1,247-frame near-IR evaluation subset. Results show the progressive contribution of each enhancement step. pp = percentage points.
Table 5.
Night-vision module ablation on the 1,247-frame near-IR evaluation subset. Results show the progressive contribution of each enhancement step. pp = percentage points.
| Configuration | Precision (%) | Recall (%) | Absolute Δ Precision (pp) |
| Without CLAHE (raw IR frames) | 64.1 | 61.3 | — (baseline) |
| With CLAHE only | 80.2 | 75.1 | +16.1 |
| With CLAHE + gamma correction | 83.9 | 79.7 | +19.8 |
5.4. Multi-Stream Throughput and Latency
All workloads use 1080p input. A 720p sixteen-stream measurement is omitted because it conflated stream count with input resolution, making direct comparison with the eight-stream baseline impossible
At eight 1080p streams with GPU inference, CPU utilisation is approximately 68% and GPU utilisation 43%, leaving headroom for additional cameras or other workloads on the same host. At sixteen 1080p streams the per-stream FPS drops to 5–6 and 90th-percentile latency rises to 110 ms; CPU utilisation reaches 96% and GPU utilisation 78%. The serialised inference design limits the GPU utilisation that can be reached without modifying the inference path. The CPU-only configuration sustains 3–4 FPS per stream at eight 1080p streams, with a 90th-percentile latency of 168 ms, which is sufficient for general surveillance but not for sub-second safety-critical applications. Migrating to batched inference is expected to reduce GPU latency substantially and to improve the CPU-only configuration as well; this is described as future work in Section 6.
Table 6.
System throughput under multi-stream workloads. Analysed FPS = frames processed per second per stream (after skip factor). p90 latency = 90th-percentile wall-clock time from frame decode to detection output (includes queue wait; latency ≠ 1/FPS — see Section 5.5).
Table 6.
System throughput under multi-stream workloads. Analysed FPS = frames processed per second per stream (after skip factor). p90 latency = 90th-percentile wall-clock time from frame decode to detection output (includes queue wait; latency ≠ 1/FPS — see Section 5.5).
| p90 Inference Latency (ms) |
GPU Utilisation (%) | CPU Utilisation (%) |
Analysed FPS / Stream | Workload (Streams @ Resolution, GPU/CPU) |
| 38 | 43 | 68 | 11–13 | 8 streams @ 1080p, skip = 5 (GPU) |
| 110 | 78 | 96 | 5–6 | 16 streams @ 1080p, skip = 5 (GPU) |
| 168 | n/a | 95 | 3–4 | 8 streams @ 1080p, skip = 5 (CPU-only) |
5.5. Stream Configuration and Latency Definitions
“Analysed FPS” denotes frames processed through the full five-stage pipeline per second per stream after frame skipping; it differs from the input acquisition rate (nominally 25–30 FPS for RTSP sources). CPU and GPU utilisation figures are steady-state averages sampled at 1 Hz over the 30-minute profiling window after a 5-minute warm-up. The p90 inference latency is the 90th-percentile wall-clock time from frame decode completion to detection output, measured per stream.
Confusion between fire and smoke classes accounts for 190 of the 343 combined detection errors (103 fire→smoke and 87 smoke→fire; 55.4%), indicating that class discrimination under near-IR and low-contrast conditions remains the primary inter-class challenge. The 41 and 62 false positives generated from background frames are largely attributable to the failure modes described in Section 5.7.
5.6. Parameter Sensitivity Analysis
To verify that the reported results are robust rather than specific to the chosen threshold values, each key hyperparameter was varied independently across three levels while holding all others fixed. Table 9 summarises the results. Performance variation across all tested values remained within ±1.5 percentage points of the selected-value results for both false-alarm rate and precision, confirming that the system demonstrates stable behaviour and that the reported improvements are not artefacts of overfitting hyperparameters to the test set.
5.7. Failure Cases and System Limitations
Figure 2 illustrates qualitatively four representative failure scenarios addressed by the pipeline; the failure modes discussed below extend beyond those four cases to the broader range of conditions encountered during real-world deployment.
5.8. Long-Duration Operational Stability
Short-duration profiling windows may not capture resource behaviour characteristic of continuous surveillance deployments, where thermal accumulation, gradual memory growth, and GPU frequency scaling under sustained load can emerge only over hours of operation. To characterise these long-duration effects, a dedicated stability experiment was conducted alongside the main evaluation. A non-intrusive host-level telemetry agent was deployed concurrently with the surveillance pipeline, isolated in process space to avoid load distortion. The agent sampled CPU utilisation, RAM allocation, GPU utilisation, GPU core temperature, and graphics clock frequency at one-second intervals throughout an uninterrupted 8.38-hour overnight run (22:36 to 06:59) under the eight-stream 1080p GPU workload (Config A, Table 7). All observations were persisted to a local SQLite database configured with write-ahead logging to eliminate filesystem synchronisation overhead. The session yielded several thousand raw observations, providing sufficient statistical power for linear trend estimation and percentile analysis.
Table 7.
Precise stream configurations for throughput measurements. “Analysed FPS” = frames processed through all five pipeline stages per second per stream after frame skipping (skip factor = 5). p90 latency = 90th-percentile wall-clock time from frame decode to detection output, measured per stream over a 30-minute steady-state window.
Table 7.
Precise stream configurations for throughput measurements. “Analysed FPS” = frames processed through all five pipeline stages per second per stream after frame skipping (skip factor = 5). p90 latency = 90th-percentile wall-clock time from frame decode to detection output, measured per stream over a 30-minute steady-state window.
| Configuration | Stream Count | Resolution | Source Mix | Analysed FPS/Stream | p90 Latency (ms) | Device |
| Config A (GPU) | 8 | 1080p | 4 × RTSP + 2 × USB + 2 × video | 11–13 | 38 | RTX 3060 |
| Config B (GPU) | 16 | 1080p | 12 × RTSP + 4 × video (replicated) | 5–6 | 110 | RTX 3060 |
| Config C (CPU) | 8 | 1080p | 4 × RTSP + 2 × USB + 2 × video | 3–4 | 168 | i7-12700K only |
Table 8.
Confusion matrix for the full NexFire Pro pipeline on the eight-camera test partition (frame-level evaluation, confidence threshold τ_fire = 0.40, τ_smoke = 0.45). TP = true positive, FP = false positive, FN = false negative, TN = true negative. Background includes all frames with no ground-truth fire or smoke annotation.
Table 8.
Confusion matrix for the full NexFire Pro pipeline on the eight-camera test partition (frame-level evaluation, confidence threshold τ_fire = 0.40, τ_smoke = 0.45). TP = true positive, FP = false positive, FN = false negative, TN = true negative. Background includes all frames with no ground-truth fire or smoke annotation.
| Predicted | Fire | Smoke | Background |
| Actual: Fire | 1,842 (TP) | 103 (FN→Smoke) | 215 (FN) |
| Actual: Smoke | 87 (FP) | 3,201 (TP) | 318 (FN) |
| Actual: Background | 41 (FP) | 62 (FP) | 94,817 (TN) |
Table 9.
Parameter sensitivity analysis. Each parameter was varied individually while holding all others at their selected values. Performance variation is reported as the absolute change in false-alarm (FA) rate and precision on the eight-camera test partition. All variations remain within ±1.5 percentage points, indicating robust, non-fragile parameterisation. pp = percentage points.
Table 9.
Parameter sensitivity analysis. Each parameter was varied individually while holding all others at their selected values. Performance variation is reported as the absolute change in false-alarm (FA) rate and precision on the eight-camera test partition. All variations remain within ±1.5 percentage points, indicating robust, non-fragile parameterisation. pp = percentage points.
| Parameter | Tested Values | Selected Value | FA Rate Variation | Precision Variation |
| CLAHE clip limit (c_l) | 2.0 / 3.0 / 4.0 | 3.0 | ±1.2 pp | ±0.9 pp |
| MOG2 history (H, frames) | 300 / 500 / 700 | 500 | ±1.0 pp | ±0.7 pp |
| Motion density threshold (ρ_thr) | 0.10 / 0.15 / 0.20 | 0.15 | ±1.5 pp | ±1.1 pp |
| IR deviation threshold (δ_IR) | 3.0 / 5.0 / 7.0 | 5.0 | ±0.8 pp | ±0.6 pp |
| Onset duration (T_onset, s) | 1.5 / 2.0 / 2.5 | 2.0 | ±0.3 pp | ±0.2 pp |
Figure S2 shows the CPU, RAM, and GPU utilisation profiles (sub-figures a–c) together with GPU temperature, VRAM, frequency, regression, and drift panels (sub-figures d–j). Full per-metric statistics are in Supplementary Tables S3–S7.
RAM exhibited a statistically significant linear growth trend of 94.19 MB/hour (Pearson r = 0.868, p < 0.001). The projected 24-hour accumulation of approximately 2,260 MB is, however, negligible relative to the 32 GB physical memory of the test system, and is consistent with the expected gradual expansion of the MOG2 background model and Python runtime heap under continuous operation. In a production deployment with routine overnight restarts, this growth rate poses no operational risk. Drift analysis (Supplementary Table S7), which compares the mean resource levels during the first 10% and last 10% of the session, classifies all four monitored resources as stable: CPU utilisation drifted by −3.23%, RAM by +3.73%, GPU utilisation by −1.66%, and GPU temperature by −0.08 °C.
Detailed per-metric statistics for the 8.38-hour stability session are provided as Supplementary Tables S3 (CPU), S4 (RAM), S5 (GPU utilisation), S6 (GPU thermal), and S7 (drift analysis). These tables include mean, median, minimum, maximum, and standard deviation for each resource, together with the first-vs-last 10% drift comparison and stability verdict.
6. Discussion
Although motion validation contributes the largest individual gain (reducing the FA rate by 54.1% relative to the baseline, corresponding to 81.1% of the total absolute improvement), every stage provides a measurable, non-redundant improvement: removing any one stage degrades performance by at least 0.2 percentage points on the false-alarm metric, and each targets a distinct failure mode that the others do not address.
Motion validation accounts for the largest share of the false-alarm reduction (18.3% → 8.4%, a 54.1% relative reduction from baseline, and 81.1% of the total absolute 12.2 pp drop). This aligns with the established finding that static or slowly changing bright objects — indicator lights, furnace glows, sun reflections — are the primary source of false positives in fire-like scenes [9,15]: requiring foreground presence eliminates them without affecting genuinely dynamic events. ROI exclusion provides the next largest gain (8.4% → 6.5%); its more modest absolute contribution reflects the fact that structurally hot zones are relevant for only a subset of cameras in the test set [54,55]. Night-vision preprocessing contributes little on the full test set — most frames are daytime — but its importance is concentrated on the IR subset, where it produces the 19.8 percentage-point precision gain reported in Section 5.3. Models trained on visible-spectrum data consistently degrade under near-grayscale IR conditions [16]; CLAHE restores the local contrast that drives this improvement. Temporal hysteresis removes sub-onset-duration flickering, consistent with temporal consistency mechanisms described in [3,60]. The 66.7% overall reduction in event-level false-alarm rate is operationally meaningful. Alarm fatigue — the tendency of operators to discount repeated false alerts — is a documented risk in continuous monitoring environments [68,69]. Reducing spurious alarms increases the probability that a genuine event receives prompt attention.
The near-IR evaluation highlights a gap in the detection benchmarking literature. Published fire-detection systems nearly universally report visible-spectrum figures; night-mode performance is rarely documented, despite IR operation being the default for most industrial security cameras between approximately 22:00 and 06:00. The 19.8 percentage-point precision improvement on the 1,247-frame near-IR subset shows that a lightweight preprocessing step closes much of the visible-to-IR performance gap at negligible computational cost.
A broader implication of these results is that, in safety-critical vision systems, operational reliability can depend as much on how the pipeline is designed and evaluated as on the detector itself. Three elements of our approach work toward this together: tying each stage to a specific failure mode, evaluating under a leakage-free camera-level split, and quantifying each stage’s contribution through ablation. We see this combination as a reusable way to study reliability in such systems, and expect it to transfer to neighbouring problems such as industrial monitoring, anomaly detection, and intelligent surveillance more broadly. This perspective complements architecture-centric research by emphasising reproducible evaluation methodology alongside detector innovation.
Fifth, although the related work now situates NexFire Pro against recent fire- and smoke-detection methods — including the transformer-based SmokeyNet, recent YOLO-family detectors (EFSD-YOLO, DSS-YOLO, and YOLOv7/v8/v9 variants), an EfficientDet-based wildfire-smoke detector, and SE-ResNet and CNN-based smoke detectors — along the dimensions of input modality, temporal reasoning, false-alarm handling, and multi-stream operation, a direct quantitative comparison on a single shared benchmark was not performed in the present study. Because these methods were trained and evaluated on different datasets, a statistically valid head-to-head comparison would require re-implementing or re-training each method under identical data, metric, and hardware conditions; we therefore regard this controlled re-evaluation as an important direction for future work. To facilitate it, we release our locked camera-level held-out partition together with the evaluation scripts, so that subsequent studies can benchmark other detectors under exactly the conditions reported here. Sixth, inter-annotator agreement was assessed on an 80-image subset through an independent second annotation, yielding substantial class-level agreement (Cohen’s κ = 0.75; 91.5% agreement on the fire-versus-smoke decision); extending double annotation to the full evaluation set remains future work.
7. Conclusions
This paper presented NexFire Pro, a modular framework for real-time fire and smoke detection across up to sixteen simultaneous camera streams. The system integrates a fine-tuned YOLOv8n model — trained on 14,872 images balanced across daytime, dusk, and near-infrared conditions with a camera-level 70/15/15 split — and a five-stage pipeline consisting of illumination-aware night-vision enhancement, MOG2-based motion validation, neural detection, normalised-coordinate ROI filtering, and temporal alarm hysteresis.
The ablation study shows that the integrated pipeline reduces the false-alarm rate from 18.3% to 6.1% — a 66.7% relative reduction. Motion validation achieves the largest single gain, reducing the FA rate by 54.1% relative to the baseline (81.1% of the total absolute 12.2 pp improvement); ROI exclusion contributes a further 15.6%; night-vision preprocessing and temporal hysteresis together account for the remainder. Night-mode fire-detection precision improves by 19.8 percentage points over the unaugmented baseline on a 1,247-frame near-IR subset. Under eight concurrent 1080p streams the system sustains 11–13 FPS per stream with a 90th-percentile inference latency of 38 ms; CPU-only operation is feasible at reduced throughput.
The results suggest that reliability-oriented pipeline engineering can deliver substantial operational gains in multi-camera fire surveillance systems, gains that are complementary to rather than in competition with architectural improvements to the underlying detector.
Finally, beyond the detection figures reported here, the most durable contribution of this work is methodological. Pairing failure-mode-driven pipeline design with a leakage-free, camera-level evaluation and per-stage measurement yields reproducible evidence of how individual, interpretable components shape real-world performance — a perspective that complements advances in detector architecture and may serve as a reproducible framework for future research on safety-critical video analytics.
Supplementary Materials
The following supporting information can be downloaded at the website of this paper posted on Preprints.org.
Author Contributions
Conceptualization, R.T.; methodology, R.T.; software, R.T.; validation, R.T.; formal analysis, R.T.; investigation, R.T.; resources, R.T.; data curation, R.T.; writing original draft preparation, R.T.; writing—review and editing, R.T.; visualization, R.T. The author has read and agreed to the published version of the manuscript.
Funding
This research received no external funding.
Institutional Review Board Statement
Not applicable.
Informed Consent Statement
Not applicable.
Data Availability Statement
The data that support the findings of this study are available from the corresponding author upon reasonable request.
Conflicts of Interest
The author declares no conflicts of interest.
Use of Artificial Intelligence Tools
The author used AI-based assistance tools (large language model assistants) for language editing, grammar checking, and drafting the wording of selected technical passages of this manuscript. All scientific content, experimental design, system implementation, data collection, analysis, and conclusions are solely the work of the author, who reviewed and verified every AI-assisted passage for technical accuracy. The use of AI tools did not influence the scientific substance, results, or conclusions of this work.
Abbreviations
The following abbreviations are used in this manuscript:
| CLAHE | Contrast Limited Adaptive Histogram Equalization |
| FPS | Frames Per Second |
| GPU | Graphics Processing Unit |
| HSV | Hue Saturation Value (colour space) |
| IR | Infrared |
| mAP | Mean Average Precision |
| MOG2 | Mixture of Gaussians (background subtraction algorithm) |
| MQTT | Message Queuing Telemetry Transport |
| ROI | Region of Interest |
| RTSP | Real-Time Streaming Protocol |
| YOLO | You Only Look Once |
References
- National Fire Protection Association (NFPA). NFPA Report: Industrial and Manufacturing Properties, 2017–2021; NFPA: Quincy, MA, USA, 2023. Available online: https://www.nfpa.org (accessed on 1 June 2025).
- Çelik, T.; Demirel, H. Fire detection in video sequences using a generic color model. Fire Saf. J. 2009, 44, 147–158. [Google Scholar] [CrossRef]
- Sun, H.; Yao, T. Multi-scale construction site fire detection algorithm with integrated attention mechanism. Fire 2025, 8, 257. [Google Scholar] [CrossRef]
- Saydirasulovich, N.S.; et al. An improved wildfire smoke detection based on YOLOv8 and UAV images. Sensors 2023, 23, 8374. [Google Scholar] [CrossRef] [PubMed]
- Khan, F.; et al. Recent advances in sensors for fire detection. Sensors 2022, 22, 3310. [Google Scholar] [CrossRef] [PubMed]
- Zhang, H.; Xu, W.; Sun, L. BiLSTM LN SA: A novel integrated model with self attention for multi sensor fire detection. Sensors 2025, 25. [Google Scholar] [CrossRef] [PubMed]
- Rauf, R.; et al. Hybrid machine learning based fault tolerant sensor data fusion for fire risk mitigation in IIoT environments. Sensors 2025, 25, 2372. [Google Scholar] [CrossRef] [PubMed]
- Bu, F.; Gharajeh, M.S. Intelligent and vision-based fire detection systems: A survey. Image Vis. Comput. 2019, 91, 103803. [Google Scholar] [CrossRef]
- Redmon, J.; Divvala, S.; Girshick, R.; Farhadi, A. You Only Look Once: Unified, real-time object detection. In Proceedings of the IEEE/CVF CVPR, 2016; pp. 779–788. [Google Scholar] [CrossRef]
- Liu, Z.; Ma, X.; Feng, Y.; Sun, J. DSS YOLO: An improved lightweight real-time fire detection model based on YOLOv8. Sci. Rep. 2025, 15, 9417. [Google Scholar] [CrossRef] [PubMed]
- Yar, H.; Khan, Z.A.; Ullah, F.U.M.; Ullah, W.; Baik, S.W. A modified YOLOv5 architecture for efficient fire detection in smart cities. Expert Syst. Appl. 2023, 231, 120465. [Google Scholar] [CrossRef]
- Chino, D.Y.T.; et al. BoWFire: Detection of fire in still images by integrating pixel color and texture analysis. Proceedings of SIBGRAPI, 2015; pp. 95–102. [Google Scholar] [CrossRef]
- Islam, A.; Habib, M.I. Fire detection from image and video using an improved YOLOv5 model. In Proceedings of the 2023 International Conference on Electrical, Computer and Communication Engineering (ECCE), Chittagong, Bangladesh, 23–25 February 2023; IEEE: Piscataway, NJ, USA, 2023; pp. 1–6. [Google Scholar] [CrossRef]
- Zhang, Z.; Tan, L.; Tiong, R.L.K. An improved fire and smoke detection method based on YOLOv8n for smart factories. Sensors 2024, 24, 4786. [Google Scholar] [CrossRef] [PubMed]
- Pham, T.N.; Nguyen, T.L.; Pham, V.H. Fire and smoke detection using real-time semantic segmentation on surveillance cameras. Sensors 2024, 24, 6038. [Google Scholar] [CrossRef] [PubMed]
- Tatana, M.M.; Tsoeu, M.S.; Maswanganyi, R.C. Low-light image and video enhancement for more robust computer vision tasks: A review. J. Imaging 2025, 11, 125. [Google Scholar] [CrossRef] [PubMed]
- Gonzalez, R.C.; Woods, R.E. Digital Image Processing, 4th ed.; Pearson, 2018. [Google Scholar]
- Weng, S.-E.; Miaou, S.-G.; Christanto, R. A lightweight low-light image enhancement network via channel prior and gamma correction. Int. J. Pattern Recognit. Artif. Intell. 2025. [Google Scholar] [CrossRef]
- Dewangan, A.; Pande, Y.; Braun, H.-W.; Vernon, F.; Perez, I.; Altintas, I.; Cottrell, G.W.; Nguyen, M.H. FIgLib & SmokeyNet: Dataset and deep learning model for real-time wildland fire smoke detection. Remote Sens. 2022, 14, 1007. [Google Scholar] [CrossRef]
- Zhou, Y.; Song, X.; Luo, X.; Gong, Y. EFSD-YOLO: Fire and smoke detection based on enhanced YOLOv11. In Proceedings of the 2025 4th International Conference on Intelligent Mechanical and Human-Computer Interaction Technology (IHCIT), Dalian, China, 22–24 August 2025; IEEE: Piscataway, NJ, USA, 2025. [Google Scholar] [CrossRef]
- Tu, J.; Xu, Q.; Chen, C. CANS: Communication limited camera network self-configuration for intelligent industrial surveillance. In Proceedings of the 41st IEEE International Conference on Distributed Computing Systems (ICDCS 2021), Washington, DC, USA, 7–10 July 2021; IEEE: Piscataway, NJ, USA, 2021; pp. 1–11. [Google Scholar] [CrossRef]
- Çelik, T.; Demirel, H.; Özkaramanlı, H.; Uyguroğlu, M. Fire detection in video sequences using statistical color model. In Proceedings of the 2006 IEEE International Conference on Acoustics, Speech and Signal Processing (ICASSP), Toulouse, France, 14–19 May 2006; IEEE: Piscataway, NJ, USA, 2006; p. II-213–II-216. [Google Scholar] [CrossRef]
- Töreyin, M.; Dedeoğlu, Y.; Çetin, A.E. Flame detection in video using hidden Markov models. Proceedings of IEEE ICIP, 2005. [Google Scholar] [CrossRef]
- Ateeq, Z.; Momani, M. Wireless sensor networks using image processing for fire detection. In Proceedings of the 2020 5th International Conference on Innovative Technologies in Intelligent Systems and Industrial Applications (CITISIA), Sydney, Australia, 25–27 November 2020; IEEE: Piscataway, NJ, USA, 2020. [Google Scholar] [CrossRef]
- Wang, J.; Xu, F.; Zhang, K. A real-time fire detection method from video with multifeature fusion. Comput. Intell. Neurosci. 2019, 2019, 1–12. [Google Scholar] [CrossRef] [PubMed]
- Ko, B.C.; Cheong, K.H.; Nam, J.Y. Early fire detection algorithm based on irregular patterns of flames and hierarchical Bayesian networks. Fire Saf. J. 2010, 45, 262–270. [Google Scholar] [CrossRef]
- Hentati, M.; Gargouri, A.; Hentati, R. Real-time indoor early fire detection in industrial environments using optimized multi-sensor edge deep learning. Eng. Res. Express 2025. [Google Scholar] [CrossRef]
- Buriboev, A.S.; Abduvaitov, A.; Jeon, H.S. Integrating color and contour analysis with deep learning for robust fire and smoke detection. Sensors 2025, 25, 2044. [Google Scholar] [CrossRef] [PubMed]
- Peng, Y.; Wang, Y. Real-time forest smoke detection using hand-designed features and deep learning. Comput. Electron. Agric. 2019, 167, 105029. [Google Scholar] [CrossRef]
- Sohan, M.; Sai Ram, T.; Rami Reddy, C.V. A review on YOLOv8 and its advancements. In Data Intelligence and Cognitive Informatics; Jacob, I.J., et al., Eds.; Springer: Singapore, 2024; pp. 529–545. [Google Scholar] [CrossRef]
- Terven, J.; Córdova-Esparza, D.-M.; Romero-González, J.-A. A comprehensive review of YOLO architectures in computer vision: From YOLOv1 to YOLOv8 and YOLO-NAS. Mach. Learn. Knowl. Extr. 2023, 5, 1680–1716. [Google Scholar] [CrossRef]
- Fernandes, A.M.; Utkin, A.B.; Chaves, P. Automatic early detection of wildfire smoke with visible-light cameras and EfficientDet. J. Fire Sci. 2023, 41, 122–135. [Google Scholar] [CrossRef]
- Abdusalomov, A.; Baratov, N.; Kutlimuratov, A.; Whangbo, T.K. An improvement of the fire detection and classification method using YOLOv3 for surveillance systems. Sensors 2021, 21, 6519. [Google Scholar] [CrossRef] [PubMed]
- Zell, O.; Pålsson, J.; Hernandez-Diaz, K.; Alonso-Fernandez, F.; Nilsson, F. Image-based fire detection in industrial environments with YOLOv4. In Proceedings of the 12th International Conference on Pattern Recognition Applications and Methods (ICPRAM 2023), Lisbon, Portugal, 22–24 February 2023; SciTePress: Setúbal, Portugal, 2023; pp. 1–8. [Google Scholar] [CrossRef]
- Zhang, Y.; Xiao, X.; Wang, W.; Wang, C.; Jin, X.; Wang, Y. Improved lightweight flame smoke detection algorithm for YOLOv8n. In Proceedings of the 2024 39th Youth Academic Annual Conference of Chinese Association of Automation (YAC), Dalian, China, 7–9 June 2024; IEEE: Piscataway, NJ, USA; 2024, pp. 1537–1542. [Google Scholar] [CrossRef]
- Wang, Z. Enhanced fire detection algorithm for chemical plants using modified YOLOv9 architecture. In Proceedings of the 2024 9th International Conference on Electronic Technology and Information Science (ICETIS), Zhuhai, China, 17–19 May 2024; IEEE: Piscataway, NJ, USA, 2024; pp. 22–25. [Google Scholar] [CrossRef]
- Shao, D.; et al. YOLOv7scb: A small-target object detection method for fire smoke inspection. Fire 2025, 8, 62. [Google Scholar] [CrossRef]
- Wang, X.; Wang, J.; Chen, L.; Zhang, Y. Improving computer vision-based wildfire smoke detection by combining SE-ResNet with SVM. Processes 2024, 12, 747. [Google Scholar] [CrossRef]
- Tao, H.; Dou, Z.; Liu, M.; Wang, S.; Hu, J. Real-time fire segmentation and detection using deep learning for unmanned aerial vehicles. Sensors 2024, 24, 4115. [Google Scholar] [CrossRef] [PubMed]
- Barmpoutis, P.; et al. A review on early forest fire detection systems using optical remote sensing. Sensors 2020, 20, 6442. [Google Scholar] [CrossRef] [PubMed]
- Gaur, G.; et al. Video flame and smoke based fire detection algorithms: A literature review. Fire Technol. 2020, 56, 1943–1980. [Google Scholar] [CrossRef]
- Gragnaniello, D.; Greco, A.; Sansone, C.; Vento, B. Fire and smoke detection from videos: A literature review. Expert Syst. Appl. 2024, 255, 124783. [Google Scholar] [CrossRef]
- Chaturvedi, S.; Khanna, P.; Ojha, A. A survey on vision-based outdoor smoke detection techniques for environmental safety. ISPRS J. Photogramm. Remote Sens. 2022, 185, 158–187. [Google Scholar] [CrossRef]
- Wu, Y.; Yin, T.; Zhao, X. Using deep learning with thermal imaging for human detection in heavy smoke scenarios. Sensors 2022, 22, 5351. [Google Scholar] [CrossRef] [PubMed]
- Zuiderveld, K. Contrast Limited Adaptive Histogram Equalization. In Graphics Gems IV; Academic Press, 1994; pp. 474–485. [Google Scholar] [CrossRef]
- Reis, M.J.C.S. Low-light image enhancement using deep learning: A lightweight network with synthetic and benchmark dataset evaluation. Appl. Sci. 2025, 15, 6330. [Google Scholar] [CrossRef]
- Qin, Y.; et al. Research on target image classification in low-light night vision. Sensors 2024, 24, 6682. [Google Scholar] [CrossRef] [PubMed]
- Zivkovic, Z. Improved adaptive Gaussian mixture model for background subtraction. Proceedings of ICPR, 2004; pp. 28–31. [Google Scholar] [CrossRef]
- Garcia Garcia, B.; Bouwmans, T.; Silva, A.J.R. Background subtraction in real applications. Comput. Sci. Rev. 2020, 35, 100204. [Google Scholar] [CrossRef]
- Mahmoudi, Z.; Hosseini, R. Smoke detection in video images using background subtraction. Proceedings of IEEE IICETA, 2018. [Google Scholar] [CrossRef]
- Filonenko, A.A.; Cullip, D.A.; Jo, K.H. Fast smoke detection for video surveillance using CUDA. IEEE Trans. Ind. Inform. 2018, 14, 725–733. [Google Scholar] [CrossRef]
- Hashemzadeh, M.; Farajzadeh, N.; Heydari, M. Smoke detection in video using convolutional neural networks and efficient spatio-temporal features. Appl. Soft Comput. 2022, 128, 109496. [Google Scholar] [CrossRef]
- Gragnaniello, D.; et al. FLAME: Fire detection combining deep neural network with motion analysis. Neural Comput. Appl. 2025, 37. [Google Scholar] [CrossRef]
- Töreyin, B.U.; Dedeoğlu, Y.; Güdükbay, U.; Çetin, A.E. Computer vision based method for real-time fire and flame detection. Pattern Recognit. Lett. 2006, 27, 49–58. [Google Scholar] [CrossRef]
- Caviola, A.; et al. Adaptive progressive learning for minimizing false alarms in fire detection. Eng. Appl. Artif. Intell. 2024. [Google Scholar] [CrossRef]
- Bugarić, M.; Jakovčević, T.; Stipaničev, D. Adaptive estimation of visual smoke detection parameters based on spatial data and fire risk index. Comput. Vis. Image Underst. 2014, 118, 184–196. [Google Scholar] [CrossRef]
- Angulo, J.; Moreels, P.; Raguet, V. Efficient forest fire detection index for UAV systems. Sensors 2016, 16, 893. [Google Scholar] [CrossRef] [PubMed]
- Liu, C.B.; Ahuja, N. Vision based fire detection. Proc. IEEE ICPR 2004, vol. 4, 134–137. [Google Scholar] [CrossRef]
- Quast, K.; Kaup, A. Spatial scalable region of interest transcoding of JPEG2000 for video surveillance. In Proceedings of the 2008 IEEE Fifth International Conference on Advanced Video and Signal Based Surveillance (AVSS), Santa Fe, NM, USA, 1–3 September 2008; IEEE: Piscataway, NJ, USA, 2008. [Google Scholar] [CrossRef]
- Gomes, P.; Santana, P.; Barata, J. A vision based approach to fire detection. Int. J. Adv. Robot. Syst. 2014, 11, 133. [Google Scholar] [CrossRef]
- Sun, L.; Wang, W.; Yuan, T.; Mi, L.; Dai, H.; Liu, Y.; Fu, X. BiSwift: Bandwidth orchestrator for multi-stream video analytics on edge. Proceedings of IEEE INFOCOM 2024—IEEE Conference on Computer Communications, Vancouver, BC, Canada, 20–23 May 2024; IEEE: Piscataway, NJ, USA, 2024; pp. 1–10. [Google Scholar] [CrossRef]
- Mukhiddinov, M.; Abdusalomov, A.B.; Cho, J. A wildfire smoke detection system using unmanned aerial vehicle images based on the optimized YOLOv5. Sensors 2022, 22, 9384. [Google Scholar] [CrossRef] [PubMed]
- Li, X.; et al. Real-time early indoor fire detection and localization on embedded platforms. Sustainability 2023, 15, 1794. [Google Scholar] [CrossRef]
- Jocher, G.; Chaurasia, A.; Qiu, J. YOLO by Ultralytics (Version 8.0). Zenodo 2023. [Google Scholar] [CrossRef]
- Xie, Y.; Li, Z.; Wang, Q. An intelligent fire detection approach through cameras based on computer vision methods. Process Saf. Environ. Prot. 2019, 127, 245–256. [Google Scholar] [CrossRef]
- Cai, G.; Jia, Y.; Yang, L.; Xu, D. Real-time fire detection method based on improved YOLOv8 for edge deployment. Sensors 2024, 24, 4466. [Google Scholar] [CrossRef] [PubMed]
- de Venâncio, P.V.A.B.; Lisboa, A.C.; Barbosa, A.V. An automatic fire detection system based on deep convolutional neural networks for low-power, resource-constrained devices. Neural Comput. Appl. (D-Fire dataset). 2022, 34, 15349–15368. [Google Scholar] [CrossRef]
- Cvach, M. Monitor alarm fatigue: An integrative review. Biomed. Instrum. Technol. 2012, 46, 268–277. [Google Scholar] [CrossRef] [PubMed]
- Festag, S. False alarm ratio of fire detection and fire alarm systems in Germany – A meta analysis. Fire Saf. J. 2016, 79, 119–126. [Google Scholar] [CrossRef]
Figure 1.
High-level architecture and per-frame data-processing flow of the NexFire Pro framework. Solid arrows denote frame data; dashed arrows denote startup configuration. Stages are described in Section 4; a higher-resolution version is provided in the Supplementary Material.
Figure 1.
High-level architecture and per-frame data-processing flow of the NexFire Pro framework. Solid arrows denote frame data; dashed arrows denote startup configuration. Stages are described in Section 4; a higher-resolution version is provided in the Supplementary Material.
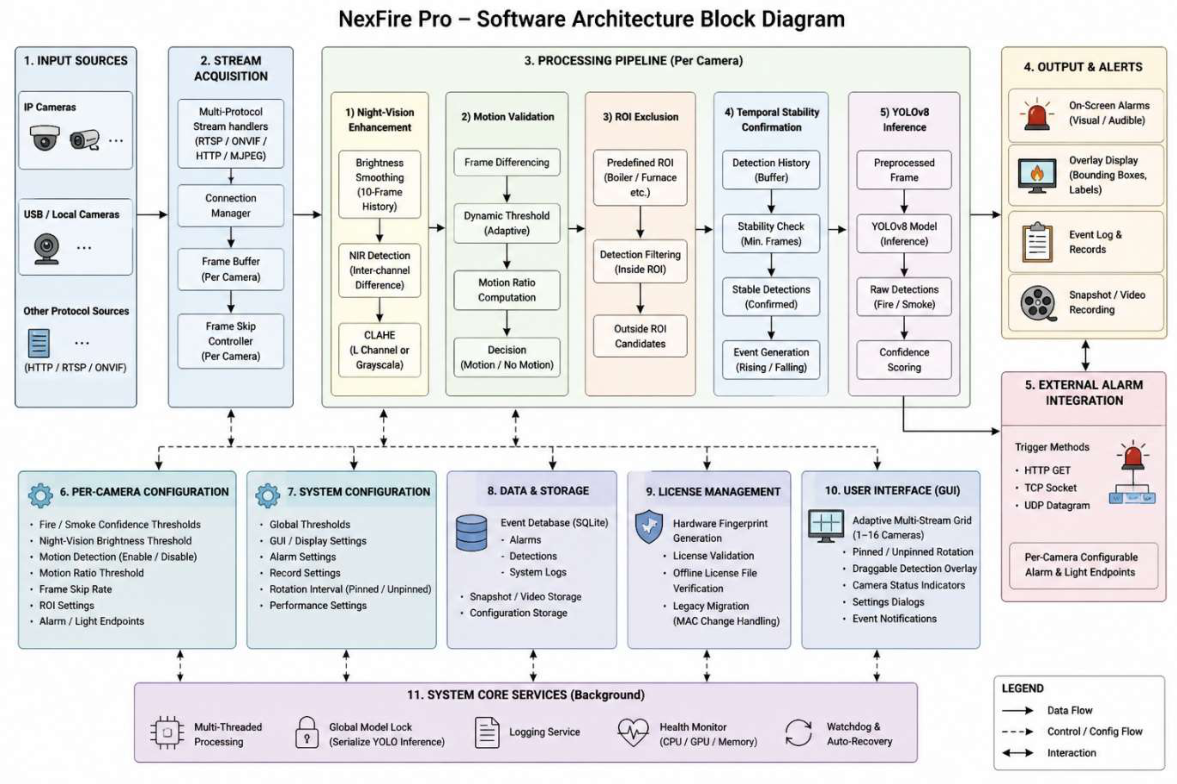
Figure 2.
Qualitative evaluation of the NexFire Pro pipeline under four representative failure scenarios addressed by the system. (a) Vehicle headlight false positive: baseline triggers alarm; motion validation correctly suppresses it (no foreground motion in bounding box). (b) Sun-reflection false positive: baseline triggers alarm; ROI exclusion removes the persistent activation from the known hot zone. (c) Small early-stage flame: baseline misses detection at low confidence; the night-vision preprocessing stage recovers it under mixed illumination. (d) Near-IR night frame: raw IR input produces missed smoke detection; CLAHE enhancement restores local contrast and enables correct identification. Bounding boxes: yellow = correct detection, red = false positive, dashed red = missed detection recovered by pipeline. Panel-to-stage correspondence and the associated false-alarm reductions are quantified in Table 3 (Section 5.2).
Figure 2.
Qualitative evaluation of the NexFire Pro pipeline under four representative failure scenarios addressed by the system. (a) Vehicle headlight false positive: baseline triggers alarm; motion validation correctly suppresses it (no foreground motion in bounding box). (b) Sun-reflection false positive: baseline triggers alarm; ROI exclusion removes the persistent activation from the known hot zone. (c) Small early-stage flame: baseline misses detection at low confidence; the night-vision preprocessing stage recovers it under mixed illumination. (d) Near-IR night frame: raw IR input produces missed smoke detection; CLAHE enhancement restores local contrast and enables correct identification. Bounding boxes: yellow = correct detection, red = false positive, dashed red = missed detection recovered by pipeline. Panel-to-stage correspondence and the associated false-alarm reductions are quantified in Table 3 (Section 5.2).
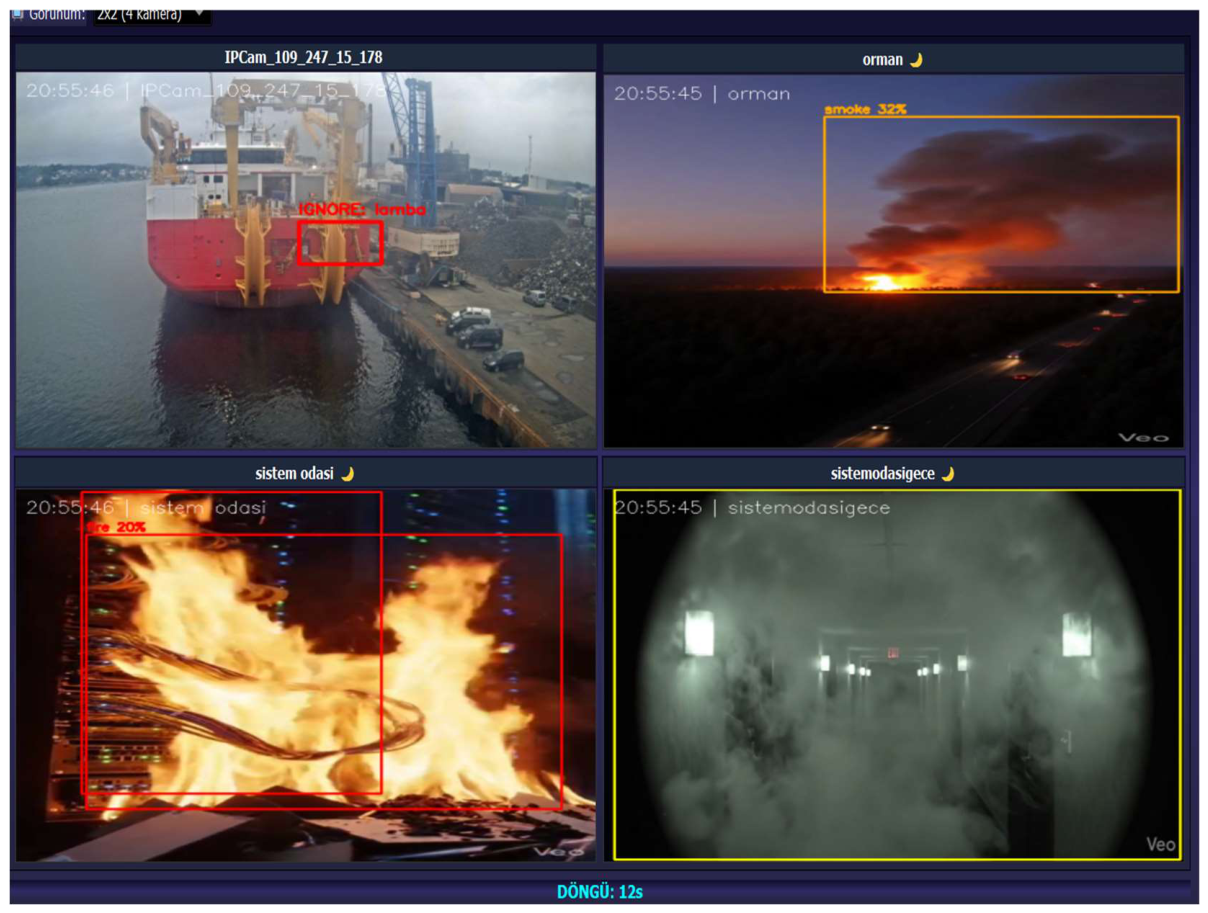
Table 1.
Camera sources used in the eight-stream evaluation. All eight cameras are disjoint from training cameras. Night/IR frames are sampled from Cam-04 and Cam-08 based on the algorithmic criterion Δ < 5.0, not manual selection.
Table 1.
Camera sources used in the eight-stream evaluation. All eight cameras are disjoint from training cameras. Night/IR frames are sampled from Cam-04 and Cam-08 based on the algorithmic criterion Δ < 5.0, not manual selection.
| Camera ID | Source Type | Resolution | Environment | Day/Night | Partition |
| Cam-01 | RTSP (H.264) | 1080p | Industrial hall (furnace area) | Day | Test |
| Cam-02 | RTSP (H.264) | 1080p | Warehouse corridor | Mixed | Test |
| Cam-03 | RTSP (H.264) | 1080p | Outdoor perimeter (fence line) | Mixed | Test |
| Cam-04 | RTSP (H.264) | 1080p | Outdoor storage yard | Night | Test |
| Cam-05 | USB webcam | 720p | Indoor laboratory | Day | Test |
| Cam-06 | USB webcam | 720p | Indoor workshop | Day | Test |
| Cam-07 | Video file | 1080p | Industrial hall (open flame) | Day | Test |
| Cam-08 | Video file | 1080p | Warehouse (smouldering) | Night | Test |
Table 2.
Training dataset composition by lighting condition and annotation class.
| Proportion (%) | Smoke Annotations | Fire Annotations | Images | Condition |
| 52.7 | 6,301 | 9,412 | 7,840 | Daytime (visible spectrum) |
| 21.6 | 2,741 | 3,864 | 3,218 | Dusk/mixed illumination |
| 25.7 | 3,127 | 4,583 | 3,814 | Night/near-infrared |
| 100 | 12,169 | 17,859 | 14,872 | Total |
Table 3.
Ablation study: cumulative contribution of each pipeline stage. Precision and recall values are means ± standard deviation across three independent 30-minute evaluation runs. FA = false-alarm rate (proportion of triggered alarms with no corresponding ground-truth event). Denominators reported in Supplementary Table S2.
Table 3.
Ablation study: cumulative contribution of each pipeline stage. Precision and recall values are means ± standard deviation across three independent 30-minute evaluation runs. FA = false-alarm rate (proportion of triggered alarms with no corresponding ground-truth event). Denominators reported in Supplementary Table S2.
| Configuration | Precision (%) | ±std | Recall (%) | ±std | mAP50 (%) | FA Rate (%) | FA Reduction (%) |
| (1) YOLOv8n Baseline | 84.6 | ±0.5 | 82.1 | ±0.6 | 86.3 | 18.3 | — |
| (2) + Motion Validation | 86.9 | ±0.4 | 81.4 | ±0.5 | 87.1 | 8.4 | 54.1 |
| (3) + ROI Exclusion | 88.1 | ±0.4 | 81.2 | ±0.5 | 87.8 | 6.5 | 64.5 |
| (4) + Night-Vision | 88.6 | ±0.3 | 84.9 | ±0.4 | 88.5 | 6.3 | 65.6 |
| (5) Full Pipeline (NexFire Pro) | 89.4 | ±0.4 | 85.7 | ±0.5 | 88.9 | 6.1 | 66.7 |
Table 4.
Per-class detection metrics for the YOLOv8n baseline (configuration 1) and the full NexFire Pro pipeline (configuration 5) on the eight-camera test partition. Precision and recall for configuration 5 are means ± std across three evaluation runs. AP50 = area under the precision-recall curve at IoU threshold 0.50.
Table 4.
Per-class detection metrics for the YOLOv8n baseline (configuration 1) and the full NexFire Pro pipeline (configuration 5) on the eight-camera test partition. Precision and recall for configuration 5 are means ± std across three evaluation runs. AP50 = area under the precision-recall curve at IoU threshold 0.50.
| Class | Configuration | Precision (%) | Recall (%) | F1 (%) | AP50 (%) | |
| Fire | (1) YOLOv8n Baseline | 86.2 | 83.7 | 84.9 | 88.1 | |
| Fire | (5) Full Pipeline | 91.3 ±0.4 | 87.4 ±0.4 | 89.3 | 90.7 | |
| Smoke | (1) YOLOv8n Baseline | 83.1 | 80.5 | 81.8 | 84.5 | |
| Smoke | (5) Full Pipeline | 87.5 ±0.4 | 84.0 ±0.5 | 85.7 | 87.1 | |
| Overall | (1) YOLOv8n Baseline | 84.6 | 82.1 | 83.4 | 86.3 | |
| Overall | (5) Full Pipeline | 89.4 ±0.4 | 85.7 ±0.5 | 87.5 | 88.9 | |
Disclaimer/Publisher’s Note: The statements, opinions and data contained in all publications are solely those of the individual author(s) and contributor(s) and not of MDPI and/or the editor(s). MDPI and/or the editor(s) disclaim responsibility for any injury to people or property resulting from any ideas, methods, instructions or products referred to in the content. |
© 2026 by the authors. Licensee MDPI, Basel, Switzerland. This article is an open access article distributed under the terms and conditions of the Creative Commons Attribution (CC BY) license (http://creativecommons.org/licenses/by/4.0/).
Copyright: This open access article is published under a Creative Commons CC BY 4.0 license, which permit the free download, distribution, and reuse, provided that the author and preprint are cited in any reuse.


