

Submitted:
22 June 2026
Posted:
23 June 2026
You are already at the latest version
Preprints on COVID-19 and SARS-CoV-2
Abstract
During financial crises, markets do not only fall or become more volatile. They may also become more dynamically coupled, with the behaviour of one market becoming more recoverable from another. This study applies Convergent Cross Mapping, a state-space reconstruction method, to examine whether crisis periods strengthen nonlinear coupling between major US and European equity indices. Daily log returns for the Dow Jones Industrial Average, S&P 500, FTSE 100 and DAX are analysed across pre-crisis, crisis and post-crisis windows for the COVID-19 market shock and the Global Financial Crisis. Pairwise bidirectional Convergent Cross Mapping is used to estimate cross-map skill, convergence and directional asymmetry, with a focused lagged analysis of key trans-atlantic pairs during COVID-19. Cross-map skill is interpreted as the strength of the recoverable dynamical footprint between markets. The results show that nonlinear coupling increases during crisis phases. During COVID-19, mean late-library cross-map skill rises from the pre-crisis to the crisis period, and all tested directional relationships satisfy the convergence criterion. The Global Financial Crisis also shows increased cri-sis-period coupling, with stronger persistence into the post-crisis phase. Lagged COVID-19 results suggest a short contemporaneous to three-trading-day coupling hori-zon. The findings position Convergent Cross Mapping as a complementary mathematical modelling framework for identifying recoverable dynamical information between markets during financial stress.
Keywords:
convergent cross mapping
; nonlinear dynamical coupling
; financial crises
; market interdependence
; COVID-19
; global financial crisis
; state-space reconstruction
; risk monitoring
1. Introduction
Financial crises are usually studied through price falls, volatility, correlations, liquidity indicators and regression-based measures of market dependence. These tools are essential for financial risk management, but they can leave open an important question: whether markets become more dynamically coupled during periods of stress, and whether this coupling changes before, during and after a crisis. In highly connected financial systems, a shock in one market may not remain local. It may appear rapidly in other markets through investor expectations, portfolio rebalancing, liquidity pressures, algorithmic trading, policy announcements and global information flows. Understanding this process is important because financial risk is not only a property of individual assets or indices, it is also a property of the coupling structure between markets.
The COVID-19 pandemic provides a particularly useful case for studying this problem. The World Health Organization declared the outbreak a Public Health Emergency of International Concern on 30 January 2020 and characterised COVID-19 as a pandemic on 11 March 2020 (World Health Organization, 2020a, 2020b). During the same period, global equity markets experienced a rapid sell-off and a sharp increase in volatility. Market stress was not limited to equities, as official analysis also documented substantial disruption in Treasury and foreign exchange markets during the March 2020 turmoil (Dobrev & Meldrum, 2020). The COVID-19 crisis is therefore a strong empirical case for testing whether nonlinear methods can identify changes in cross-market coupling during a short, severe and globally synchronised shock.
The Global Financial Crisis provides a useful comparison. Unlike COVID-19, which was triggered by a public-health emergency and then transmitted through economic and financial channels, the Global Financial Crisis emerged from within the financial system itself, through credit-market fragility, leverage, banking stress and the repricing of financial risk. Comparing COVID-19 with the Global Financial Crisis allows this study to ask whether nonlinear market coupling intensifies in both exogenous and more endogenous crisis settings, and whether the temporal profile of that coupling differs across crises.
A large literature on financial contagion and market interdependence has used correlations, regressions, vector autoregressions, Granger causality and related econometric methods to study how shocks move across markets. These methods are useful, but they also have limitations. Correlation can increase during crises without necessarily identifying directionality or dynamical dependence. Regression-based approaches may depend on assumptions about linearity, separability and model specification. Granger causality provides a prediction-based definition of causal influence, where one series is said to Granger-cause another if its past values improve prediction of the other series (Granger, 1969). Transfer entropy extends this idea in an information-theoretic direction, measuring whether the past of one process reduces uncertainty about the future of another, conditional on the latter’s own past (Schreiber, 2000). Under Gaussian assumptions, transfer entropy and linear Granger causality are closely related (Barnett et al., 2009). However, financial markets are often nonlinear, non-stationary and strongly affected by regime changes, and these features motivate the use of complementary approaches.
The methodological novelty of this study lies in using CCM as a state-space reconstruction approach to crisis-period market coupling. Granger causality asks whether past values of one series improve prediction of another series, while transfer entropy measures directed information transfer by assessing whether the past of one process reduces uncertainty about another. CCM asks a different question: whether the reconstructed dynamics of one market contain recoverable information about another, and whether this recoverability improves as the library size increases. In the present study, this recoverability is interpreted as the strength of the dynamical footprint that one market leaves in another during a crisis. This makes CCM particularly suitable for studying crisis-period coupling as a nonlinear dynamical phenomenon, while still requiring cautious interpretation because CCM evidence does not imply direct institutional or mechanical causation.
Convergent Cross Mapping, usually abbreviated as CCM, offers a different way of thinking about causality in nonlinear dynamical systems. Introduced in its modern form by Sugihara et al. (2012), CCM is grounded in state-space reconstruction and the idea that, when two variables belong to the same coupled dynamical system, the history of one variable can contain recoverable information about the other. In practical terms, if a variable causally influences a variable , then the reconstructed state space of should contain information about . The strength of this recoverable information is measured through cross-map skill, commonly denoted by . Importantly, evidence for coupling is strengthened when cross-map skill increases as the library size grows, a property known as convergence.
This is conceptually different from simply estimating a regression coefficient or computing a correlation. CCM does not ask only whether two time series move together, nor does it require the influence of one variable to be separable in a linear model. Instead, it asks whether the dynamical footprint of one series is embedded in another. This makes CCM attractive for financial crisis analysis, because markets during stress may behave less like independent stochastic processes and more like interacting components of a coupled global system. At the same time, the interpretation of CCM must be cautious. In this paper, the term causality is used in the CCM sense of recoverable dynamical information between reconstructed state spaces. It is not used to claim direct institutional, legal or mechanical causation between financial indices.
This distinction is important because there are diverging views about how best to infer causal relationships from observational financial data. Linear approaches are often easier to interpret, easier to estimate and more familiar in risk management. Information-theoretic approaches such as transfer entropy can capture nonlinear dependence, but they require careful choices about discretisation, embedding, estimation and statistical testing. CCM provides a complementary dynamical-systems approach, but it also depends on methodological choices such as embedding dimension, time delay, sample length, library size and the definition of the analysis window. A central purpose of this study is therefore not to present CCM as a replacement for established financial-risk tools, but to test whether it adds useful information about market coupling during crises.
In this context, CCM is best understood as complementary to established market-coupling methods rather than as a replacement for them. Correlation measures whether markets move together, but it does not provide directionality or reconstruct dynamical dependence. Granger causality asks whether the past of one market improves prediction of another, but it is prediction-based and often implemented in a model-dependent, linear form. Transfer entropy extends the analysis to directional information transfer and can capture nonlinear dependence, but its estimates can be sensitive to embedding, discretisation and statistical-estimation choices. CCM asks a different question: whether the reconstructed dynamics of one market contain recoverable information about another, and whether this recoverability improves with increasing library size. The value of CCM in this study is therefore its ability to model crisis-period coupling as a nonlinear dynamical footprint between markets, while retaining a cautious interpretation that does not equate recoverability with direct mechanical causation.
This paper applies CCM to daily log returns for four major equity indices: the Dow Jones Industrial Average, the S&P 500, the FTSE 100 and the DAX. The indices were selected to provide two United States benchmarks and two European benchmarks, allowing the analysis to examine both within-region and transatlantic coupling. The main empirical case is the COVID-19 market shock, with the Global Financial Crisis used as a comparison. For each crisis, the analysis separates the data into pre-crisis, crisis and post-crisis windows. Pairwise bidirectional CCM is then used to estimate cross-map skill, convergence and directional asymmetry. A focused lagged CCM analysis is also conducted for key transatlantic pairs to examine whether the strongest coupling appears contemporaneously or over a short lead-lag horizon.
The study addresses three research questions. First, does nonlinear market coupling, measured through CCM cross-map skill, increase during financial crisis periods? Second, does the COVID-19 market shock produce a different coupling profile from the Global Financial Crisis? Third, do the main transatlantic relationships show evidence of short-horizon lead-lag structure during the COVID-19 crisis phase? These questions are relevant for financial risk management because crisis monitoring requires tools that can describe not only individual market stress, but also changes in the dynamical links between markets.
The principal findings are that nonlinear coupling increases during crisis phases and that the COVID-19 crisis shows a particularly clear increase in both average cross-map skill and convergence. In the COVID-19 crisis window, all tested directional relationships satisfy the convergence criterion used in this study, while convergence is less consistent in the corresponding pre-crisis period. The Global Financial Crisis also shows stronger coupling during the crisis phase, but with a more persistent elevation into the post-crisis period. The lagged CCM results for COVID-19 suggest that transatlantic coupling is strongest over a short horizon of approximately one to three trading days, although this should be interpreted as an indicative coupling horizon rather than an exact transmission speed.
The contribution of the paper is threefold. First, it applies CCM as a nonlinear mathematical modelling framework for analysing crisis-period coupling between major US and European equity indices. Second, it compares an exogenous global shock, COVID-19, with the Global Financial Crisis as a more financial-system-centred crisis, allowing the analysis to distinguish a short synchronised coupling spike from a more persistent post-crisis coupling profile. Third, it interprets cross-map skill as the strength of a recoverable dynamical footprint between markets and uses lagged CCM to estimate an indicative coupling horizon for key transatlantic relationships during COVID-19. The paper therefore positions CCM as a useful addition to the financial-risk modelling toolkit, provided that its results are interpreted cautiously and alongside established indicators.
2. Materials and Methods
2.1. Study Design
This study uses an empirical time-series design to examine whether nonlinear dynamical coupling between major equity indices changes during financial crises. The analysis focuses on two crisis episodes: the COVID-19 market shock and the Global Financial Crisis. The COVID-19 episode is the main case study, while the Global Financial Crisis is used as a comparison case to assess whether crisis-period changes in coupling are specific to a sudden exogenous shock or also appear during a more financial-system-centred crisis.
The study compares three phases for each episode: a pre-crisis period, a crisis period and a post-crisis period. Within each phase, pairwise bidirectional Convergent Cross Mapping, CCM, is applied to daily log returns for four equity indices: the Dow Jones Industrial Average, the S&P 500, the FTSE 100 and the DAX. The analysis estimates cross-map skill, convergence and directional asymmetry. A focused lagged CCM analysis is also applied to key transatlantic pairs during the COVID-19 crisis phase, in order to assess whether the strongest coupling appears contemporaneously or over a short lead-lag horizon.
2.2. Data
Daily adjusted closing prices were retrieved from Yahoo Finance using the quantmod package in R. The analysis includes four equity indices: the Dow Jones Industrial Average, the S&P 500, the FTSE 100 and the DAX. The full data retrieval window was 1 January 2005 to 31 December 2022, which provides sufficient coverage for both the Global Financial Crisis and the COVID-19 market shock.
The selected Yahoo Finance symbols were ^DJI for the Dow Jones Industrial Average, ^GSPC for the S&P 500, ^FTSE for the FTSE 100 and ^GDAXI for the DAX. The four series were aligned using common trading dates only, so that all CCM calculations were performed on matched observations across the included markets. This conservative alignment avoids missing values caused by different market holidays or trading calendars.
The main analysis uses daily log returns rather than raw price levels, because returns are more standard in financial-risk analysis and reduce the non-stationarity associated with index levels. For each index, daily log returns were calculated as follows:
where is the adjusted closing price on trading day , and is the corresponding daily log return.
The processed adjusted-price and log-return datasets were saved as reproducible outputs from the R workflow. The code also stores metadata including the download date, index symbols, number of observations, embedding dimension, time delay and CCM iteration settings.
2.3. Crisis Windows
For each crisis episode, three analysis windows were defined: pre-crisis, crisis and post-crisis. The windows were chosen to provide sufficient observations for CCM while retaining a meaningful distinction between baseline, stress and recovery regimes.
For the Global Financial Crisis, the pre-crisis period was defined as 3 January 2005 to 29 June 2007, the crisis period as 2 July 2007 to 30 June 2009, and the post-crisis period as 1 July 2009 to 31 December 2010. This window captures the broad escalation of financial stress from mid-2007 through the post-Lehman period and subsequent stabilisation.
For the COVID-19 market shock, the pre-crisis period was defined as 2 January 2018 to 18 February 2020, the crisis period as 19 February 2020 to 30 June 2020, and the post-crisis period as 1 July 2020 to 31 December 2021. The COVID-19 crisis window begins around the equity-market peak and includes the acute sell-off and early recovery phase. It is broader than the shortest February to March 2020 crash interval because CCM requires enough observations for state-space reconstruction and convergence assessment.
Table 1 summarises the crisis windows used in the analysis.
2.4. Convergent Cross Mapping
Convergent Cross Mapping is a nonlinear causality method grounded in dynamical systems theory and state-space reconstruction. It was introduced in its modern form by Sugihara et al. (2012) and is based on the idea that, when two variables are part of the same coupled dynamical system, the reconstructed dynamics of one variable can contain recoverable information about the other.
The intuition is as follows. If a variable influences a variable , then the historical states of should contain information about , because the dynamics of have left a footprint in the evolution of . CCM tests this by reconstructing a state space from one time series and using nearest-neighbour information in that reconstructed space to estimate values of the other time series. The quality of this reconstruction is measured by cross-map skill, denoted here as .
In this paper, the term causality is used only in the CCM sense of recoverable dynamical information between reconstructed state spaces. It should not be interpreted as a claim of direct institutional, legal or mechanical causation between financial indices. A high CCM value is interpreted as evidence of nonlinear dynamical coupling under the assumptions of CCM.
2.5. State-space reconstruction and CCM parameters
For each time series, delay-coordinate embedding was used to reconstruct the state space. For a time series , the reconstructed vector can be written as:
where is the embedding dimension and is the time delay.
In the main analysis, the embedding dimension was set to and the time delay to . This choice provides a transparent and fixed parameter specification across all markets, crisis windows and directions. The purpose of the study is not to optimise CCM for predictive performance, but to test whether crisis periods show stronger and more convergent nonlinear coupling under a consistent framework. A supplementary embedding-dimension sensitivity analysis was conducted for with , to assess whether the phase-level crisis-coupling pattern depends on the baseline specification. The sensitivity analysis used the same episode-phase windows and pairwise bidirectional CCM structure as the main analysis, and is reported in the Supplementary Materials.
Each bidirectional CCM comparison was run with 300 bootstrap iterations using the multispatialCCM package in R. Cross-map skill was summarised using the mean over the final third of library sizes, referred to in the results as late-library mean . This follows the logic that the largest library sizes provide the most relevant estimate of the asymptotic cross-map skill, while avoiding dependence on a single final value.
2.6. Pairwise Bidirectional CCM
For each crisis episode and phase, pairwise bidirectional CCM was applied to all six unordered index pairs among the four indices. Each unordered pair produces two directional tests. For example, the pair DJIA, FTSE 100 produces a DJIA to FTSE 100 direction and an FTSE 100 to DJIA direction. With four indices, this gives twelve directional relationships per phase.
The CCM direction follows the convention used in the R workflow and teaching example: CCM_boot(A, B, ...) is reported as . This notation is interpreted as evidence that the proposed source has a recoverable dynamical footprint in the proposed target . The analysis reports both directions for each pair because financial markets are expected to be bidirectionally coupled, especially during crises.
For each directional relationship, the following quantities were recorded:
where is the cross-map skill at the smallest library size, is the cross-map skill at the largest library size, is the mean cross-map skill over the final third of library sizes, is the maximum observed cross-map skill, and is the Spearman correlation between library size and cross-map skill.
2.7. Convergence Criterion
In CCM, evidence for dynamical coupling is strengthened when cross-map skill increases with library size, a property referred to as convergence. A high cross-map skill alone is not sufficient, because high apparent association can arise from shared trends, common shocks or synchronised volatility. Convergence is important because CCM theory predicts that, when a genuine dynamical relationship is present, the ability to recover one variable from the reconstructed state space of another should improve as more library points become available.
In this study, convergence was assessed descriptively using two conditions. A directional relationship was classified as convergent when:
And
Here, is the Spearman correlation between library size and cross-map skill. This criterion is intentionally simple and transparent. It is used to support interpretation of the CCM results rather than as a definitive formal proof of causality.
2.8. Directional Asymmetry
To assess whether coupling was stronger in one direction than the other, directional asymmetry was calculated for each unordered index pair. For a pair , the asymmetry measure was defined as:
A positive value indicates stronger late-library cross-map skill in the direction, while a negative value indicates stronger cross-map skill in the direction. This measure was used to identify whether crisis-period coupling was approximately balanced or whether one direction was dominant.
Directional asymmetry was interpreted cautiously. Financial indices are not isolated causal mechanisms, and all four markets are influenced by global news, macroeconomic expectations, monetary policy, liquidity conditions and investor behaviour. Asymmetry in CCM therefore indicates stronger recoverable dynamical information in one direction, not necessarily a direct one-way causal channel.
2.9. Lagged CCM Analysis
The lagged analysis was designed to estimate an indicative coupling horizon rather than an exact propagation delay. For each direction, the lag with the highest late-library mean cross-map skill was recorded as the maximum-recoverability lag. This value identifies the alignment at which the dynamical footprint of the proposed source is most strongly recoverable from the proposed target during the COVID-19 crisis window. Because financial indices are simultaneously exposed to global news, policy announcements, liquidity conditions and common shocks, the best-lag estimate should not be interpreted as a precise transmission speed or as proof of a direct one-way causal channel.
The lagged analysis was applied to the following directional pair families: DJIA and FTSE 100, S&P 500 and FTSE 100, DJIA and DAX, and S&P 500 and DAX. Each pair was tested in both directions. Lags from to trading days were examined. A positive lag was defined as the proposed source leading the proposed target by that number of trading days. For example, a positive lag of one day in the DJIA to FTSE 100 direction indicates that the DJIA series is aligned one trading day ahead of the FTSE 100 series.
The lagged analysis used the same embedding dimension and time delay as the main analysis, and , and used 100 bootstrap iterations. The lower number of iterations was chosen to keep the lagged analysis computationally tractable, because lagged CCM multiplies the number of runs across directions and lag values. The lagged results are therefore interpreted as exploratory evidence about the short-horizon structure of crisis coupling, rather than as exact estimates of transmission speed.
For each direction, the lag with the highest late-library mean was recorded as the best-lag estimate. Because cross-map skill can remain elevated across a range of nearby lags, the best lag was interpreted as an indicative coupling horizon rather than a precise propagation delay.
2.10. Software and Reproducibility
All analyses were conducted in R. Market data were retrieved using the quantmod package, and CCM was implemented using the multispatialCCM package. Data wrangling, table generation and plotting were performed using standard R packages including dplyr, tidyr, purrr, readr and ggplot2.
The R workflow exports the cleaned aligned adjusted-price data, cleaned aligned log-return data, metadata, pairwise CCM tables, directional asymmetry tables, lagged CCM tables, best-lag summaries and publication-ready figures. These outputs were used directly to construct the Results section. The code and processed data will be made available as supplementary material or deposited in a public repository prior to publication.
No human participants, animal subjects or private personal data were used in this study. Ethical approval was therefore not required.
2.11. Use of Generative Artificial Intelligence
Generative artificial intelligence was used to assist with improving the readability of the manuscript text only. It was not used to generate the financial data, perform the statistical analysis, create or alter results, or fabricate findings. All data analyses were performed in R using code created, reviewed and controlled by the author, and all interpretations, results and conclusions are the author’s own work.
3. Results
3.1. Crisis Periods Are Associated with Stronger Nonlinear Market Coupling
The pairwise CCM results indicate that nonlinear dynamical coupling between the four equity indices strengthens during crisis periods. This pattern is particularly clear for the COVID-19 market shock, where both average cross-map skill and convergence increase markedly during the crisis window.
Figure 1 shows the daily log returns for the Dow Jones Industrial Average, S&P 500, FTSE 100 and DAX across the full analysis period. The figure shows pronounced volatility clustering around the Global Financial Crisis and the COVID-19 market shock, providing the financial context for the CCM analysis.
Table 2 summarises the average late-library cross-map skill, median late-library cross-map skill, mean convergence and proportion of convergent directional relationships across the pre-crisis, crisis and post-crisis phases for both episodes.
For the COVID-19 episode, mean late-library ρ increased from 0.473 in the pre-crisis period to 0.637 during the crisis period, before falling to 0.442 in the post-crisis period. Median late-library ρ shows the same pattern, increasing from 0.376 before the crisis to 0.581 during the crisis, then declining to 0.338 after the crisis. The convergence pattern also strengthened during the crisis phase. Mean convergence increased from 0.345 before the crisis to 0.939 during the crisis, and the proportion of convergent directional relationships increased from 0.667 to 1.000. This means that all twelve tested directional relationships satisfied the convergence criterion during the COVID-19 crisis phase.
For the Global Financial Crisis, mean late-library ρ increased from 0.464 in the pre-crisis period to 0.588 during the crisis period, and then increased further to 0.660 in the post-crisis period. Median late-library ρ also increased across the three phases, from 0.329 to 0.519 and then to 0.596. This suggests that the Global Financial Crisis was also associated with stronger nonlinear coupling, but with a different temporal profile from COVID-19. Whereas the COVID-19 episode shows a sharp crisis-period increase followed by a post-crisis reduction, the Global Financial Crisis shows a more persistent elevation of coupling into the post-crisis phase.
Figure 2 visualises the same pattern. The COVID-19 market shock produces a clear crisis-period peak in average nonlinear coupling, while the Global Financial Crisis shows a more gradual increase from the pre-crisis phase through to the post-crisis phase.
The embedding-dimension sensitivity analysis supports the same qualitative interpretation. Across E = 3, 4, 5, 6, the COVID-19 crisis phase shows higher mean late-library cross-map skill than both the pre-crisis and post-crisis phases, while the Global Financial Crisis shows higher crisis-period coupling than the pre-crisis phase and a further elevation in the post-crisis phase. This indicates that the main phase-level pattern is not dependent on the baseline E = 5 specification.
3.2. COVID-19 Produces Consistently Convergent Directional Coupling
The COVID-19 crisis phase provides the clearest evidence of nonlinear dynamical coupling across the four equity indices. All twelve directional relationships between the four markets were classified as convergent during the COVID-19 crisis period. This contrasts with the pre-crisis phase, where only two thirds of the directional relationships satisfied the convergence criterion.
This result is important because high cross-map skill alone is not sufficient for a defensible CCM interpretation. In CCM, evidence for coupling is strengthened when cross-map skill improves with library size. The COVID-19 results therefore suggest not only that markets became more strongly associated during the crisis, but that their dynamics became more mutually recoverable in the CCM sense.
Figure 3 shows directional CCM coupling during the crisis phase for both episodes. Within-region coupling is strongest, as expected. During the COVID-19 crisis, the two US indices show particularly high bidirectional coupling, while the FTSE 100 and DAX also show strong European coupling. Transatlantic coupling is weaker than within-region coupling, but remains substantial and consistently convergent.
3.3. Transatlantic Coupling Strengthens During the COVID-19 Market Shock
The transatlantic relationships between US and European indices also strengthen during the COVID-19 crisis phase. Table 3 reports the key COVID-19 crisis-period results for the DJIA, S&P 500, FTSE 100 and DAX transatlantic directions.
The DJIA to FTSE 100 direction produced a late-library of 0.593, while FTSE 100 to DJIA produced 0.535. Similarly, S&P 500 to FTSE 100 produced 0.595, compared with 0.508 for FTSE 100 to S&P 500. The DJIA to DAX and DAX to DJIA directions were more balanced, with late-library values of 0.569 and 0.561 respectively. The S&P 500 to DAX direction produced 0.570, while DAX to S&P 500 produced 0.532.
All of these transatlantic relationships satisfied the convergence criterion. This supports the interpretation that the COVID-19 market shock was associated with bidirectional nonlinear coupling between US and European equity markets. The US-to-European directions were generally stronger than the corresponding European-to-US directions, although the differences were modest. The results should therefore be interpreted as evidence of asymmetric bidirectional coupling rather than simple one-way causation.
The DJIA and FTSE 100 pair illustrates this crisis-period change clearly. As shown in Figure 4, DJIA to FTSE 100 coupling increased from the pre-crisis phase to the COVID-19 crisis phase, then declined in the post-crisis phase. FTSE 100 to DJIA coupling followed a similar pattern, although the DJIA to FTSE 100 direction was stronger during the COVID-19 crisis phase. This supports the view that the COVID-19 shock was associated with temporary strengthening of bidirectional transatlantic coupling.
3.4. The Global Financial Crisis Shows a Different Coupling Profile
The Global Financial Crisis also shows stronger nonlinear coupling, but with a different temporal profile from COVID-19. Average coupling increases during the crisis phase, but remains elevated, and rises further, in the post-crisis phase. This suggests that the Global Financial Crisis may have been associated with a more persistent restructuring of market coupling, rather than a short crisis-period spike followed by rapid relaxation.
The DJIA and FTSE 100 pair also behaves differently across the two crises. During the COVID-19 crisis phase, both directions become strongly coupled and convergent, with DJIA to FTSE 100 stronger than FTSE 100 to DJIA. During the Global Financial Crisis, by contrast, the FTSE 100 to DJIA direction is stronger than the DJIA to FTSE 100 direction, and the difference persists across the phases shown in Figure 4.
This contrast suggests that crisis coupling is not invariant across historical episodes. The COVID-19 shock appears as a sharp, globally synchronised event in which all tested directional relationships become convergent during the crisis window. The Global Financial Crisis shows a more persistent coupling structure, with stronger post-crisis coupling than crisis-period coupling in the aggregate results. This difference is consistent with the idea that different crisis mechanisms can produce different nonlinear coupling profiles.
3.5. Lagged CCM Suggests a Short Crisis-Period Coupling Horizon
The lagged CCM analysis was used to identify the lag at which the dynamical footprint between transatlantic markets was most strongly recoverable during the COVID-19 crisis phase. Key US-European pairs were tested in both directions to assess whether the strongest cross-map skill appeared contemporaneously or when the proposed source series was allowed to lead the proposed target series by a small number of trading days.
The results suggest that COVID-19 transatlantic coupling was strongest over a short contemporaneous to three-trading-day horizon. For DJIA to FTSE 100, the strongest late-library occurred at a lag of +1 trading day, with . For S&P 500 to FTSE 100, the strongest value occurred at lag 0, with . For DJIA to DAX and S&P 500 to DAX, the strongest values occurred at +2 trading days, with and , respectively.
The reverse European-to-US directions also showed positive best lags. FTSE 100 to DJIA and FTSE 100 to S&P 500 both peaked at +3 trading days, while DAX to DJIA and DAX to S&P 500 both peaked at +2 trading days. All best-lag relationships were classified as convergent.

Table 4.
Best lagged CCM results for key transatlantic pairs during the COVID-19 crisis phase.
| Direction | Best lag, trading days | Late-library rho | End rho | Convergent |
|---|---|---|---|---|
| DJIA to FTSE 100 | +1 | 0.599 | 0.598 | Yes |
| S&P 500 to FTSE 100 | 0 | 0.596 | 0.615 | Yes |
| DJIA to DAX | +2 | 0.621 | 0.623 | Yes |
| S&P 500 to DAX | +2 | 0.611 | 0.610 | Yes |
| FTSE 100 to DJIA | +3 | 0.563 | 0.560 | Yes |
| FTSE 100 to S&P 500 | +3 | 0.561 | 0.561 | Yes |
| DAX to DJIA | +2 | 0.640 | 0.650 | Yes |
| DAX to S&P 500 | +2 | 0.627 | 0.630 | Yes |
Figure 5 shows the lagged CCM curves for the COVID-19 crisis phase. The curves show weak or negative cross-map skill at several negative lags, followed by substantially stronger cross-map skill around lag 0 and short positive lags. The strongest coupling generally occurs over a window from lag 0 to approximately +3 trading days.
These results should not be interpreted as exact transmission speeds. Rather, they indicate a short crisis-period coupling horizon, where the strongest recoverable dynamical information appears when one market is aligned contemporaneously or allowed to lead another by a small number of trading days. This is consistent with rapid cross-market adjustment during the COVID-19 crisis, while still recognising that all markets were responding to a common global shock.
3.6. Summary of Results
The results support three main conclusions. First, nonlinear market coupling, measured through late-library CCM cross-map skill, increases during crisis periods. This pattern is strongest and most consistent during the COVID-19 market shock, where mean late-library rises during the crisis phase and all tested directional relationships satisfy the convergence criterion.
Second, the Global Financial Crisis also shows increased coupling, but with a different temporal profile. Rather than displaying a sharp crisis-period peak followed by a reduction, it shows elevated coupling that persists into the post-crisis period. This suggests that different crises may produce different forms of nonlinear market coupling.
Third, the lagged CCM results indicate that COVID-19 transatlantic coupling was strongest over a short contemporaneous to three-trading-day horizon. The lagged results are best interpreted as exploratory evidence of a short coupling horizon, not as exact estimates of transmission speed.
Together, these findings support the use of CCM as a complementary tool for analysing market coupling during financial stress. The method does not replace conventional correlation, volatility or regression-based approaches, but it adds a nonlinear dynamical perspective by testing whether the reconstructed behaviour of one market contains recoverable information about another.
4. Discussion
This study examined whether Convergent Cross Mapping can reveal changes in nonlinear dynamical coupling between major US and European equity indices during financial crises. The results show that crisis periods are associated with stronger recoverable dynamical information between markets, particularly during the COVID-19 market shock. The evidence is strongest for COVID-19, where average late-library cross-map skill increases during the crisis phase and all tested directional relationships satisfy the convergence criterion. The Global Financial Crisis also shows increased coupling, although with a more persistent post-crisis elevation. These findings suggest that CCM can provide a useful complementary perspective on financial contagion and market interdependence, especially when the focus is not only on whether markets move together, but on whether their reconstructed dynamics contain recoverable information about one another.
The useful interpretation of CCM in this setting is not that one index mechanically causes another, but that one market can leave a recoverable dynamical footprint in another. During crisis periods, this footprint becomes stronger when cross-map skill increases and more defensible when cross-map skill also converges with increasing library size. The COVID-19 results are therefore meaningful because the crisis period shows both higher late-library cross-map skill and complete convergence across the tested directional relationships. This suggests that the four equity indices became more dynamically informative about one another during the crisis, consistent with a temporary tightening of nonlinear market coupling.
The main result supports the hypothesis that nonlinear market coupling intensifies during periods of financial stress. During the COVID-19 crisis window, mean late-library cross-map skill rises from the pre-crisis period to the crisis period, while convergence becomes much more consistent across directional relationships. This is important because the CCM interpretation depends not only on high cross-map skill, but also on whether cross-map skill improves with increasing library size. In this study, all tested COVID-19 crisis-phase directions satisfy the convergence criterion, suggesting that the crisis was associated with a more recoverable dynamical structure across the four indices. In practical terms, this means that the behaviour of each market became more informative about the behaviour of the others during the crisis phase.
This finding is consistent with the broader idea that crises increase market interdependence, but it adds a nonlinear dynamical interpretation. Conventional crisis analysis often shows that correlations rise during periods of stress, while volatility, drawdown and tail dependence also increase. CCM asks a different question. It tests whether the reconstructed state space of one series contains information about another. The results therefore suggest that the COVID-19 market shock did not only increase co-movement, it also increased the degree to which market dynamics became mutually recoverable. This distinction is important because crisis contagion may involve nonlinear interactions, feedback loops, synchronised investor behaviour and regime-dependent dynamics that are not fully captured by linear association measures.
The COVID-19 results are particularly striking because the crisis was sudden, global and externally triggered. Unlike a financial crisis that develops primarily from within credit markets or banking systems, COVID-19 began as a public-health emergency and then transmitted rapidly through expectations about economic shutdowns, earnings, liquidity, supply chains, policy responses and investor risk appetite. The finding that nonlinear coupling strengthens sharply during this period is therefore consistent with a view of COVID-19 as a globally synchronising shock. The increase in convergence across all tested directions suggests that the crisis temporarily reduced the effective independence of regional market dynamics, making US and European equity indices behave more like components of a tightly coupled global system.
The comparison with the Global Financial Crisis provides an important qualification. The Global Financial Crisis also shows increased nonlinear coupling, but its profile is different from COVID-19. In the aggregate results, coupling rises during the crisis phase and rises further in the post-crisis phase. This suggests that the Global Financial Crisis may have produced a more persistent restructuring of market dynamics, rather than a short and sharp coupling spike. This interpretation is plausible because the Global Financial Crisis unfolded through financial-sector fragility, deleveraging, banking stress and policy intervention over a longer period. By contrast, COVID-19 produced an abrupt market shock followed by rapid and substantial policy responses, which may explain why the aggregate coupling profile peaks during the crisis window and then declines in the post-crisis phase.
The directional results also show that crisis coupling should not be reduced to a simple one-way causal story. During COVID-19, transatlantic relationships strengthen in both directions, with a modest asymmetry from US indices towards European indices. For example, DJIA to FTSE 100 and S&P 500 to FTSE 100 cross-map skill is higher than the corresponding reverse directions, but the differences are not large enough to justify a strong claim of one-way causation. The most defensible interpretation is asymmetric bidirectional coupling. In the CCM sense, US market dynamics appear to leave a somewhat stronger recoverable footprint in European indices during the COVID-19 crisis phase, while European dynamics also remain informative about US markets.
This point matters because financial markets are not isolated cause-and-effect mechanisms. They respond to shared global news, monetary and fiscal policy, investor expectations, liquidity conditions, algorithmic trading and cross-border portfolio flows. A directional CCM result should therefore not be interpreted as proof that one index mechanically caused another to move. Rather, it indicates that one series contains recoverable dynamical information about another under the assumptions of CCM. In this sense, CCM is best understood as a method for identifying nonlinear dynamical coupling, not as a standalone proof of direct institutional causation.
The lagged CCM results add a useful secondary insight. During the COVID-19 crisis phase, the strongest transatlantic coupling generally appears between lag 0 and +3 trading days. For some US-to-European directions, the strongest coupling occurs at lag 0, +1 or +2 trading days, while several European-to-US directions peak around +2 or +3 trading days. This suggests a short crisis-period coupling horizon rather than an exact transmission speed. The lagged curves are especially useful because they show weak or negative cross-map skill at several negative lags and stronger values around contemporaneous and short positive lags. However, these findings should be interpreted cautiously because the lagged analysis was deliberately focused and used fewer iterations than the main pairwise CCM analysis.
The lagged CCM results provide an indicative coupling horizon rather than a measured propagation delay. The strongest recoverability appears from contemporaneous alignment to approximately three trading days, suggesting that the dynamical footprint between US and European markets during COVID-19 was concentrated over a short horizon. This is consistent with rapid cross-market adjustment during a globally synchronised crisis. However, the result should not be interpreted as a precise estimate of information-travel time, because the markets were also responding to common public-health news, policy announcements, liquidity conditions and global investor sentiment.
From a risk-management perspective, the findings indicate that CCM can complement existing approaches to crisis monitoring. Standard measures such as volatility, drawdown and correlation remain essential because they are transparent, widely understood and directly connected to losses and risk exposure. CCM adds a different layer by asking whether markets have become more dynamically interdependent. This may be useful when analysts want to understand whether a crisis is producing stronger coupling across regions, whether market dynamics are becoming more synchronised, and whether apparent interdependence is supported by convergence in the CCM sense.
The results also show why methodological caution is necessary. The choice of crisis windows, embedding dimension, lag structure and data transformation can affect CCM results. This study uses daily log returns as the main input, which is appropriate for financial risk analysis and avoids some of the non-stationarity associated with index levels. The embedding dimension is fixed at E=5, and the time delay at τ=1, providing a transparent and consistent specification across markets and crisis windows. However, future work should test alternative embedding dimensions, recurrence or library-size choices, different lag ranges and alternative crisis-window definitions. A full robustness analysis would strengthen the interpretation and help distinguish persistent findings from parameter-dependent ones.
There are several limitations. First, the analysis is restricted to four major equity indices. These indices are important and economically meaningful, but they do not represent the full structure of global financial markets. Future studies should include additional equity markets, exchange rates, bond yields, credit spreads, commodities and volatility indices. Second, the analysis uses daily data. Higher-frequency data could capture intraday propagation more directly, especially across markets with different trading hours, although this would introduce additional issues related to market microstructure, opening and closing times, and asynchronous trading. Third, the lagged CCM analysis is intentionally focused and exploratory. It supports the interpretation of a short coupling horizon during COVID-19, but it should be extended with more iterations, alternative lag ranges and additional robustness checks before being treated as a precise lead-lag estimate. A further limitation is that crisis-period coupling may partly reflect common global shocks rather than pairwise transmission between specific markets. This is especially relevant for COVID-19, where all markets were exposed to shared public-health news, policy responses, liquidity conditions and global investor sentiment. CCM therefore identifies recoverable dynamical information and directional asymmetry under its modelling assumptions, but it does not by itself separate direct pairwise influence from common-driver effects. Finally, CCM is a powerful nonlinear method, but it does not remove the fundamental difficulty of causal inference from observational financial data. The method provides evidence of recoverable dynamical information between reconstructed state spaces, which is consistent with nonlinear coupling under the assumptions of the method. It does not prove that one market directly caused another in a simple structural sense. This is particularly important in crisis analysis, where common shocks can affect many markets simultaneously. The interpretation in this paper is therefore deliberately cautious: CCM is used to identify nonlinear dynamical coupling and directional asymmetry, not to claim direct mechanistic causation.
Despite these limitations, the study makes three contributions. First, it applies CCM to compare nonlinear market coupling across two major crisis episodes, COVID-19 and the Global Financial Crisis. Second, it shows that the temporal profile of coupling differs across crises, with COVID-19 producing a sharp crisis-phase increase and the Global Financial Crisis showing more persistent post-crisis elevation. Third, it demonstrates that lagged CCM can provide exploratory evidence about the short-horizon structure of transatlantic market coupling during a crisis. Together, these contributions position CCM as a useful addition to the financial-risk toolkit, particularly for studies of crisis contagion, nonlinear interdependence and market-regime change.
Future research should extend this analysis in several directions. A first extension would be to compare CCM with correlation, Granger causality and transfer entropy on the same crisis windows, so that the added value of the nonlinear state-space approach can be assessed directly. A second extension would be to conduct a systematic embedding-dimension and time-delay sensitivity analysis. A third extension would be to apply the method to a broader set of crises, including the Eurozone sovereign debt crisis, the Brexit referendum period and the 2022 inflation and interest-rate shock. Finally, future work could use higher-frequency data to test whether the short lag horizon observed here can be resolved more precisely at intraday scales.
Overall, the results suggest that financial crises can be understood not only as episodes of increased volatility or falling prices, but also as episodes in which markets become more dynamically coupled. CCM provides a way to measure this coupling through recoverable dynamical fingerprints between time series. The findings do not imply that CCM should replace conventional financial-risk indicators, but they show that it can enrich crisis analysis by revealing nonlinear interdependence that is not reducible to simple correlation or regression-based association.
5. Conclusions
This paper examined whether Convergent Cross Mapping can identify changes in nonlinear dynamical coupling between major US and European equity indices during financial crises. Using daily log returns for the Dow Jones Industrial Average, S&P 500, FTSE 100 and DAX, the study compared pre-crisis, crisis and post-crisis periods for the COVID-19 market shock and the Global Financial Crisis.
The results show that nonlinear market coupling increases during crisis periods. The pattern is especially clear for COVID-19, where average late-library cross-map skill rises during the crisis phase and all tested directional relationships satisfy the convergence criterion. This indicates that, during the COVID-19 market shock, the dynamics of the analysed equity indices became more mutually recoverable in the CCM sense. The Global Financial Crisis also shows stronger coupling, but with a different temporal profile, as coupling remains elevated into the post-crisis period.
The findings also show that crisis coupling is bidirectional rather than purely one-way. During COVID-19, US-to-European directions are generally stronger than the reverse directions, but European indices also contain recoverable information about US indices. The lagged CCM analysis further suggests that COVID-19 transatlantic coupling was strongest over a short contemporaneous to three-trading-day horizon, although this should be interpreted as an indicative coupling window rather than an exact transmission speed.
The main conclusion is that CCM provides a useful nonlinear mathematical modelling framework for analysing crisis-period market coupling. Its value lies in estimating the strength of recoverable dynamical footprints between markets and testing whether this recoverability strengthens during financial stress. The method does not replace correlation, volatility, Granger causality, transfer entropy or conventional contagion analysis, and it does not prove direct mechanical causation between indices. Instead, it adds a complementary state-space perspective on market interdependence. Future work should extend the analysis to additional asset classes, higher-frequency data, alternative crisis windows, broader embedding-parameter and time-delay sensitivity checks, formal benchmark comparisons with Granger causality and transfer entropy, and tests of whether CCM-based coupling indicators improve crisis-monitoring systems.
Supplementary Materials
The following supporting information will be made available with the article: reproducible R scripts for the main pairwise CCM analysis, the lagged COVID-19 transatlantic CCM analysis and the embedding-dimension sensitivity analysis; cleaned aligned adjusted-price and log-return datasets; metadata; pairwise CCM output tables; directional asymmetry tables; lagged CCM output tables; best-lag summaries; embedding-sensitivity tables and figures; manuscript-ready tables; publication figures; supplementary figures; README file; and supplementary captions and legends.
Author Contributions
Conceptualization, D.V.; methodology, D.V.; software, D.V.; validation, D.V.; formal analysis, D.V.; investigation, D.V.; data curation, D.V.; writing, original draft preparation, D.V.; writing, review and editing, D.V.; visualization, D.V. The author has read and agreed to the published version of the manuscript.
Funding
This research received no external funding.
Institutional Review Board Statement
Not applicable.
Informed Consent Statement
Not applicable.
Data Availability Statement
The original market data used in this study were obtained from publicly available Yahoo Finance index series for the Dow Jones Industrial Average, S&P 500, FTSE 100 and DAX. The processed datasets, R code and output tables supporting the results of this study will be made available as supplementary material and/or deposited in a public repository prior to publication.
Acknowledgments
During the preparation of this manuscript, the author used OpenAI GPT-5.5 Thinking, to assist with improving the readability of the manuscript text. The author reviewed and edited the output and takes full responsibility for the content of this publication.
Conflicts of Interest
The author declare no conflicts of interest.
Abbreviations
The following abbreviations are used in this manuscript:
| CCM | Convergent Cross Mapping |
| COVID-19 | Coronavirus disease 2019 |
| DAX | Deutscher Aktienindex |
| DJIA | Dow Jones Industrial Average |
| FTSE 100 | Financial Times Stock Exchange 100 Index |
| GFC | Global Financial Crisis |
| S&P 500 | Standard & Poor’s 500 Index |
| TE | Transfer Entropy |
| VAR | Vector Autoregression |
| WHO | World Health Organization |
References
- Barnett, L.; Barrett, A. B.; Seth, A. K. Granger causality and transfer entropy are equivalent for Gaussian variables. Phys. Rev. Lett. 2009, 103(23), 238701. [Google Scholar] [CrossRef] [PubMed]
- Clark, A. T.; Ye, H.; Isbell, F.; Deyle, E. R.; Cowles, J.; Tilman, G. D.; Sugihara, G. Spatial convergent cross mapping to detect causal relationships from short time series. Ecology 2015, 96(5), 1174–1181. [Google Scholar] [CrossRef] [PubMed]
- Dobrev, D.; Meldrum, A. What do quoted spreads tell us about machine trading at times of market stress? Evidence from Treasury and FX markets during the COVID-19-related market turmoil in March 2020. In FEDS Notes; Board of Governors of the Federal Reserve System, 25 September 2020. [Google Scholar] [CrossRef]
- Granger, C. W. J. Investigating causal relations by econometric models and cross-spectral methods. Econometrica 1969, 37(3), 424–438. [Google Scholar] [CrossRef]
- Ryan, J. A.; Ulrich, J. M. 2025. quantmod: Quantitative financial modelling framework [R package]. Available online: CRAN, package quantmod, accessed on 16 May 2026.
- Schreiber, T. Measuring information transfer. Phys. Rev. Lett. 2000, 85(2), 461–464. [Google Scholar] [CrossRef] [PubMed]
- Sugihara, G.; May, R.; Ye, H.; Hsieh, C.-h.; Deyle, E.; Fogarty, M.; Munch, S. Detecting causality in complex ecosystems. Science 2012, 338(6106), 496–500. [Google Scholar] [CrossRef] [PubMed]
- Takens, F. Detecting strange attractors in turbulence. In Dynamical systems and turbulence, Warwick 1980 (Lecture Notes in Mathematics; Rand, D., Young, L.-S., Eds.; Springer, 1981; Vol. 898, pp. 366–381. [Google Scholar] [CrossRef]
- World Health Organization. (2020a, January 30). Statement on the second meeting of the International Health Regulations (2005) Emergency Committee regarding the outbreak of novel coronavirus (2019-nCoV). Available online at the World Health Organization website, accessed on 16 May 2026.
- World Health Organization. (2020b, March 11). WHO Director-General’s opening remarks at the media briefing on COVID-19, 11 March 2020. Available online at the World Health Organization website, accessed on 16 May 2026. World Health Organization website.
Figure 1.
Daily log returns for the Dow Jones Industrial Average, S&P 500, FTSE 100 and DAX. The figure shows periods of elevated volatility around the Global Financial Crisis and the COVID-19 market shock.
Figure 1.
Daily log returns for the Dow Jones Industrial Average, S&P 500, FTSE 100 and DAX. The figure shows periods of elevated volatility around the Global Financial Crisis and the COVID-19 market shock.
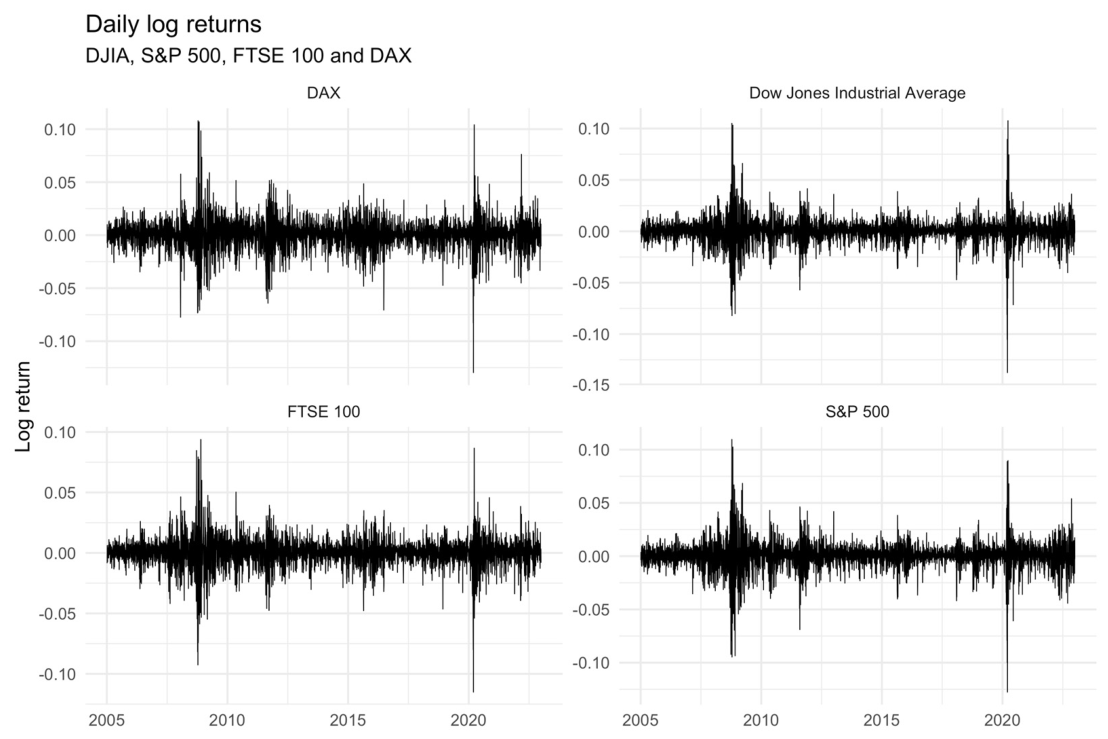
Figure 2.
Average nonlinear market coupling by crisis phase. The figure shows mean late-library cross-map skill for each crisis episode and phase. The COVID-19 market shock shows a sharp crisis-period increase followed by a post-crisis decline, while the Global Financial Crisis shows elevated coupling that persists into the post-crisis phase.
Figure 2.
Average nonlinear market coupling by crisis phase. The figure shows mean late-library cross-map skill for each crisis episode and phase. The COVID-19 market shock shows a sharp crisis-period increase followed by a post-crisis decline, while the Global Financial Crisis shows elevated coupling that persists into the post-crisis phase.
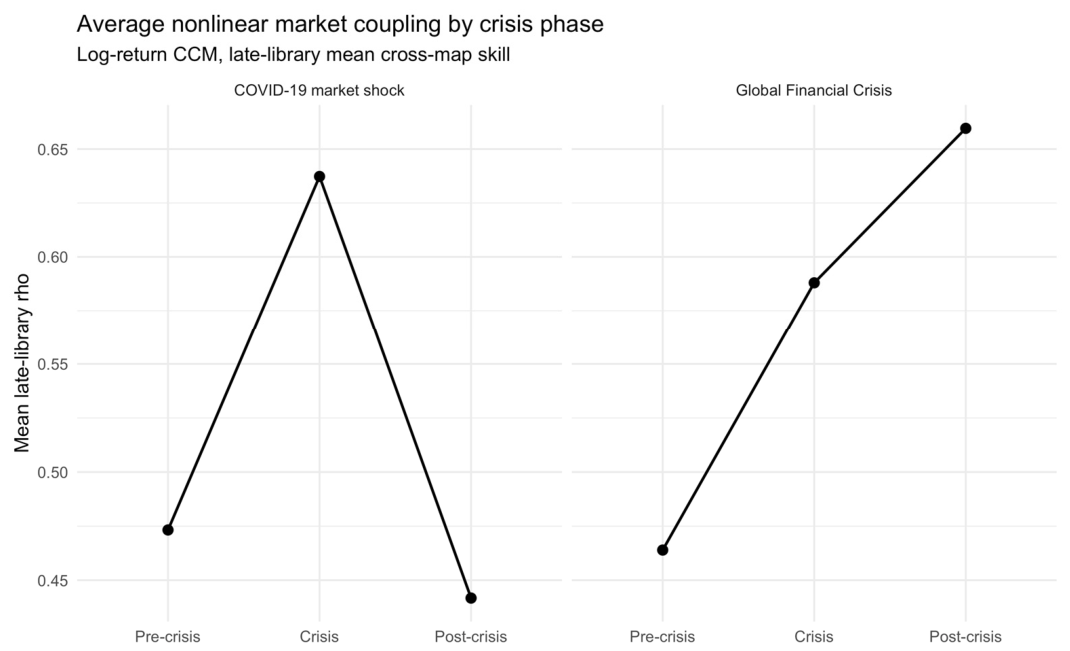
Figure 3.
Directional CCM coupling during crisis phases. The heatmap shows late-library cross-map skill for all directional relationships during the crisis phase of each episode. Darker cells indicate stronger nonlinear coupling. Blank diagonal cells indicate self-pairs, which were not estimated.
Figure 3.
Directional CCM coupling during crisis phases. The heatmap shows late-library cross-map skill for all directional relationships during the crisis phase of each episode. Darker cells indicate stronger nonlinear coupling. Blank diagonal cells indicate self-pairs, which were not estimated.
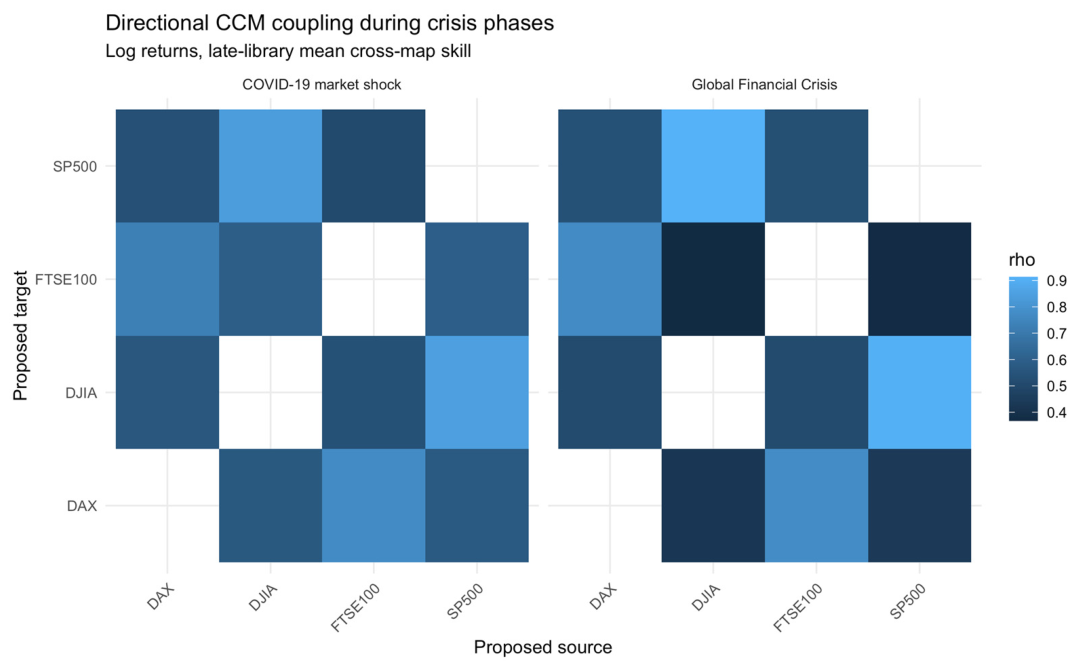
Figure 4.
DJIA and FTSE 100 nonlinear coupling by phase. The figure shows late-library cross-map skill for the DJIA to FTSE 100 and FTSE 100 to DJIA directions across pre-crisis, crisis and post-crisis phases. During the COVID-19 crisis phase, coupling strengthens in both directions, with the DJIA to FTSE 100 direction stronger than the reverse direction.
Figure 4.
DJIA and FTSE 100 nonlinear coupling by phase. The figure shows late-library cross-map skill for the DJIA to FTSE 100 and FTSE 100 to DJIA directions across pre-crisis, crisis and post-crisis phases. During the COVID-19 crisis phase, coupling strengthens in both directions, with the DJIA to FTSE 100 direction stronger than the reverse direction.
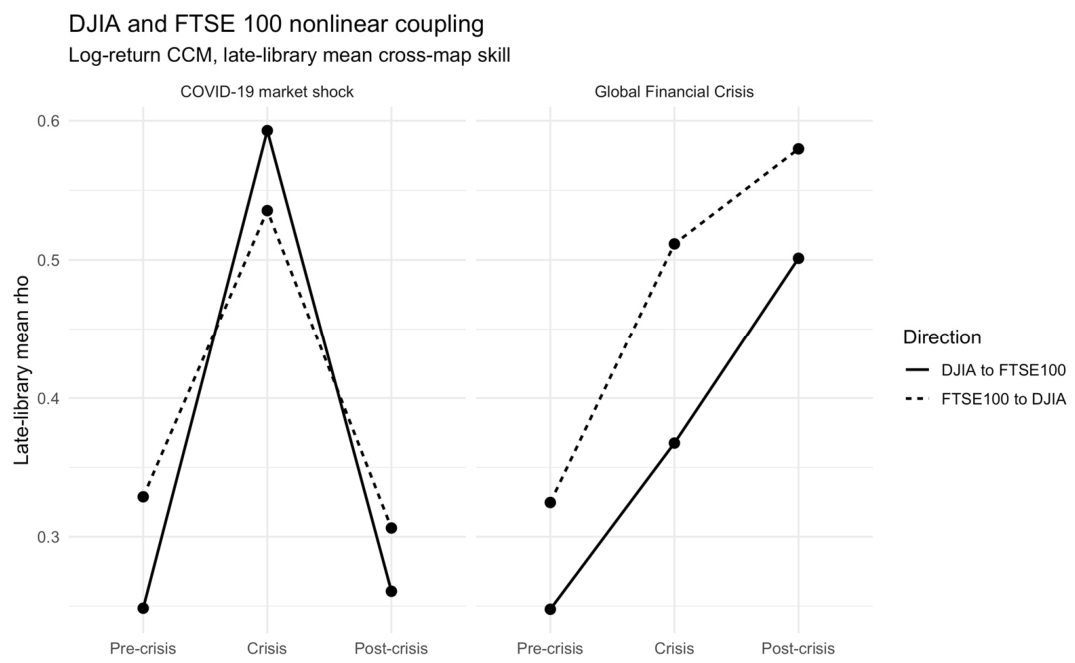
Figure 5.
Lagged CCM during the COVID-19 crisis phase. The figure shows late-library cross-map skill for key transatlantic pairs across lags from -5 to +5 trading days. Positive lag values indicate that the proposed source leads the proposed target. The strongest coupling generally occurs over a short window around lag 0 to +3 trading days.
Figure 5.
Lagged CCM during the COVID-19 crisis phase. The figure shows late-library cross-map skill for key transatlantic pairs across lags from -5 to +5 trading days. Positive lag values indicate that the proposed source leads the proposed target. The strongest coupling generally occurs over a short window around lag 0 to +3 trading days.
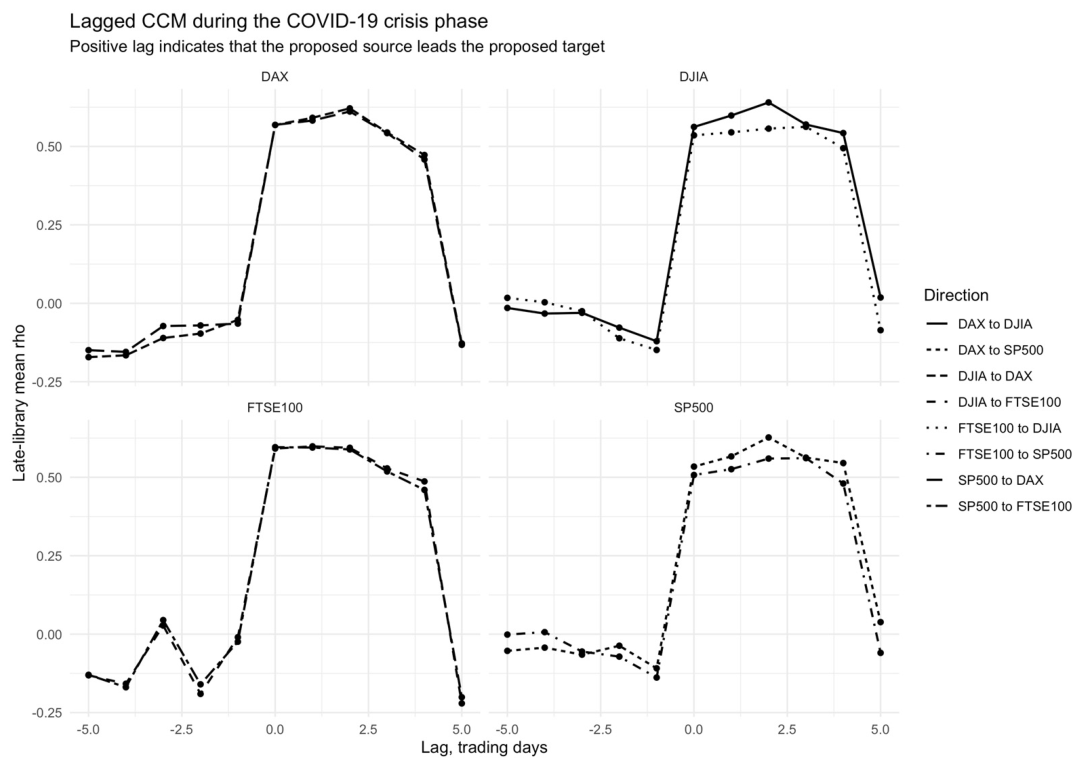
Table 1.
Crisis episodes and analysis windows.
| Episode | Phase | Start date | End date | Description |
|---|---|---|---|---|
| Global Financial Crisis | Pre-crisis | 3 January 2005 | 29 June 2007 | Pre-crisis baseline |
| Global Financial Crisis | Crisis | 2 July 2007 | 30 June 2009 | Financial crisis and post-Lehman stress |
| Global Financial Crisis | Post-crisis | 1 July 2009 | 31 December 2010 | Early post-crisis period |
| COVID-19 market shock | Pre-crisis | 2 January 2018 | 18 February 2020 | Pre-COVID baseline |
| COVID-19 market shock | Crisis | 19 February 2020 | 30 June 2020 | COVID-19 sell-off and early recovery |
| COVID-19 market shock | Post-crisis | 1 July 2020 | 31 December 2021 | Post-shock recovery period |
Table 2.
Average CCM coupling by episode and phase.
| Episode | Phase | Mean late-library rho | Median late-library rho | Mean convergence | Proportion convergent |
|---|---|---|---|---|---|
| COVID-19 market shock | Pre-crisis | 0.473 | 0.376 | 0.345 | 0.667 |
| COVID-19 market shock | Crisis | 0.637 | 0.581 | 0.939 | 1.000 |
| COVID-19 market shock | Post-crisis | 0.442 | 0.338 | 0.768 | 1.000 |
| Global Financial Crisis | Pre-crisis | 0.464 | 0.329 | 0.244 | 0.583 |
| Global Financial Crisis | Crisis | 0.588 | 0.519 | 0.555 | 0.667 |
| Global Financial Crisis | Post-crisis | 0.660 | 0.596 | 0.632 | 0.833 |
Note: Late-library rho is the mean cross-map skill over the final third of library sizes. Convergence was assessed using a positive relationship between library size and cross-map skill, together with a higher final than initial cross-map skill.
Table 3.
Key transatlantic CCM results during the COVID-19 crisis phase.
| Direction | Late-library rho | End rho | Convergence | Convergent |
|---|---|---|---|---|
| DJIA to FTSE 100 | 0.593 | 0.600 | 0.994 | Yes |
| FTSE 100 to DJIA | 0.535 | 0.532 | 0.933 | Yes |
| S&P 500 to FTSE 100 | 0.595 | 0.604 | 0.993 | Yes |
| FTSE 100 to S&P 500 | 0.508 | 0.506 | 0.936 | Yes |
| DJIA to DAX | 0.569 | 0.569 | 0.966 | Yes |
| DAX to DJIA | 0.561 | 0.553 | 0.833 | Yes |
| S&P 500 to DAX | 0.570 | 0.572 | 0.964 | Yes |
| DAX to S&P 500 | 0.532 | 0.527 | 0.720 | Yes |
Disclaimer/Publisher’s Note: The statements, opinions and data contained in all publications are solely those of the individual author(s) and contributor(s) and not of MDPI and/or the editor(s). MDPI and/or the editor(s) disclaim responsibility for any injury to people or property resulting from any ideas, methods, instructions or products referred to in the content. |
© 2026 by the authors. Licensee MDPI, Basel, Switzerland. This article is an open access article distributed under the terms and conditions of the Creative Commons Attribution (CC BY) license (http://creativecommons.org/licenses/by/4.0/).
Copyright: This open access article is published under a Creative Commons CC BY 4.0 license, which permit the free download, distribution, and reuse, provided that the author and preprint are cited in any reuse.


