

Submitted:
18 June 2026
Posted:
22 June 2026
You are already at the latest version
Abstract
Background/Objectives: Rotator cuff tears are a leading cause of shoulder disability. While multi-sequence MRI is standard, the optimal deep learning integration of het-erogeneous image series and clinical metadata remains unresolved. This study evalu-ated a hierarchical, sequence-aware multimodal framework for patient-level binary rotator cuff tear classification. Methods: A single-center cohort of 199 patients (100 tears, 99 controls) was analyzed across four MRI sequences (T1 coronal, T2 fat-suppressed sagittal, and proton density [PD] fat-suppressed coronal and trans-verse/axial) and nine demographic features. Under a patient-level stratified three-fold cross-validation scheme preventing data leakage, we evaluated ResNet50 and Vision Transformer baselines (Study 0), full-protocol fusion topologies (Study 1), and system-atically mapped sequence-subset combinations with or without metadata (Study 2). Results: In Study 0, the PD coronal ResNet50 model was the top baseline (AUC = 0.9834, F1 = 0.9515). In Study 1, late decision fusion yielded the highest AUC (0.9909), while feature concatenation optimized threshold balance (F1 = 0.9502). In Study 2, a streamlined three-sequence subset with metadata (C14M: T2 + PDc + PDt) achieved peak performance (AUC = 0.9961, 95% CI: 0.9806–0.9986, F1 = 0.9618, MCC = 0.9238), outperforming the full protocol (AUC = 0.9909, F1 = 0.9355). Metadata utility was con-figuration-dependent, assisting only fluid-sensitive combinations. Conclusions: Rather than indiscriminately aggregating entire clinical protocols, multimodal fusion is opti-mized by selecting complementary imaging series. For binary classification, excluding non-fat-suppressed T1 images in favor of a streamlined T2 and PD set stabilized by clinical demographics maximizes diagnostic capacity.
Keywords:
rotator cuff tear
; shoulder MRI
; multi-sequence MRI
; deep learning
; convolutional neural network
; vision transformer
; multimodal fusion
; clinical metadata
; sequence selection
1. Introduction
Rotator cuff tears represent one of the most common and clinically consequential disorders of the shoulder, particularly in middle-aged and older adults. Their importance is not limited to the mere presence or absence of tendon discontinuity; tear size, tear chronicity, tendon retraction, muscle atrophy, fatty infiltration, and associated shoulder pathology all influence treatment decisions, surgical repairability, postoperative healing, and long-term function [1,2]. MRI is routinely used because it offers multiplanar soft-tissue contrast and can depict both direct tendon abnormalities and secondary signs, such as fluid-sensitive signal changes, muscle quality, bursal involvement, and adjacent joint findings [3,4,5,6]. Nevertheless, routine shoulder MRI interpretation remains demanding. Partial-thickness tears, small full-thickness tears, degenerative tendon changes, calcific tendinosis, subscapularis involvement, and postoperative or chronic changes can create diagnostic uncertainty even when high-quality imaging is available.
The increasing clinical and technical interest in artificial intelligence (AI) for shoulder MRI reflects this diagnostic complexity. Early and contemporary deep learning studies have demonstrated that convolutional neural networks, 3D networks, radiomics models, transformer-style comparators, multitask systems, and segmentation pipelines can detect or grade rotator cuff and supraspinatus-related abnormalities on MRI [7,8,9,10,11,12,13,14,15,16]. Recent systematic reviews of MRI-based rotator cuff tear AI models and broader shoulder AI applications further support the feasibility of automated interpretation, while also emphasizing limitations related to cohort size, external validation, scanner heterogeneity, task definition, reporting quality, and clinical integration [16,17,18]. A prior study in the literature evaluated patient-level rotator cuff tear classification on shoulder MRI using an explainable Vision Transformer framework, emphasizing patient-level aggregation and the anatomical plausibility of visual explanations [19].
However, one important question remains underdeveloped in the rotator cuff tear literature: how should different MRI sequences and non-image clinical variables be used together? Shoulder MRI is inherently multi-sequence. A conventional examination consists of a set of acquisitions that differ in contrast weighting, fat suppression, plane, anatomical emphasis, and susceptibility to sequence-specific artifacts, rather than a single homogeneous image series. T1-weighted coronal imaging may provide useful anatomical and marrow context; T2 fat-suppressed sagittal imaging is sensitive to fluid and muscle-tendon relationships; PD fat-suppressed coronal imaging is often informative for supraspinatus tendon integrity; and PD fat-suppressed axial or transverse imaging contributes transverse-plane information on the cuff, biceps, and related structures. From a machine learning perspective, these inputs may provide complementary information, but they can also introduce redundancy, domain heterogeneity, or weakly informative features that are amplified in small datasets.
The broader medical imaging literature provides a strong methodological basis for treating sequence selection as an empirical question rather than a fixed assumption. Multi-sequence and multiparametric MRI studies have shown that MRI sequences can contain both complementary and redundant information, and that complete protocols are not automatically optimal for every downstream learning objective [20,21,22,23,24,25,26,27,28,29,30,31]. In multi-sequence MRI representation learning, redundant information may interfere with efficient feature mining, while selected sequence subsets can sometimes approach full-protocol performance [20]. Missing-modality and incomplete-modality brain MRI studies similarly show that performance depends on which sequence is missing, which anatomical or pathological target is being predicted, and how fusion is performed [24,25,26,27,28,29]. The pediatric brain tumor segmentation work by Piffer et al. is relevant to the present study only as a conceptual example of this sequence-selection logic; because it concerns brain tumor segmentation rather than shoulder MRI or rotator cuff tear classification, it should be viewed strictly as a conceptual analogue rather than direct musculoskeletal evidence [21].
Clinical metadata adds a second layer of complexity. Age, sex, body habitus, laterality, and acquisition year can be clinically meaningful or technically informative, but such variables can also encode site-specific practice patterns, missingness, referral bias, or non-causal correlations. Reviews of image and electronic health record (EHR) fusion alongside multimodal biomedical AI suggest that structured clinical variables may improve imaging-based models when they add information not already present in the images. However, these reviews also warn that fusion design, missingness, confounding, and validation strategies ultimately determine whether a multimodal model is genuinely viable across diverse clinical scenarios [32,33,34,35,36,37,38,39,40]. In other words, metadata should not be treated as a universally beneficial attachment to an image model; its value must be rigorously tested in relation to the specific image feature set and task.
To address these challenges, we developed a multi-sequence, multimodal deep learning framework utilizing both convolutional (ResNet50) and transformer-based (Vision Transformer) architectures explicitly designed for patient-level rotator cuff tear diagnosis. Rather than presenting this framework as a static, unyielding configuration, we evaluate its behavioral mechanics through a systematic, hierarchical experimental design. Within this paradigm, "hierarchical" refers directly to the sequential decision flow of our investigations. Study 0 establishes single-sequence baselines and contrasts the inductive biases of ResNet50 against Vision Transformers under a unified, patient-level evaluation protocol. Study 1 benchmarks alternative multimodal fusion topologies using the complete four-sequence clinical protocol plus metadata, thereby isolating a highly stable fusion family suitable for combinatorial scaling. Study 2 then systematically maps all pairwise and three-sequence MRI combinations with and without metadata. This structural pipeline mirrors a practical clinical engineering question: before asserting that a multimodal system is ready for clinical deployment, one must determine which imaging sequence is intrinsically informative alone, which fusion strategy generalizes reliably, and whether adding more cross-domain data actually yields an incremental diagnostic benefit.
The core contributions of this study are therefore fourfold:
- First, we present a single-center, multi-sequence shoulder MRI cohort () accompanied by structured clinical metadata, explicitly curated for binary rotator cuff tear classification under a strict, leakage-free protocol.
- Second, we provide a comprehensive, slice-masked baseline benchmark comparing convolutional and transformer-based backbones across four distinct MRI planes and contrast weightings.
- Third, we systematically compare alternative multimodal fusion strategies to isolate the most robust decision-level archetype for multi-sequence aggregation.
- Fourth, we execute a granular sequence-combination analysis that isolates and quantifies the exact marginal performance deltas induced by clinical metadata across precisely matched feature spaces.
As a conclusion, our empirical evaluations demonstrate that the highest diagnostic performance within this cohort is achieved by a streamlined three-sequence subset (T2 + PDc + PDt) enhanced by clinical metadata, rather than by indiscriminately aggregating the entire clinical imaging protocol. This critical takeaway proves that adding non-fat-suppressed anatomical series introduces feature redundancy that degrades classification boundaries, showcasing that targeted sequence selection is essential for optimizing multimodal medical architectures.
2. Materials and Methods
This section delineates the methodological framework established to systematically evaluate multi-sequence shoulder MRI and clinical metadata fusion for rotator cuff tear classification. It describes the retrospective cohort definition, ethical considerations, and parameters governing multiplanar MRI acquisitions. Furthermore, it details the problem formulation, rigorous image preprocessing, slice standardization techniques, data augmentation strategies, and patient-level cross-validation protocols. Finally, it presents the specific deep learning architectures (ResNet50 and Vision Transformers), structured clinical metadata encoding pipelines, multimodal fusion strategies, optimization schedules, and visual explainability methodologies in accordance with transparent medical AI reporting standards.
The global experimental architecture and the five-stage procedural flow of this study are illustrated in Figure 1. To preserve a clear structural connection between the subheadings and the operational flow depicted in the schematic, detailed descriptions of these stages are organized and given as follows:
- Stage 1 (Cohort Assembly): Detailed patient baseline and ethical parameters are provided in Section 2.1.
- Stage 2 (Multimodal Inputs): Technical MRI acquisition profiles and structured metadata encoding pipelines are described in Section 2.2 and Section 2.3.
- Stage 3 (Hierarchical Design): Problem formulation, standardization, image preprocessing, and core model architectures are mapped across Section 2.4, Section 2.5, Section 2.7 and Section 2.8, and 2.11.
- Stage 4 (Empirical Best Model Topology): Multimodal fusion strategies, regularization schedules, and optimization details are evaluated in Section 2.9 and Section 2.10.
- Stage 5 (Patient-Level Evaluation): Cross-validation protocols, statistical output metrics, explainability mapping, and reporting standards are presented in Section 2.6, Section 2.12 and Section 2.13, and 2.14.
2.1. Study Design, Ethical Context, and Cohort Definition
This retrospective, single-center study included 199 patients who underwent shoulder MRI and had binary labels for rotator cuff tear classification. The positive class was defined as the presence of a rotator cuff tear, and the negative class was defined as the absence of a tear. The cohort comprised 100 tear cases and 99 no-tear cases. The mean age of the cohort was years, and the mean body mass index (BMI) was . The cohort included 118 female and 81 male patients. Laterality was right-sided in 74 patients, left-sided in 56 patients, and unspecified in 69 patients. MRI examinations were performed in either 2024 () or 2025 (). Detailed demographic and clinical characteristics are provided in Table 1.
The study was designed as a patient-level diagnostic modeling study. To prevent data leakage arising from slice-level correlation, all slices belonging to a single patient were strictly confined to the same cross-validation fold. This partitioning strategy is critical because shoulder MRI examinations contain multiple adjacent slices from the same anatomical volume; if slices from the same patient appear across both training and test partitions, model performance metrics may be artificially inflated.
The study was conducted in accordance with the Declaration of Helsinki. The research protocol, entitled “Multimodal Diagnosis and Virtual Assistant Use in Magnetic Resonance Imaging for Rotator Cuff Tear Diagnosis,” was reviewed and approved by the Non-Interventional Clinical Research Ethics Committee of Bilecik Şeyh Edebali University (Approval Date: 30 October 2025; Meeting Number: 2025/10; Decision Number: 9).
2.2. MRI Acquisition and Sequence-Level Inputs
For each patient, four distinct MRI sequences were evaluated: T1-weighted turbo spin-echo (TSE) coronal, T2-weighted TSE fat-suppressed sagittal, proton density (PD)-weighted TSE fat-suppressed coronal, and PD-weighted TSE fat-suppressed axial/transverse imaging. Acquisition metadata indicated a image matrix across all four sequence groups. The mean repetition time (TR) and echo time (TE) were approximately 669.2/20.1 ms for T1 TSE coronal, 4258.2/71.0 ms for T2 TSE fat-suppressed sagittal, 3115.7/34.1 ms for PD TSE fat-suppressed coronal, and 3137.3/26.0 ms for PD TSE fat-suppressed axial/transverse imaging. The mean slice thickness was approximately 4.3 mm across all sequences. These acquisition parameters are summarized in Table 2.
For concise reporting, these sequences are abbreviated throughout the manuscript as T1, T2, PDc, and PDt, respectively. The distinction between sequence identity (contrast weighting) and anatomical plane was rigorously preserved throughout the analysis, as deep learning models can exploit both contrast-specific and plane-specific features. Consequently, the sequence-combination analysis treats each sequence-plane acquisition as a distinct, independent input channel at the examination level, rather than assuming that all MRI series are interchangeable.
2.3. Structured Clinical Metadata
Structured clinical metadata included age, sex, weight, height, BMI, laterality, and acquisition study year. The metadata pipeline ingested nine numeric inputs: age, sex, weight (in kilograms), height (in meters), BMI, right laterality, left laterality, unspecified laterality, and study year. Continuous variables were scaled using min-max normalization, where parameters were fitted exclusively on the training set within each fold and subsequently applied to the corresponding validation and test sets. Laterality was one-hot encoded into three dimensions (right, left, or unspecified). This fold-specific preprocessing strategy was strictly enforced to prevent validation or test information from leaking into the training pipeline.
Metadata was treated as a distinct, separate modality rather than a surrogate for imaging. A metadata-only model baseline was established to quantify the baseline diagnostic signal that could be extracted from structured variables alone. In multimodal configurations, the clinical metadata vector was encoded by a small multilayer perceptron (MLP) and either concatenated with image-derived features or converted into an independent decision component, depending on the fusion architecture. This design permitted an empirical evaluation of whether metadata improves specific sequence combinations, rather than merely reporting a single global image-plus-metadata result.
2.4. Problem Formulation
The diagnostic task was formulated as a patient-level binary classification problem leveraging a set of sequence-specific MRI stacks and a structured metadata vector. For patient , the multi-sequence MRI input is represented as:
where denotes an individual MRI sequence from the sequence set , and for denotes the chronologically ordered stack of slices for that specific sequence . Each individual slice is a two-dimensional grayscale MRI image resized and formatted as a three-channel tensor to ensure compatibility with ImageNet-pretrained backbones. The patient-level ground-truth label is defined as , where 1 denotes a rotator cuff tear and 0 denotes no tear. The structured clinical features are represented as a metadata vector .
The optimization objective is to learn a mapping , where is the predicted probability of a rotator cuff tear.
- In Study 0, contains only a single sequence, and the model estimates from a single image stack or from the metadata vector alone.
- In Study 1, encompasses all four MRI sequences alongside metadata to determine the optimal architectural fusion strategy.
- In Study 2, comprises a systematically selected subset of two, three, or four MRI sequences evaluated across matched metadata-free and metadata-enhanced variants. This formulation treats the sequence selection configuration itself as an explicit experimental variable.
2.5. Image Loading, Normalization, and Slice Standardization
MRI slices were parsed using a slice-level metadata index that mapped patient identifiers, binary labels, sequence definitions, instance numbers, and image file paths. For each patient and sequence, slices were sorted by instance number to preserve true anatomical ordering. Images were normalized and resized to pixels using bilinear interpolation. To satisfy fixed-length batch requirements, each sequence stack was standardized to exactly 20 slices via center-padding or center-trimming. Center-trimming was executed if the original stack exceeded 20 slices, while symmetric zero-padding was applied if the stack contained fewer than 20 slices. A binary slice validity mask was retained to differentiate real anatomical images from padded positions.
This slice mask is central to the pipeline's engineering implementation. Let be the feature vector extracted from slice of sequence , and let be the corresponding binary validity indicator ( for real slices, for padded frames). The aggregated sequence-level representation was computed via masked averaging:
This masking formulation prevents zero-padded slices from corrupting the sequence-level representation and allows a uniform architecture to process variable slice counts within a batch.
During training, data augmentation was applied exclusively to valid anatomical slices. The augmentation pipeline included horizontal flipping (probability = 0.5), random rotation (), spatial scaling (0.9 to 1.1), shear transforms (up to ), intensity shifting (up to 0.1), and the injection of Gaussian noise (). Augmentations were restricted entirely to the training sets and were never applied to validation or test folds.
2.6. Patient-Level Cross-Validation and Data Loading
All experiments were evaluated using a stratified three-fold outer cross-validation scheme initialized with random seed 42. Within each outer split, a stratified inner validation partition comprising 15% of the training pool was utilized for early stopping and hyperparameter optimization. The held-out test folds contained 67, 66, and 66 patients, respectively, ensuring that all 199 patients were evaluated exactly once across the three outer folds. The target class was the presence of a rotator cuff tear. Identical fold boundaries were maintained across all model families and sequence combinations to ensure paired, statistically rigorous performance comparisons.
Class imbalances were addressed at both the data-loading and loss-function levels. Image models integrated a weighted random sampler wherein individual training samples were weighted inversely to their respective class frequencies within that specific training fold. Furthermore, the positive-class weight term for the binary cross-entropy loss function was dynamically calculated per training fold as the exact ratio of negative to positive cases. These dual mitigation strategies were implemented because small, fold-level class variations can destabilize decision thresholds, particularly when optimizing high-dimensional imaging models on relatively small patient cohorts.
2.7. Backbone Encoders and Patient-Level Representations
The primary convolutional neural network backbone evaluated was an ImageNet-pretrained ResNet50 architecture [41]. For each slice, the final fully connected classification layer was removed, enabling the convolutional feature extractor to yield a 2048-dimensional feature vector. For a given MRI sequence, slice-level features were aggregated using the previously defined masked mean pooling to derive a singular sequence-level vector. Single-sequence ResNet variants utilized this vector directly (or concatenated it with metadata representations when applicable). Multi-sequence ResNet architectures dedicated an independent sequence encoder to each respective MRI series, subsequently merging the sequence-level vectors according to the specified fusion paradigm.
The Vision Transformer comparator leveraged a pretrained vit_base_patch16_224 backbone [42]. Each pixel slice was tokenized into patches, projected into a 768-dimensional embedding space, and processed through the transformer blocks. To construct a patient-level representation, individual slice embeddings were passed through a temporal sequence-encoding module and aggregated using a class-token ([CLS]) representation. Sequence-specific learnable embeddings were integrated to preserve MRI sequence identity when multiple sequences were processed simultaneously. The implementation adheres to established deep learning guidelines in medical imaging AI, including transfer learning, strict patient-level validation tracking, and reproducible reporting of preprocessing configurations [43,44]. The Vision Transformer models serve exclusively as a comparator framework in Study 0 and Study 1 rather than being presented as a novel architectural contribution.
2.8. Metadata Encoder and Classification Heads
The metadata encoder consisted of a two-layer MLP. The raw nine-dimensional metadata vector was projected to a 64-dimensional hidden layer, followed by layer normalization and a Gaussian Error Linear Unit (GELU) activation function, and then projected to a final 128-dimensional metadata representation with an additional layer normalization and GELU activation. The standalone metadata baseline model utilized a separate MLP architecture configured with hidden dimensions of 64 and 32, layer normalization, GELU activations, a dropout rate of 0.3, and a final scalar logit output.
Image-based classification heads were constructed using fully connected layers combined with layer normalization, GELU activations, and dropout regularizers. The default classification head projected fused representations through hidden dimensions of 256 and 64 prior to computing the final binary logit. For models executing explicit feature concatenation across multiple parallel sequences, an expanded classification head with hidden dimensions of 512 and 128 was utilized to accommodate the substantially increased input feature dimensionality. This architectural adaptation is necessary because feature concatenation preserves high-dimensional joint spaces, whereas late decision fusion merges low-dimensional scalar logits, thereby requiring fewer trainable parameters at the final fusion layer.
2.9. Multimodal Fusion Strategies
Study 1 systematically compared several fusion methodologies leveraging all four MRI sequences alongside clinical metadata.
- Late decision-level fusion first generated independent logits for each individual MRI sequence and, where applicable, a separate logit from the clinical metadata vector. The unified final logit was computed as a learned, softmax-weighted combination:
- Feature concatenation fused sequence-level image representations prior to the classification layers. For a selected sequence subset , the fused joint vector was formed as:
- Attention-weighted fusion dynamically learned sequence importances from projected feature states using a tanh transformation coupled with a scalar attention scoring mechanism followed by softmax normalization across sequences.
- Compact bilinear pooling iteratively fused sequence vectors through randomized count-sketch projections and elementwise multiplication in the Fourier domain, finalized by signed square-root and normalizations.
- Early fusion was restricted to structurally compatible paired sequences and concatenated raw image channels prior to ResNet encoding, utilizing a modified six-channel first convolutional layer adapted from the pretrained three-channel weights.
The purpose of these evaluations was to select a highly stable and performant fusion archetype for the subsequent sequence-combination experiments. Late fusion was selected as the core paradigm for Study 2 because it yielded the highest Area Under the Receiver Operating Characteristic curve (ROC-AUC) in Study 1 and exhibited excellent cross-metric stability. The competitive F1-score performance of the feature concatenation architecture was retained during subsequent interpretation to ensure multi-metric validation.
2.10. Optimization, Regularization, and Reproducibility
All deep learning models were trained for a maximum of 30 epochs with an early stopping patience of 7 epochs. To reduce the risk of selecting an epoch with an inflated AUC but poor threshold-dependent behavior, early stopping was governed by a composite validation score:
Label smoothing () was applied during training. The objective function was minimized using binary cross-entropy with logits, integrating the fold-specific positive-class weights.
Optimization was driven by the AdamW optimizer paired with a weight decay of and a cosine annealing warm-restart learning rate scheduler. ResNet models utilized a backbone learning rate of and a classification head learning rate of . Vision Transformer variants utilized a backbone learning rate of and a head learning rate of . ResNet models were trained with a batch size of 8 and a gradient accumulation step of 2, whereas Vision Transformer models used a batch size of 4 and a gradient accumulation step of 4. Model backbones were frozen for the first 2 epochs for ResNet and the first 3 epochs for Vision Transformers. Gradient clipping with a maximum norm of 1.0 was enforced. All cross-validation experiments were explicitly seeded at execution initialization, and deterministic cuDNN execution flags were set to ensure pipeline reproducibility.
2.11. Hierarchical Experimental Design
The research pipeline was partitioned into three sequential, hierarchical experimental blocks, summarized in Table 3.
- Study 0 evaluated each individual MRI sequence independently using both ResNet50 and Vision Transformer backbones alongside the standalone metadata MLP baseline. This block established which singular imaging sequence retained the highest intrinsic diagnostic signal and verified whether the transformer architecture provided an advantage over the convolutional baseline on this cohort size.
- Study 1 comprehensively evaluated multimodal fusion strategies using all four MRI sequences combined with clinical metadata. Competing methods included ResNet late decision-level fusion, feature concatenation, attention-weighted fusion, compact bilinear pooling, early channel fusion, and parallel Vision Transformer fusion variants. This block determined the optimal fusion architecture to carry forward into the sequence subset analysis.
- Study 2 executed a systematic evaluation of partial MRI sequence combinations with and without clinical metadata. Because single-sequence models were thoroughly charted in Study 0, Study 2 focused specifically on all possible pairwise, three-sequence, and full four-sequence permutations. The incremental value of clinical data was strictly isolated and quantified as the performance delta (, , , and ) between precisely matched metadata-enhanced and metadata-free configurations.
2.12. Performance Metrics, Confidence Intervals, and Statistical Outputs
Model classification performance was evaluated across the three independent patient-level test folds. Computed evaluation metrics included ROC-AUC, average precision (AP), accuracy, sensitivity, specificity, precision, F1-score, the Matthews correlation coefficient (MCC), negative predictive value (NPV), and cross-entropy loss. Threshold-dependent metrics were computed using a fixed decision threshold of 0.5. Specificity was calculated as , sensitivity as , precision as , and NPV as . The MCC was tracked to provide a balanced assessment of binary classification quality that remains robust against fold-level variations in class proportions.
Confidence intervals for the ROC-AUC metrics were generated via a bootstrapping procedure leveraging 200 stratified resamples. Paired ROC-AUC statistical significances were computed using DeLong's test [45]. Model selection criteria avoided reliance on any singular performance metric; instead, the final selection integrated ROC-AUC, F1-score, sensitivity/specificity balance, precision, MCC stability, and the variance of confidence intervals across the outer validation folds.
2.13. Explainability and Visual Quality Control
Experimental outputs generated by the evaluation pipeline included ROC curves, confusion matrices, fold-level prediction spreads, and explainability galleries. For ResNet-based models, Gradient-weighted Class Activation Mapping (Grad-CAM) visualizations were computed from the final feature maps of the terminal convolutional layer [46]. For Vision Transformer comparators, attention-based saliency maps were extracted from the self-attention weights. To prevent heatmaps from misallocating importance to uninformative zero-padded background matrices or air artifacts outside the anatomical boundaries, a binary foreground mask was derived directly from the source image and applied to the computed saliency maps. These explainability outputs were interpreted strictly as qualitative architectural checks rather than clinical proof of human-like radiological reasoning.
The primary visual evidence compiled for manuscript reporting consists of the hierarchical experimental workflow diagram, the Study 0 sequence baseline matrix, the Study 1 fusion-strategy comparison chart, the Study 2 sequence-combination performance heatmap, the metadata contribution delta plot, and the comprehensive diagnostic performance panel. While explainability maps offer qualitative support for anatomical plausibility, the core scientific findings of this study rely strictly on patient-level quantitative test fold data.
2.14. Reporting Standards
The structure and reporting of this manuscript align strictly with established medical imaging AI guidelines, including transparent cohort assembly criteria, explicit patient-level split tracking, precise task definitions, fold-specific metric reporting, and a clear disclosure of external validation constraints. The CLAIM (Clinical AI Modeling), TRIPOD+AI, and STARD-AI reporting frameworks were utilized as foundational checklists for diagnostic accuracy and medical AI study execution [47,48,49]. Accordingly, this study should be interpreted as a rigorous model-development and internal-validation effort, rather than a clinical trial of a deployed clinical decision-support system.
3. Results
In this section, the empirical findings derived from the hierarchical experimental framework are systematically presented across three distinct analytical phases. First, the demographic and acquisition baseline characteristics of the 199-patient cohort are outlined. Next, the unimodal diagnostic capabilities of the deep convolutional and transformer-based networks are established alongside a standalone clinical metadata baseline (Study 0). This is followed by a comprehensive architectural comparison of alternative multimodal fusion topologies using the full four-sequence clinical protocol (Study 1). Finally, a systematic sequence-combination analysis isolates the optimal partial imaging configurations and quantifies the performance deltas induced by clinical metadata integration (Study 2), alongside cross-validation stability and qualitative explainability assessments.
3.1. Cohort and MRI Inputs
The final cohort included 199 patients, consisting of 100 tear cases and 99 no-tear cases. All patients had the four predefined shoulder MRI sequences available: T1, T2, PDc, and PDt. The three held-out test folds contained 67, 66, and 66 patients, respectively. The balanced target class distribution allowed sensitivity and specificity to be interpreted directly without the skew of a majority-class imbalance. However, fold-level variance remained experimentally relevant because each validation partition contained approximately one-third of the total cohort.
The demographic and clinical characteristics are summarized in Table 1, and the acquisition parameters are detailed in Table 2. The sequence abbreviations used throughout this section correspond directly to the acquisition groups defined in the methods. The sequence-combination alphanumeric labels in Study 2 follow a systematic configuration matrix, where the presence or absence of each individual MRI sequence is indexed relative to the baseline order (T1, T2, PDc, and PDt). The suffix "M" explicitly denotes the inclusion of structured clinical metadata.
3.2. Study 0: Single-Sequence Baselines and ResNet-ViT Comparison
Study 0 demonstrated that individual MRI sequences contained a highly robust diagnostic signal for binary rotator cuff tear classification. Among all single-sequence models evaluated, the convolutional ResNet50 baseline trained on the PDc sequence yielded the highest overall diagnostic performance, achieving an , , , , , a Matthews correlation coefficient () of , and a bootstrapped for the AUC of . The ResNet T2 model also performed strongly (; ), followed closely by the ResNet PDt model (; ). These findings are clinically plausible, as proton density fat-suppressed coronal imaging and fluid-sensitive sagittal views are the radiological standards for evaluating tendon integrity, fluid-tendon interfaces, and general muscle-tendon relationships.
The single-sequence Vision Transformer (ViT) architectures were highly competitive but did not outperform the top-performing convolutional baselines on this dataset. The highest performing ViT configuration was achieved using the PDt sequence (; ), followed by T2 (; ) and PDc (; ). This performance gap does not imply that transformer models are inherently unsuited for shoulder pathodynamics; rather, it indicates that given our cohort size, the ImageNet-pretrained ResNet50 encoder combined with our masked slice-level aggregation and fold-level optimization pipeline yielded a superior single-sequence diagnostic profile.
The standalone clinical metadata model performed substantially worse than all image-based models, yielding an and an . This baseline is important because it prevents the overinterpretation of clinical risk factors; while non-image electronic health record variables hold an undercurrent of diagnostic signal, they are wholly insufficient for accurate classification without corresponding multiplanar imaging features. Thus, Study 0 justified two fundamental downstream choices: deep image feature mining is mandatory for this task, and the ResNet backbone offers the most stable baseline for the subsequent combinatorial analysis. The complete single-sequence baseline performance metrics are documented in Table 4.
3.3. Study 1: Multimodal Fusion Strategy Comparison
Study 1 compared multimodal fusion architectures leveraging the complete four-sequence MRI protocol alongside clinical metadata. The ResNet late-fusion architecture achieved the highest ranking capacity among all evaluated options, demonstrating an , , , , , , , and an of . Conversely, the ResNet feature-concatenation model achieved a lower overall area under the curve but produced a higher localized F1-measure (; ; ). The late-fusion Vision Transformer model yielded an and an .
These discrepancies emphasize why multimodal optimization should never be collapsed into a single metric. Late fusion optimized global ranking accuracy and achieved a balanced sensitivity-specificity profile across thresholds, whereas feature concatenation maximized the explicit precision-recall trade-off at the default classification threshold. In a clinical diagnostic pipeline, both characteristics are valuable: superior ranking performance supports custom operational threshold tuning, while the F1-score reflects the real-world performance of an uncalibrated, deployed model.
ResNet late fusion was chosen as the primary engine for Study 2 due to its superior AUC profile in Study 1 and its modular, decision-level configuration. By isolating each sequence's logit contribution prior to weighted aggregation, the late-fusion pipeline dampens the risk of high-dimensional concatenated spaces causing catastrophic overfitting on constrained training partitions. The comparison of these distinct multimodal architectures is detailed in Table 5.
3.4. Study 2: MRI Sequence-Combination Analysis
Study 2 investigated whether optimal diagnostics require the full diagnostic sequence complement, or if selective subset configurations could yield superior results. The top-performing overall model across the entire experimental block was C14M, which combined the T2, PDc, and PDt sequences with structured clinical metadata. C14M achieved an , , , , , , , a negative predictive value () of , and a tight bootstrapped for the AUC of . The comprehensive evaluation of all combinatorial variations with and without clinical metadata is structured in Table 6.
The fold-level performance metrics for the optimal C14M configuration were highly consistent across the cross-validation splits, as detailed below:
- Fold 0: , , , , , .
- Fold 1: , , , , , .
- Fold 2: , , , , , .
This breakdown demonstrates excellent ranking stability across all validation partitions, with minor localized fluctuations confined to threshold-dependent sensitivity and specificity trade-offs. The detailed cross-validation slice tracking for the optimal C14M framework is reported in Table 7.
Crucially, the full four-sequence metadata-enhanced configuration was outperformed by the streamlined three-sequence C14M model, with the complete protocol model achieving a lower , , , , , , and . In this cohort, excluding the T1 sequence while preserving the fat-suppressed, fluid-sensitive, and proton density sequences maximized classification accuracy. This does not imply that T1-weighted sequences are clinically redundant; rather, it highlights that for this specific binary computer-aided diagnosis task, adding non-fat-suppressed anatomical data introduced feature noise that detracted from the core signal captured by the remaining modalities.
3.5. Metadata Contribution
The diagnostic contribution of clinical metadata was highly dependent on the baseline image sequence combination. The most pronounced positive effect occurred when metadata was integrated into the three-sequence C14 combination (T2 + PDc + PDt). Upgrading from C14 to C14M increased the performance profile substantially: , , , and . Modest positive improvements were also visible in other subsets, such as the transition from C09 to C09M (; ) and C10 to C10M (; ).
However, the addition of metadata was not a universal benefit. For certain configurations, metadata injection damaged model execution; for example, upgrading C13 to C13M resulted in a performance drop (; ), and the transition from C05 to C05M similarly degraded performance (; ).
These trends strongly challenge the simplistic assumption that appending structured patient features always yields a net positive effect. Clinical data provided its greatest utility when paired with a highly informative image feature set (T2 + PDc + PDt), suggesting that demographic attributes stabilize or calibrate predictions only when the underlying visual tokens are already well-aligned with the pathology. When the imaging features are suboptimal or unaligned, appending clinical data introduces confounding parameters, reinforces site-specific biases, or skews classification thresholds unfavorably. This mirrors broader multimodal EHR-imaging trends where the utility of clinical variables is bounded by cross-modality complementarity and validation architecture [32,33,34,35,36,37,38,39,40]. The isolated performance differences detailing the specific positive and negative impacts of metadata integration are cataloged in Table 8.
3.6. Visual and Explainability Outputs
The generated experimental figures complement the quantitative tables by illustrating the hierarchical framework flow, sequence-combination performance heatmaps, metadata contribution delta charts, and the final diagnostic performance profiles of the optimal configuration. The sequence-combination matrix heatmap is central to our core thesis, visually demonstrating that maximum performance plateaued before the integration of the full four-sequence imaging protocol. The metadata delta plot provides critical non-imaging context, showing the structural divergence between performance gains and losses based on the underlying image combination.
Saliency maps were treated strictly as conservative visual quality metrics. While Grad-CAM heatmaps and ViT attention maps allowed us to confirm that feature extraction localized to valid shoulder structures rather than zero-padded backgrounds or out-of-field air artifacts, these maps do not constitute proof of clinical reasoning, mechanistic understanding, or out-of-distribution generalizability. Representative out-of-fold Grad-CAM activation overlays across the cross-validation splits and fused imaging planes for the optimal late-fusion configuration (C14M) are systematically detailed in Figure 2. Consequently, these visualizations serve strictly as qualitative checks for anatomical plausibility, leaving the patient-level quantitative cross-validation data as the primary empirical validation of this study.
4. Discussion
This section contextualizes the empirical findings of our hierarchical framework within the broader landscape of musculoskeletal artificial intelligence and multiplanar medical imaging translation. We interpret the primary findings, highlighting the robust unimodal signal of fat-suppressed sequences and the nuanced paradox of modality redundancy where streamlined sequence subsets can optimize diagnostic accuracy over full clinical protocols. The role of structured clinical variables is examined as a context-dependent calibration signal rather than an independent predictor. Furthermore, the technical and engineering choices underpinning late decision fusion are critically evaluated alongside direct clinical implications for high-throughput computer-aided diagnosis (CADx) systems. Finally, the intrinsic limitations of this single-center, binary classification study are transparently disclosed, establishing a concrete roadmap for future multi-institutional validation and multi-task algorithmic development.
4.1. Principal Findings
This study evaluated patient-level binary rotator cuff tear classification using a hierarchical multimodal framework designed to systematically isolate the diagnostic value of single-sequence baselines, alternative fusion strategies, and multi-sequence MRI combinations coupled with structured clinical metadata. Three primary findings emerged from this empirical evaluation:
- Robust Unimodal Signal: Individual MRI sequences—most notably proton density fat-suppressed coronal (PDc) and T2-weighted fat-suppressed sagittal (T2) series—contain a highly robust intrinsic diagnostic signal. The top-performing single-sequence model was the ResNet50 baseline trained on PDc images, achieving an and an .
- Trade-offs in Multimodal Fusion: The optimal multimodal architecture depends heavily on fusion topology and metric prioritization. In our all-sequence baseline comparisons, late decision-level fusion maximized global ranking capacity (), whereas feature-level concatenation yielded a superior threshold-dependent precision-recall balance ().
- The Paradox of Modality Redundancy: Maximizing the volume of raw image data does not automatically improve diagnostic accuracy. The strongest overall diagnostic profile in this study was achieved by the C14M configuration—a streamlined three-sequence subset (T2 + PDc + PDt) enhanced by clinical metadata—which systematically outperformed the full four-sequence metadata-enhanced protocol.
Consequently, the central paradigm shift demonstrated by this study moves from an indiscriminate modality-maximal approach to a targeted sequence-aware optimization framework. Multimodal fusion delivers its greatest utility when constituent inputs provide distinct, complementary features regarding the underlying pathology. In our cohort, combining fluid-sensitive sagittal data, coronal tendon details, axial transverse context, and structured patient demographics provided a comprehensive diagnostic landscape. Adding further non-fat-suppressed anatomical series failed to add actionable incremental signals and instead introduced confounding parameters that degraded the model's threshold-dependent classification metrics.
4.2. Relationship to Prior Shoulder MRI AI Studies
Contemporary deep learning literature has firmly established the feasibility of automated shoulder MRI interpretation, demonstrating excellent performance across tasks such as rotator cuff tear detection, supraspinatus tear grading, muscle segmentation, and the quantification of fatty infiltration [7,8,9,10,11,12,13,14,15,16,17,18,19,50,51,52,53]. While that baseline study [19] successfully demonstrated the feasibility of patient-level diagnostics, its scope was focused primarily on evaluating whether an explainable Vision Transformer framework could effectively aggregate slice-level features to yield anatomically plausible visual explanations.
The present study extends that foundational work conceptually rather than structurally. Instead of developing a new model architecture to re-verify if deep learning can classify rotator cuff tears, this study shifts the core research question to a more granular, engineering-focused inquiry: Which specific MRI sequences and metadata inputs should be fused, and under what architectural conditions does fusion yield a genuine diagnostic benefit? This question is highly relevant to translation because clinical musculoskeletal MRI protocols are inherently heterogeneous, consisting of multiple distinct acquisitions designed for separate diagnostic roles.
The exceptional performance of our single-sequence PDc ResNet baseline aligns perfectly with established orthopedic radiology practices, where coronal proton-density fat-suppressed series serve as the gold standard for evaluating supraspinatus tendon disruptions. The strong complementary performances of the T2 sagittal and PDt axial models further reflect their clinical utility in mapping fluid-tendon interfaces and transverse-plane cuff anatomy. Conversely, the finding that the full four-sequence model was outperformed by the C14M configuration suggests that T1-weighted coronal imaging may introduce weakly informative features or redundant noise for this specific binary classification endpoint. This finding must remain task-specific; T1-weighted imaging remains clinically indispensable for marrow characterization, muscle atrophy grading, surgical planning, and differential diagnosis.
4.3. Why Selected Sequence Sets May Outperform Full-Sequence Fusion
The empirical finding that the streamlined C14M model outperformed the complete, all-sequence protocol is compatible with several distinct machine learning and radiomic principles:
- Dimensionality and Parameter Pressure: Appending additional MRI sequences exponentially scales the input feature dimensionality. When utilizing independent backbone encoders per sequence, this increases trainable parameter pressure, escalating the risk of overfitting on a single-center cohort.
- Domain Heterogeneity: Distinct imaging planes and contrast weightings introduce substantial domain variance. Forcing a classifier to reconcile non-fat-suppressed anatomical structures (T1) with fluid-sensitive pathological markers (T2/PD) can introduce contradictory feature vectors that destabilize joint optimization space.
- Spurious Correlations: Small to mid-sized medical imaging datasets are inherently vulnerable to non-generalizable, site-specific artifacts. A sequence that is clinically informative for a human radiologist may still encode non-causal features that undermine deep learning stability for a narrow binary classification task.
- Diminishing Marginal Value: The utility of any single imaging modality is strictly bounded by what is already captured by the existing input set. A sequence may exhibit excellent performance when evaluated in isolation, yet become entirely redundant when combined with higher-capacity, complementary sequences.
This interpretation strongly echoes multi-sequence MRI representation learning trends observed outside the musculoskeletal domain. For example, Han et al. explicitly detailed the interference caused by cross-sequence redundancy and proposed structured sequence-ranking concepts to select optimal subsets for non-inferiority protocols [20]. Similarly, missing-modality brain tumor segmentation studies have routinely shown that the marginal utility of an imaging series is highly dynamic, depending entirely on the target anatomy, the specific task, and the fusion mechanics [24,25,26,27,28,29]. Rather than suggesting that certain sequences are clinically obsolete, these findings support the more cautious, evidence-based claim that deep learning input selection must be empirically tested rather than assumed a priori.
4.4. Metadata as Context Rather Than a Standalone Signal
The poor diagnostic execution of the standalone metadata model () demonstrates that basic clinical variables are wholly insufficient for direct rotator cuff diagnosis. However, injecting these exact same variables into the three-sequence C14 configuration yielded a substantial performance surge (; ). This dichotomy strongly supports a context-dependent interpretation of multimodal biomedical AI: structured demographic features do not act as independent predictors, but rather as calibration anchors that stabilize or contextualize deep image features.
Equally informative are the negative performance deltas observed when metadata was appended to less optimal imaging combinations (e.g., the transitions from C13 to C13M and C05 to C05M). These performance drops demonstrate that metadata is not a universally beneficial attachment. When the underlying visual representation is suboptimal or poorly aligned with the target pathology, appending non-image variables can alter the model's final decision boundary in an unfavorable direction.
This pattern mirrors broader insights from the image-EHR fusion literature, which frequently warns that non-image variables can inadvertently encode institutional workflows, shifting referral patterns, or chronological documentation biases rather than true causal physiological signals [32,33,34,35,36,37,38,39,40]. For instance, acquisition year or age may correlate with machine-specific protocols or degenerate age-related changes rather than acute tear dynamics. Consequently, external validation remains uniquely critical for metadata-enhanced models, as non-image clinical variables are notorious for generalizing less reliably across different healthcare networks than standardized imaging features.
4.5. Engineering Implications
From an engineering standpoint, our results validate the necessity of a staged, hierarchical evaluation pipeline for multimodal medical imaging research.
[Study 0: Establish Unimodal Baselines]
│
▼
[Study 1: Isolate & Optimize Fusion Topology]
│
▼
[Study 2: Systematic Controlled Sequence Selection]
This structural decomposition minimizes the common flaw of blindly attributing performance variations to "multimodality" when the underlying cause may actually be driven by backbone capacity, dimensionality constraints, or volatile threshold-dependent metadata interactions.
Furthermore, our selection of late decision-level fusion for the final sequence-subset analysis carries distinct technical advantages. Late fusion enforces rigid architectural modularity: each sequence-specific encoder specializes in its own localized plane and contrast weighting before projecting an independent logit into a learned, weighted softmax combination (). This modularity shields the model from the catastrophic overfitting that often plagues high-dimensional concatenated feature spaces in data-constrained settings. However, because late fusion inherently discards early, fine-grained cross-sequence spatial correlations, this architectural choice represents a specialized empirical solution for our current cohort size, rather than a universal claim of superiority over early or intermediate fusion methods.
4.6. Clinical Implications
The optimized performance of the C14M configuration offers highly relevant insights for the design of efficient, sequence-aware computer-aided diagnosis (CADx) systems. Specifically, it demonstrates that a machine learning model optimized for binary rotator cuff tear classification does not require the entire multiplanar clinical imaging protocol to achieve peak internal diagnostic accuracy.
Critical Translation Distinction: Model input optimization and clinical protocol reduction are related but non-equivalent paradigms.
This finding must not be misconstrued as a medical recommendation to eliminate T1-weighted sequences from routine shoulder MRI protocols. Hospital imaging protocols are multi-purpose instruments designed to simultaneously rule out alternative pathologies, evaluate bone marrow edema, characterize muscle mass volumes, map labral integrity, and support complex pre-surgical planning—objectives that extend far beyond a binary tendon discontinuity task.
The actionable clinical implication is that developers of musculoskeletal AI architectures must explicitly report the exact sequence configurations utilized by their models and empirically justify their inputs. If subsequent external validations confirm that a streamlined T2 + PDc + PDt + metadata configuration maintains robust accuracy across diverse clinical centers and vendors, such a model could be safely deployed to drive high-throughput triage mechanisms or automated preliminary reporting pipelines, all while the full comprehensive protocol remains fully accessible to the reading radiologist for holistic interpretation.
4.7. Limitations
This study is bound by several important limitations that temper its immediate clinical generalizability:
- Single-Center Constraint: All evaluations were conducted on a single-center cohort of 199 patients without external validation. The near-perfect internal area under the curve metrics ( for C14M) must be interpreted with extreme caution, as medical imaging models routinely experience performance drops when exposed to external data.
- Binary Endpoint Simplification: A binary tear/no-tear target class fails to capture the true, highly nuanced clinical spectrum of rotator cuff pathology. Real-world management hinges on partial-thickness classification, tear measurements, tendon retraction distances, muscle atrophy scoring, and the long-term progression of fatty infiltration.
- Scanner Homogeneity: Although our fold partitioning eliminated slice-level data leakage, the pipeline did not test robustness across alternative scanner vendors, variations in magnetic field strength ( vs. ), or heterogeneous institutional acquisition parameters.
- Metadata Dependency: The structured clinical features were restricted to basic demographic variables available in the source dataset. Their diagnostic contributions may simply reflect localized demographic distributions or center-specific scheduling patterns, limiting their reproducibility elsewhere.
- Fusion-Family Boundary: The sequence-combination matrix in Study 2 was evaluated exclusively within the late decision-level fusion framework selected from Study 1. Alternative architectural families, hyper-scale backbones, self-supervised pretraining regimens, or multi-task optimization objectives might yield entirely different optimal sequence rankings.
- Qualitative Explainability: Visual heatmaps generated via Grad-CAM or transformer attention tracking remain strictly qualitative metrics. They serve as basic anatomical sanity checks but do not constitute mathematical proof of diagnostic reasoning, internal calibration, or causal inference.
4.8. Future Work
To transition these findings toward trustworthy clinical translation, future research must prioritize validating the optimized C14M configuration across multi-institutional, heterogeneous external test sets that represent a wide array of scanner vendors and protocol variations. Additionally, subsequent modeling efforts should expand beyond binary classifications to target clinically richer, multi-task labels—such as differentiating partial-thickness from full-thickness tears, quantifying tendon retraction, and staging fatty infiltration. Transitioning to a multi-task learning paradigm may encourage deep encoders to construct more coherent, radiologically grounded representations rather than exploiting narrow binary shortcuts.
From an engineering perspective, future studies should evaluate alternative fusion paradigms, attention-driven multi-modal transformers, and missing-sequence robust architectures on significantly larger patient populations. Crucially, systematic sequence selection should be coupled with rigorous uncertainty estimation and model calibration assessments; a diagnostic model with an exceptional area under the curve can still prove clinically dangerous if its confidence metrics are poorly calibrated for downstream decision support. Finally, metadata fusion requires deep algorithmic bias and confounder analyses to ensure that clinical variables genuinely reinforce generalizable physiological markers rather than codifying institutional shortcuts.
5. Conclusions
In this single-center shoulder MRI cohort, a hierarchical evaluation of single-sequence baselines, multimodal fusion topologies, and sequence-subset configurations identified a tailored three-sequence protocol—consisting of TSE fat-suppressed sagittal, TSE fat-suppressed coronal, and TSE fat-suppressed axial/transverse imaging—coupled with structured clinical metadata () as the most robust input configuration for binary rotator cuff tear classification. Crucially, the complete four-sequence metadata-enhanced protocol failed to outperform this optimized subset.
These empirical findings demonstrate that a targeted, sequence-aware multimodal fusion approach can be more informative and stable than the indiscriminate aggregation of an entire clinical imaging protocol. Furthermore, the diagnostic utility of clinical metadata was highly combination-dependent, yielding its maximum performance gain only when paired with the fluid-sensitive and proton-density-informed sequence framework (). Ultimately, extensive multi-institutional external validation remains imperative to verify the generalizability of these optimized feature spaces before clinical deployment or the consideration of diagnostic protocol modifications.
Author Contributions
Conceptualization, M.A.; Methodology, S.A. and A.Y.; Software, S.A.; Validation, M.A. and İ.O.; Formal Analysis, S.A. and M.A.; Investigation, M.A., S.A., A.Y. and İ.O.; Data Curation, S.A.; Writing—original draft preparation, M.A., S.A. and A.Y.; Writing—review and editing, M.A., S.A. and A.Y.; Visualization, S.A.; Supervision, M.A., A.Y. and İ.O.; Project administration, M.A. All authors have read and agreed to the published version of the manuscript.
Funding
This study was supported by Scientific and Technological Research Council of Turkey (TUBITAK) under the Grant Number 22AG040. The authors thank to TUBITAK for their supports.
Institutional Review Board Statement
The study was conducted in accordance with the Declaration of Helsinki and was approved by the Non-Interventional Clinical Research Ethics Committee of Bilecik Şeyh Edebali University (Decision No. 9, 10th Meeting, dated 30 October 2025).
Informed Consent Statement
Informed consent was obtained from all subjects involved in the study.
Data Availability Statement
The data presented in this study are available on request from the corresponding author.
Conflicts of Interest
The authors declare no conflicts of interest.
References
- Bedi, A.; Bishop, J.; Keener, J.; Lansdown, D.A.; Levy, O.; MacDonald, P.; Maffulli, N.; Oh, J.H.; Sabesan, V.J.; Sanchez-Sotelo, J.; et al. Rotator Cuff Tears. Nat. Rev. Dis. Prim. 2024, 10, 8. [Google Scholar] [CrossRef] [PubMed]
- Yamamoto, A.; Takagishi, K.; Osawa, T.; Yanagawa, T.; Nakajima, D.; Shitara, H.; Kobayashi, T. Prevalence and Risk Factors of a Rotator Cuff Tear in the General Population. J. Shoulder Elb. Surg. 2010, 19, 116–120. [Google Scholar] [CrossRef] [PubMed]
- de Jesus, J.O.; Parker, L.; Frangos, A.J.; Nazarian, L.N. Accuracy of MRI, MR Arthrography, and Ultrasound in the Diagnosis of Rotator Cuff Tears: A Meta-Analysis. Am. J. Roentgenol. 2009, 192, 1701–1707. [Google Scholar] [CrossRef] [PubMed]
- Lenza, M.; Buchbinder, R.; Takwoingi, Y.; Johnston, R. V.; Hanchard, N.C.A.; Faloppa, F. Magnetic Resonance Imaging, Magnetic Resonance Arthrography and Ultrasonography for Assessing Rotator Cuff Tears in People with Shoulder Pain for Whom Surgery Is Being Considered. Cochrane Database Syst. Rev. 2013. [Google Scholar] [CrossRef] [PubMed]
- Roy, J.-S.; Braën, C.; Leblond, J.; Desmeules, F.; Dionne, C.E.; MacDermid, J.C.; Bureau, N.J.; Frémont, P. Diagnostic Accuracy of Ultrasonography, MRI and MR Arthrography in the Characterisation of Rotator Cuff Disorders: A Systematic Review and Meta-Analysis. Br. J. Sports Med. 2015, 49, 1316. [Google Scholar] [CrossRef] [PubMed]
- Farooqi, A.S.; Lee, A.; Novikov, D.; Kelly, A.M.; Li, X.; Kelly, J.D.; Parisien, R.L. Diagnostic Accuracy of Ultrasonography for Rotator Cuff Tears: A Systematic Review and Meta-Analysis. Orthop. J. Sports Med. WEBSITE:WEBSITE:SAGE;JOURNAL:JOURNAL:OJSA;ISSUE:ISSUE:DOI. 2021, 9. [Google Scholar] [CrossRef] [PubMed]
- Shim, E.; Kim, J.Y.; Yoon, J.P.; Ki, S.-Y.; Lho, T.; Kim, Y.; Chung, S.W. Automated Rotator Cuff Tear Classification Using 3D Convolutional Neural Network. Sci. Rep. 2020, 10, 15632. [Google Scholar] [CrossRef] [PubMed]
- Lin, D.J.; Schwier, M.; Geiger, B.; Raithel, E.; von Busch, H.; Fritz, J.; Kline, M.; Brooks, M.; Dunham, K.; Shukla, M.; et al. Deep Learning Diagnosis and Classification of Rotator Cuff Tears on Shoulder MRI. Invest. Radiol. 2023, 58. [Google Scholar] [CrossRef] [PubMed]
- Lee, K.C.; Cho, Y.; Ahn, K.S.; Park, H.J.; Kang, Y.S.; Lee, S.; Kim, D.; Kang, C.H. Deep-Learning-Based Automated Rotator Cuff Tear Screening in Three Planes of Shoulder MRI. Diagnostics 2023, Vol. 13 13, 3254. [Google Scholar] [CrossRef]
- Yao, J.; Chepelev, L.; Nisha, Y.; Sathiadoss, P.; Rybicki, F.J.; Sheikh, A.M. Evaluation of a Deep Learning Method for the Automated Detection of Supraspinatus Tears on MRI. Skelet. Radiol. 2022, 51, 1765–1775. [Google Scholar] [CrossRef] [PubMed]
- Cui, J.; Xia, X.; Wang, J.; Li, X.; Huang, M.; Miao, S.; Hao, D.; Li, J. Fully Automated Approach for Diagnosis of Supraspinatus Tendon Tear on Shoulder MRI by Using Deep Learning. Acad. Radiol. 2024, 31, 994–1002. [Google Scholar] [CrossRef] [PubMed]
- Guo, D.; Liu, X.; Wang, D.; Tang, X.; Qin, Y. Development and Clinical Validation of Deep Learning for Auto-Diagnosis of Supraspinatus Tears. J. Orthop. Surg. Res. 2023, 18, 426. [Google Scholar] [CrossRef] [PubMed]
- Zhan, J.; Liu, S.; Dong, C.; Ge, Y.; Xia, X.; Tian, N.; Xu, Q.; Jiang, G.; Xu, W.; Cui, J. Shoulder MRI-Based Radiomics for Diagnosis and Severity Staging Assessment of Surgically Treated Supraspinatus Tendon Tears. Eur. Radiol. 2023, 33, 5587–5593. [Google Scholar] [CrossRef] [PubMed]
- Ni, M.; Zhao, Y.; Zhang, L.; Chen, W.; Wang, Q.; Tian, C.; Yuan, H. MRI-Based Automated Multitask Deep Learning System to Evaluate Supraspinatus Tendon Injuries. Eur. Radiol. 2024, 34, 3538–3551. [Google Scholar] [CrossRef] [PubMed]
- He, Z.; Fang, K.; Lin, X.; Xiang, C.; Li, Y.; Huang, N.; Hu, X.; Chen, Z.; Dai, Z. Enhancing Preoperative Diagnosis of Subscapular Muscle Injuries with Shoulder MRI-Based Multimodal Radiomics. Acad. Radiol. 2025, 32, 907–915. [Google Scholar] [CrossRef] [PubMed]
- Longo, U.G.; Bandini, B.; Mancini, L.; Merone, M.; Schena, E.; de Sire, A.; D’Hooghe, P.; Pecchia, L.; Carnevale, A. Artificial Intelligence in Rotator Cuff Tear Detection: A Systematic Review of MRI-Based Models. Diagnostics 2025, Vol. 15 15, 1315. [Google Scholar] [CrossRef]
- Longo, U.G.; Marino, M.; Nicodemi, G.; Pisani, M.G.; Oeding, J.F.; Ley, C.; Papalia, R.; Samuelsson, K. Artificial Intelligence Applications in the Management of Musculoskeletal Disorders of the Shoulder: A Systematic Review. J. Exp. Orthop. 2025, 12, e70248. [Google Scholar] [CrossRef] [PubMed]
- Cho, S.H.; Kim, Y.S. An Overview of Artificial Intelligence and Machine Learning in Shoulder Surgery. Clin. Shoulder Elb. 2025, 28, 242. [Google Scholar] [CrossRef] [PubMed]
- Aşçı, M.; Aşık, S.; Yazıcı, A.; Okumuşer, İ. Patient-Level Classification of Rotator Cuff Tears on Shoulder MRI Using an Explainable Vision Transformer Framework. J. Clin. Med. 2026, Vol. 15 15, 928. [Google Scholar] [CrossRef]
- Han, L.; Tan, T.; Zhang, T.; Huang, Y.; Wang, X.; Gao, Y.; Teuwen, J.; Mann, R. Synthesis-Based Imaging-Differentiation Representation Learning for Multi-Sequence 3D/4D MRI. Med. Image Anal. 2024, 92, 103044. [Google Scholar] [CrossRef] [PubMed]
- Piffer, A.; Buchner, J.A.; Gennari, A.G.; Grehten, P.; Sirin, S.; Ross, E.; Ezhov, I.; Rosier, M.; Peeken, J.C.; Piraud, M.; et al. Enhancing Efficiency in Pediatric Brain Tumor Segmentation Using a Pathologically Diverse Single-Center Clinical Dataset. Neurooncol. Adv. 2026, 8, vdag024. [Google Scholar] [CrossRef] [PubMed]
- Walsh, R.; Gaubert, M.; Meurée, C.; Hussein, B.R.; Kerbrat, A.; Casey, R.; Combès, B.; Galassi, F. Multi-Sequence Learning for Multiple Sclerosis Lesion Segmentation in Spinal Cord MRI. In Proceedings of the Medical Image Computing and Computer Assisted Intervention – MICCAI 2024; Linguraru, M.G., Dou, Q., Feragen, A., Giannarou, S., Glocker, B., Lekadir, K., Schnabel, J.A., Eds.; Springer Nature Switzerland: Cham, 2024; pp. 478–487. [Google Scholar]
- Remedios, L.W.; Liu, H.; Remedios, S.W.; Zuo, L.; Saunders, A.M.; Bao, S.; Huo, Y.; Powers, A.C.; Virostko, J.M.; Landman, B.A. Influence of Early through Late Fusion on Pancreas Segmentation from Imperfectly Registered Multimodal Magnetic Resonance Imaging. J. Med. Imaging 2025, 12, 024008. [Google Scholar] [CrossRef] [PubMed]
- Feng, X.; Ghimire, K.; Kim, D.D.; Chandra, R.S.; Zhang, H.; Peng, J.; Han, B.; Huang, G.; Chen, Q.; Patel, S.; et al. Brain Tumor Segmentation for Multi-Modal MRI with Missing Information. J. Digit. Imaging 2023, 36, 2075–2087. [Google Scholar] [CrossRef] [PubMed]
- Ting, H.; Liu, M. Multimodal Transformer of Incomplete MRI Data for Brain Tumor Segmentation. IEEE J. Biomed. Health Inform. 2024, 28, 89–99. [Google Scholar] [CrossRef] [PubMed]
- Shi, J.; Yu, L.; Cheng, Q.; Yang, X.; Cheng, K.-T.; Yan, Z. MFTrans: Modality-Masked Fusion Transformer for Incomplete Multi-Modality Brain Tumor Segmentation. IEEE J. Biomed. Health Inform. 2024, 28, 379–390. [Google Scholar] [CrossRef] [PubMed]
- Zhou, T.; Ruan, S.; Hu, H. A Literature Survey of MR-Based Brain Tumor Segmentation with Missing Modalities. Comput. Med. Imaging Graph. 2023, 104, 102167. [Google Scholar] [CrossRef] [PubMed]
- Menze, B.H.; Jakab, A.; Bauer, S.; Kalpathy-Cramer, J.; Farahani, K.; Kirby, J.; Burren, Y.; Porz, N.; Slotboom, J.; Wiest, R.; et al. The Multimodal Brain Tumor Image Segmentation Benchmark (BRATS). IEEE Trans. Med. Imaging 2014, 34, 1993. [Google Scholar] [CrossRef] [PubMed]
- Bakas, S.; Akbari, H.; Sotiras, A.; Bilello, M.; Rozycki, M.; Kirby, J.S.; Freymann, J.B.; Farahani, K.; Davatzikos, C. Advancing The Cancer Genome Atlas Glioma MRI Collections with Expert Segmentation Labels and Radiomic Features. Sci. Data 2017, 4, 170117. [Google Scholar] [CrossRef] [PubMed]
- Kim, B.; Mathai, T.S.; Helm, K.; Pinto, P.A.; Summers, R.M. Classification of Multi-Parametric Body MRI Series Using Deep Learning. IEEE J. Biomed. Health Inform. 2024, 28, 6791–6802. [Google Scholar] [CrossRef] [PubMed]
- Xiang, Y.; Zeng, C.; Liu, B.; Tan, W.; Wu, J.; Hu, X.; Han, Y.; Luo, Q.; Gong, J.; Liu, J.; et al. Deep Learning-Enabled Identification of Autoimmune Encephalitis on 3D Multi-Sequence MRI. J. Magn. Reson. Imaging 2022, 55, 1082–1092. [Google Scholar] [CrossRef] [PubMed]
- Huang, S.-C.; Pareek, A.; Seyyedi, S.; Banerjee, I.; Lungren, M.P. Fusion of Medical Imaging and Electronic Health Records Using Deep Learning: A Systematic Review and Implementation Guidelines. npj Digit. Med. 2020, 3, 136. [Google Scholar] [CrossRef] [PubMed]
- Cui, C.; Yang, H.; Wang, Y.; Zhao, S.; Asad, Z.; Coburn, L.A.; Wilson, K.T.; Landman, B.A.; Huo, Y. Deep Multimodal Fusion of Image and Non-Image Data in Disease Diagnosis and Prognosis: A Review. Prog. Biomed. Eng. 2023, 5, 022001. [Google Scholar] [CrossRef] [PubMed]
- Baltrusaitis, T.; Ahuja, C.; Morency, L.P. Multimodal Machine Learning: A Survey and Taxonomy. IEEE Trans. Pattern Anal. Mach. Intell. 2019, 41, 423–443. [Google Scholar] [CrossRef] [PubMed]
- Acosta, J.N.; Falcone, G.J.; Rajpurkar, P.; Topol, E.J. Multimodal Biomedical AI. Nat. Med. 2022, 28, 1773–1784. [Google Scholar] [CrossRef] [PubMed]
- Mohsen, F.; Ali, H.; El Hajj, N.; Shah, Z. Artificial Intelligence-Based Methods for Fusion of Electronic Health Records and Imaging Data. Sci. Rep. 2022, 12, 17981. [Google Scholar] [CrossRef] [PubMed]
- Huang, S.-C.; Pareek, A.; Zamanian, R.; Banerjee, I.; Lungren, M.P. Multimodal Fusion with Deep Neural Networks for Leveraging CT Imaging and Electronic Health Record: A Case-Study in Pulmonary Embolism Detection. Sci. Rep. 2020, 10, 22147. [Google Scholar] [CrossRef] [PubMed]
- Schilcher, J.; Nilsson, A.; Andlid, O.; Eklund, A. Fusion of Electronic Health Records and Radiographic Images for a Multimodal Deep Learning Prediction Model of Atypical Femur Fractures. Comput. Biol. Med. 2024, 168, 107704. [Google Scholar] [CrossRef] [PubMed]
- Hinterwimmer, F.; Guenther, M.; Consalvo, S.; Neumann, J.; Gersing, A.; Woertler, K.; von Eisenhart-Rothe, R.; Burgkart, R.; Rueckert, D. Impact of Metadata in Multimodal Classification of Bone Tumours. BMC Musculoskelet. Disord. 2024, 25, 822. [Google Scholar] [CrossRef] [PubMed]
- Sherafatmandjoo, H.; Safaei, A.A.; Ghaderi, F.; Allameh, F. Prostate Cancer Diagnosis Based on Multi-Parametric MRI, Clinical and Pathological Factors Using Deep Learning. Sci. Rep. 2024, 14, 14951. [Google Scholar] [CrossRef] [PubMed]
- He, K.; Zhang, X.; Ren, S.; Sun, J. Deep Residual Learning for Image Recognition. In Proceedings of the Proceedings of the IEEE conference on computer vision and pattern recognition, 2016; pp. 770–778. [Google Scholar]
- Dosovitskiy, A.; Beyer, L.; Kolesnikov, A.; Weissenborn, D.; Zhai, X.; Unterthiner, T.; Dehghani, M.; Minderer, M.; Heigold, G.; Gelly, S. An Image Is Worth 16x16 Words: Transformers for Image Recognition at Scale. arXiv 2020, arXiv:2010.11929. [Google Scholar]
- Litjens, G.; Kooi, T.; Bejnordi, B.E.; Setio, A.A.A.; Ciompi, F.; Ghafoorian, M.; van der Laak, J.A.W.M.; van Ginneken, B.; Sánchez, C.I. A Survey on Deep Learning in Medical Image Analysis. Med. Image Anal. 2017, 42, 60–88. [Google Scholar] [CrossRef] [PubMed]
- Lundervold, A.S.; Lundervold, A. An Overview of Deep Learning in Medical Imaging Focusing on MRI. Z. Med. Phys. 2019, 29, 102–127. [Google Scholar] [CrossRef] [PubMed]
- DeLong, E.R.; DeLong, D.M.; Clarke-Pearson, D.L. Comparing the Areas under Two or More Correlated Receiver Operating Characteristic Curves: A Nonparametric Approach. Biometrics 1988, 44, 837–845. [Google Scholar] [CrossRef] [PubMed]
- Selvaraju, R.R.; Cogswell, M.; Das, A.; Vedantam, R.; Parikh, D.; Batra, D. Grad-Cam: Visual Explanations from Deep Networks via Gradient-Based Localization. In Proceedings of the Proceedings of the IEEE international conference on computer vision, 2017; pp. 618–626. [Google Scholar]
- Mongan, J.; Moy, L.; Kahn, C.E. Checklist for Artificial Intelligence in Medical Imaging (CLAIM): A Guide for Authors and Reviewers. Radiol. Artif. Intell. 2020, 2, e200029. [Google Scholar] [CrossRef] [PubMed]
- Collins, G.S.; Moons, K.G.M.; Dhiman, P.; Riley, R.D.; Beam, A.L.; Van Calster, B.; Ghassemi, M.; Liu, X.; Reitsma, J.B.; van Smeden, M.; et al. TRIPOD+AI Statement: Updated Guidance for Reporting Clinical Prediction Models That Use Regression or Machine Learning Methods. BMJ 2024, 385, e078378. [Google Scholar] [CrossRef] [PubMed]
- Sounderajah, V.; Guni, A.; Liu, X.; Collins, G.S.; Karthikesalingam, A.; Markar, S.R.; Golub, R.M.; Denniston, A.K.; Shetty, S.; Moher, D.; et al. The STARD-AI Reporting Guideline for Diagnostic Accuracy Studies Using Artificial Intelligence. Nat. Med. 2025, 31, 3283–3289. [Google Scholar] [CrossRef] [PubMed]
- Vosshenrich, J.; Bruno, M.; Cantarelli Rodrigues, T.; Donners, R.; Jardon, M.; Leonhardt, Y.; Neumann, S.G.; Recht, M.; Serfaty, A.; Stern, S.E.; et al. Arthroscopy-Validated Diagnostic Performance of 7-Minute Five-Sequence Deep Learning Super-Resolution 3-T Shoulder MRI. Radiology 2025, 314, e241351. [Google Scholar] [CrossRef] [PubMed]
- Foti, G.; Spoto, F.; Mignolli, T.; Spezia, A.; Romano, L.; Manenti, G.; Cardobi, N.; Avanzi, P. Deep Learning-Driven Abbreviated Shoulder MRI Protocols: Diagnostic Accuracy in Clinical Practice. Tomography 2025, Vol. 11(Page 48 2025, 11), 48. [Google Scholar] [CrossRef]
- Riem, L.; Feng, X.; Cousins, M.; DuCharme, O.; Leitch, E.B.; Werner, B.C.; Sheean, A.J.; Hart, J.; Antosh, I.J.; Blemker, S.S. A Deep Learning Algorithm for Automatic 3D Segmentation of Rotator Cuff Muscle and Fat from Clinical MRI Scans. Radiol. Artif. Intell. 2023, 5, e220132. [Google Scholar] [CrossRef] [PubMed]
- Alipour, E.; Chalian, M.; Pooyan, A.; Azhideh, A.; Shomal Zadeh, F.; Jahanian, H. Automatic MRI–Based Rotator Cuff Muscle Segmentation Using U-Nets. Skelet. Radiol. 2024, 53, 537–545. [Google Scholar] [CrossRef]
Figure 1.
Schematic representation of the hierarchical multimodal workflow for patient-level rotator cuff tear classification. The experimental pipeline progresses systematically through five core operational stages: (1) retrospective assembly of the single-center cohort (), comprising balanced tear and no-tear cases; (2) multiplanar ingestion of four distinct MRI sequence weightings alongside a 9-variable normalized clinical metadata vector; (3) execution of the hierarchical design divided into three sequential investigations (Studies 0, 1, and 2); (4) empirical isolation and deployment of the optimized ResNet50 late-fusion classifier (C14M); and (5) rigorous multi-metric patient-level evaluation leveraging stratified three-fold cross-validation, bootstrapping, paired DeLong testing, and Grad-CAM/attention-driven visual quality control maps. CV: cross-validation, CI: confidence interval, AUC: Area Under the ROC Curve, FS: fat-suppressed.
Figure 1.
Schematic representation of the hierarchical multimodal workflow for patient-level rotator cuff tear classification. The experimental pipeline progresses systematically through five core operational stages: (1) retrospective assembly of the single-center cohort (), comprising balanced tear and no-tear cases; (2) multiplanar ingestion of four distinct MRI sequence weightings alongside a 9-variable normalized clinical metadata vector; (3) execution of the hierarchical design divided into three sequential investigations (Studies 0, 1, and 2); (4) empirical isolation and deployment of the optimized ResNet50 late-fusion classifier (C14M); and (5) rigorous multi-metric patient-level evaluation leveraging stratified three-fold cross-validation, bootstrapping, paired DeLong testing, and Grad-CAM/attention-driven visual quality control maps. CV: cross-validation, CI: confidence interval, AUC: Area Under the ROC Curve, FS: fat-suppressed.
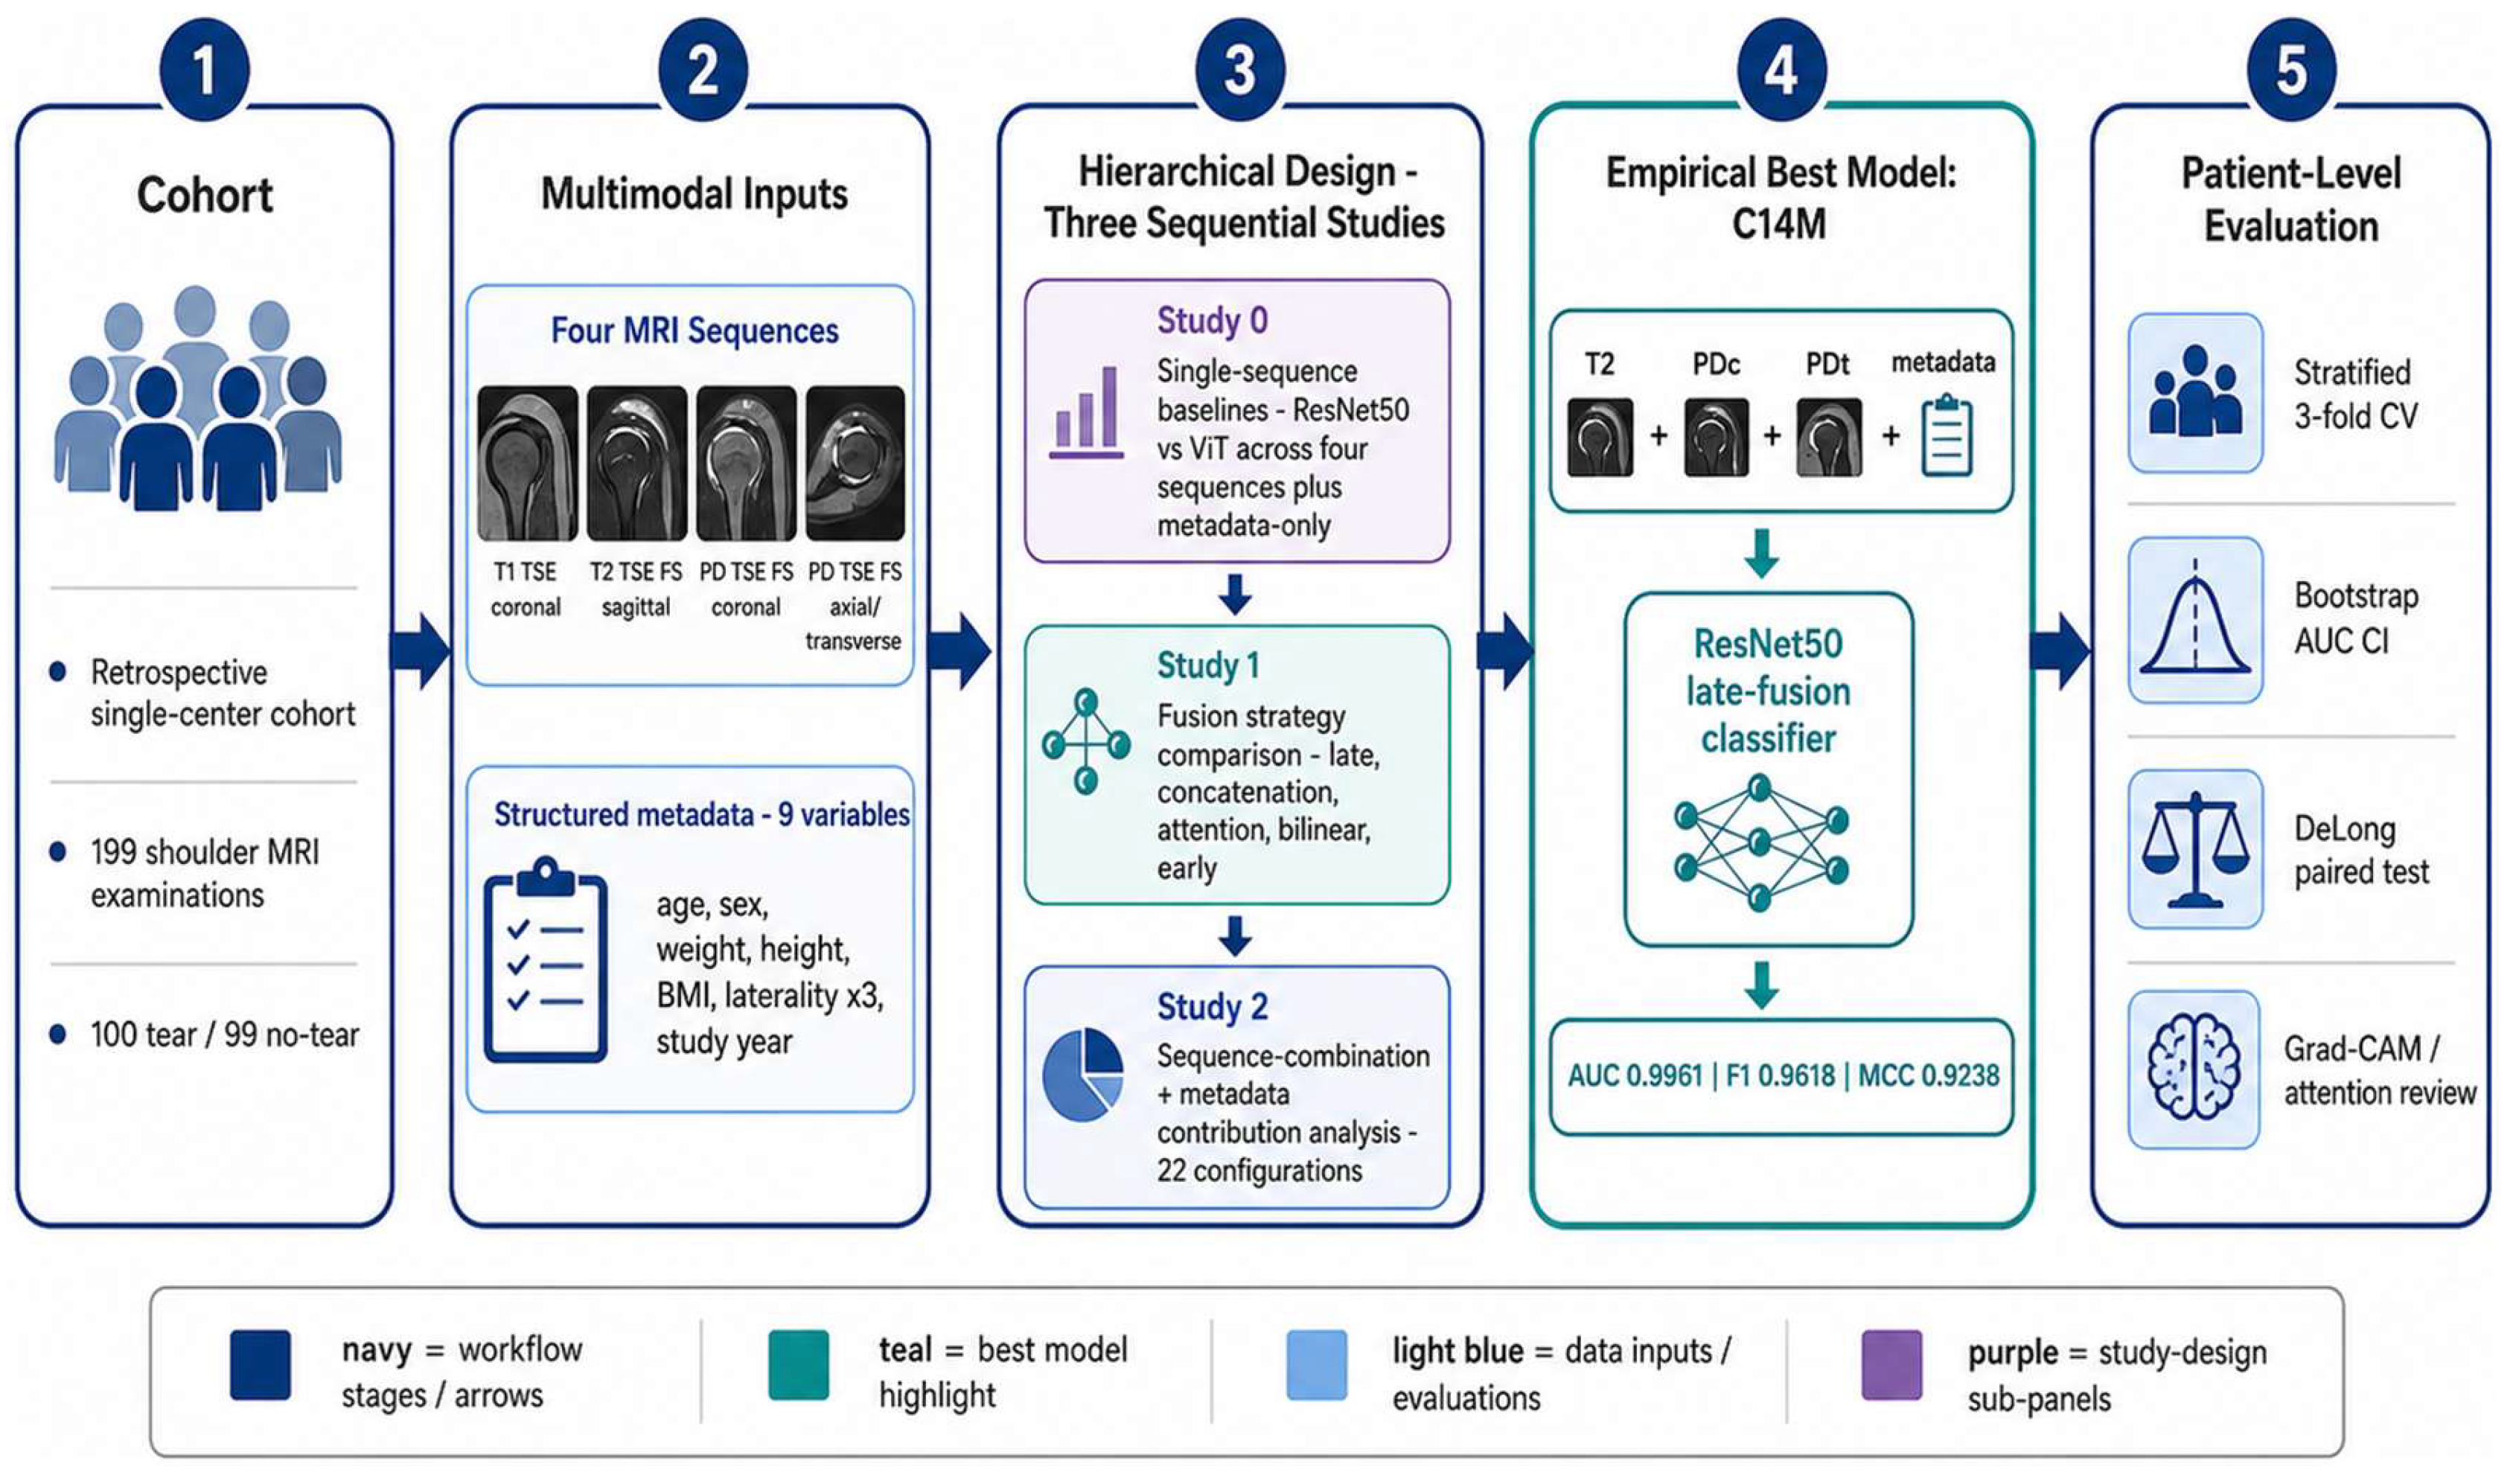
Figure 2.
Out-of-fold Grad-CAM explainability matrix for the task-optimized late-fusion model (C14M) across the three fused MRI sequences (T2 sagittal, PD coronal, and PD axial). Rows are stratified by true patient pathology (Tear vs. Normal) across independent validation splits (folds 0, 1, and 2), with anonymized patient identifiers and true/predicted classes indicated. White arrows highlight the localized, highly focused supraspinatus-region activation in true tear cases, contrasting with the diffuse or peripheral background activation patterns observed in true normal/negative controls. The color bar represents relative feature activation maps normalized from 0 (low) to 1 (high). TSE: turbo spin-echo, FS: fat-suppressed, PD: proton density.
Figure 2.
Out-of-fold Grad-CAM explainability matrix for the task-optimized late-fusion model (C14M) across the three fused MRI sequences (T2 sagittal, PD coronal, and PD axial). Rows are stratified by true patient pathology (Tear vs. Normal) across independent validation splits (folds 0, 1, and 2), with anonymized patient identifiers and true/predicted classes indicated. White arrows highlight the localized, highly focused supraspinatus-region activation in true tear cases, contrasting with the diffuse or peripheral background activation patterns observed in true normal/negative controls. The color bar represents relative feature activation maps normalized from 0 (low) to 1 (high). TSE: turbo spin-echo, FS: fat-suppressed, PD: proton density.
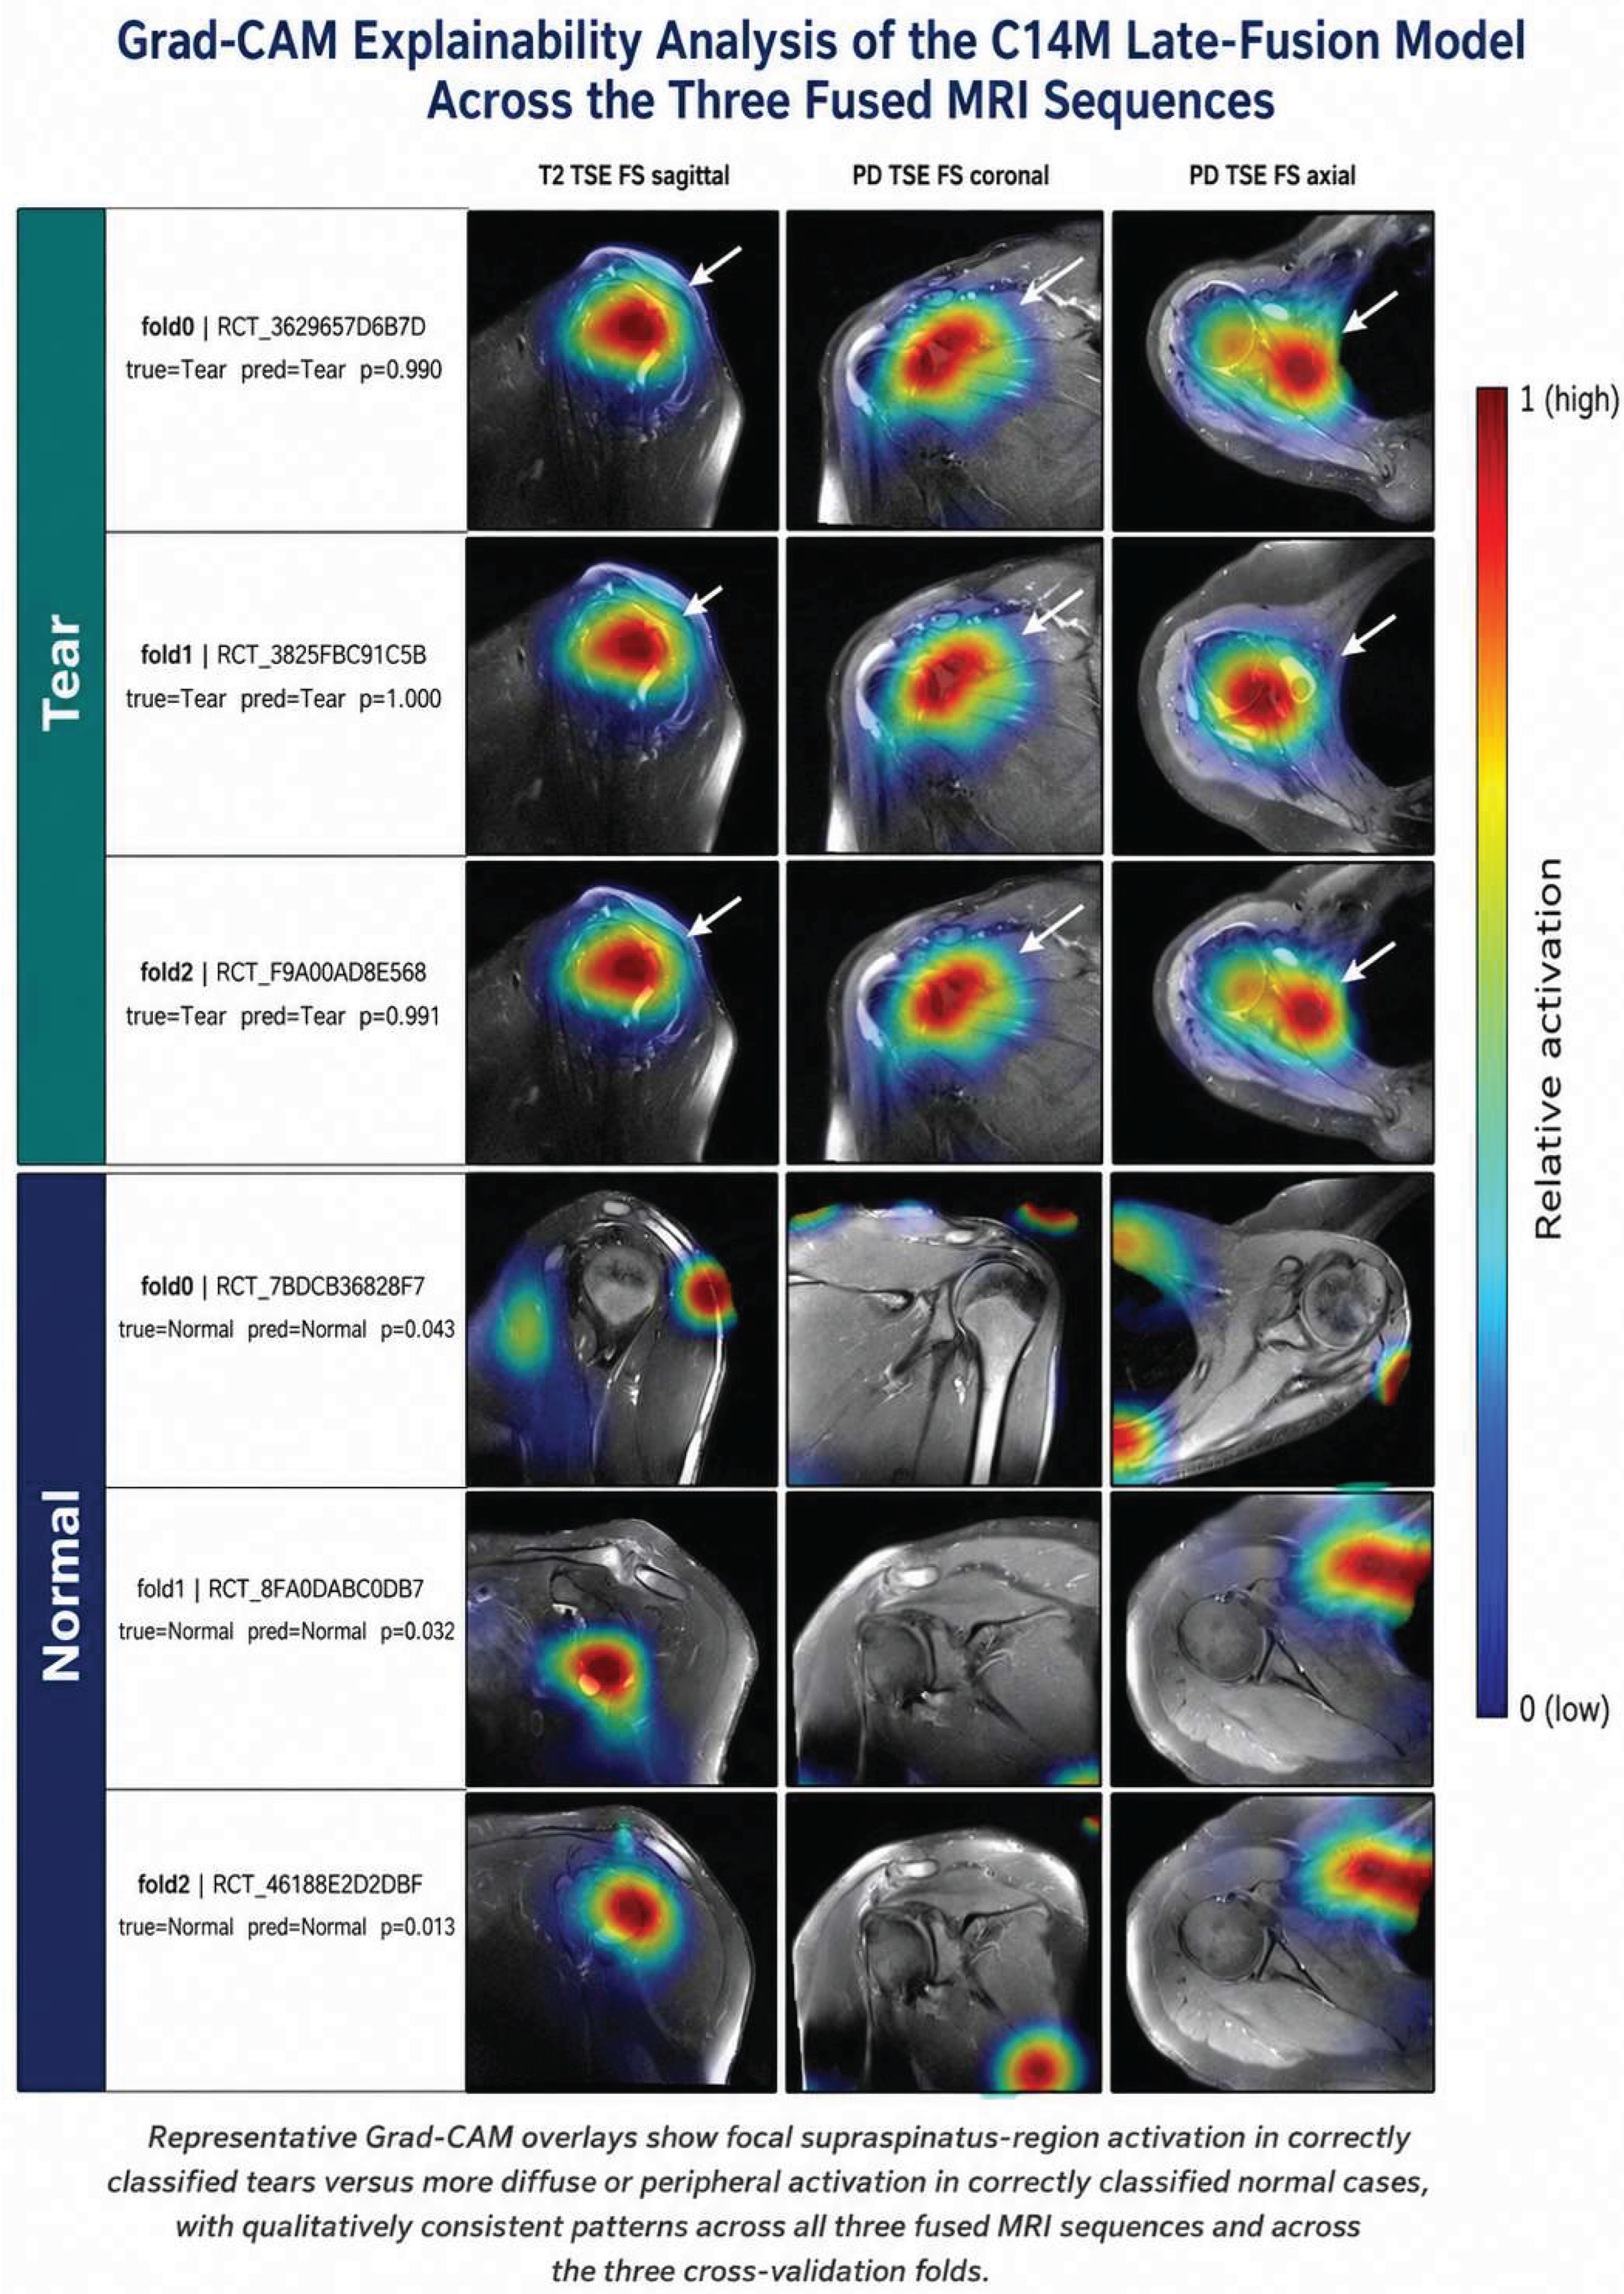

Table 1.
Baseline demographic characteristics and structured clinical metadata of the study cohort (). Continuous variables are expressed as mean standard deviation (SD).
Table 1.
Baseline demographic characteristics and structured clinical metadata of the study cohort (). Continuous variables are expressed as mean standard deviation (SD).
| Characteristic | Value (n = 199) |
| Diagnosis, n (%) | |
|
100 (50.3%) |
|
99 (49.7%) |
| Sex, n (%) | |
|
118 (59.3%) |
|
81 (40.7%) |
| Age (years), mean SD | 50.2 18.1 |
| BMI (kg / m2), mean SD | 26.5 3.2 |
| Laterality, n (%) | |
|
74 (37.2%) |
|
56 (28.1%) |
|
69 (34.7%) |
| Study Year, n (%) | |
|
157 (78.9%) |
|
42 (21.1%) |
Table 2.
Technical acquisition parameters and scanner specifications across the four evaluated shoulder MRI sequences. TR: repetition time, TE: echo time, TSE: turbo spin-echo.
Table 2.
Technical acquisition parameters and scanner specifications across the four evaluated shoulder MRI sequences. TR: repetition time, TE: echo time, TSE: turbo spin-echo.
| Sequence | Sequence Description | TR (ms) | TE (ms) | Slice Thickness (mm) | Matrix Size |
| T1 | T1 TSE Coronal | 669.2 | 20.1 | 4.3 | 256 x 256 |
| T2 | T2 TSE Fat-Suppressed Sagittal | 4258.2 | 71.0 | 4.3 | 256 x 256 |
| PDc | PD TSE Fat-Suppressed Coronal | 3115.7 | 34.1 | 4.3 | 256 x 256 |
| PDt | PD TSE Fat-Suppressed Transverse (Axial) | 3137.3 | 26.0 | 4.3 | 256 x 256 |
Table 3.
Methodological outline of the hierarchical experimental framework, detailing the specific objectives, input modalities, and primary analytical outcomes for Studies 0, 1, and 2.
Table 3.
Methodological outline of the hierarchical experimental framework, detailing the specific objectives, input modalities, and primary analytical outcomes for Studies 0, 1, and 2.
| Study Phase | Purpose / Objective | Input Modalities | Primary Outcome / Key Finding |
| Study 0 | Baseline unimodal evaluation and ResNet50 vs. ViT architecture comparison | Individual MRI sequences (T1, T2, PDc, PDt) and a standalone clinical metadata model | PDc ResNet50 identified as the optimal single-sequence baseline |
| Study 1 | Benchmarking of alternative multimodal fusion topologies | Full clinical protocol (all four MRI sequences combined with clinical metadata) | ResNet50 late decision fusion selected based on superior global AUC performance |
| Study 2 | Systematic sequence-subset optimization and metadata impact analysis | Pairwise, three-sequence, and full-protocol MRI combinations (with and without metadata) | C14M configuration (T2 + PDc + PDt + metadata) established as the peak-performing diagnostic model |
Table 4.
Diagnostic classification performance of unimodal baseline models in Study 0 across individual MRI sequences and standalone clinical metadata. CI: confidence interval, MCC: Matthews correlation coefficient, R: ResNet50, V: Vision Transformer.
Table 4.
Diagnostic classification performance of unimodal baseline models in Study 0 across individual MRI sequences and standalone clinical metadata. CI: confidence interval, MCC: Matthews correlation coefficient, R: ResNet50, V: Vision Transformer.
| Model | Input Modality | AUC | Accuracy | Sensitivity | Specificity | F1-Score | MCC | 95% CI for AUC |
| S0-R-PDc | PDc | 0.9834 | 0.9498 | 0.9700 | 0.9293 | 0.9515 | 0.9028 | 0.9522-0.9920 |
| S0-R-T2 | T2 | 0.9780 | 0.9096 | 0.9192 | 0.8990 | 0.9110 | 0.8271 | 0.9289-0.9831 |
| S0-R-PDt | PDt | 0.9742 | 0.9095 | 0.8794 | 0.9394 | 0.9064 | 0.8221 | 0.9456-0.9884 |
| S0-V-PDt | PDt | 0.9663 | 0.9092 | 0.9293 | 0.8889 | 0.9106 | 0.8195 | 0.9383-0.9899 |
| S0-V-T2 | T2 | 0.9594 | 0.9396 | 0.9394 | 0.9394 | 0.9388 | 0.8815 | 0.9333-0.9883 |
| S0-V-PDc | PDc | 0.9564 | 0.8993 | 0.9094 | 0.8889 | 0.9002 | 0.7991 | 0.9121-0.9767 |
| S0-R-T1 | T1 | 0.9543 | 0.8743 | 0.8604 | 0.8889 | 0.8755 | 0.7491 | 0.9110-0.9755 |
| S0-V-T1 | T1 | 0.9069 | 0.8341 | 0.8515 | 0.8182 | 0.8372 | 0.6686 | 0.8420-0.9410 |
| S0-Meta | Metadata | 0.6104 | 0.5430 | 0.8791 | 0.2020 | 0.6575 | 0.0738 | 0.4924-0.6399 |
Table 5.
Comparative diagnostic performance metrics of alternative multimodal fusion topologies in Study 1 utilizing the complete four-sequence MRI protocol combined with clinical metadata.
Table 5.
Comparative diagnostic performance metrics of alternative multimodal fusion topologies in Study 1 utilizing the complete four-sequence MRI protocol combined with clinical metadata.
| Strategy | AUC | Accuracy | Sensitivity | Specificity | Precision | F1-Score | MCC | 95% CI for AUC |
| ResNet Late Decision Fusion | 0.9909 | 0.9346 | 0.9495 | 0.9192 | 0.9235 | 0.9355 | 0.8715 | 0.9685-0.9979 |
| ResNet Feature Concatenation | 0.9753 | 0.9498 | 0.9495 | 0.9495 | 0.9545 | 0.9502 | 0.9030 | 0.9590-0.9916 |
| ViT Late Decision Fusion | 0.9722 | 0.9196 | 0.9697 | 0.8687 | 0.8828 | 0.9237 | 0.8444 | 0.9408-1.0000 |
| ResNet Attention-Weighted Fusion | 0.9694 | 0.9095 | 0.9498 | 0.8687 | 0.8867 | 0.9138 | 0.8282 | 0.9494-0.9894 |
| ViT Feature Concatenation | 0.9614 | 0.8898 | 0.9599 | 0.8182 | 0.8520 | 0.8996 | 0.7928 | 0.9594-0.9634 |
| ResNet Early Two-Sequence Fusion | 0.9164 | 0.8136 | 0.7986 | 0.8283 | 0.8244 | 0.8095 | 0.6300 | 0.8231-1.0000 |
| ResNet Compact Bilinear Pooling | 0.9056 | 0.8543 | 0.9195 | 0.7879 | 0.8221 | 0.8635 | 0.7234 | 0.8297-0.9815 |
| ViT Token-Level Early Fusion | 0.5436 | 0.5025 | 1.0000 | 0.0000 | 0.5052 | 0.6689 | 0.0000 | 0.4248-0.6624 |
Table 6.
Combinatorial performance matrix in Study 2 evaluating all possible pairwise, three-sequence, and full-protocol MRI subsets with ("M") and without clinical metadata. Models are sorted by descending Area Under the ROC Curve (AUC).
Table 6.
Combinatorial performance matrix in Study 2 evaluating all possible pairwise, three-sequence, and full-protocol MRI subsets with ("M") and without clinical metadata. Models are sorted by descending Area Under the ROC Curve (AUC).
| Model ID | Sequence Combination | Clinical Metadata | AUC | Accuracy | Sensitivity | Specificity | Precision | F1-Score | MCC | |
| C14M * | T2 + PDc + PDt | Yes | 0.9961 | 0.9600 | 0.9798 | 0.9394 | 0.9475 | 0.9618 | 0.9238 | |
| C11M | T1 + T2 + PDc | Yes | 0.9918 | 0.9346 | 0.9394 | 0.9293 | 0.9333 | 0.9350 | 0.8720 | |
| C05 | T1 + T2 | No | 0.9917 | 0.9546 | 0.9697 | 0.9394 | 0.9423 | 0.9557 | 0.9099 | |
| C15M | T1 + T2 + PDc + PDt | Yes | 0.9909 | 0.9346 | 0.9495 | 0.9192 | 0.9235 | 0.9355 | 0.8715 | |
| C13 | T1 + PDc + PDt | No | 0.9905 | 0.9195 | 0.8895 | 0.9495 | 0.9518 | 0.9148 | 0.8473 | |
| C08M | T2 + PDc | Yes | 0.9899 | 0.9345 | 0.9394 | 0.9293 | 0.9335 | 0.9332 | 0.8748 | |
| C10M | PDc + PDt | Yes | 0.9885 | 0.9295 | 0.9596 | 0.8990 | 0.9071 | 0.9317 | 0.8624 | |
| C12M | T1 + T2 + PDt | Yes | 0.9866 | 0.9597 | 0.9697 | 0.9495 | 0.9506 | 0.9597 | 0.9202 | |
| C08 | T2 + PDc | No | 0.9866 | 0.9447 | 0.9697 | 0.9192 | 0.9236 | 0.9458 | 0.8911 | |
| C11 | T1 + T2 + PDc | No | 0.9864 | 0.9146 | 0.9697 | 0.8586 | 0.8751 | 0.9196 | 0.8352 | |
| C15 | T1 + T2 + PDc + PDt | No | 0.9863 | 0.9395 | 0.9192 | 0.9596 | 0.9592 | 0.9374 | 0.8822 | |
| C06M | T1 + PDc | Yes | 0.9834 | 0.8943 | 0.9498 | 0.8384 | 0.8695 | 0.9024 | 0.8044 | |
| C09M | T2 + PDt | Yes | 0.9833 | 0.9246 | 0.9394 | 0.9091 | 0.9168 | 0.9258 | 0.8536 | |
| C13M | T1 + PDc + PDt | Yes | 0.9824 | 0.9044 | 0.9091 | 0.8990 | 0.9074 | 0.9022 | 0.8188 | |
| C10 | PDc + PDt | No | 0.9817 | 0.9195 | 0.9293 | 0.9091 | 0.9160 | 0.9190 | 0.8453 | |
| C12 | T1 + T2 + PDt | No | 0.9806 | 0.8996 | 0.9798 | 0.8182 | 0.8481 | 0.9083 | 0.8113 | |
| C07M | T1 + PDt | Yes | 0.9796 | 0.9094 | 0.9293 | 0.8889 | 0.8942 | 0.9108 | 0.8208 | |
| C06 | T1 + PDc | No | 0.9775 | 0.9045 | 0.9302 | 0.8788 | 0.8881 | 0.9069 | 0.8137 | |
| C07 | T1 + PDt | No | 0.9768 | 0.8994 | 0.9002 | 0.8990 | 0.9111 | 0.9010 | 0.8076 | |
| C09 | T2 + PDt | No | 0.9741 | 0.8996 | 0.8898 | 0.9091 | 0.9107 | 0.8994 | 0.8006 | |
| C05M | T1 + T2 | Yes | 0.9731 | 0.9247 | 0.9798 | 0.8687 | 0.8844 | 0.9292 | 0.8555 | |
| C14 | T2 + PDc + PDt | No | 0.9699 | 0.8943 | 0.8889 | 0.8990 | 0.9028 | 0.8928 | 0.7942 |
* Denotes that the ROC-AUC of the C14M model is statistically significantly superior to both the baseline single-sequence PDc model (p < 0.001) and the full four-sequence protocol C15M (p = 0.028) according to paired DeLong’s test.
Table 7.
Out-of-fold diagnostic performance breakdown across the three-fold stratified outer cross-validation splits for the top-performing C14M configuration ().
Table 7.
Out-of-fold diagnostic performance breakdown across the three-fold stratified outer cross-validation splits for the top-performing C14M configuration ().
| Fold | AUC | Accuracy | Sensitivity | Specificity | Precision | F1-Score | NPV | MCC |
| Fold 0 | 0.9929 | 0.9254 | 1.0000 | 0.8485 | 0.8718 | 0.9315 | 1.0000 | 0.8601 |
| Fold 1 | 0.9991 | 0.9848 | 1.0000 | 0.9697 | 0.9706 | 0.9851 | 1.0000 | 0.9701 |
| Fold 2 | 0.9963 | 0.9697 | 0.9394 | 1.0000 | 1.0000 | 0.9688 | 0.9429 | 0.9411 |
| Mean | 0.9961 | 0.9600 | 0.9798 | 0.9394 | 0.9475 | 0.9618 | 0.9810 | 0.9238 |
Table 8.
Isolated marginal performance deltas () demonstrating the exact positive and negative diagnostic impacts of integrating structured clinical metadata across precisely matched MRI sequence combinations.
Table 8.
Isolated marginal performance deltas () demonstrating the exact positive and negative diagnostic impacts of integrating structured clinical metadata across precisely matched MRI sequence combinations.
| Comparison Pair | Sequence Combination | ΔAUC | ΔF1-Score | ΔPrecision | ΔSensitivity |
| C14 → C14M | T2 + PDc + PDt | +0.0262 | +0.0690 | +0.0447 | +0.0909 |
| C09 → C09M | T2 + PDt | +0.0093 | +0.0264 | +0.0061 | +0.0496 |
| C10 → C10M | PDc + PDt | +0.0067 | +0.0127 | −0.0089 | +0.0303 |
| C12 → C12M | T1 + T2 + PDt | +0.0060 | +0.0515 | +0.1025 | −0.0101 |
| C06 → C06M | T1 + PDc | +0.0058 | −0.0045 | −0.0185 | +0.0196 |
| C11 → C11M | T1 + T2 + PDc | +0.0055 | +0.0154 | +0.0582 | −0.0303 |
| C15 → C15M | T1 + T2 + PDc + PDt | +0.0046 | −0.0019 | −0.0357 | +0.0303 |
| C08 → C08M | T2 + PDc | +0.0033 | −0.0126 | +0.0099 | −0.0303 |
| C07 → C07M | T1 + PDt | +0.0028 | +0.0098 | −0.0169 | +0.0291 |
| C13 → C13M | T1 + PDc + PDt | −0.0081 | −0.0127 | −0.0444 | +0.0196 |
| C05 → C05M | T1 + T2 | −0.0187 | −0.0265 | −0.0579 | +0.0101 |
Disclaimer/Publisher’s Note: The statements, opinions and data contained in all publications are solely those of the individual author(s) and contributor(s) and not of MDPI and/or the editor(s). MDPI and/or the editor(s) disclaim responsibility for any injury to people or property resulting from any ideas, methods, instructions or products referred to in the content. |
© 2026 by the authors. Licensee MDPI, Basel, Switzerland. This article is an open access article distributed under the terms and conditions of the Creative Commons Attribution (CC BY) license (http://creativecommons.org/licenses/by/4.0/).
Copyright: This open access article is published under a Creative Commons CC BY 4.0 license, which permit the free download, distribution, and reuse, provided that the author and preprint are cited in any reuse.


