

Submitted:
16 June 2026
Posted:
17 June 2026
You are already at the latest version
Abstract
Introduction: Diabetic retinopathy (DR) is а major microvascular complication of diabetes mellitus (DM). Among the established risk factors for DR, “metabolic memory” plays a key role. Its development is mainly driven by advanced glycation end-products (AGEs), some of which possess characteristic fluorescent properties. Aims: To examine the relationship between skin AGEs, noninvasively assessed through skin autofluorescence (SAF), and the presence and severity of DR in subjects with long-standing type 1 DM (T1DM) and no history of atherosclerotic cardiovascular disease. Methods: 81 subjects with T1DM and 45 healthy controls were included. All individuals underwent SAF measurements and fundus photographs were taken in subjects with T1DM. Associations between SAF, its change over time and the presence and severity of DR were analyzed. Results: A significant positive correlation was found between SAF and the severity of DR. Only SAF and renal parameters showed a significant positive association with the presence of sight-threatening DR (STDR). There was a statistically significant increase in SAF levels over 3 years in STDR. Conclusion: SAF, but not HbA1c or diabetes duration, was associated with the severity of DR. SAF may therefore represent a promising, rapid, and non-invasive biomarker for identifying individuals at increased risk of STDR.
Keywords:
type 1 diabetes mellitus
; diabetic retinopathy
; sight-threatening diabetic retinopathy
; skin autofluorescence
1. Introduction
Despite continuous technological advances in the treatment and monitoring of type 1 diabetes mellitus (T1DM), diabetic retinopathy (DR) remains among the leading yet preventable causes of severe vision loss in working-age adults [1]. Its typically asymptomatic course in the early stages contributes to delayed diagnosis. Therefore, ongoing investigation of potential risk factors (RFs), as well as the improvement of DR screening and treatment, is of critical importance [2].
Glycemic control and diabetes duration are among the well-established RFs for DR [3]. It is known that glycated hemoglobin (HbA1c) reflects average blood glucose levels over a relatively short period. On the other hand, advanced glycation end products (AGEs), the levels of which increase during the natural aging process [4] as well as under conditions of chronic hyperglycemia and increased oxidative stress [5], have been established as markers of the so-called “metabolic memory” [6]. This is due to their ability to irreversibly bind to long-lived proteins, which leads to the accumulation of AGEs in tissues with a slow metabolism, such as the skin. Thanks to their fluorescent properties, skin AGEs can be examined quickly and non-invasively using the skin autofluorescence (SAF) method, which has been validated against the “gold standard” for assessing tissue AGEs – skin biopsy [7].
In addition to serving as a marker of metabolic memory [8,9], there is evidence supporting the role of AGEs in the pathogenesis of age-related pathologies [10] as well as diabetic micro- and macroangiopathy [11,12,13,14]. For instance, the accumulation of AGEs in retinal pericytes and endothelial cells, along with the consequent increased formation of intracellular reactive oxygen species and cellular adhesion molecules, contributes to oxidative-stress-induced damage to retinal cells, premature capillary occlusion, and the stimulation of angiogenesis and thrombogenesis [15,16]. Although there is currently no method for the quantitative assessment of AGEs accumulated in the retina, Januszewski et al. demonstrated a positive correlation between ocular autofluorescence (measured at the level of the cornea and lens) and SAF [17].
Monnier et al. published the first data demonstrating a significant and independent association between the presence and severity of DR and collagen-linked fluorescence in skin biopsy extracts from 41 individuals with a duration of T1DM exceeding 20 years [18]. On the other hand, data on the relationship between non-invasively assessed AGEs via SAF and the presence of DR in T1DM are inconsistent [19,20,21,22]. Moreover, few studies have evaluated the association between SAF and DR severity in T1DM [9,20,23].
The aim of the present study is to analyze the relationship between SAF, its change over time, and the presence and severity of DR in a Bulgarian cohort with long-standing T1DM and no history of atherosclerotic cardiovascular disease (ASCVD).
2. Materials and Methods
2.1. Participants
The participants in this study are part of the cohort of the research project Cardiovascular and Metabolic Risk Associated with Visceral Adipose Tissue in Patients with Type 1 Diabetes, which was approved by the Research Ethics Committee of the Medical University – Varna, Bulgaria (No. 72/01.03.2018). The project included 124 individuals with long-standing T1DM (diabetes duration ≥ 15 years), with poor glycemic control and no history of ASCVD, as well as 59 healthy controls matched for age, sex, and body mass index. A detailed description of the inclusion and exclusion criteria, as well as the baseline data collected in the project, is provided in a previous publication [24]. For the purposes of the present study, all participants from the original research project were invited, with 68.9% of them responding, on average 37 months (37.2 ± 5.8) after their baseline visit within the project. Three individuals with T1DM were excluded due to the diagnosis of ASCVD during the follow-up period. As a result, the current study included 81 individuals with T1DM and 45 healthy controls. The study was conducted in accordance with the Declaration of Helsinki, and the protocol was approved by the Research Ethics Committee of the Medical University - Varna, Bulgaria (No. 117/26.05.2022).
2.2. Clinical Examination and Biochemical Measurements
After signing informed consent, a detailed medical history was obtained from all participants, and anthropometric (height, body weight, waist circumference) and instrumental tests (fundus photography with a portable fundus camera, non-invasive measurement of AGEs using an AGE Reader) were performed. Venous blood and first-morning urine samples were collected at baseline and at follow-up after an overnight fast under standardized pre-analytical conditions. HbA1c was measured on a Roche Cobas 6000 analyzer using a turbidimetric immunoassay standardized according to DCCT/NGSP criteria. Serum creatinine was determined using the kinetic Jaffe method (Roche Cobas 6000), and the estimated glomerular filtration rate (eGFR) was calculated using the Chronic Kidney Disease Epidemiology Collaboration (CKD-EPI) equation. For the urinary albumin-to-creatinine ratio (UACR), urinary albumin was measured using an immunoturbidimetric assay, and urinary creatinine was quantified using the kinetic Jaffe method on the same analytical platform (Roche Cobas 6000). UACR values were expressed in mg/mmol. The assessment of concomitant hypertension and dyslipidemia was based on participants’ medical history and available medical records.
2.3. SAF Measurement
SAF was measured using an AGE Reader (DiagnOptics, Groningen, the Netherlands), positioned on the volar surface of the dominant forearm about 5 cm distal to the cubital fossa. For each participant, three consecutive measurements were performed at intervals of approximately 2 minutes, in a sitting position and at room temperature, choosing an area of intact skin that had been minimally exposed to sunlight. The value of SAF was taken as the arithmetic mean of the three measurements. All subjects we examined belonged to the Caucasian race, which serves to reduce the risk of falsely low SAF values [25].
2.4. Fundus Examination
In all individuals with T1DM, after initial pupil dilation, fundus photographs were taken using a portable fundus camera (VISUSCOUT 100, Zeiss) in the primary position and in the four gaze directions. The photographs were evaluated by an ophthalmologist specialized in DR. Patients diagnosed with DR were classified into two groups - non-proliferative DR (NPDR) and proliferative DR (PDR). Additionally, individuals with NPDR were further subdivided into those with mild, moderate, and severe NPDR. Due to the small number of participants with severe NPDR (n = 5), they were combined with those with PDR and classified as individuals with sight-threatening DR (STDR).
2.5. Statistical Analysis
The statistical analysis was performed using the statistical software GraphPad Prism 9.0.0 for Windows, and some analyses were carried out using IBM SPSS Statistics 19 and MedCalc® Statistical Software 23.1.7 (MedCalc Software Ltd, Ostend, Belgium; https://www.medcalc.org; 2025). Results for continuous variables were presented as means and standard deviation when the data were normally distributed, and as medians and interquartile ranges (IQR) when the data were not normally distributed. The presence of DR, STDR, hypertension, dyslipidemia, and smoking was introduced as dichotomous categorical variables, while the severity of DR was treated as an ordinal categorical variable with three levels (mild NPDR, moderate NPDR, and STDR). Categorical variables were presented as percentages. Multiple linear regression was used to assess the independent variables determining SAF levels, and logistic regression was applied to evaluate factors associated with STDR. In all analyses conducted, a p-value of < 0.05 was considered statistically significant.
3. Results
3.1. Characteristics of the Study Population
The main characteristics of the study population are presented in Table 1. Only eight (9.9%) of the participants with T1DM were using insulin pump therapy, two (2.5%) were on mixed insulin, and the remaining 87.6% were on intensified treatment with insulin analogues. Hypertension was more common among subjects with T1DM compared with controls, while the prevalence of smoking and dyslipidemia was similar between the two groups. SAF was significantly higher in participants with T1DM than in controls (Table 1).
DR was diagnosed in 74.1% (n = 60) of the studied individuals with T1DM, with 73.3% (n = 44) having NPDR and 26.7% (n = 16) having PDR. Additionally, according to the severity of NPDR, patients were classified as having mild (33.3%, n = 20), moderate (31.7%, n = 19), and severe NPDR (8.3%, n = 5). Participants with severe NPDR were combined with those with PDR into a single group with STDR (35%, n = 21).
3.2. Factors Associated with SAF Levels
We found a significant correlation between SAF and age in the control group, but not in individuals with T1DM (rs = 0.387, p = 0.009 and r = 0.156, p = 0.165, respectively). Among the other studied parameters, SAF was significantly associated with baseline HbA1c (r = 0.284, p = 0.01), follow-up HbA1c (rs = 0.429, p < 0.0001), UACR levels (rs = 0.327, p = 0.003, n = 80), and eGFR (rs = -0.240, p = 0.031), but only in the T1DM cohort. In a multivariate linear regression including age, follow-up HbA1c, and eGFR, follow-up HbA1c and eGFR were identified as significant independent determinants of SAF in individuals with T1DM (B = 0.17, β = 0.444, p < 0.001 and B = -0.006, β = -0.241, p = 0.031, respectively for HbA1c and eGFR).
3.3. Relationship Between SAF and DR
Characteristics of individuals with and without DR are shown in Table 2. SAF levels were similar in both groups, whereas HbA1c values were significantly higher in participants with DR. On the other hand, DR severity was significantly associated with SAF, but not with HbA1c (Table 3). Among the other parameters, smoking, lower eGFR, and UACR > 3 mg/mmol were positively correlated with more advanced stages of DR (Table 3).
Additionally, follow-up SAF and eGFR values, both of which were related to DR severity, were compared among participants with mild NPDR, moderate NPDR, and STDR. Only SAF showed a significant between-group difference (F(df1, df2) = 5.160(2, 57), p = 0.009), whereas eGFR did not (H(df) = 4.582(2), p = 0.101). Post-hoc analysis revealed that SAF was significantly higher in STDR compared with mild NPDR (2.61 AU vs. 2.11 AU, adj. p = 0.007), while comparisons between the other groups did not reach statistical significance (mild NPDR vs. moderate NPDR: 2.11 AU vs. 2.44 AU, adj. p = 0.104; moderate NPDR vs. STDR: 2.44 AU vs. 2.61 AU, adj. p = 0.569).
Univariate logistic regression was performed to assess potential predictors of STDR in the T1DM cohort (Table 4). Only follow-up SAF and renal parameters were significantly associated with the presence of STDR. Diabetes duration showed a borderline association with STDR, whereas HbA1c levels were not significantly related to STDR. Each 1 AU increase in follow-up SAF was associated with a 3.6-fold higher odds of STDR (Table 4).
A subsequent multivariable logistic regression analysis was performed using three models due to the limited number of STDR cases (n = 21). Follow-up SAF remained significantly and positively associated with STDR independently of diabetes duration (Table 5, Model 1). However, in models including SAF together with renal parameters, neither SAF nor eGFR or UACR levels remained significantly associated with STDR (Models 2 and 3).
When assessed using ROC analysis only follow-up SAF (AUC 0.669, 95% CI 0.534–0.805, p = 0.022) and diabetes duration (AUC 0.680, 95% CI 0.559–0.801, p = 0.015), but not 1/eGFR (AUC 0.635, p = 0.068) or UACR (AUC 0.640, p = 0.057), showed significant discriminatory ability for identifying participants with STDR. The optimal SAF cut-off, determined using the maximum Youden index, was 2.42 AU, corresponding to a sensitivity of 71.4% and a specificity of 62.7%.
3.4. Change in SAF and HbA1c Levels According to the Presence and Severity of DR
Baseline and follow-up HbA1c levels did not differ significantly in individuals with DR (8.52% vs. 8.45%, p = 0.914) or in those without DR (7.44% vs. 7.2%, p = 0.212). Although follow-up SAF was higher in participants with DR (2.387 AU vs. 2.285 AU, p = 0.066) and unchanged in those without DR (2.294 AU vs. 2.290 AU, p = 0.963) compared to the baseline values, neither comparison reached statistical significance. However, SAF showed a significant increase from baseline in individuals with STDR (Figure 1A), whereas changes in HbA1c remained non-significant across DR severity groups (Figure 1B).
4. Discussion
In the present study, the prevalence of DR was high (74%) among individuals with long-standing T1DM. This finding is comparable to that reported by Zlatarova et al. (68.8%) in another Bulgarian cohort of similar age, although with a shorter duration of diabetes [26]. Consistent with previous studies in T1DM, HbA1c levels were significantly higher in participants with DR than in those without DR [27,28]. Although follow-up SAF tended to be higher in subjects with DR, the difference did not reach statistical significance. In the study by Osawa et al., SAF was no longer a significant determinant of the presence of DR after adjustment for diabetes duration and blood glucose levels [21]. Similar results were reported by Araszkiewicz et al., who identified diabetes duration and not SAF as the only independent predictor of concomitant DR [19]. Notably, in the present study, T1DM duration was similar in individuals with and without DR, possibly reflecting the generally long-standing disease. After 15–20 years of DM, the risk of DR reaches a plateau [29], and nearly 90% of participants in our cohort had DM for ≥ 20 years.
DM is a classic example of accelerated formation and accumulation of AGEs [5]. Our results, showing significantly higher SAF levels (as a non-invasive marker for AGE assessment) in individuals with T1DM compared to age-matched healthy controls, are in line with several clinical studies [30,31]. In addition to reflecting retrospective glycemic control [8,9], AGEs contribute to the pathogenesis of diabetic vascular complications through both direct and receptor-mediated mechanisms [11]. Despite the lack of a significant difference in SAF levels between individuals with and without DR, we found that SAF - not HbA1c - was significantly associated with DR severity. Follow-up SAF was significantly higher in participants with STDR compared to those with mild NPDR. Few studies have assessed the relationship between SAF and DR severity in T1DM populations [9,20,23]. Our observations support two cross-sectional studies reporting a progressive increase in SAF with increasing DR severity [9,20]. Furthermore, we found that only SAF and renal parameters were significant determinants of concomitant STDR. The association between SAF and STDR remained significant after adjustment for diabetes duration, but lost significance when considering the influence of eGFR and UACR individually. This may be explained by the strong correlation we observed between SAF and renal parameters, suggesting that the relationship between SAF and STDR is partially mediated by renal changes. Importantly, SAF - but not eGFR or UACR - showed statistically significant discriminatory ability for detecting concomitant STDR (AUC 0.680, p = 0.015). Nevertheless, the calculated sensitivity (71.4%) and specificity (62.7%) for the SAF cut-off value of 2.42 AU indicate a limited role as an independent screening marker.
Examined through skin biopsy, AGEs predict future deterioration of DR in the DCCT/EDIC study, independently of HbA1c [32]. To our knowledge, only one prospective study in T1DM has analyzed the relationship between non-invasively measured skin AGEs and the future development or progression of DR [33]. Rigalleau et al. demonstrated that baseline SAF positively predicted new-onset and/or worsened DR over a 7-year follow-up of nearly 200 individuals with T1DM. This association remained significant after adjustment for factors such as age and eGFR [33]. No prior research has investigated how changes in SAF over time relate to DR. Although follow-up SAF did not differ significantly between individuals with and without DR, we observed an increase in SAF during follow-up exclusively in participants with DR. Additionally, individuals with the most severe form of DR showed a significant increase in SAF from baseline to follow-up.
The small sample size of the T1DM cohort, as well as the lack of objective fundus examination data at the time of baseline HbA1c and SAF assessments, are among the limitations of the present study. Consequently, the prognostic value of changes in SAF for the de novo development or progression of DR during follow-up could not be assessed.
5. Conclusions
In conclusion, we observed a trend toward higher SAF in individuals with DR compared with those without DR, although the difference did not reach statistical significance. Importantly, SAF - but not HbA1c levels or diabetes duration - was significantly associated with DR severity and the presence of coexisting STDR. These findings support the role of SAF as a marker of metabolic memory and long-term glycemic exposure, which cannot be captured by a single HbA1c measurement. SAF may therefore represent a reliable, non-invasive biomarker for identifying individuals at increased risk of STDR, a condition requiring more frequent monitoring. Additional prospective studies in larger T1DM cohorts are needed to validate the potential role of changes in SAF in the development and/or progression of DR.
Author Contributions
Conceptualization, E.H. and M.B.; methodology, E.H., Z.Z., L.Z. and S.S.; validation, M.B., Z.Z., V.I., N.U. and Y.Y.; formal analysis, E.H. and N.U.; investigation, E.H.; resources, M.B., V.I., Y.Y.; data curation, E.H.; writing—original draft preparation, E.H..; writing—review and editing, M.B., Z.Z., V.I., L.Z., N.U., S.S., Y.Y.; visualization, E.H.; supervision, M.B., Z.Z., V.I., Y.Y. All authors have read and agreed to the published version of the manuscript.
Funding
This research received no external funding.
Institutional Review Board Statement
The study was conducted in accordance with the Declaration of Helsinki, and the protocol was approved by the Research Ethics Committee of the Medical University - Varna, Bulgaria (No. 117/26.05.2022).
Informed Consent Statement
Informed consent was obtained from all subjects involved in the study.
Data Availability Statement
The raw data supporting the conclusions of this article will be made available by the corresponding author upon reasonable request.
Conflicts of Interest
The authors declare no conflicts of interest.
Abbreviations
The following abbreviations are used in this manuscript:
AGEs - advanced glycation end-products
ASCVD - atherosclerotic cardiovascular disease
AUC - area under the curve
BMI - body mass index
CI - confidence interval
CKD-EPI - Chronic Kidney Disease Epidemiology Collaboration
DM - diabetes mellitus
DR - diabetic retinopathy
eGFR - estimated glomerular filtration rate
HbA1c - glycated hemoglobin
IQR - interquartile ranges
NPDR - non-proliferative diabetic retinopathy
OR - odds ratio
PDR - proliferative diabetic retinopathy
RFs - risk factors
SAF - skin autofluorescence
STDR - sight-threatening diabetic retinopathy
T1DM - type 1 diabetes mellitus
UACR - urinary albumin-to-creatinine ratio
References
- Bourne, R.R.A.; Stevens, G.A.; White, R.A.; et al. Causes of vision loss worldwide, 1990-2010: A systematic analysis. Lancet Glob. Health 2013, 1(6), e339–e349. [Google Scholar] [CrossRef] [PubMed]
- Tan, T.E.; Wong, T.Y. Diabetic retinopathy: Looking forward to 2030. In Front Endocrinol (Lausanne); Frontiers Media S.A, 2023. [Google Scholar] [CrossRef] [PubMed]
- Al, Ghamdi A.H. Clinical Predictors of Diabetic Retinopathy Progression; A Systematic Review. Curr. Diabetes Rev. 2019, 16(3), 242–247. [Google Scholar] [CrossRef]
- Koetsier, M.; Lutgers, H.L.; De Jonge, C.; et al. Reference Values of Skin Autofluorescence. Diabetes Technol. Ther. 2010, 12(5), 399–403. [Google Scholar] [CrossRef] [PubMed]
- Brownlee, M. Advanced protein glycosylation in diabetes and aging. Annu. Rev. Med. 1995, 46, 223–234. [Google Scholar] [CrossRef] [PubMed]
- Testa, R.; Bonfigli, A.R.; Prattichizzo, F.; et al. The “Metabolic Memory” Theory and the Early Treatment of Hyperglycemia in Prevention of Diabetic Complications. Nutrients 2017, 9(5), 437. [Google Scholar] [CrossRef] [PubMed]
- Meerwaldt, R.; Graaf, R.; Oomen, P.H.N.; et al. Simple non-invasive assessment of advanced glycation endproduct accumulation. Diabetologia 2004, 47(7), 1324–1330. [Google Scholar] [CrossRef] [PubMed]
- Rigo, M.; Lecocq, M.; Brouzeng, C.; et al. Skin autofluorescence, a marker of glucose memory in type 2 diabetes. Metab. Open. 2020, 7, 100038. [Google Scholar] [CrossRef] [PubMed]
- Sugisawa, E.; Miura, J.; Iwamoto, Y.; et al. Skin autofluorescence reflects integration of past long-term glycemic control in patients with type 1 diabetes. Diabetes Care 2013, 36(8), 2339–2345. [Google Scholar] [CrossRef] [PubMed]
- Ávila, F.; Cruz, N.; González, M.A.; et al. Dietary advanced glycation end products (AGEs): A modifiable risk factor in the prevention of chronic diseases associated with aging? Biochim. B.V. 2025, 235, 80–92. [Google Scholar] [CrossRef] [PubMed]
- Mengstie, M.A.; Chekol Abebe, E.; Behaile Teklemariam, A.; et al. Endogenous advanced glycation end products in the pathogenesis of chronic diabetic complications. Front Mol. Biosci. 2022, 9, 1002710. [Google Scholar] [CrossRef] [PubMed]
- Monnier, V.M.; Sell, D.R.; Gao, X.; et al. Plasma advanced glycation end products and the subsequent risk of microvascular complications in type 1 diabetes in the DCCT/EDIC. BMJ Open Diabetes Res. Care 2022, 10(1), e002667. [Google Scholar] [CrossRef]
- Oshitari, T. Advanced Glycation End-Products and Diabetic Neuropathy of the Retina. Int. J. Mol. Sci.MDPI. 2023, 24(3), 2927. [Google Scholar] [CrossRef] [PubMed]
- Ahuja, P.; Waris, A.; Siddiqui, S.S.; et al. Single nucleotide variants of receptor for advanced glycation end-products (AGER) gene: is it a new opening in the risk assessment of diabetic retinopathy?—a review. J. Genet Eng. Biotechnol. 2022, 20(1), 17. [Google Scholar] [CrossRef] [PubMed]
- Ansari, P.; Tabasumma, N.; Snigdha, N.N.; et al. Diabetic Retinopathy: An Overview on Mechanisms, Pathophysiology and Pharmacotherapy. Diabetology 2022, 3(1), 159–175. [Google Scholar] [CrossRef]
- Huang, H. Pericyte-endothelial interactions in the retinal microvasculature. Int. J. Mol. Sci.MDPI AG. 2020, 21(19), 1–18. [Google Scholar] [CrossRef] [PubMed]
- Januszewski, A.S.; Sachithanandan, N.; Karschimkus, C.; et al. Non-invasive measures of tissue autofluorescence are increased in Type 1 diabetes complications and correlate with a non-invasive measure of vascular dysfunction. Diabet. Med. 2012, 29(6), 726–733. [Google Scholar] [CrossRef] [PubMed]
- Monnier, V.M.; Vishwanath, V.; Frank, K.E.; et al. Relation between complications of type I diabetes mellitus and collagen-linked fluorescence. N Engl. J. Med. 1986, 314(7), 403–408. [Google Scholar] [CrossRef] [PubMed]
- Araszkiewicz, A.; Naskret, D.; Niedzwiecki, P.; et al. Increased accumulation of skin advanced glycation end products is associated with microvascular complications in type 1 diabetes. Diabetes Technol. Ther. 2011, 13(8), 837–842. [Google Scholar] [CrossRef] [PubMed]
- Genevieve, M.; Vivot, A.; Gonzalez, C.; et al. Skin autofluorescence is associated with past glycaemic control and complications in type 1 diabetes mellitus. Diabetes Metab. 2013, 39(4), 349–354. [Google Scholar] [CrossRef] [PubMed]
- Osawa, S.; Katakami, N.; Kuroda, A.; et al. Skin autofluorescence is associated with early-stage atherosclerosis in patients with type 1 diabetes. J. Atheroscler. Thromb. 2017, 24(3), 312–326. [Google Scholar] [CrossRef] [PubMed]
- Diallo, A.M.; Jaisson, S.; Barriquand, R.; et al. Association Between the Tissue and Circulating Advanced Glycation End-Products and the Micro- and Macrovascular Complications in Type 1 Diabetes: The DIABAGE Study. Diabetes Ther. 2022, 13(8), 1531–1546. [Google Scholar] [CrossRef] [PubMed]
- Varoniukaite, A.; Poskiene, U.; Paskeviciene, D.; et al. Association of Advanced Glycation End Products with Diabetic Retinopathy Severity in Lithuanian Patients. Medicina 2025, 61(11), 1956. [Google Scholar] [CrossRef] [PubMed]
- Pancheva, R.; Dimitrov, L.; Gillon-Keren, M.; et al. Dietary Behavior and Compliance to Bulgarian National Nutrition Guidelines in Patients With Type 1 Diabetes With Longstanding Disease. Front Nutr. 2022, 9, 900422. [Google Scholar] [CrossRef] [PubMed]
- Meerwaldt, R.; Links, T.; Graaff, R.; et al. Simple noninvasive measurement of skin autofluorescence. Ann. N Y Acad. Sci. 2005, 1043, 290–8. [Google Scholar] [CrossRef] [PubMed]
- Zlatarova, Z.; Hristova, E.; Bliznakova, K.; et al. Prevalence of Diabetic Retinopathy Among Diabetic Patients from Northeastern Bulgaria. Diagnostics 2024, 14(20), 2340. [Google Scholar] [CrossRef] [PubMed]
- Schreur, V.; van Asten, F.; Ng, H.; et al. Risk factors for development and progression of diabetic retinopathy in Dutch patients with type 1 diabetes mellitus. Acta Ophthalmol. 2018, 96(5), 459–464. [Google Scholar] [CrossRef] [PubMed]
- Hammes, H.P.; Kerner, W.; Hofer, S.; et al. Diabetic retinopathy in type 1 diabetes - A contemporary analysis of 8,784 patients. Diabetologia 2011, 54(8), 1977–1984. [Google Scholar] [CrossRef] [PubMed]
- EURODIAB IDDM Complications Study Group. Microvascular and acute complications in IDDM patients: the EURODIAB IDDM Complications Study. Diabetologia 1994, 37(3), 278–285. [Google Scholar] [CrossRef] [PubMed]
- Januszewski, A.S.; Xu, D.; Cho, Y.H.; et al. Skin autofluorescence in people with type 1 diabetes and people without diabetes: An eight-decade cross-sectional study with evidence of accelerated aging and associations with complications. Diabet. Med. 2021, 38(7), e14432. [Google Scholar] [CrossRef] [PubMed]
- Osawa, S.; Katakami, N.; Sato, I.; et al. Skin autofluorescence is associated with vascular complications in patients with type 2 diabetes. J. Diabetes Complicat. 2018, 32(9), 839–844. [Google Scholar] [CrossRef] [PubMed]
- Genuth, S.; Sun, W.; Cleary, P.; et al. Glycation and Carboxymethyllysine Levels in Skin Collagen Predict the Risk of Future 10-Year Progression of Diabetic Retinopathy and Nephropathy in the Diabetes Control and Complications Trial and Epidemiology of Diabetes Interventions and Complications Participants With Type 1 Diabetes. Diabetes 2005, 54(11), 3103–11. [Google Scholar] [CrossRef] [PubMed]
- Rigalleau, V.; Foussard, N.; Larroumet, A.; et al. Can the skin autofluorescence predict retinopathy in diabetes? Diabet. Med. 2021, 38, e14499. [Google Scholar] [CrossRef] [PubMed]
Figure 1.
Changes in HbA1c and SAF according to DR Severity. A: Paired t-tests were used for comparisons in mild and moderate NPDR (mild NPDR: t(df) = 0.856 (19), p = 0.403; moderate NPDR: t(df) = 0.227 (18), p = 0.823). For the comparison in STDR, a paired Wilcoxon test was applied (p = 0.708). Data for mild and moderate NPDR are presented as mean ± SD, while data for STDR are shown as median and interquartile range (IQR). B: Paired t-tests were used for all comparisons (mild NPDR: t(df) = 0.375 (19), p = 0.712; moderate NPDR: t(df) = 0.433 (18), p = 0.671; STDR: t(df) = 2.497 (20), p = 0.021). Data are presented as mean ± SD.
Figure 1.
Changes in HbA1c and SAF according to DR Severity. A: Paired t-tests were used for comparisons in mild and moderate NPDR (mild NPDR: t(df) = 0.856 (19), p = 0.403; moderate NPDR: t(df) = 0.227 (18), p = 0.823). For the comparison in STDR, a paired Wilcoxon test was applied (p = 0.708). Data for mild and moderate NPDR are presented as mean ± SD, while data for STDR are shown as median and interquartile range (IQR). B: Paired t-tests were used for all comparisons (mild NPDR: t(df) = 0.375 (19), p = 0.712; moderate NPDR: t(df) = 0.433 (18), p = 0.671; STDR: t(df) = 2.497 (20), p = 0.021). Data are presented as mean ± SD.
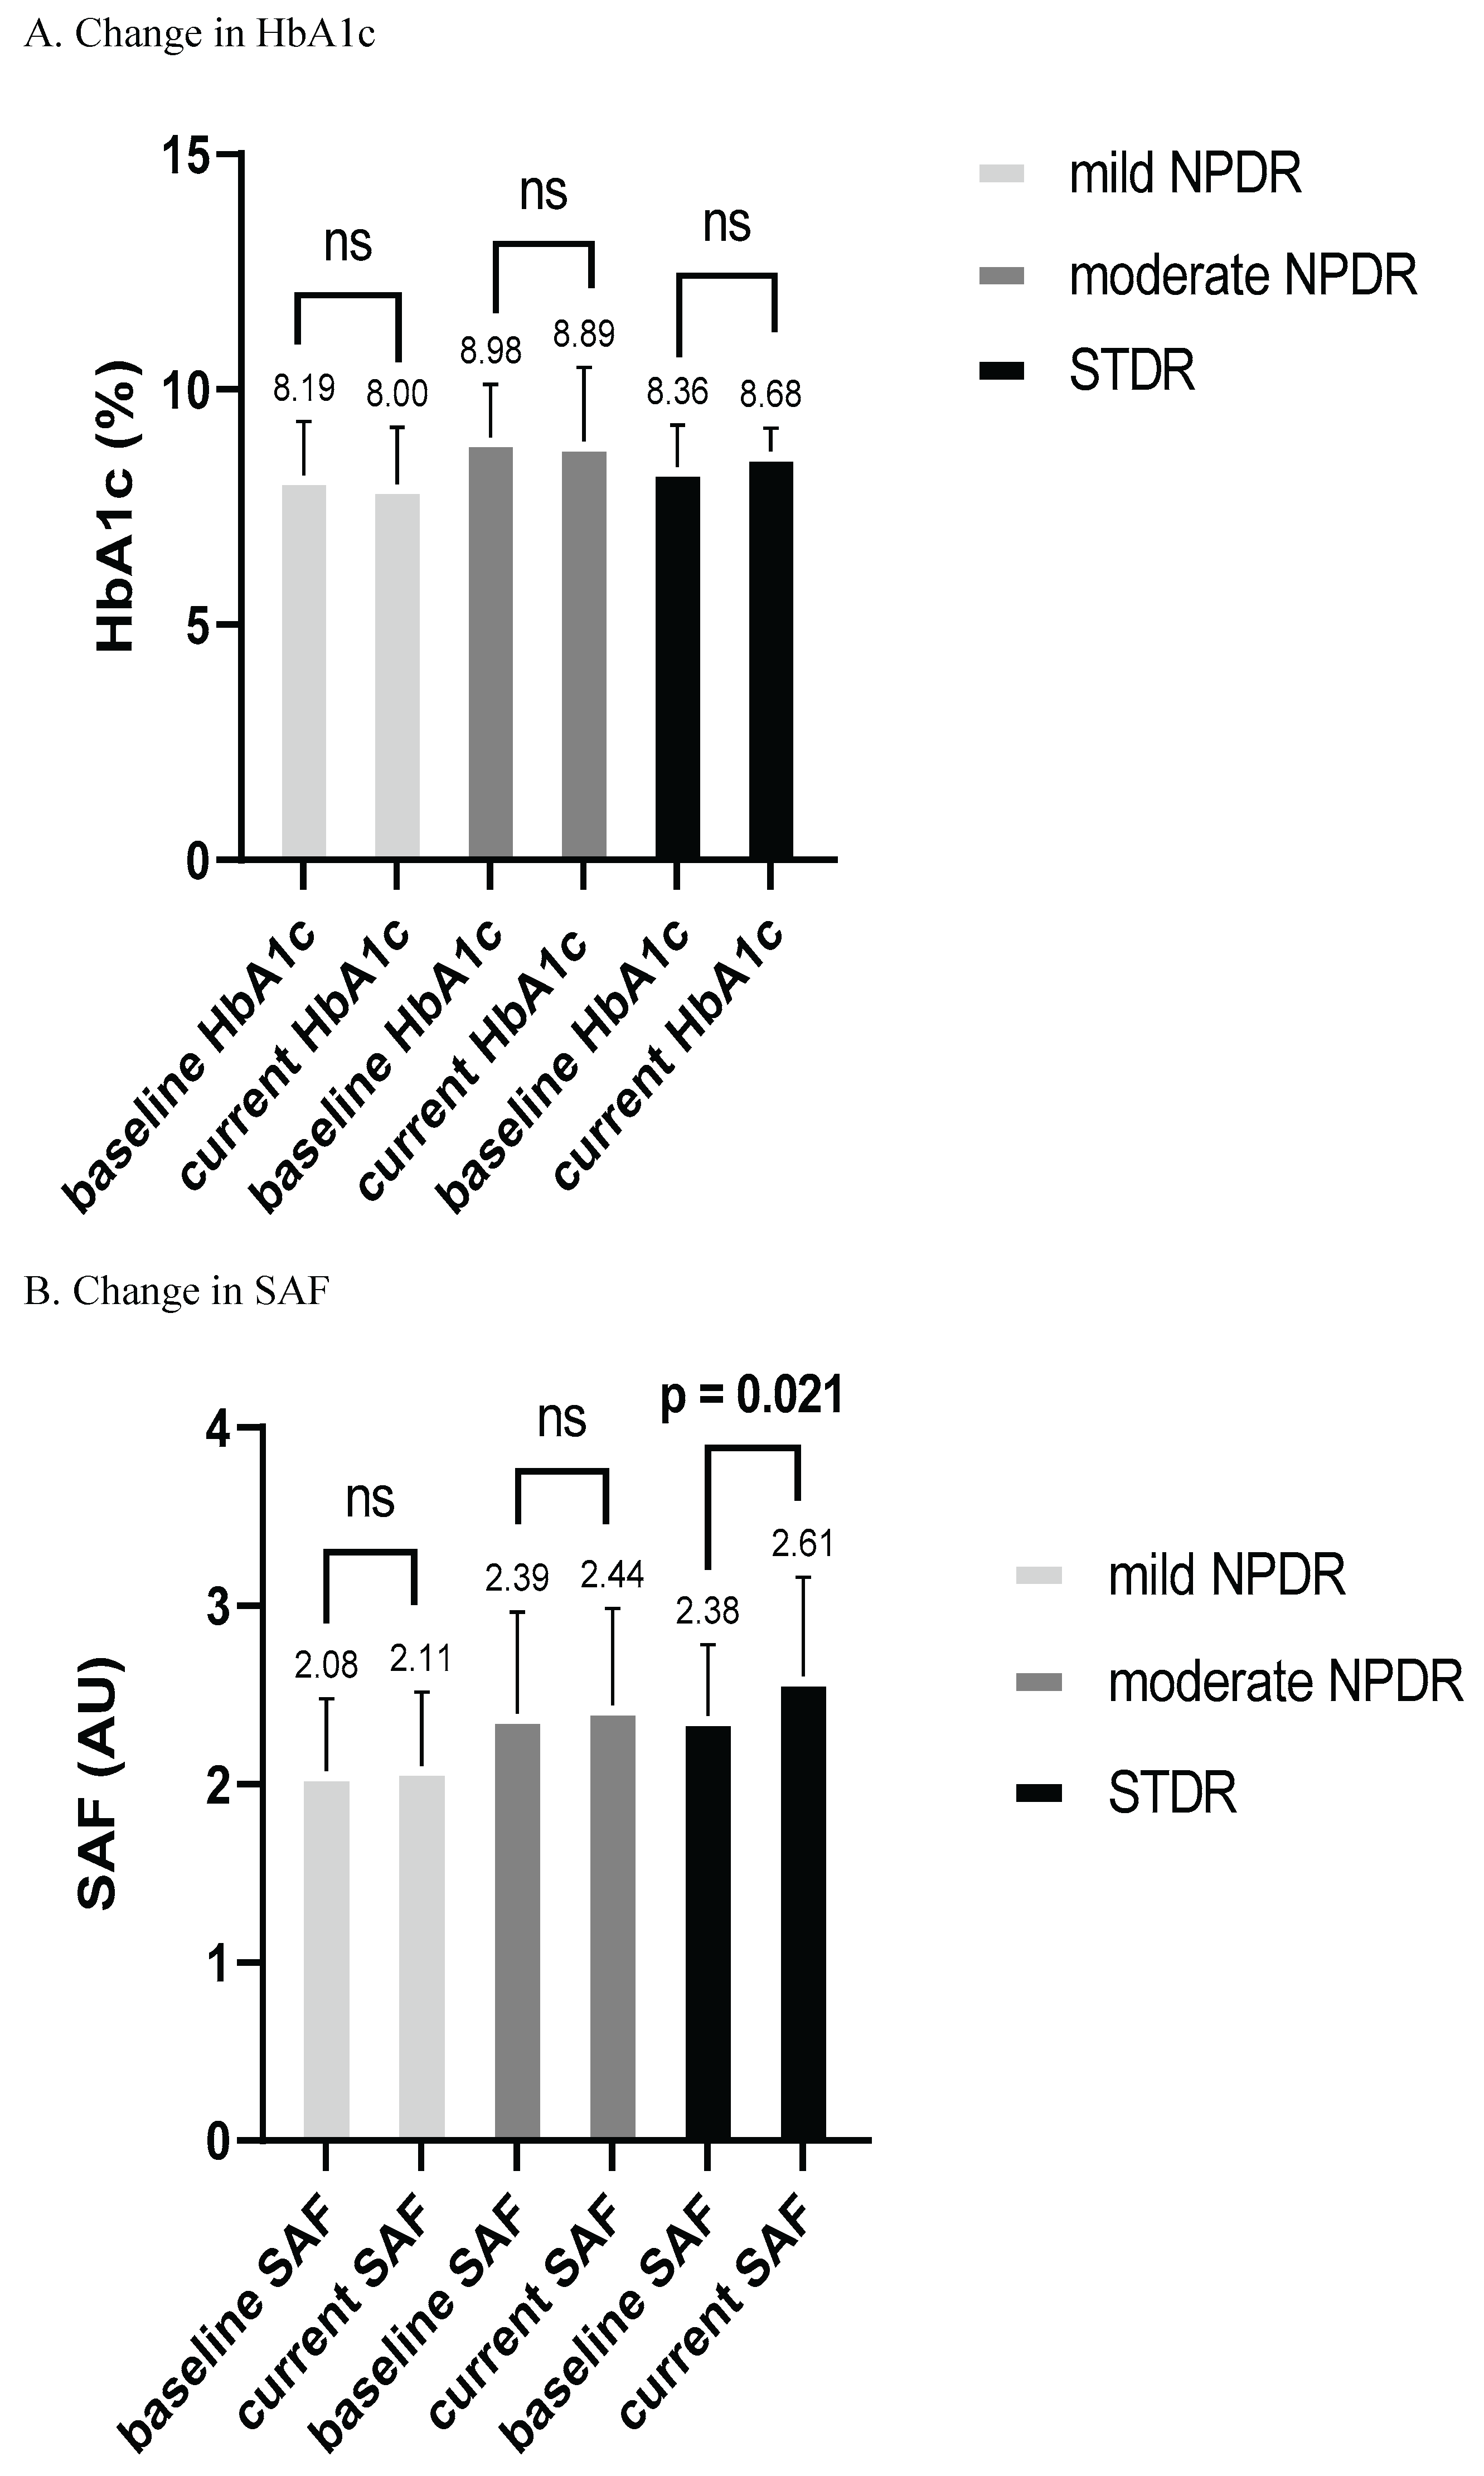

Table 1.
Main characteristics of the study population.
| Variables | T1DM (n = 81) |
Controls (n = 45) |
p - value |
|---|---|---|---|
|
Age (years) |
47 (IQR, 41.5 - 53) |
49 (IQR, 41.5 - 54.5) |
p = 0.729 |
|
Gender (% female/male) |
42/58 | 46.7/53.3 | p = 0.612 |
| Duration of T1DM (years) | 27 (IQR, 22 - 33.5) |
- | - |
| Follow-up duration (months) | 36.5 ± 5.9 | 38.5 ± 5.7 | p = 0.07 |
| BMI (kg/m²) | 26.17 ± 4.126 | 26.58 ± 5.02 | p = 0.623 |
| Smoking (%) | 46.9 | 46.7 | p = 0.983 |
| Hypertension (%) | 71.6 | 26.7 | p < 0.0001 |
| Dyslipidemia (%) | 66.7 | 62.2 | p = 0.613 |
| Baseline HbA1c (%) | 8.284 ± 1.463 | 5.378 ± 0.356 | p < 0.0001 |
| Follow-up HbA1c (%) | 7.84 (IQR, 7.205 - 9.02) |
5.55 (IQR, 5.3 - 5.725) |
p < 0.0001 |
| Baseline SAF (AU) | 2.2 (IQR, 2 - 2.55) |
1.9 (IQR, 1.6 - 2.1) |
p < 0.0001 |
| Follow-up SAF (AU) | 2.37 (IQR, 1.915 - 2.715) |
1.97 (IQR, 1.665 - 2.2) |
p < 0.0001 |
| UACR (mg/mmol) | 0.691 (IQR, 0.365 – 1.658) (n = 80) |
0.43 (IQR, 0.32 – 0.688) (n = 44) |
p = 0.005 |
| eGFR (ml/min/1.73 m²) | 101 (IQR, 89 - 107) |
102 (IQR, 93 - 106.5) |
p = 0.382 |
T1DM: type 1 diabetes mellitus; BMI: body mass index; HbA1c: glycated hemoglobin; SAF: skin autofluorescence; UACR: urinary albumin-to-creatinine ratio; eGFR: estimated glomerular filtration rate.
Table 2.
Characteristics of individuals with and without DR.
| Variables | T1DM with DR (n = 60) | T1DM without DR (n = 21) | p - value |
|---|---|---|---|
|
Age (years) |
47 (IQR, 40.25 - 53) | 47 (IQR, 44 - 57.5) | p = 0.378 |
|
Gender (% female/male) |
41.7/58.3 | 42.9/57.1 | p = 0.924 |
| Duration of T1DM (years) | 27 (IQR, 23 - 34.75) | 27 (IQR, 19.5 - 32.5) | p = 0.277 |
| BMI (kg/m²) | 26.37 ± 4.279 | 25.63 ± 3.696 | p = 0.456 |
| Smoking (%) | 43.3 | 57.1 | p = 0.278 |
| Hypertension (%) | 70 | 76.2 | p = 0.59 |
| Dyslipidemia (%) | 60 | 85.7 | p = 0.033 |
| Baseline HbA1c (%) | 8.52 (IQR, 7.555 - 9.358) |
7.44 (IQR, 6.1 - 8.32) |
p = 0.003 |
| Follow-up HbA1c (%) | 8.447 ± 1.343 | 7.201 ± 0.964 | p < 0.0001 |
| Baseline SAF (AU) | 2.285 ± 0.478 | 2.290 ± 0.452 | p = 0.963 |
| Follow-up SAF (AU) | 2.387 ± 0.542 | 2.294 ± 0.464 | p = 0.452 |
| eGFR (ml/min1.73 m²) | 100.5 (IQR, 90 - 107) | 102 (IQR, 81 - 106.5) | p = 0.714 |
| UACR (mg/mmol) | 0.71 (IQR, 0.350 - 1.635) |
0.671 (IQR, 0.375 - 3.573) (n = 20) |
p = 0.989 |
T1DM: type 1 diabetes mellitus; DR: diabetic retinopathy; BMI: body mass index; HbA1c: glycated hemoglobin; SAF: skin autofluorescence; eGFR: estimated glomerular filtration rate; UACR: urinary albumin-to-creatinine ratio.
Table 3.
Correlation between DR severity and characteristics of participants with T1DM.
| Variables | T1DM with DR (n = 60) | ||
|---|---|---|---|
| DR severity | |||
| rs | 95%CI | p - value | |
| Age (years) | 0.207 | -0.057 - 0.444 | 0.112 |
| Gender (male/female) | 0.015 | -0.248 - 0.275 | 0.913 |
| Duration of T1DM (years) | 0.241 | -0.021 - 0.473 | 0.064 |
| BMI (kg/m²) | -0.034 | -0.293 - 0.229 | 0.796 |
| Smoking (yes/no) | 0.266 | 0.005 - 0.493 | 0.04 |
| Hypertension (yes/no) | 0.145 | -0.121 - 0.391 | 0.27 |
| Dyslipidemia (yes/no) | 0.098 | -0.167 - 0.35 | 0.457 |
| Baseline HbA1c (%) | 0.065 | -0.199 - 0.321 | 0.621 |
| Follow-up HbA1c (%) | 0.163 | -0.103 - 0.407 | 0.213 |
| Baseline SAF (AU) | 0.271 | 0.011 - 0.497 | 0.036 |
| Follow-up SAF (AU) | 0.362 | 0.111 - 0.569 | 0.005 |
| eGFR (ml/min/1.73 m²) | −0.268 | -0.495 - -0.007 | 0.038 |
| UACR (mg/mmol) | 0.234 | -0.029 - 0.466 | 0.072 |
| UACR > 3 mg/mmol (yes/no) | 0.394 | 0.149 - 0.594 | 0.002 |
T1DM: type 1 diabetes mellitus; DR: diabetic retinopathy; BMI: body mass index; HbA1c: glycated hemoglobin; SAF: skin autofluorescence; eGFR: estimated glomerular filtration rate; UACR: urinary albumin-to-creatinine ratio; CI: confidence interval. All correlations were calculated using Spearman’s rank correlation coefficient (rs). For all dichotomous variables presented in a “yes/no” format, the reference category is “no.” For the variable “gender,” the reference category is female.
Table 4.
Univariate logistic regression of potential predictors of STDR.
| Dependent variable: STDR, n = 21 | |||
|---|---|---|---|
| Independent variables | Unstandardized logistic coefficient (B) | OR (95% CI) | p - value |
|
Age (years) (n = 81) |
-0.005 | 0.995 (0.942 - 1.052) |
0.858 |
| Duration of T1DM (years) (n = 81) | 0.056 | 1.058 (0.999 - 1.125) |
0.054 |
|
Smoking (yes/no) (n = 81) |
0.296 | 1.344 (0.495 - 3.693) |
0.56 |
|
Hypertension (yes/no) (n = 81) |
0.316 | 1.371 (0.456 - 4.699) |
0.583 |
|
Dyslipidemia (yes/no) (n = 81) |
-0.284 | 0.753 (0.270 - 2.182) |
0.593 |
|
Baseline HbA1c (%) (n = 81) |
0.182 | 1.2 (0.854 - 1.706) |
0.291 |
|
Follow-up HbA1c (%) (n = 81) |
0.249 | 1.283 (0.892 - 1.865) |
0.178 |
|
Baseline SAF (AU) (n = 81) |
0.600 | 1.823 (0.634 - 5.341) |
0.262 |
|
Follow-up SAF (AU) (n = 81) |
1.272 | 3.567 (1.314 - 10.76) |
0.012 |
|
eGFR (ml/min/1.73 m²) (n = 81) |
-0.03 | 0.970 (0.945 - 0.994) |
0.015 |
|
UACR (mg/mmol) (n = 80) |
0.065 | 1.067 (1.016 - 1.142) |
0.003 |
|
UACR > 3 mg/mmol (yes/no) (n = 80) |
1.565 | 4.781 (1.537 - 15.43) |
0.007 |
T1DM: type 1 diabetes mellitus; STDR: sight-threatening diabetic retinopathy; HbA1c: glycated hemoglobin; SAF: skin autofluorescence; eGFR: estimated glomerular filtration rate; UACR: urinary albumin-to-creatinine ratio; OR: odds ratio; CI: confidence interval. For all dichotomous variables presented in a “yes/no” format, the reference category is “no.”.
Table 5.
Logistic regression models examining the association between SAF and STDR adjusted for other clinical variables.
Table 5.
Logistic regression models examining the association between SAF and STDR adjusted for other clinical variables.
| Dependent variable: STDR, n = 21 | ||||
|---|---|---|---|---|
| Independent variables | Unstandardized logistic coefficient (B) | OR (95% CI) | p - value | |
| Model 1: |
Follow-up SAF (AU) (n = 81) |
1.213 | 3.363 (1.159 - 9.757) |
0.026 |
|
Duration of T1DM (years) (n = 81) |
0.050 | 1.052 (0.990 - 1.118) |
0.105 | |
| Model 2: |
Follow-up SAF (AU) (n = 81) |
0.997 | 2.710 (0.904 - 8.125) |
0.075 |
|
eGFR (ml/min/1.73 m²) (n = 81) |
-0.022 | 0.978 (0.953 - 1.004) |
0.099 | |
| Model 3: |
Follow-up SAF (AU) (n = 80) |
0.956 | 2.602 (0.846 - 8.005) |
0.095 |
|
UACR (mg/mmol) (n = 80) |
0.045 | 1.046 (0.988 - 1.109) |
0.124 | |
STDR: sight-threatening diabetic retinopathy; SAF: skin autofluorescence; T1DM: type 1 diabetes mellitus; eGFR: estimated glomerular filtration rate; UACR: urinary albumin-to-creatinine ratio; OR: odds ratio; CI: confidence interval.
Disclaimer/Publisher’s Note: The statements, opinions and data contained in all publications are solely those of the individual author(s) and contributor(s) and not of MDPI and/or the editor(s). MDPI and/or the editor(s) disclaim responsibility for any injury to people or property resulting from any ideas, methods, instructions or products referred to in the content. |
© 2026 by the authors. Licensee MDPI, Basel, Switzerland. This article is an open access article distributed under the terms and conditions of the Creative Commons Attribution (CC BY) license (http://creativecommons.org/licenses/by/4.0/).
Copyright: This open access article is published under a Creative Commons CC BY 4.0 license, which permit the free download, distribution, and reuse, provided that the author and preprint are cited in any reuse.


