

Submitted:
13 June 2026
Posted:
15 June 2026
You are already at the latest version
Abstract
This study investigated retinal proteomic alterations associated with type-1 diabetes mellitus (T1DM) using two mouse models of diabetic retinopathy (DR): the genetic Ins2akita/+ (Akita) model and streptozotocin (STZ)-induced diabetes. Retinas were collected from Akita (n=4) and STZ-induced diabetic mice (n=6) 15–16 weeks after diabetes onset and compared with age-matched controls. Quantitative mass spectrometry identified 7,933 proteins in Akita retinas and 7,399 proteins in STZ retinas. Differentially expressed proteins were identified using adjusted p-values and log₂ fold-change, ranked by Man-hattan distance, and visualized with volcano plots and heatmaps. The top 20 dysregulat-ed proteins in each model were subjected to canonical pathway analysis. Both models demonstrated upregulation of inflammatory and angiogenesis-associated proteins, in-cluding LRRC58, coronin-2A, S100-A4, and COL4A2, supporting a pro-inflammatory and vascular remodeling microenvironment. However, there were distinctive changes in some proteins between the two models. For example, Crystallins were downregulated in the STZ model but upregulated in the Akita model. Canonical pathway analysis revealed ac-tivation of platelet-related signaling pathways, enrichment of lipid metabolic networks, and significant alterations in extracellular matrix organization. These findings indicate coordinated inflammatory, metabolic, and structural remodeling in DR and identify can-didate molecular pathways for further investigation and therapeutic targeting.
Keywords:
diabetic retinopathy
; akita
; STZ
; type-1 diabetes mellitus
; proteome
; spectrometry
1. Introduction
Diabetic retinopathy (DR) is a significant microvascular complication of diabetes mellitus (DM) and continues to be one of the primary reasons of vision impairment and blindness in the contemporary world [1,2,3,4]. The increased rates of DR across the world and the resulting burdens are expected to increase by a great margin in the next few decades. DR was estimated at 103 million cases in 2020, and cases predicted to increase to an estimated 130 and 161 million by 2030 and 2045, respectively [5]. About 4.1 million adult citizens are diagnosed with DR in the United States alone, and one out of every 12 adults past the age of 40 years has an advanced, vision-threatening stage of this disease [6]. In addition to its ocular manifestations, DR serves as an indicator of systemic vascular dysfunction and is associated with increased morbidity and mortality due to its close relationship with the broader vascular complications of diabetes [3].
The pathogenesis of DR is a multifactorial chronic disorder that advances in the sequence of non-proliferative (NPDR), characterized by breakdown of the blood retinal barrier (BRB) and diabetic macular edema (DME), followed by proliferative DR (PDR), defined by abnormal blood vessel growth (retinal neovascularization or RNV) [7] DME can occur at any stage of DR, though it is more frequently observed in advanced stages. The underlying microvascular injury in DR results from hyperglycemia-induced activation of multiple signaling pathways, notably the upregulation of vascular endothelial growth factor (VEGF) and NF-κB–mediated inflammatory cascades, leading to breakdown of the BRB and subsequent vascular leakage [8]. Clinically, these processes manifest as DME, microaneurysms, intraretinal hemorrhages, cotton-wool spots, intraretinal microvascular abnormalities, venous caliber changes, and neovascularization. These pathological changes can result in significant vision loss through mechanisms including vitreous hemorrhage, retinal detachment, DME, and retinal capillary nonperfusion [9,10].
Current therapeutic interventions, such as laser photocoagulation and intravitreal pharmacologic therapy (e.g., anti-VEGF and triamcinolone), are limited by significant side effects [11]. These side effects may include long-term postoperative hemorrhage, recurrent retinal detachment, future development of epiretinal membrane after vitrectomy, central retinal vessel occlusion, and neovascular glaucoma [12]. Such limitations highlight the importance of elucidating the molecular pathways involved in the pathogenesis of DR and exploring innovative therapeutic strategies aimed at improving clinical outcomes.
To study DR, a range of experimental diabetic models is widely used. For example, the Akita mouse model (Ins2akita/+), which carries a genetic defect causing impaired insulin secretion, and the streptozotocin (STZ)-induced mouse model displaying insulin deficiency due to destruction of pancreatic ß-cells. Both serve as established models for type 1 diabetes mellitus (T1DM). On the other hand, the db/db mouse and Goto-Kakizaki (GK) rat represent experimental type 2 diabetes mellitus (T2DM) models. Since DR is more common in T1DM [13], this study is carried out in experimental models of T1DM utilizing both the Akita mouse and the STZ-induced model.
In this study, we performed comparative proteomic profiling of retinas from Akita and STZ-treated mice with their respective controls. Differentially expressed proteins from the two models were compared with their controls to identify the unique molecular alterations in the progression of DR. This study ultimately seeks to delineate the most profoundly dysregulated proteins, elucidating their roles as central contributors to the pathogenesis of DR and as viable targets for therapeutic intervention to mitigate disease progression.
2. Materials and Methods
2.1. Experimental Mice
Animal studies were carried out at the Eye Research Institute, Oakland University (Rochester, MI, USA) animal facility. The animal protocols were approved by the Institutional Animal Care and Use Committee (IACUC) (Protocol #2022-1159). Akita mice with C57BL/6J background (C57BL/6J Ins2Akita) were obtained from Jackson Laboratories (Bar Harbor, ME) [14] were used in this study as a genetic model of T1DM. Akita mice is characterized by a spontaneous mutation in the insulin 2 gene that leads to incorrect folding of the insulin protein and reduced insulin secretion. Heterozygous Ins2Akita mice develop insulin dependent diabetes, by 3-4 weeks and demonstrate early retinal complications such as vascular permeability after 12-weeks and acellular capillaries after 36-weeks [15]. Since the phenotype is more severe in males than females, we only used male Akita in this study and age matched male C57BL/6J mice as a control group. Genotypes were confirmed according to the Jackson Animal Laboratory genotyping protocols specific to each genotype. Akita animals were diagnosed with diabetes after two weeks of birth. Akita and wild-type littermate eyeballs were collected at ~16 weeks post-diabetes. For streptozotocin (STZ)-induced diabetes type 1, six- to eight-week-old wild-type mice were kept fasting at least four hours before intraperitoneal (IP) injections of freshly prepared STZ (50 mg/kg, Sigma, St. Louis, MO) dissolved in citrate buffer (ThermoFisher Scientific, catalog number 005000, PH 6.0). STZ was administered once daily for five consecutive days. Control mice received intraperitoneal injections of an equivalent volume of citrate buffer following the same fasting condition and injection schedule [16]. Mice with blood glucose levels >300 mg ⁄dL were considered diabetic. Only male animals were used in this study. Eyeballs from STZ-injected and their wild-type littermate were collected at ~16 weeks post-diabetes. Their retinas were isolated (n=4 Akita, n=4 wild-type littermate, n=6 STZ, and n=5 wild-type littermate), then froze in liquid nitrogen and stored at -80 °C.
All mice were group-housed, subjected to the standard 12-hour light/12-hour dark cycle, provided with food and water ad libitum, and kept at a temperature range of 22–24 °C.
2.2. Sample Preparation
Mouse retinal samples were homogenized in 100 µL of 20 mM Tris–HCl (pH 8.0) with three 2.0 mm zirconia beads (BioSpec Products, 11079124zx) using a Storm 24 Bullet Blender (Next Advance) at setting 8 for 1 min. Following the first round of homogenization, 100 µl of 5% lithium dodecyl sulfate (LiDS) was added to each sample, and homogenization was repeated. Homogenized samples in 2.5% LiDS were heated to 95 °C for 5 minutes. An aliquot of each lysate was taken for BCA protein analysis then the remainder of each sample was reduced with 5 mM DL- dithiothreitol (DTT, Sigma cat# D5545) for 30 mins at 37 °C, alkylated with 15 mM iodoacetamide (IAA, Sigma cat# I1149) for 30 mins at room temperature in the dark, then 5mM DTT was added to stop alkylation. Samples were acidified by the addition of 20 µl of 12% phosphoric acid, then proteins were precipitated by the addition of 1 ml of 90% MeOH in 100 mM TEAB. Pellets from the precipitation were washed with 0.5 ml of 80% MeOH in 10 mM TEAB. Precipitates were dried on the bench, then resuspended in 25 µl of 20 mM Tris pH 8.0, 10 mM CaCl2, and 10% Acetonitrile (ACN). Trypsin (Promega, V5113) was added to each sample, 1 μg per sample, and then incubated overnight at 37 °C to complete the digestion. Peptides were cleaned up by solid-phase extraction on an Oasis HLB 30 mg cartridge (Waters, WAT094225), dried, and finally reconstituted in 0.1% formic acid before LC-MS analysis.
2.3. Mass Spectrometry Analysis
LC-MS/MS analysis was completed using a Thermo Scientific Vanquish-Neo chromatography system with an Acclaim PepMap 100 trap column (100 µm × 2 cm, C18, 5 µm, 100Å), and an IonOpticks Aurora column (75 µm × 25 cm) maintained at 45 °C in an Easy Spray source. A 120-minute gradient was applied, starting with 1% of solution of B (80% ACN, 0.1% FA), and increasing to the final 42% of solution B. Data independent analysis (DIA) was performed on a Thermo Scientific Orbitrap Eclipse mass spectrometer. MS1 spectra are acquired at 120,000 resolutions in the 350 to 1200 Da mass range with an AGC of 3e6. MS2 spectra were acquired in the Orbitrap and collected at 15,000 resolutions with a 200 to 1600 Da window. Fragmentation for MS2 spectra was completed using 15 Da windows between 350 to 900 Da with HCD fragmentation at a collision energy of 32, a maximum injection time of 50 msec, and an AGC target of 3e6.
2.4. Protein Identification and Quantification
Spectronaut 19.3 (Biognosis), using BGS factory settings normalization, and Mouse Uniprot FASTA database (UP000000589, downloaded March 30, 2021), processed mass spectrometry data. The search parameters included trypsin with up to two missed cleavages. Variable modification by oxidation of M, and of protein N-termini by Acetylation, Met Loss or both Acetylation and Met Loss. Carbamidomethylation of cysteine was a fixed modification. For the entire data set, false discovery rate (FDR) was calculated using a cut-off of 1% for the identification of precursors and 1% for the identification of peptides [17].
2.5. Data Analysis
Output data from Spectronaut were imported into VolcaNoseR to generate volcano plots differentially expressed proteins were identified based on adjusted p-values and log2 fold-change thresholds. Proteins meeting these criteria were ranked using Manhattan distance, which integrates effect size and statistical significance. Heatmaps were generated in R from log2-transformed protein intensity values to visualize relative protein abundance patterns across samples for the top 20 differentially expressed proteins. Canonical pathway analysis was performed using QIAGEN Ingenuity Pathway Analysis (IPA), and graphical representations of the top ten significantly enriched pathways were generated.
3. Results
To characterize proteomic changes linked to DR, we employed data-independent acquisition (DIA)-based mass spectrometry to analyze retinal proteomes from two distinct type-1 diabetes mouse models: the Akita model, representing a genetic form of diabetes, and the streptozotocin (STZ)-induced model, representing a pharmacological form, in comparison with age-matched control mice. We used both models at ~16-week post-diabetic. Proteomic analysis performed using Spectronaut (version 19.3) identified 7,933 proteins in the Akita group, and 7,399 proteins in the STZ group. Volcano plots were generated using VolcaNoseR, applying a log2 fold-change threshold ranging from −0.6 to 0.6, a significance threshold of 1.8, and Manhattan distance as the ranking criterion. The top 20 dysregulated proteins were highlighted in each volcano plot (Figure 1 and Figure 2). To further characterize the most affected biological processes, the top 10 altered canonical pathways (Figure 3 and Figure 4) were identified using QIAGEN Ingenuity Pathway Analysis (IPA). Bar lengths were determined based on Benjamini–Hochberg (B–H) multiple testing–corrected p-values, with statistical significance defined as −log(B–H p-value) > 1.3. Pathway activation states were visualized using Z-scores to color the bars.
3.1. Top 20 Dysregulated Proteins in Akita Group
Among the quantified proteins, the 20 most significantly dysregulated proteins were identified based on volcano plot ranking using Manhattan distance (Figure 1 and Table 1). Of these, 15 proteins were upregulated and 5 were downregulated in the Akita group compared to its controls. The most significantly increased protein was immunoglobulin kappa constant (IGKC) with a 2.7-fold change (log) and a 2.27 significance (-log10), whereas WAP four-disulfide core domain protein 12 showed the greatest decreased protein with a -2.45-fold change (log) and a 2.51 significance (-log10). The heatmap was created using the same 20 dysregulated proteins (Figure 5) from the volcano plot. Most Akita samples clustered together and were separated from controls. A subset of proteins showed coordinated upregulation in Akita retinas compared to controls, including immunoglobulin-related proteins (IGHG3_MOUSE, Igkc), acute-phase proteins (Orm1, Hp), and serine protease inhibitors (Serpina6, Serpina1e). Conversely, several proteins were consistently downregulated in Akita samples, including CryβB2 and neuronal-associated proteins.
The top 20 differentially expressed proteins identified in the Akita group compared to controls, ranked by Manhattan distance. For each protein, direction of change, fold change (log2), and statistical significance (-log10 p-value) are shown.
3.2. Canonical Pathway Analysis of Akita Group
Integrin cell surface interactions were the most significant enriched pathway (6.3 -log p-value) (Figure 3). IPA Z-score analysis predicted activation of response to elevated platelet cytosolic Ca2, acute phase response signaling, intrinsic prothrombin activation pathway, regulation of TLR by endogenous ligand, LXR/RXR activation, and DHCR24 signaling pathway. While IPA Z-score predicted inhibition of Integrin cell surface interactions, GP6 signaling pathway, assembly of collagen fibrils and other multimeric structures, and collagen degradation.
3.3. Top 20 Dysregulated Proteins in STZ Group
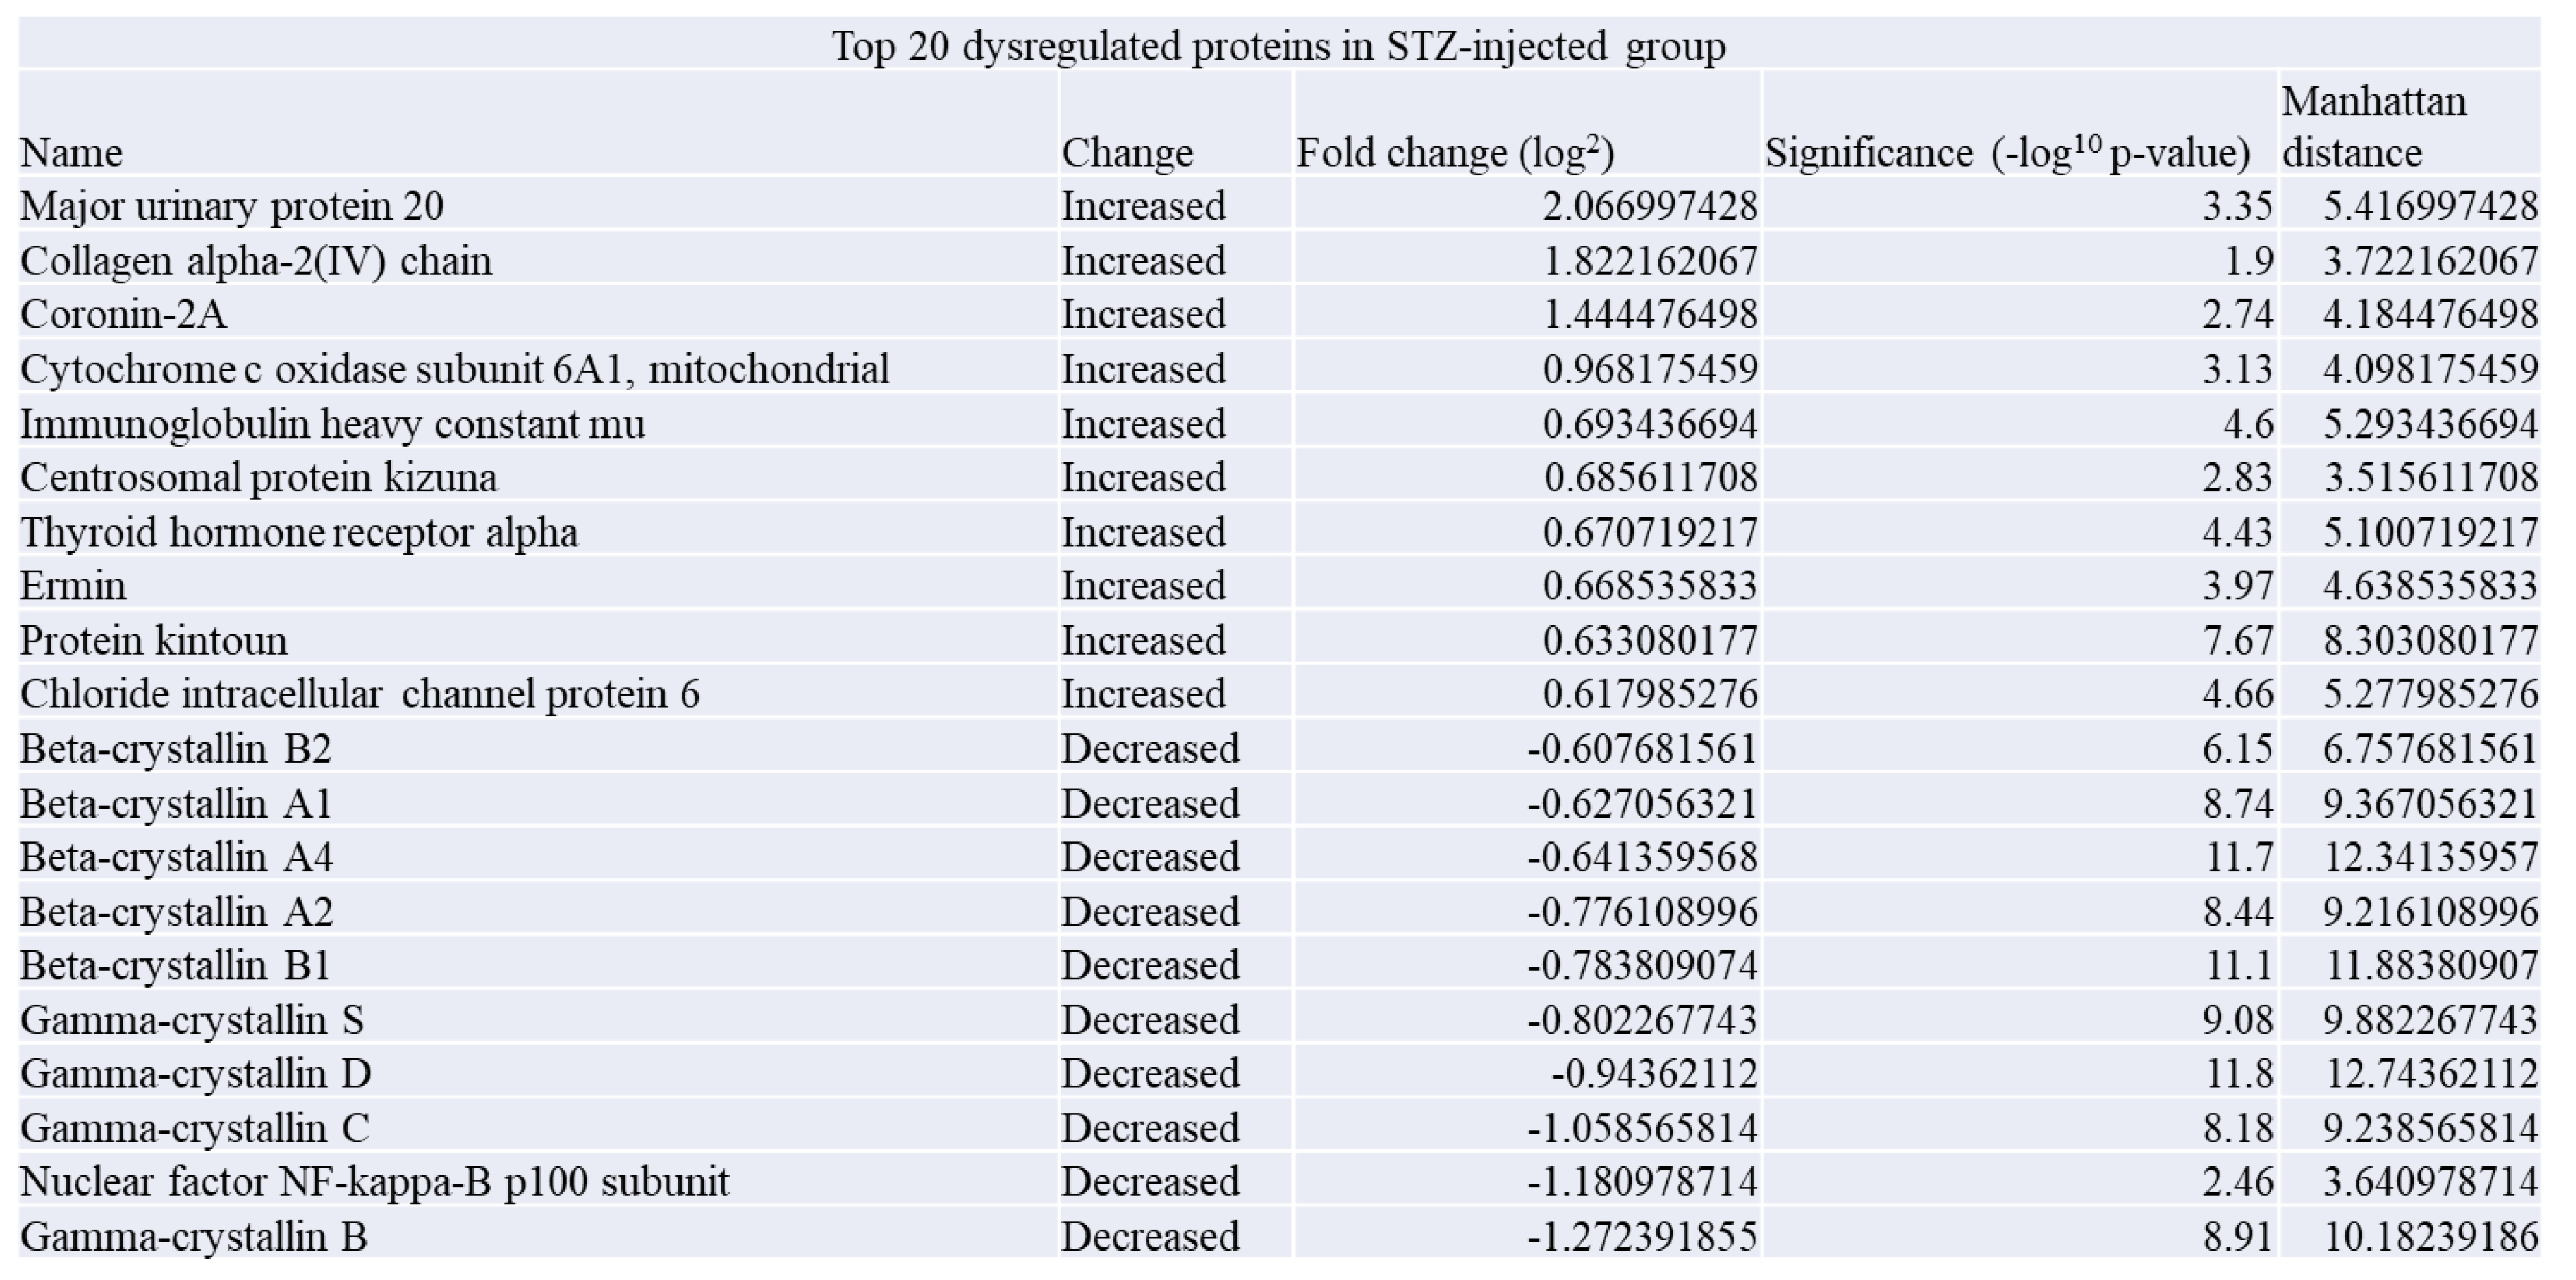
Among the top 20 dysregulated proteins in STZ group when compared to its controls, 10 of them were upregulated and 10 downregulated (Figure 2 and Table 2). Major urinary protein 20 showed the highest significant fold change increase (2.07-fold change (log) and 3.35 significance (-log10)), whereas gamma-crystallin B showed the greatest fold change decrease (-1.27 (log) fold change and 8.91 significance (-log10)). Heatmap analysis of the top 20 differentially expressed proteins between STZ and control retinas demonstrated segregation of samples according to experimental group (Figure 6). STZ samples clustered predominantly together and were separated from controls. A coordinated cluster of crystallin family members (including Cryαa, Cryαb isoforms, Cryγs, and CrysβB2) exhibited reduced relative abundance in STZ retinas compared to controls. Additional proteins, including IgHm, Thra, Ermn, and Clic6, also demonstrated group-dependent differential expression. Among the top 20 dysregulated proteins in STZ group when compared to its controls, 10 of them were upregulated and 10 downregulated (Figure 2 and Table 2). Major urinary protein 20 showed the highest significant fold change increase (2.07-fold change (log) and 3.35 significance (-log10)), whereas gamma-crystallin B showed the greatest fold change decrease (-1.27 (log) fold change and 8.91 significance (-log10)). Heatmap analysis of the top 20 differentially expressed proteins between STZ and control retinas demonstrated segregation of samples according to experimental group (Figure 6). STZ samples clustered predominantly together and were separated from controls. A coordinated cluster of crystallin family members (including Cryαa, Cryαb isoforms, Cryγs, and CrysβB2) exhibited reduced relative abundance in STZ retinas compared to controls. Additional proteins, including IgHm, Thra, Ermn, and Clic6, also demonstrated group-dependent differential expression.
The top 20 differentially expressed proteins identified in the Akita group compared to controls, ranked by Manhattan distance. For each protein, direction of change, fold change, and statistical significance (-log10 p-value) are shown.
3.4. Canonical Pathway Analysis of STZ Group
The most significantly enriched pathways included extracellular matrix (ECM) organization (4.9 -log p-value), collagen chain trimerization (4.4 -log p-value), and neutrophil extracellular trap signaling (4.2 -log p-value) (Figure 4). IPA Z-score analysis predicted activation of the majority of the top 10 pathways, with neutrophil extracellular trap signaling predicted to be inhibited. Hepatic fibrosis/hepatic stellate cell activation showed no predicted activation state due to the absence of an activity pattern in the IPA database.
4. Discussion
The current study underscored the highest dysregulated retinal proteins and related signaling pathways in two experimental mice of T1DM at ~16-week post-diabetes that represents a transition period between the early and advanced microvascular dysfunction in retina. These findings could lead to novel therapeutic targets that treat or at least prevent the progression of diabetic retinopathy. Among the notable differences in proteomic alterations between the Akita and STZ-induced diabetic models, a compensatory response was evident in the Akita retina. Specifically, crystallins were upregulated in the Akita model, whereas an opposite downregulation was observed in the STZ-induced model. Such differential regulation may contribute to the delayed onset of vascular and neuronal injury in the Akita retina compared to the STZ model. This can provide a guidance for experimental design and therapeutic intervention in the two distinct models.
Volcano plot analysis revealed widespread proteomic alterations in the Akita retina. In this study, the top 20 significantly dysregulated proteins were highlighted based on ranking by Manhattan distance, which integrates both fold change and statistical significance. Among these, IGKC was the most upregulated protein based on log2 fold change. IGKC encodes the constant region of kappa light chains of immunoglobulins, a key component of B-cell–mediated humoral immune responses [18]. In addition to IGKC, immunoglobulin heavy chain V region MOPC 104E and immunoglobulin gamma-3 chain C region (IgG3) were also significantly upregulated in the Akita retina. The concurrent upregulation of immunoglobulin light- and heavy-chain components suggests enhanced humoral immune activity within the diabetic retina [19].
Leucine-rich repeat-containing protein 58 (LRRC58) functions as a substrate adaptor for an E3 ubiquitin ligase complex that targets cysteine dioxygenase 1 (CDO1) [20]. Taurine is highly enriched in the retina and plays a critical role in protecting retinal neurons from oxidative and metabolic stress. Dysregulation of LRRC58 may therefore influence retinal cysteine–taurine metabolism, potentially reducing taurine availability and exacerbating oxidative stress, lipid dysregulation, and inflammatory processes that contribute to diabetic retinopathy [21].
Protein S100-A4, participates in angiogenesis, immune response and plays role in cancer metastasis [22]. S100-A9, a protein from the same family, has been reported to induce neurodegeneration and vascular abnormalities [23]. S100-A4 may have a similar role in DR. Being upregulated in the Akita model may reflect enhanced pro-angiogenic signaling consistent with ongoing vascular remodeling.
We noticed that CrysβB2, an abundant lens protein which has been also found to be expressed in retina [24] is among the top upregulated 20 protein in akita mouse retina suggesting a compensatory mechanism in Akita mice during the progression of DR. In the retina, βB2-Crys plays a protective role by preventing degeneration of the retinal pigment epithelium and has been shown to be upregulated during retinal regeneration, where it promotes retinal ganglion cell survival [25].
Alpha-1-acid glycoprotein 1, Haptoglobin, Heat shock protein beta-1, and corticosteroid-binding globulin, these acute-phase proteins are typically induced during local and systemic inflammation. Their upregulation is consistent with the chronic inflammation in DR [26,27,28]. Lengsin is another lens protein and ocular-associated protein implicated in cytoskeletal organization and protein stability. Its upregulation in the diabetic retina may reflect adaptive responses to cellular stress and tissue remodeling induced by chronic hyperglycemia [29].
Neurogranin is a neuronal calcium-binding protein that regulates calmodulin-dependent signaling and synaptic function. Its dysregulation in the diabetic retina supports the concept that diabetic retinopathy involves early neuronal and synaptic alterations in addition to vascular pathology [30]. The dysregulation of lengsin and neurogranin highlights concurrent structural and neuronal remodeling in the diabetic retina, reinforcing the emerging view of diabetic retinopathy as a disorder involving both tissue architecture and neural dysfunction.
RNA-binding protein 3 (RBM3) is a stress-responsive RNA-binding protein involved in post-transcriptional regulation and cellular survival pathways. RBM3 has been implicated in neuroprotection under metabolic and oxidative stress conditions. Its upregulation in the DR may reflect an adaptive response aimed at preserving neuronal viability and maintaining translational control in the setting of chronic hyperglycemic stress [31]. Ethanolamine-phosphate phospho-lyase participates in phospholipid metabolism by regulating ethanolamine phosphate turnover, thereby influencing membrane composition and lipid homeostasis [32]. Altered expression of this enzyme in the diabetic retina may reflect disrupted membrane lipid metabolism, a process implicated in cellular dysfunction and stress responses in diabetic retinopathy.
Normal mucosa of esophagus-specific gene 1 (NMES1) has been identified as a regulator of mucosal repair and tissue remodeling, with evidence suggesting a role in modulating macrophage responses during healing processes. The upregulation of NMES1 in the diabetic retina may therefore reflect an adaptive cellular response to chronic inflammatory stress, consistent with the sustained inflammatory environment characteristic of DR [33].
F-box only protein 50 (FBXO50) is a component of E3 ubiquitin ligase complexes that regulate protein degradation through the ubiquitin–proteasome system [34]. Downregulation of FBXO50 in the diabetic retina may indicate altered proteostasis and adaptive regulation of stress- or inflammation-related proteins in response to chronic metabolic challenge.
Keratin, type I cytoskeletal 24 (KRT24) and keratin-associated protein 19-3 (KRTAP19-3) are structural proteins linked to intermediate filament organization and cytoskeletal stability. Keratins constitute a major component of the cellular cytoskeleton, providing mechanical integrity and participating in stress-adaptive responses, while keratin-associated proteins regulate filament assembly and structural reinforcement [35]. Although the retina is not classically considered a keratin-rich tissue, the altered abundance of these proteins in the diabetic retina may reflect stress-induced cytoskeletal remodeling or changes in cellular phenotype under chronic metabolic challenge.
Alpha-1-antitrypsin proteins are serine protease inhibitors with established anti-inflammatory and tissue-protective properties. Downregulation of alpha-1-antitrypsin isoforms in the diabetic retina may reflect altered protease–antiprotease balance [36].
Whey acidic protein four-disulfide core domain protein 12 (WFDC12) exhibited the greatest decrease in abundance based on log2 fold change, indicating marked suppression in the diabetic retina. WFDC12 is associated with protease regulation and immunomodulatory functions; therefore, its downregulation may suggest impaired protease–antiprotease balance or reduced protective regulatory mechanisms within the diabetic retina [37].
Canonical pathway analysis revealed a coordinated shift in signaling networks characterized by activation of inflammatory and stress-associated pathways alongside suppression of ECM regulatory mechanisms. The enrichment of the Acute Phase Response and Toll-like receptors (TLR) regulation strongly supports activation of innate immune and inflammatory processes. Acute phase signaling activation reflects cytokine-driven systemic or tissue-level responses [38], while activation of TLR-associated pathways indicate cellular stress, tissue injury, or chronic inflammation [39].
Activation of platelet cytosolic Ca2+ signaling and the intrinsic prothrombin activation pathway suggests involvement of calcium-dependent signaling and coagulation cascade. Calcium flux is central to platelet activation and intracellular signaling [40], and prothrombin pathway enrichment often accompanies vascular stress, endothelial dysfunction, or inflammatory microenvironments [41].
The activation of Liver X Receptor/Retinoid X Receptor (LXR/RXR) and 24-dehydrocholesterol reductase (DHCR24) signaling implies modulation of lipid metabolic and cytoprotective pathways. LXR is tightly linked to lipid metabolism. RXR is involved in cell proliferation and vitamin D metabolism [42].
Activation of the DHCR24 signaling pathway in the diabetic condition may reflect adaptive modulation of sterol metabolism and cytoprotective responses. DHCR24 functions as a key enzyme in cholesterol biosynthesis and has been implicated in cellular resistance to oxidative and metabolic stress. Given that diabetes imposes significant lipid and redox imbalance, enrichment of DHCR24-associated signaling likely represents a compensatory response aimed at maintaining cholesterol homeostasis and protecting against stress-induced cellular dysfunction [43].
Both integrin signaling and GP6 signaling are fundamentally linked to cell–collagen and cell–matrix interactions. GP6 functions as a major collagen receptor, while integrins mediate cell adhesion, and bidirectional ECM signaling [44,45]. Their concurrent inhibition strongly suggests reduced matrix sensing and cell–ECM communication. The suppression of collagen assembly and collagen degradation indicates attenuated matrix remodeling dynamics [46]. Taken together, inhibition of integrin and GP6 pathways alongside suppressed collagen turnover supports a model of impaired ECM regulatory activity. This pattern may reflect disrupted structural adaptation and diminished tissue remodeling capacity.
Heatmap analysis of the top differentially expressed proteins in Akita retinas revealed coordinated upregulation of immunoglobulin components, acute-phase reactants, and serine protease inhibitors, supporting activation of inflammatory and humoral immune mechanisms in the diabetic retina. Concurrent downregulation of crystallin family members suggests impairment of intrinsic cytoprotective pathways that normally buffer oxidative and metabolic stress. The clustering of protease-regulatory and structural proteins further indicates remodeling of ECM and barrier-associated processes. Importantly, the modular organization observed in the heatmap suggests network-level proteomic reprogramming rather than isolated molecular perturbations, reinforcing pathway-level alterations identified in canonical pathway analysis.
Major urinary protein 20 (MUP20) showed the largest fold change in the STZ group. MUP20 is a liver-enriched secreted lipocalin that circulates in the bloodstream and is ultimately excreted in urine. Therefore, its marked dysregulation may reflect a broader systemic response to STZ-induced insulin deficiency and metabolic stress rather than a purely retina-intrinsic pathway. Notably, the detection of MUP20 in retinal tissue may be attributable to breakdown of the blood–retinal barrier (BRB), a well-established feature of DR, which permits increased extravasation and accumulation of circulating serum proteins within the retina [47].
Consistent with our proteomic data, which show marked upregulation of Collagen alpha-2(IV) chain (COL4A2) in STZ group, recent evidence indicates that COL4A2 actively promotes endothelial cell proliferation, migration, and angiogenesis via AKT signaling in diabetic retinopathy models. This supports a role for COL4A2 in diabetic vascular remodeling beyond its classical structural function in basement membranes [48].
Upregulation of Coronin-2A in the STZ group may reflect activated inflammatory transcriptional programs. Coronin-2A has been shown to interact with the nuclear receptor corepressor complex, linking actin cytoskeletal components with regulation of inflammatory gene expression, suggesting it could mediate changes in transcriptional responses under diabetic stress [49].
Cytochrome c oxidase subunit 6A1 (COX6A1) has been implicated in modulation of mitochondrial function and cellular responses to oxidative stress, with evidence suggesting roles in limiting reactive oxygen species (ROS) accumulation and supporting anti-apoptotic mechanisms [50]. Its upregulation our proteomic, may therefore represent a compensatory adaptation of the mitochondrial electron transport chain in response to diabetes-associated impairment of oxidative phosphorylation.
Immunoglobulin heavy constant mu (IGHM) represents the constant region of IgM antibodies. Upregulation signals immune activation, vascular permeability changes, or inflammatory infiltration [51].
Upregulation of centrosomal protein kizuna (KIZ), which contributes to centrosome stability and proper spindle assembly during mitosis, may reflect cellular stress responses or altered proliferative dynamics [52]. Diabetes is known to perturb thyroid hormone signaling, while thyroid hormone receptors play key roles in mitochondrial biogenesis and energy metabolism.
Thyroid hormone receptor alpha (THRA) is a nuclear receptor that regulates metabolic rate, mitochondrial function, and cellular differentiation [53]. The observed upregulation of THRA in our proteomic analysis may represent a compensatory response to diabetes-associated metabolic and mitochondrial stress.
Ermin is an oligodendrocyte/myelin-associated cytoskeletal protein involved in myelin sheath organization [54]. Upregulation may reflect glial responses, cytoskeletal remodeling, or myelin-related adaptations under metabolic stress.
Protein kintoun, a cytoplasmic factor historically characterized for its role in the pre-assembly of axonemal dynein complexes, was upregulated in the STZ group [55]. The observed increase in our dataset may suggest diabetes-associated modulation of cytoskeleton-dependent intracellular transport or stress-responsive trafficking pathways.
Chloride intracellular channels (CLICs) are a family of proteins that participate in intracellular ion homeostasis, membrane dynamics, and oxidative stress responses. Chloride intracellular channel protein 6 (CLIC6) upregulation reflect alterations in ionic balance or redox regulation associated with diabetic metabolic stress [56].
A prominent feature of the downregulated proteins in the STZ group was the coordinated reduction of multiple crystallin family members, including β-crystallins (βB2-Crys, βA1-Crys, βA4-Crys, βA2-Crys, βB1-Crys) and γ-crystallins (CRY-GS, CRY-GD, CRY-GC, CRY-GB). Although classically recognized as structural lens proteins, crystallins are widely expressed in neural tissues where they serve critical cytoprotective and stress-responsive functions, including molecular chaperoning, stabilization of cytoskeletal elements, and protection against oxidative damage [57]. Decreased crystallin abundance has been repeatedly associated with cellular vulnerability, impaired proteostasis, and reduced resistance to metabolic and oxidative stress [58]. In particular, β-crystallins have been implicated in neuronal survival and cytoskeletal maintenance, while γ-crystallins contribute to protein stability and stress tolerance. Therefore, the observed crystallin downregulation may reflect compromised endogenous protective mechanisms under diabetic conditions, potentially exacerbating oxidative injury and cellular dysfunction.
Additionally,: the reduction of the NF-κB p100 subunit (NFKB2) suggests perturbation of NF-κB signaling dynamics. The p100 precursor functions both as an inhibitor and a source of the active p52 transcription factor in the non-canonical NF-κB pathway, which regulates inflammatory responses, cell survival, and stress adaptation [59]. Downregulation of p100 may indicate altered inflammatory regulation or impaired stress-responsive transcriptional control in the diabetic environment.
The: pathway analysis revealed a dominant enrichment of ECM and collagen-related processes, accompanied by signatures of inflammatory and platelet-associated signaling, suggesting that STZ-induced diabetes drives coordinated structural and stress-response remodeling rather than isolated protein changes.
The most prominent pathway enrichments included ECM organization, collagen chain trimerization, assembly of collagen fibrils, collagen biosynthesis, and collagen degradation. The positive z-scores associated with these pathways indicate predicted functional activation, consistent with enhanced ECM turnover and dynamic collagen remodeling. Such coordinated regulation of matrix-related processes suggests active structural reorganization rather than passive protein accumulation, a pattern well aligned with established features of diabetic tissue remodeling.
Diabetes-associated metabolic stress, particularly hyperglycemia-driven oxidative stress and the formation of advanced glycation end products (AGEs), is known to disrupt collagen homeostasis, promoting both aberrant matrix deposition and degradation [46,60]. In contrast to the Akita model, the STZ group demonstrated activation of both integrin signaling and GP6 signaling. These pathways are centrally involved in cell–matrix and collagen-dependent signaling, where GP6 functions as a major collagen receptor and integrins regulate cell adhesion and bidirectional ECM communication. Their concurrent activation suggests enhanced matrix sensing and strengthened cell–ECM interactions rather than suppression of matrix regulatory processes. This interpretation is further supported by the enrichment of collagen-related pathways, including collagen biosynthesis, fibril assembly, and collagen degradation, collectively indicating increased ECM turnover and dynamic matrix remodeling.
Unlike the Akita dataset, which pointed toward impaired ECM regulatory activity, the STZ profile is consistent with an actively remodeling extracellular environment, potentially reflecting stress-induced structural adaptation, matrix reorganization, and collagen-driven signaling responses [44,45]. According to current models of diabetic wound pathology, chronic inflammation perpetuates activation of wound-healing signaling cascades even in the absence of effective tissue repair. Persistent pro-inflammatory cytokine signaling maintains engagement of pathways related to ECM remodeling and tissue stress responses, contributing to the apparent enrichment of the Wound Healing Signaling Pathway in the STZ group [61].
The Neutrophil Extracellular Trap (NET) Signaling Pathway exhibited a negative z-score, indicating predicted functional inhibition. NET formation represents a specialized innate immune response implicated in inflammatory and vascular injury. The predicted inhibition of NET signaling may indicate altered neutrophil-associated immune dynamics or dysregulated innate immune responses under diabetic metabolic stress [62].
The Hepatic Fibrosis / Hepatic Stellate Cell Activation pathway was enriched without a predicted activation state. In IPA, absence of a z-score reflects insufficient directional evidence, not lack of biological relevance. Enrichment of fibrosis-related pathways likely reflects shared ECM and collagen components rather than organ-specific fibrotic processes [63].
Heatmap analysis of STZ retinas revealed a striking and coordinated downregulation of α-, β-, and γ-crystallin family members, highlighting suppression of key molecular chaperones involved in oxidative stress defense and cytoskeletal stability. The tight clustering of crystallins suggests pathway-level regulation rather than isolated protein changes, indicating disruption of intrinsic neuroprotective networks in chemically induced diabetes. Additional differential expression of immune- and signaling-associated proteins further supports multifactorial remodeling of retinal homeostasis. Notably, in contrast to the Akita model, where immune-related proteins were prominently upregulated, the STZ retina exhibited dominant suppression of structural and protective proteins, suggesting model-specific mechanisms underlying diabetic retinal injury.
5. Conclusions
Collectively, the proteomic analysis identified numerous dysregulated proteins with potential mechanistic and therapeutic relevance in DR. LRRC58 and coronin-2A were consistently upregulated across models, supporting a pro-inflammatory retinal environment, while S100-A4 and COL4A2 increases align with angiogenic and vascular remodeling processes. In contrast, several crystallin family members were downregulated, suggesting impairment of intrinsic stress-response and neuroprotective mechanisms. Whether restoration of crystallin pathways could be therapeutically beneficial warrants further investigation.
Canonical pathway analysis showed activation of platelet-related signaling, suggesting increased platelet activity, microthrombus formation, and possible blood–retinal barrier disruption. Lipid-associated pathways were also enriched, indicating metabolic dysregulation, along with significant alterations in ECM organization and remodeling consistent with structural vascular changes in DR. Overall, these pathway-level findings provide a systems-based framework for prioritizing mechanisms and guiding targeted experimental validation.
Author Contributions
GA contributed to methodology, writing—original draft, and formal analysis. KL contributed to software and formal analysis. SS, MM, NK, MH, XZ, and KE contributed to investigation and data acquisition/technical support. MA contributed to supervision and funding acquisition. All authors have read and agreed to the published version of the manuscript.
Funding
This research was funded by NIH/National Eye Institute-R01 EY030054 and NIH/ National Eye Institute-1R21EY036537 (MA).
Institutional Review Board Statement
Animal studies were carried out at the Eye Research Institute, Oakland University (Rochester, MI, USA) animal facility. The animal protocols were approved by the Institutional Animal Care and Use Committee (IACUC).
Informed Consent Statement
Not applicable.
Data Availability Statement
The mass spectrometry proteomics data have been deposited to the ProteomeXchange Consortium via the PRIDE [1] partner repository with the dataset identifier PXD069751.
Acknowledgments
Wayne State University Proteomics Core which is supported through NIH grants P30ES036084, P30CA022453, and S10OD030484. The mass spectrometry proteomics data have been deposited to the ProteomeXchange Consortium via the PRIDE [1] partner repository with the dataset identifier PXD069751.
Conflicts of Interest
The authors declare no conflicts of interest. The funders had no role in the design of the study; in the collection, analyses, or interpretation of data; in the writing of the manuscript; or in the decision to publish the results.
Abbreviations
| DR | Diabetic retinopathy |
| STZ | Streptozotocin |
| T1DM | Type 1 diabetes mellitus |
| BRB | Blood-retinal barrier |
| DME | Diabetic macular edema |
| PDR | Proliferative diabetic retinopathy |
| VEGF | Vascular endothelial growth factor |
| Cry | Crystallin |
| IgG3 | Immunoglobulin gamma-3 chain C region |
| LRRC58 | Leucine-rich repeat-containing protein 58 |
| CDO1 | Cysteine dioxygenase 1 (complex targeting cysteine dioxygenase 1) |
| RBM3 | RNA-binding protein 3 |
| NMES1 | Normal mucosa of esophagus-specific gene 1 |
| FBXO50 | F-box only protein 50 |
| KRT24 | Keratin, type I cytoskeletal 24 |
| KRTAP19-3 | Keratin-associated protein 19-3 |
| WFDC12 | Whey acidic protein four-disulfide core domain protein 12 |
| TLR | Toll-like receptors |
| LXR/RXR | Liver X receptor/retinoid X receptor |
| DHCR24 | 24-dehydrocholesterol reductase |
| MUP20 | Major urinary protein 20 |
| COL4A2 | Collagen alpha-2(IV) chain |
| COX6A1 | Cytochrome c oxidase subunit 6A1 |
| IGHM | Immunoglobulin heavy constant mu |
| THRA | Thyroid hormone receptor alpha |
| CLICs | Chloride intracellular channels |
| NFKB2 | NF-κB p100 subunit |
| AGEs | Advanced glycation end products |
| ECM | Extracellular matrix |
| NET | Neutrophil extracellular traps |
References
- Kollias, A.N.; Ulbig, M.W. Diabetic retinopathy: Early diagnosis and effective treatment. Dtsch. Arztebl. Int. 2010, 107(5), 75–83; quiz 84. [Google Scholar] [CrossRef] [PubMed]
- Sinclair, S.H.; Schwartz, S.S. Diabetic Retinopathy-An Underdiagnosed and Undertreated Inflammatory, Neuro-Vascular Complication of Diabetes. Front Endocrinol. 2019, 10, 843. [Google Scholar] [CrossRef] [PubMed]
- Cheung, N.; Mitchell, P.; Wong, T.Y. Diabetic retinopathy. Lancet Lond. Engl. 2010, 376(9735), 124–136. [Google Scholar] [CrossRef] [PubMed]
- Khalil, H. Diabetes microvascular complications-A clinical update. Diabetes Metab. Syndr. 2017, 11 Suppl 1, S133–S139. [Google Scholar] [CrossRef] [PubMed]
- Tan, T.E.; Wong, T.Y. Diabetic retinopathy: Looking forward to 2030. Front Endocrinol. 2022, 13, 1077669. [Google Scholar] [CrossRef] [PubMed]
- The Eye Diseases Prevalence Research Group*. The Prevalence of Diabetic Retinopathy Among Adults in the United States. Arch. Ophthalmol. 2004, 122(4), 552–563. [CrossRef] [PubMed]
- Hu, A.; Schmidt, M.H.H.; Heinig, N. Microglia in retinal angiogenesis and diabetic retinopathy. Angiogenesis 2024, 27(3), 311–331. [Google Scholar] [CrossRef] [PubMed]
- Li, H.; Liu, X.; Zhong, H.; et al. Research progress on the pathogenesis of diabetic retinopathy. BMC Ophthalmol. 2023, 23(1), 372. [Google Scholar] [CrossRef] [PubMed]
- Neely, K.A.; Quillen, D.A.; Schachat, A.P.; Gardner, T.W.; Blankenship, G.W. DIABETIC RETINOPATHY. Med. Clin. North Am. 1998, 82(4), 847–876. [Google Scholar] [CrossRef] [PubMed]
- Shukla, U.V.; Tripathy, K. Diabetic Retinopathy. StatPearls; StatPearls Publishing, 2025. Available online: http://www.ncbi.nlm.nih.gov/books/NBK560805/ (accessed on 5 September 2025).
- Simó, R.; Hernández, C. Novel approaches for treating diabetic retinopathy based on recent pathogenic evidence. Prog. Retin Eye Res. 2015, 48, 160–180. [Google Scholar] [CrossRef] [PubMed]
- Chen, S.N.; Chen, S.J.; Wu, T.T.; Wu, W.C.; Yang, C.H.; Yang, C.M. Refining vitrectomy for proliferative diabetic retinopathy. Graefes Arch. Clin. Exp. Ophthalmol. Albrecht Von. Graefes Arch. Klin. Exp. Ophthalmol. 2023, 261(12), 3659–3670. [Google Scholar] [CrossRef] [PubMed]
- Yau, J.W.Y.; Rogers, S.L.; Kawasaki, R.; et al. Global Prevalence and Major Risk Factors of Diabetic Retinopathy. Diabetes Care 2012, 35(3), 556–564. [Google Scholar] [CrossRef] [PubMed]
- JAX® Mice & Services | The Jackson Laboratory. Available online: https://www.jax.org/jax-mice-and-services?utm_source=google&utm_medium=paid&utm_campaign=2025_jax&utm_content=search&gad_source=1&gad_campaignid=73501088&gbraid=0AAAAAD_EityCIivfqg0QSXKNSQV7g2aea&gclid=CjwKCAjwlOrFBhBaEiwAw4bYDYHAt_4WLGDTqnObQJZYocezCUyLr3U91hu0Ai3bOwuMmBgDBVHhMhoCDvAQAvD_BwE (accessed on 5 September 2025).
- Barber, A.J.; Antonetti, D.A.; Kern, T.S.; et al. The Ins2Akita Mouse as a Model of Early Retinal Complications in Diabetes. Investig. Opthalmology Vis. Sci. 2005, 46(6), 2210. [Google Scholar] [CrossRef] [PubMed]
- Furman, B.L. Streptozotocin-Induced Diabetic Models in Mice and Rats. Curr. Protoc. 2021, 1(4), e78. [Google Scholar] [CrossRef] [PubMed]
- Scofield, S.; Koshko, L.; Stilgenbauer, L.; et al. Integrative multi-omics analysis of metabolic dysregulation induced by occupational benzene exposure in mice. Sci. Total Environ. 2025, 971, 179060. [Google Scholar] [CrossRef] [PubMed]
- Pinheiro, A.; Borges, J.R.; Marques, J.P.; Esteves, P.J. The evolutionary history of IGKC in mammals reveals ancient duplications and remarkable divergence in lagomorphs. Front Immunol. 2025, 16, 1686094. [Google Scholar] [CrossRef] [PubMed]
- Al-Shabrawey, M.; Zhang, W.; McDonald, D. Diabetic Retinopathy: Mechanism, Diagnosis, Prevention, and Treatment. BioMed Res. Int. 2015, 2015, 1–2. [Google Scholar] [CrossRef] [PubMed]
- Xiao, H.; Ordonez, M.; Fink, E.C.; et al. Covariation MS uncovers a protein that controls cysteine catabolism. Nature 2025, 647(8088), 268–276. [Google Scholar] [CrossRef] [PubMed]
- Güngel, H.; Erdenen, F.; Pasaoglu, I.; Sak, D.; Ogreden, T.; Kilic Muftuoglu, I. New Insights into Diabetic and Vision-Threatening Retinopathy: Importance of Plasma Long Pentraxine 3 and Taurine Levels. Curr. Eye Res. 2021, 46(6), 818–823. [Google Scholar] [CrossRef] [PubMed]
- Li, A.; Zhu, L.; Lei, N.; et al. S100A4-dependent glycolysis promotes lymphatic vessel sprouting in tumor. Angiogenesis 2023, 26(1), 19–36. [Google Scholar] [CrossRef] [PubMed]
- Go, S.; Sokupa, S.; Gomez, Y.; U reddy, Addi; Chaurasia, S.S. S100A9 Induces Microvascular and Neurodegenerative Alterations in the Retina. Invest Ophthalmol. Vis. Sci. 2025, 66(8), 4851–4851. [Google Scholar]
- Slingsby, C.; Wistow, G.J. Functions of crystallins in and out of lens: Roles in elongated and post-mitotic cells. Prog. Biophys. Mol. Biol. 2014, 115(1), 52–67. [Google Scholar] [CrossRef] [PubMed]
- Li, M.; Liu, S.; Huang, W.; Zhang, J. Physiological and pathological functions of βB2-crystallins in multiple organs: a systematic review. Aging 2021, 13(11), 15674–15687. [Google Scholar] [CrossRef] [PubMed]
- Ceciliani, F.; Lecchi, C. The Immune Functions of α1 Acid Glycoprotein. Curr. Protein Pept. Sci. 2019, 20(6), 505–524. [Google Scholar] [CrossRef] [PubMed]
- Asleh, R.; Levy, A.P. In vivo and in vitro studies establishing haptoglobin as a major susceptibility gene for diabetic vascular disease. Vasc. Health Risk Manag. 2005, 1(1), 19–28. [Google Scholar] [CrossRef] [PubMed]
- Lee, J.H.; Meyer, E.J.; Nenke, M.A.; Lightman, S.L.; Torpy, D.J. Cortisol, Stress, and Disease—Bidirectional Associations; Role for Corticosteroid-Binding Globulin? J. Clin. Endocrinol. Metab. 2024, 109(9), 2161–2172. [Google Scholar] [CrossRef] [PubMed]
- De Maria, A.; Bassnett, S. Birc7: A Late Fiber Gene of the Crystalline Lens. Investig. Opthalmology Vis. Sci. 2015, 56(8), 4823. [Google Scholar] [CrossRef] [PubMed]
- Xiang, Y.; Xin, J.; Le, W.; Yang, Y. Neurogranin: A Potential Biomarker of Neurological and Mental Diseases. Front Aging Neurosci. 2020, 12, 584743. [Google Scholar] [CrossRef] [PubMed]
- Lin, P.; Lin, C.; Diao, L. RBM3 Ameliorates Acute Brain Injury-induced Inflammation and Oxidative Stress by Stabilizing GAS6 mRNA Through Nrf2 Signaling Pathway. Neuroscience 2024, 547, 74–87. [Google Scholar] [CrossRef] [PubMed]
- A. Elmihi K, Leonard K, Nelson R, Thiesen A, Clugston RD, Jacobs RL. The emerging role of ethanolamine phosphate phospholyase in regulating hepatic phosphatidylethanolamine and plasma lipoprotein metabolism in mice. FASEB J. 2024, 38(18), e70063. [CrossRef] [PubMed]
- Hamley, M.; Leyk, S.; Casar, C.; et al. Nmes1 is a novel regulator of mucosal response influencing intestinal healing potential. Eur. J. Immunol. 2024, 54(2), 2350434. [Google Scholar] [CrossRef]
- Kipreos, E.T.; Pagano, M. [No title found]. Genome Biol. 2000, 1(5), reviews3002.1. [Google Scholar] [CrossRef]
- Jacob, J.T.; Coulombe, P.A.; Kwan, R.; Omary, M.B. Types I and II Keratin Intermediate Filaments. Cold Spring Harb. Perspect. Biol. 2018, 10(4), a018275. [Google Scholar] [CrossRef] [PubMed]
- DeMeo, D.L. 1-Antitrypsin deficiency {middle dot} 2: Genetic aspects of 1-antitrypsin deficiency: phenotypes and genetic modifiers of emphysema risk. Thorax 2004, 59(3), 259–264. [Google Scholar] [CrossRef] [PubMed]
- Bingle, C.D.; Vyakarnam, A. Novel innate immune functions of the whey acidic protein family. Trends Immunol. 2008, 29(9), 444–453. [Google Scholar] [CrossRef] [PubMed]
- Venteclef, N.; Jakobsson, T.; Steffensen, K.R.; Treuter, E. Metabolic nuclear receptor signaling and the inflammatory acute phase response. Trends Endocrinol. Metab. 2011, 22(8), 333–343. [Google Scholar] [CrossRef] [PubMed]
- Muzio, M.; Mantovani, A. Toll-like receptors. Microbes Infect. 2000, 2(3), 251–255. [Google Scholar] [CrossRef] [PubMed]
- Bergmeier, W.; Stefanini, L. Novel molecules in calcium signaling in platelets. J. Thromb. Haemost. 2009, 7, 187–190. [Google Scholar] [CrossRef] [PubMed]
- Engelmann, B.; Massberg, S. Thrombosis as an intravascular effector of innate immunity. Nat. Rev. Immunol. 2013, 13(1), 34–45. [Google Scholar] [CrossRef] [PubMed]
- Domínguez-Avila, J.A. Dietary Phenolic Compounds Exert Some of Their Health-Promoting Bioactivities by Targeting Liver X Receptor (LXR) and Retinoid X Receptor (RXR). Foods 2023, 12(23), 4205. [Google Scholar] [CrossRef] [PubMed]
- Zhou, E.; Ge, X.; Nakashima, H.; et al. Inhibition of DHCR24 activates LXRα to ameliorate hepatic steatosis and inflammation. EMBO Mol. Med. 2023, 15(8), e16845. [Google Scholar] [CrossRef] [PubMed]
- Kechagia, J.Z.; Ivaska, J.; Roca-Cusachs, P. Integrins as biomechanical sensors of the microenvironment. Nat. Rev. Mol. Cell Biol. 2019, 20(8), 457–473. [Google Scholar] [CrossRef] [PubMed]
- Penz, S.; Reininger, A.J.; Brandl, R.; et al. Human atheromatous plaques stimulate thrombus formation by activating platelet glycoprotein VI. FASEB J. 2005, 19(8), 898–909. [Google Scholar] [CrossRef] [PubMed]
- Sprangers, S.; Everts, V. Molecular pathways of cell-mediated degradation of fibrillar collagen. Matrix Biol. 2019, 75-76, 190–200. [Google Scholar] [CrossRef] [PubMed]
- Zhou, Y.; Rui, L. Major Urinary Protein Regulation of Chemical Communication and Nutrient Metabolism. In Vitamins & Hormones; Elsevier, 2010; Volume 83, pp. 151–163. [Google Scholar] [CrossRef] [PubMed]
- Xu, Z.; Yang, L.; Gu, H. COL4A2 activation of AKT signaling drives endothelial cell proliferation, migration, and angiogenesis in diabetic retinopathy. Exp. Eye Res. 2026, 263, 110773. [Google Scholar] [CrossRef] [PubMed]
- Huang, W.; Ghisletti, S.; Saijo, K.; et al. Coronin 2A mediates actin-dependent de-repression of inflammatory response genes. Nature 2011, 470(7334), 414–418. [Google Scholar] [CrossRef] [PubMed]
- Eun, S.Y.; Woo, I.S.; Jang, H.S.; et al. Identification of cytochrome c oxidase subunit 6A1 as a suppressor of Bax-induced cell death by yeast-based functional screening. Biochem Biophys. Res. Commun. 2008, 373(1), 58–63. [Google Scholar] [CrossRef] [PubMed]
- Schroeder, H.W.; Cavacini, L. Structure and function of immunoglobulins. J. Allergy Clin. Immunol. 2010, 125((2) Suppl 2, S41–52. [Google Scholar] [CrossRef] [PubMed]
- Thomas, Y.; Peter, M.; Mechali, F.; Blanchard, J.M.; Coux, O.; Baldin, V. Kizuna is a novel mitotic substrate for CDC25B phosphatase. Cell Cycle 2014, 13(24), 3867–3877. [Google Scholar] [CrossRef] [PubMed]
- Paisdzior, S.; Schuelke, M.; Krude, H. What is the Role of Thyroid Hormone Receptor Alpha 2 (TRα2) in Human Physiology? Exp. Clin. Endocrinol. Diabetes 2022, 130(05), 296–302. [Google Scholar] [CrossRef] [PubMed]
- Wang, S.; Wang, T.; Liu, T.; et al. Ermin is a p116RIP -interacting protein promoting oligodendroglial differentiation and myelin maintenance. Glia 2020, 68(11), 2264–2276. [Google Scholar] [CrossRef] [PubMed]
- Kobayashi, D.; Takeda, H. Ciliary motility: The components and cytoplasmic preassembly mechanisms of the axonemal dyneins. Differentiation 2012, 83(2), S23–S29. [Google Scholar] [CrossRef] [PubMed]
- Loyo-Celis, V.; Patel, D.; Sanghvi, S.; et al. Biophysical characterization of chloride intracellular channel 6 (CLIC6). J. Biol. Chem. 2023, 299(11), 105349. [Google Scholar] [CrossRef] [PubMed]
- Andley, U.P. Crystallins in the eye: Function and pathology. Prog. Retin Eye Res. 2007, 26(1), 78–98. [Google Scholar] [CrossRef] [PubMed]
- Piri, N.; Kwong, J.M.K.; Caprioli, J. Crystallins in Retinal Ganglion Cell Survival and Regeneration. Mol. Neurobiol. 2013, 48(3), 819–828. [Google Scholar] [CrossRef] [PubMed]
- Dhar, A.; Chawla, M.; Chattopadhyay, S.; et al. Role of NF-kappaB2-p100 in regulatory T cell homeostasis and activation. Sci. Rep. 2019, 9(1), 13867. [Google Scholar] [CrossRef] [PubMed]
- Ljubimov, A.V.; shen, Huang Z; Huang, G.H.; et al. Human Corneal Epithelial Basement Membrane and Integrin Alterations in Diabetes and Diabetic Retinopathy1. J. Histochem Cytochem. 1998, 46(9), 1033–1041. [Google Scholar] [CrossRef] [PubMed]
- Eming, S.A.; Martin, P.; Tomic-Canic, M. Wound repair and regeneration: Mechanisms, signaling, and translation. Sci. Transl. Med. 2014, 6(265). [Google Scholar] [CrossRef] [PubMed]
- Papayannopoulos, V. Neutrophil extracellular traps in immunity and disease. Nat. Rev. Immunol. 2018, 18(2), 134–147. [Google Scholar] [CrossRef] [PubMed]
- Steinberg, G.R.; Carpentier, A.C.; Wang, D. MASH: the nexus of metabolism, inflammation, and fibrosis. J. Clin. Invest. 2025, 135(18), e186420. [Google Scholar] [CrossRef] [PubMed]
Figure 1.
Differential retinal proteome in Akita mice compared with wild-type controls. Volcano plot illustrating differential protein expression in retinas from Akita mice relative to age-matched wild-type (WT) controls. The x-axis represents log2 fold change, and the y-axis represents −log10 adjusted p-value. Each point corresponds to an identified protein. Vertical dashed lines indicate the predefined log2 fold-change threshold, and the horizontal dashed line represents the adjusted p-value significance cutoff. Proteins meeting both statistical and fold-change criteria are highlighted in red (increased in Akita) and blue (decreased in Akita), whereas gray points indicate non-significant changes. Selected top 20 dysregulated proteins, determined using Manhattan distance ranking, are annotated.
Figure 1.
Differential retinal proteome in Akita mice compared with wild-type controls. Volcano plot illustrating differential protein expression in retinas from Akita mice relative to age-matched wild-type (WT) controls. The x-axis represents log2 fold change, and the y-axis represents −log10 adjusted p-value. Each point corresponds to an identified protein. Vertical dashed lines indicate the predefined log2 fold-change threshold, and the horizontal dashed line represents the adjusted p-value significance cutoff. Proteins meeting both statistical and fold-change criteria are highlighted in red (increased in Akita) and blue (decreased in Akita), whereas gray points indicate non-significant changes. Selected top 20 dysregulated proteins, determined using Manhattan distance ranking, are annotated.
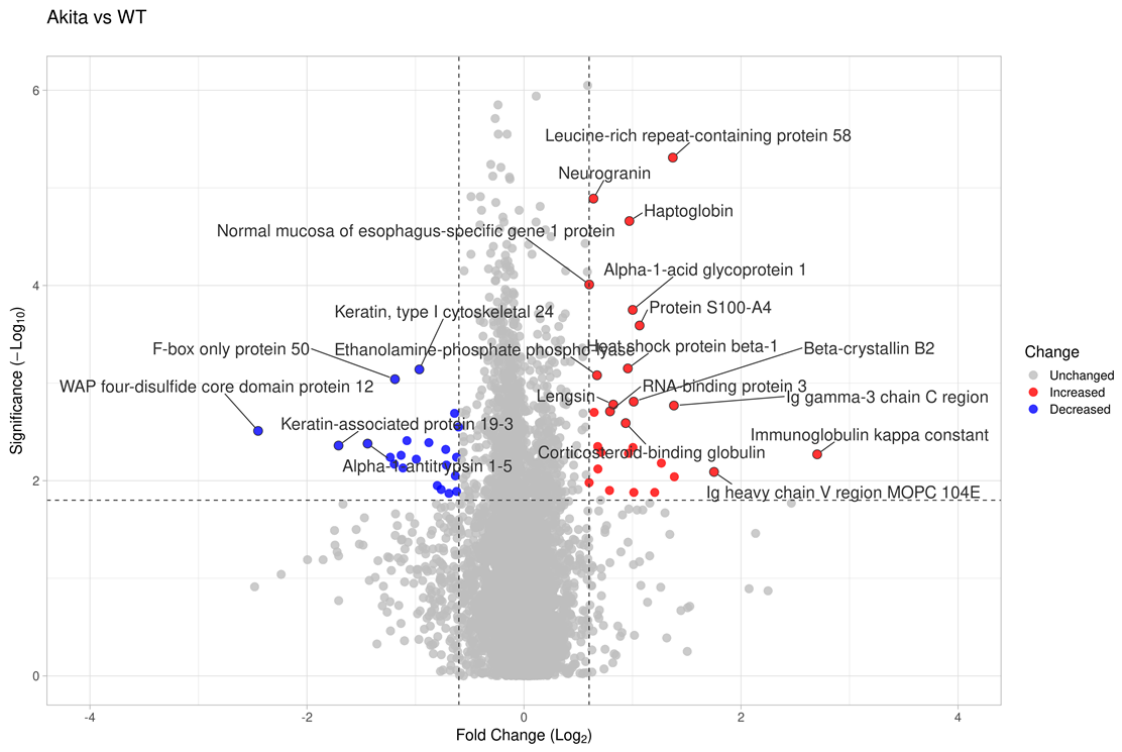
Figure 2.
Differential retinal proteome in STZ-treated mice compared with wild-type controls. Volcano plot showing differential protein expression in retinas from STZ-induced diabetic mice relative to age-matched wild-type (WT) controls. The x-axis represents log2 fold change (STZ/WT), and the y-axis represents −log10 adjusted p-value. Each point corresponds to an identified protein. Vertical dashed lines indicate the log2 fold-change threshold, and the horizontal dashed line denotes the statistical significance cutoff. Proteins meeting both criteria are highlighted in red (increased in STZ) and blue (decreased in STZ), while gray points indicate non-significant changes. Selected top 20 dysregulated proteins are annotated.
Figure 2.
Differential retinal proteome in STZ-treated mice compared with wild-type controls. Volcano plot showing differential protein expression in retinas from STZ-induced diabetic mice relative to age-matched wild-type (WT) controls. The x-axis represents log2 fold change (STZ/WT), and the y-axis represents −log10 adjusted p-value. Each point corresponds to an identified protein. Vertical dashed lines indicate the log2 fold-change threshold, and the horizontal dashed line denotes the statistical significance cutoff. Proteins meeting both criteria are highlighted in red (increased in STZ) and blue (decreased in STZ), while gray points indicate non-significant changes. Selected top 20 dysregulated proteins are annotated.
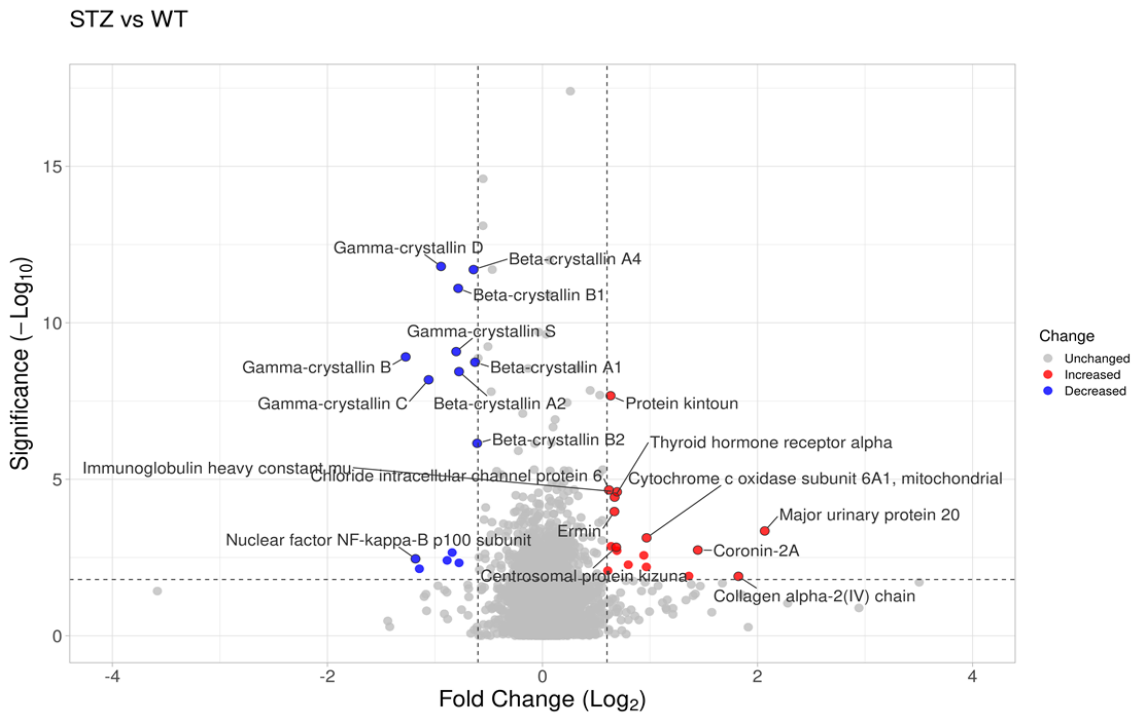
Figure 3.
Canonical pathway enrichment analysis in Akita diabetic retinas. Significantly enriched pathways identified by Ingenuity Pathway Analysis (IPA) are shown as −log10 (Benjamini–Hochberg adjusted p-value). The vertical line indicates the significance threshold. Bar colors represent predicted activity based on z-score: orange, activation; blue, inhibition; gray, no predicted activity pattern.
Figure 3.
Canonical pathway enrichment analysis in Akita diabetic retinas. Significantly enriched pathways identified by Ingenuity Pathway Analysis (IPA) are shown as −log10 (Benjamini–Hochberg adjusted p-value). The vertical line indicates the significance threshold. Bar colors represent predicted activity based on z-score: orange, activation; blue, inhibition; gray, no predicted activity pattern.
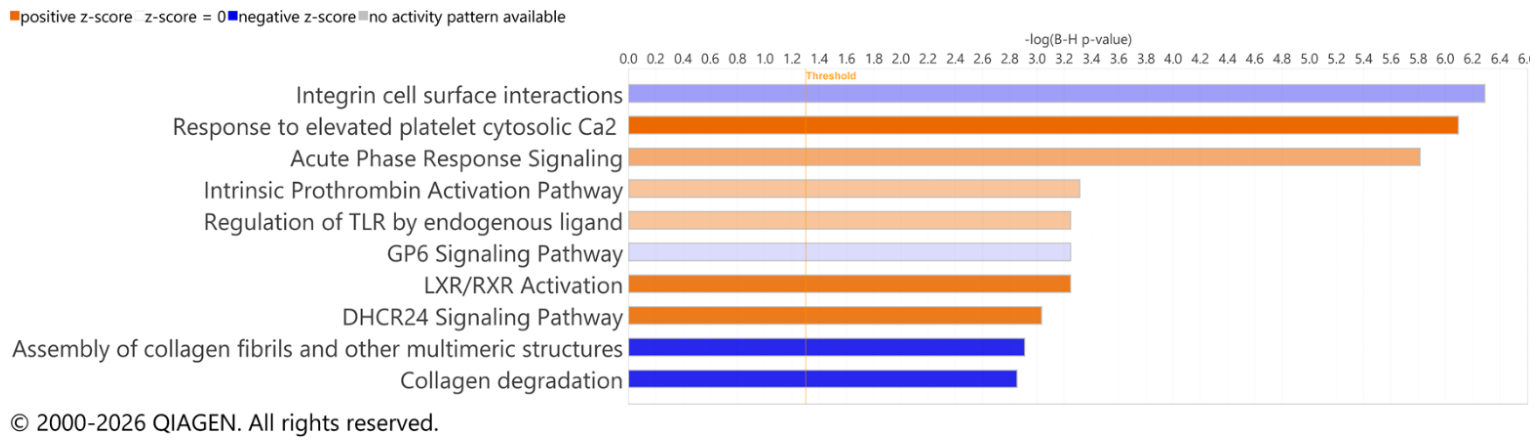
Figure 4.
Canonical pathway enrichment analysis in STZ-induced diabetic retinas. Significantly enriched canonical pathways identified by Ingenuity Pathway Analysis (IPA) are shown as −log10 (Benjamini–Hochberg adjusted p-value). The vertical line indicates the significance threshold. Bar colors denote predicted activity based on z-score: orange, activation; blue, inhibition; gray, no predicted activity pattern.
Figure 4.
Canonical pathway enrichment analysis in STZ-induced diabetic retinas. Significantly enriched canonical pathways identified by Ingenuity Pathway Analysis (IPA) are shown as −log10 (Benjamini–Hochberg adjusted p-value). The vertical line indicates the significance threshold. Bar colors denote predicted activity based on z-score: orange, activation; blue, inhibition; gray, no predicted activity pattern.
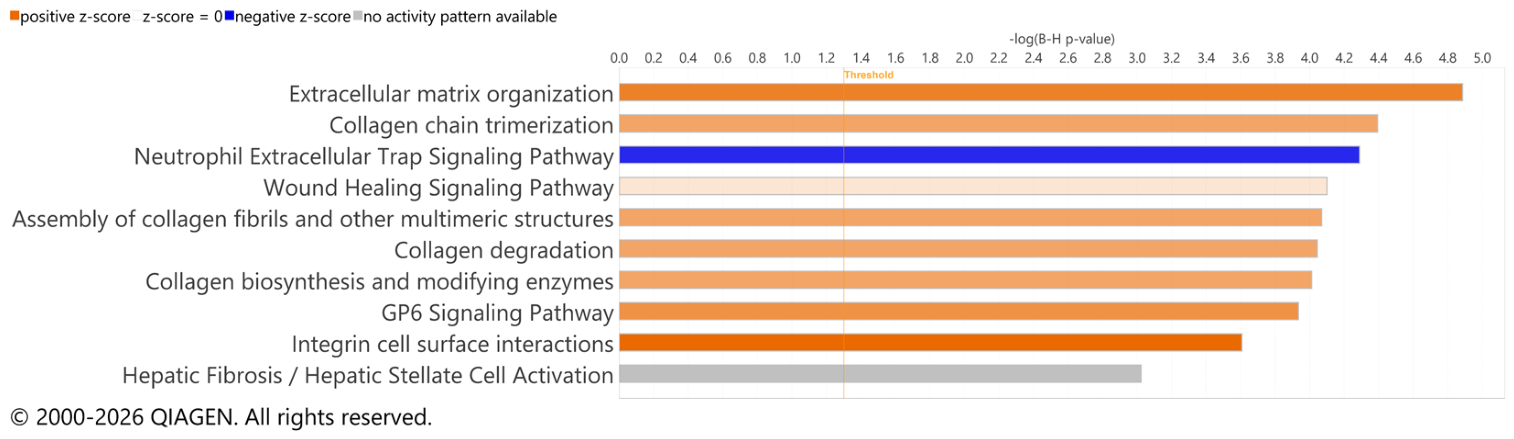
Figure 5.
Heatmap of the top 20 differentially expressed proteins in Akita versus control retinas. Hierarchical clustering of the top 20 dysregulated proteins identified by quantitative proteomics. Rows represent proteins and columns represent individual samples. Relative protein abundance is displayed as z-score–normalized expression values (red, increased; blue, decreased).
Figure 5.
Heatmap of the top 20 differentially expressed proteins in Akita versus control retinas. Hierarchical clustering of the top 20 dysregulated proteins identified by quantitative proteomics. Rows represent proteins and columns represent individual samples. Relative protein abundance is displayed as z-score–normalized expression values (red, increased; blue, decreased).
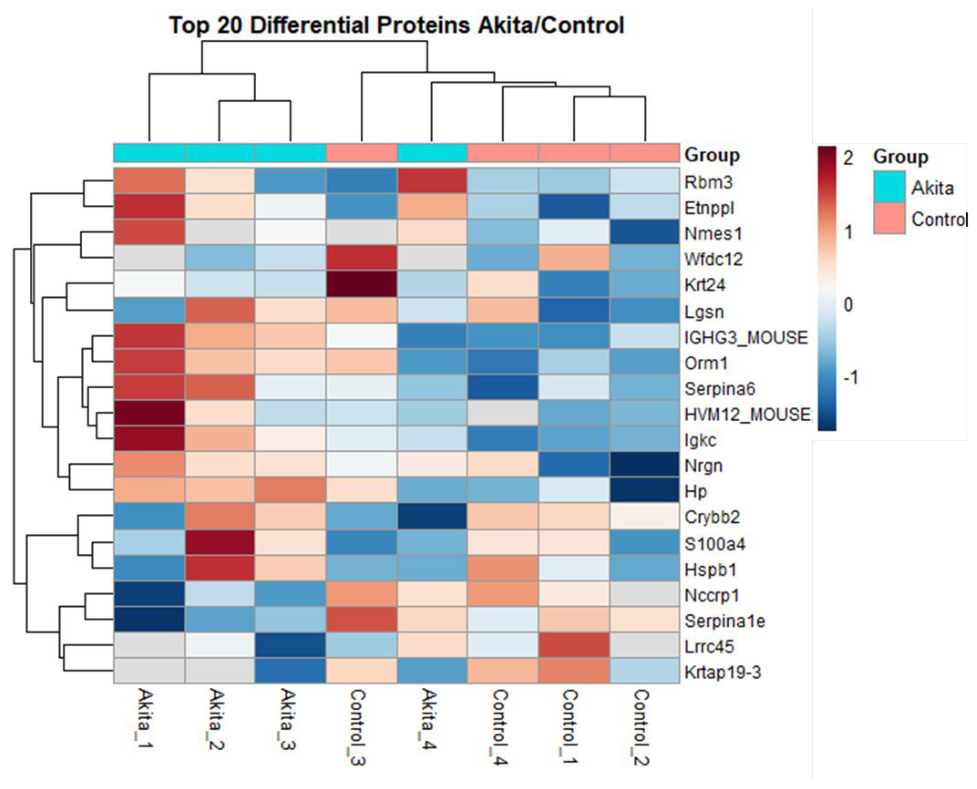
Figure 6.
Heatmap of the top 20 differentially expressed proteins in STZ versus control retinas. Hierarchical clustering of the top 20 dysregulated proteins identified by quantitative proteomics. Rows represent proteins and columns represent individual samples. Relative abundance is shown as z-score–normalized expression values (red, increased; blue, decreased).
Figure 6.
Heatmap of the top 20 differentially expressed proteins in STZ versus control retinas. Hierarchical clustering of the top 20 dysregulated proteins identified by quantitative proteomics. Rows represent proteins and columns represent individual samples. Relative abundance is shown as z-score–normalized expression values (red, increased; blue, decreased).
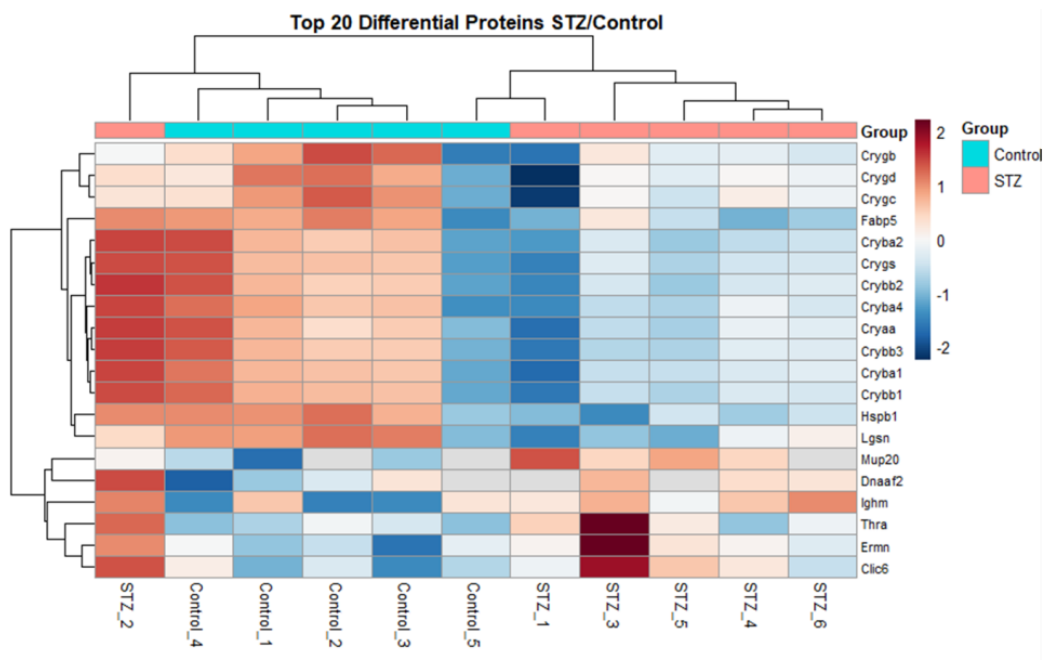

Table 1.
Top 20 dysregulated proteins in the Akita retina.
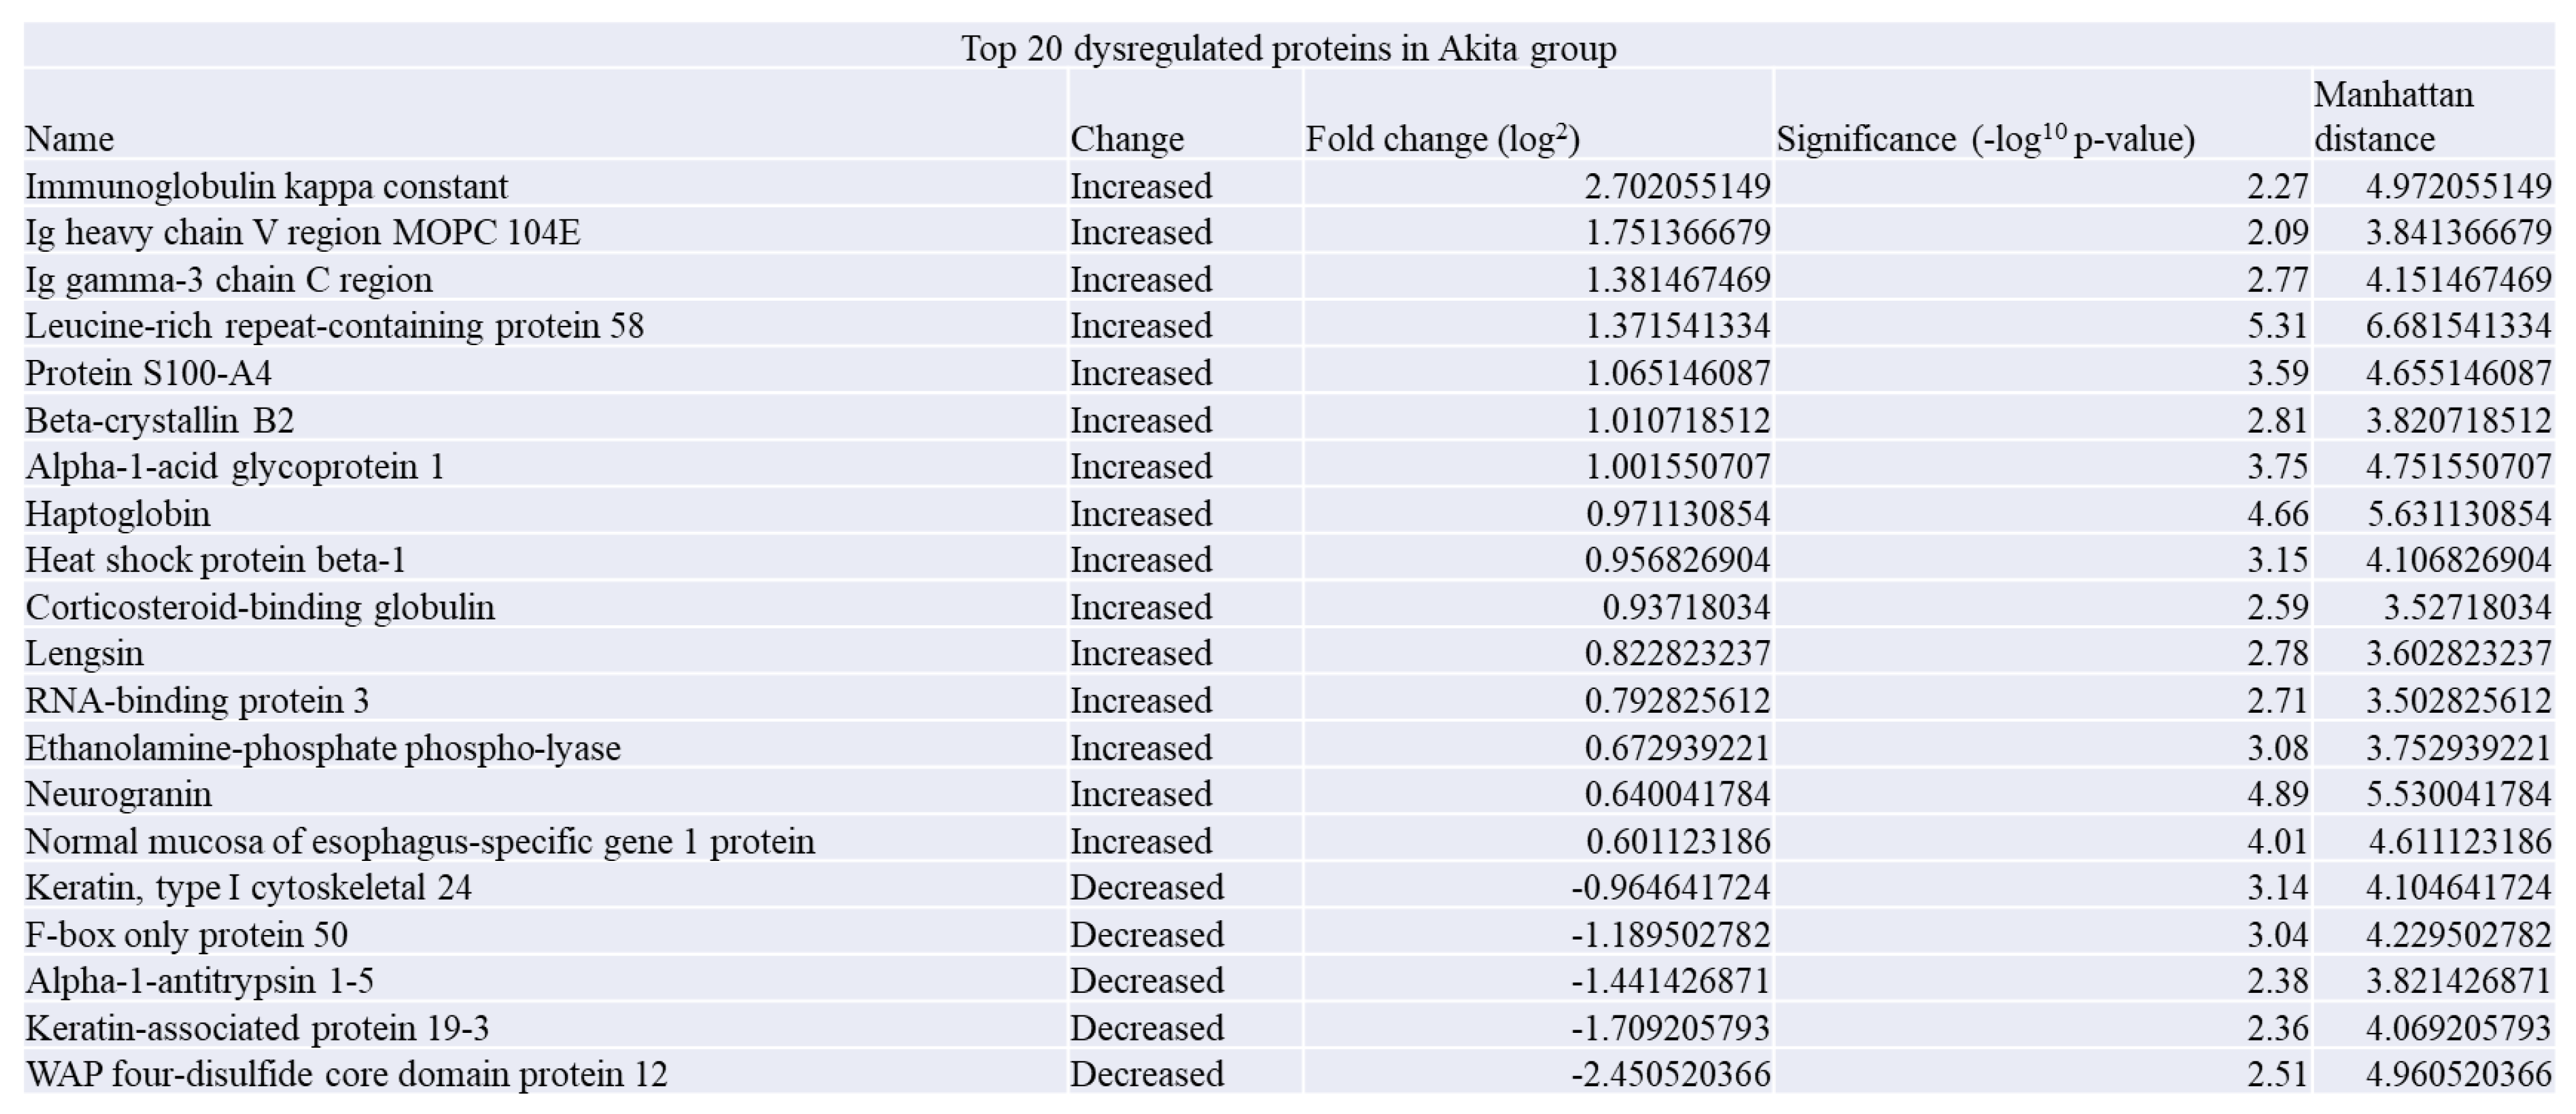
Table 2.
Top 20 dysregulated proteins in the STZ retina.
Disclaimer/Publisher’s Note: The statements, opinions and data contained in all publications are solely those of the individual author(s) and contributor(s) and not of MDPI and/or the editor(s). MDPI and/or the editor(s) disclaim responsibility for any injury to people or property resulting from any ideas, methods, instructions or products referred to in the content. |
© 2026 by the authors. Licensee MDPI, Basel, Switzerland. This article is an open access article distributed under the terms and conditions of the Creative Commons Attribution (CC BY) license (http://creativecommons.org/licenses/by/4.0/).
Copyright: This open access article is published under a Creative Commons CC BY 4.0 license, which permit the free download, distribution, and reuse, provided that the author and preprint are cited in any reuse.


