

Submitted:
08 June 2026
Posted:
10 June 2026
You are already at the latest version
Abstract
Biomechanical theory and coaching heuristics suggest contact depth meaningfully constrains swing mechanics and batted ball outcomes. Our purpose was to examine the relationship between contact depth and key hitting metrics during live collegiate competition. Markerless motion capture and ball tracking data were collected during live NCAA Division I games from 2,779 batted balls from 239 hitters. Outcomes included contact depth, exit velocity, maximum swing speed, swing speed at contact, and vertical and horizontal attack angles. Regressions assessed relationships with velocity and swing speed variables, while partial least squares regression evaluated attack angles. Mean contact depth was 20.1±7.2 inches in front of the hitter’s center of mass. Contact depth weakly explained exit velocity (r²=0.04,p< 0.001) but significantly predicted maximum swing speed (r²=0.20 p< 0.001). No meaningful relationship was observed with swing speed at ball contact (r²=0.01,p>0.01). Contact depth showed a strong association with the combined structure of vertical and horizontal attack angles, with the primary PLS component explaining 80.0% of contact depth variance. Contact depth influences swing mechanics and attack angles and is associated with peak, but not contact, bat speed. These findings highlight contact depth as a critical covariate for interpreting swing metrics and designing biomechanical assessments, analytic models, and on-field interventions.
Keywords:
baseball
; in-game
; motion capture
; swing metrics
1. Introduction
Over the past decade, baseball analytics has undergone a rapid evolution driven by advances in tracking technology and the availability of detailed performance data. Metrics such as exit velocity, launch angle, and spray angle are now routinely used to evaluate hitters, forecast future performance, and inform pitching strategy. At the professional level, these variables underpin widely used constructs such as expected weighted on-base average (xwOBA) and are increasingly adopted at the collegiate level as tracking infrastructure expands. For pitchers and analysts, understanding the mechanics behind how hitters generate these outcomes is critical for developing tailored approach strategies. Additionally, for hitters, monitoring these metrics supports progress tracking and player development initiatives.
Despite these advancements, several aspects of the batting process that plausibly influence batted-ball outcomes remain underexplored in public and academic domains. One such factor is contact depth, the longitudinal location along the hitter-pitcher axis at which ball contact occurs relative to the hitter’s body. From a biomechanical perspective, contact depth is theoretically linked to swing plane orientation, bat speed generation, and the resulting direction and quality of the batted ball. The curvilinear path of the swing would result in contact depth farther in front of the plate displaying increased attack angle and a more pull-side oriented horizontal attack angle. Further, as the axis of rotation of the bat travels distally from the body during the swing, the bat head would have greater linear velocity. From a practicality standpoint, the swing is likely most powerful around a given radius, so the hitter will alter swing mechanics to hit the ball where the pitch intersects this swing radius [1,2]. Practitioners and coaches frequently reference concepts such as “catching the ball out front” or “letting the ball travel,” yet these ideas are rarely quantified in large-scale datasets and are largely absent from the peer-reviewed literature.
The limited experimental work that does exist suggests that contact location may influence swing mechanics and performance outcomes. For example, Misaki et al. demonstrated that contact made closer to the ground on a batting tee was associated with reduced contact precision and lower vertical attack angles, implying a mechanical constraint imposed by the contact location[3]. Similarly, Nakashima et al. showed that variations in bat path influence the timing error tolerance of the swings (how mistimed the swing can be and still result in ball contact), indirectly implicating contact depth as a critical determinant of successful ball contact[4]. For both tee and machine batting, horizontal and vertical contact location both influenced contact depth[1,2]. However, these studies did not study directly quantified contact depth during live pitching conditions, nor did they examine its relationship with modern bat path metrics or exit velocity.
Importantly, contact depth is typically not available in most commercial datasets, which limits its application in advanced baseball analytics. As a result, analysts either infer its effects indirectly through launch angle, spray angle, or batted-ball distributions, or they interpret other bat path metrics without considering contact depth. This omission is notable, as contact depth may explain observed variability in these commonly reported metrics.
Therefore, the purpose of this study was to explore the relationship between contact depth and several key hitting variables: exit velocity, maximum swing speed, swing speed at ball contact, vertical attack angle, and horizontal attack angle. Using in-stadium markerless motion capture and radar-based ball tracking data collected during live National College Athletic Association (NCAA) Division I competition, this investigation aims to provide one of the first large-scale, in-game analyses of contact depth and its biomechanical and performance correlates.
2. Materials and Methods
2.1. Human Subjects and Ethical Approval
The study received exempt approval from our Institutional Review Board (protocol 23-218 EX 2304).
2.2. Experimental Design
Kinematic, bat, and ball tracking data were collected from 239 NCAA Division I hitters over the course of the 2024 and 2025 collegiate baseball seasons. Data were obtained during live game competition using a combination of fixed, in-stadium KinaTrax markerless motion capture cameras (300Hz) and TrackMan™ radar technology. A total of 2,779 batted balls put into the field of play were included in the analysis. Bunts and check swings were excluded due to their fundamentally different mechanical intent and execution. Only swings that resulted in fair or foul balls in play were retained, ensuring that all observations reflected meaningful ball contact under game conditions.
Contact depth was operationally defined as the linear distance, in inches, between the hitter’s center of mass (COM) and the location of ball contact along the axis from home plate toward the pitcher’s mound (Figure 1). Positive values indicated contact occurring in front of the hitter’s COM, whereas negative values indicated contact occurring behind the COM (deeper in the hitting zone). The hitter’s COM was estimated using the full-body kinematic model generated by the KinaTrax system. Ball contact location was derived from synchronized bat and ball tracking data, allowing for precise spatial determination of the collision point in three-dimensional space. Contact depth was calculated for each batted ball as a scalar projection along the home plate–to–mound vector (distance of the ball along the first-third base axis was ignored).
Variables of interest were: 1) exit velocity in MPH, 2) maximum swing speed in MPH (80% of the distance from the knob to the cap) 3) swing speed at ball contact (80% of the distance from the knob to the cap) in MPH, 4) vertical attack angle in degrees, and 5) horizontal attack angle in degrees.
2.3. Statistical Analysis
Descriptive statistics were calculated for contact depth across all batted balls. To assess the relationship between contact depth and exit velocity, a quadratic linear regression model was employed. This approach was selected a priori to allow for potential non-linear relationships, as both excessively deep and excessively forward contact may plausibly reduce energy transfer efficiency. Simple linear regressions were used to evaluate the influence of contact depth on maximum swing speed and swing speed at ball contact. We were comfortable using linear regressions for these variables for predictive simplicity because we hypothesized the amount of ball contacts occurring substantially farther in front of the plate than max bat speed occurred would be minimal. Model assumptions were visually assessed via residuals. Vertical and horizontal attack angles were expected to exhibit substantial collinearity, as both are derived from the same bat velocity vector at contact. Therefore, partial least squares (PLS) regression was used to examine the relationship between contact depth and the combined structure of vertical and horizontal attack angles. The proportion of variance explained by each PLS component was calculated to assess the strength of association. Of note, we did not use any form of a multilevel model in these analyses because home team hitters from the host institution contributed most of the batted balls and visiting hitters had as few as one ball in play, which makes multilevel modeling infeasible. Our author group believes the relationship contact depth has with our variables of interest is consistent between hitters, which was visually assessed, and therefore accepting of the partial pooling limitation—the greater sample size from visiting hitters was worth the model limitation. All statistical analyses were conducted using R (Version 4.4.1) [5]. Data were imported using the readr package [6], visualized using ggplot2 [7], and analyzed using linear regression models implemented in base R (stats package) [5]. Partial least squares (PLS) regression was performed using the pls package [8]. Statistical significance was set a priori at p < 0.05 and a Benjamini-Hochburg correction was used to account for familywise error [9].
3. Results
Mean contact depth across all batted balls was 20.1 ± 7.2 inches in front of the hitter’s center of mass (Figure 2). The observed range of contact depth spanned from -4.3 inches (deep contact) to 47.9 inches (far out in front), indicating substantial variability in where hitters made contact relative to their bodies during live competition.
Quadratic regression analysis revealed that contact depth weakly explained variance in exit velocity (r² = 0.04, p < 0.001). Although the overall model was statistically significant, inspection of residuals demonstrated an asymmetric distribution, with positive residuals clustering above the mean exit velocity (Figure 3). Contact depth significantly predicted maximum swing speed (β = 0.29, r² = 0.20, p < 0.001), indicating that swings associated with more forward contact tended to achieve higher peak bat speeds (Figure 4). In contrast, contact depth had no meaningful influence on swing speed at ball contact (β = 0.08, r² = 0.01, p > 0.01) (Figure 5). Partial least squares regression confirmed strong covariance between vertical and horizontal attack angles. The first PLS component explained 68.7% of the shared variance between these two angles. Importantly, this first component also explained 80.0% of the variance in contact depth, indicating a very strong relationship between contact depth and the combined structure of attack angles.
4. Discussion
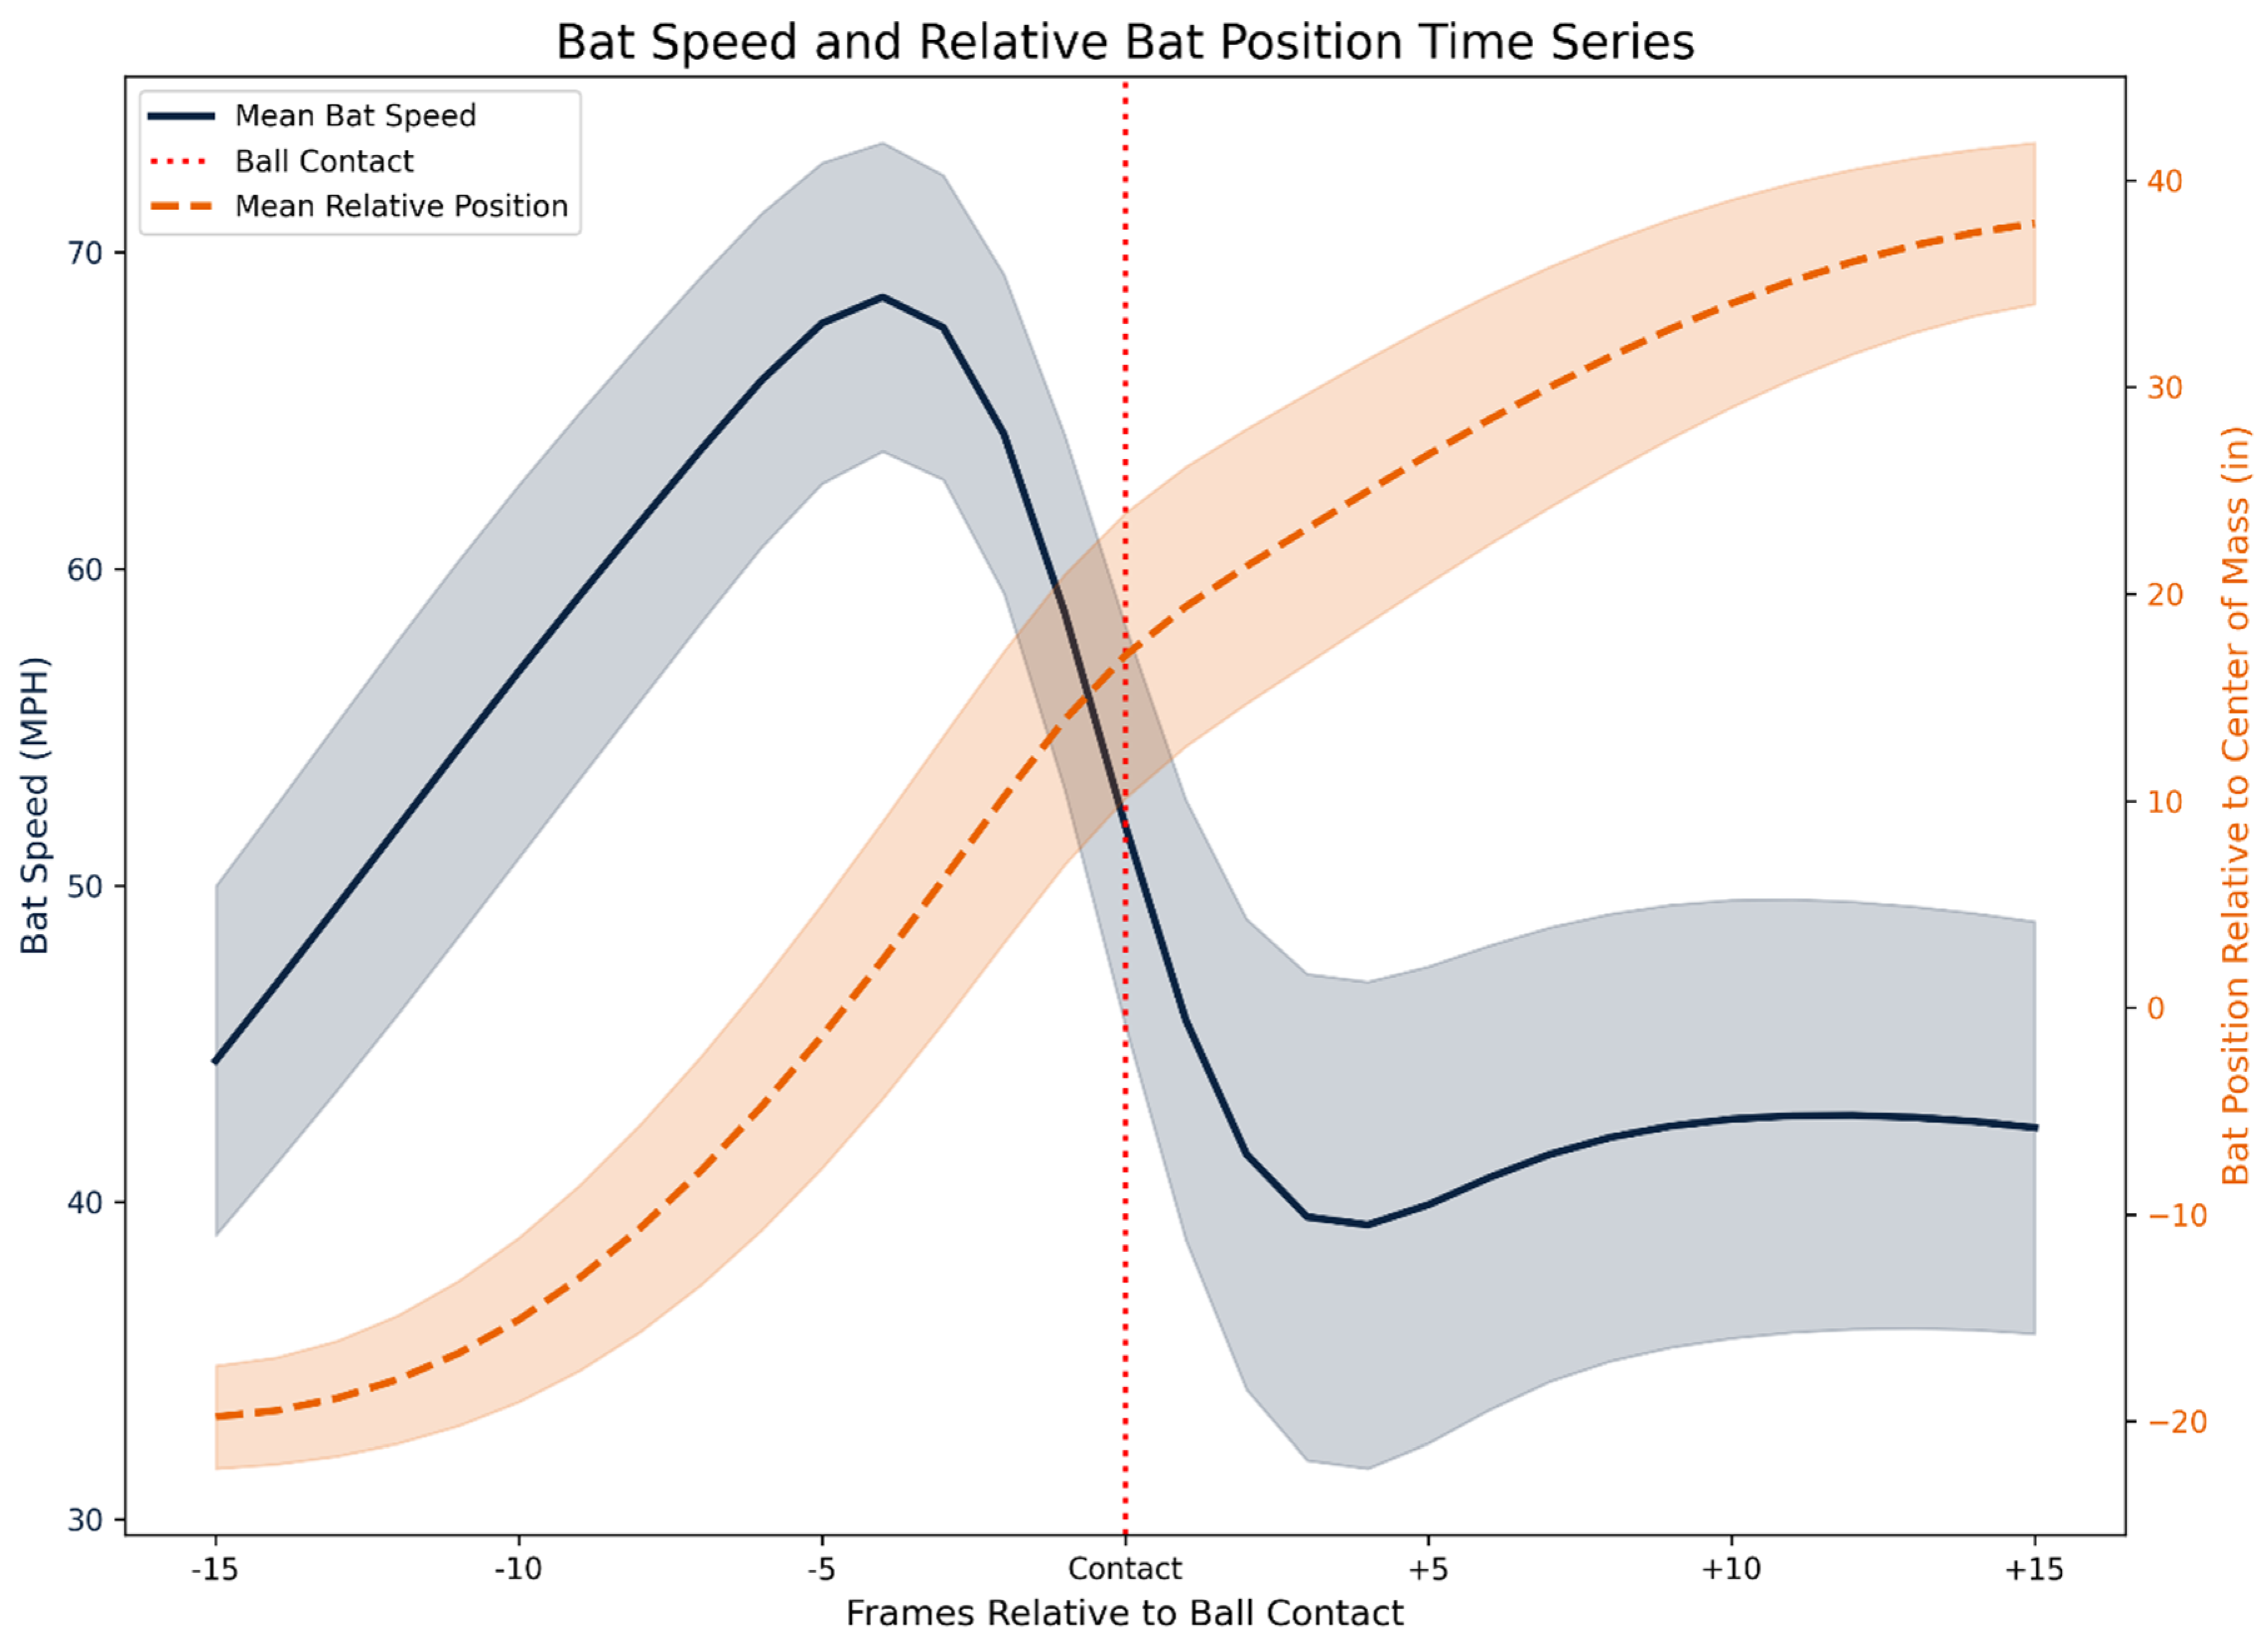
The purpose of this study was to explore the relationship of contact depth on several key hitting variables commonly tracked as performance metrics or used for intervention purposes. We determined that contact depth influences exit velocity, maximum bat speed, horizontal and vertical attack angles, but a much weaker predictor of bat speed at ball contact. The typical profile for bat speed results from the distally progressing axis of rotation of the bat in the kinetic chain. Therefore, a notable, localized spike in bat speed occurs slightly in front of the hitter’s COM when contact is anticipated (Figure 6). Although hitters modify their swings to achieve different contact locations, we hypothesize that the variability in contact depth (Figure 2) exceeds the typical swing variability for different pitch locations[1,4], which may explain the substantial impact of contact depth on swing metrics observed in this study. While exit velocity was only weakly associated with contact depth (Figure 3), there is an abnormal cluster of residuals around the average contact depth. This pattern suggests that while contact depth alone has limited explanatory power in a traditional organized least squares analysis, certain contact depths may permit disproportionately high exit velocities under favorable swing conditions. A more refined analysis, such as cluster analysis to identify optimal contact depth ranges, could provide better insight. Additionally, our analysis did not incorporate ball flight metrics; refining the analysis by limiting spray and launch angle ranges could intensify the clustering of high exit velocities within specific contact depths. Combining ball flight data with exit velocity metrics could further identify optimal contact depths for maximizing exit velocity.
Our most noteworthy findings of this research is the observed relationship between contact depth and max bat speed coupled with the weak relationship between contact depth and bat speed at ball contact. Bat speed has gained tremendous popularity since Statcast began releasing bat speed data a few years ago[10]. On average, there is a clear positive relationship between a player’s average bat speed and meaningful offensive statistics[10]. Publicly reported bat speed metrics are reported at contact (or when contact would have occurred on a swing and miss). This dissociation suggests that while hitters may generate higher peak speeds when contacting the ball farther in front, the bat speed at the moment of collision is relatively conserved across contact depths at a population level. Whether hitters can hit the ball farther out in front to increase bat speed at contact as a within-hitter adjustment still needs to be analyzed with a larger sample than the present study. For biomechanists conducting laboratory assessments, these findings are important for generalizability to a game setting. In a lab setting, off a tee or typical pitching machine, hitters can plan their contact depth without the reaction challenges of an in game setting. Therefore, when positioning a tee, or allowing a hitter to preselect a spray angle to the best of their ability, contact depth may influence lab-measured bat speed while not being indicative of in-game bat speed at ball contact. The relationship of when peak bat speed occurs relative to contact remains an area for future study.
Another important finding is that contact depth has a strong influence on both horizontal and vertical attack angles. Although this seems intuitive from the parabolic shape of the swing, many attack plans or swing interventions use vertical attack angle at contact as a metric representative of their swing. While there is very likely signal to the discrete metric, controlling for contact depth is likely to reduce noise and residual variance in models analyzing swing path. We should note that while contact depth is clearly a covariate in attack angles, the causal arrow may be bidirectional as hitters purposefully allow the ball to travel deeper into the zone to hit the ball to the opposite field along with hitters being beat by a fastball/out in front of an off speed pitch. These findings demonstrate that contact depth is tightly coupled with the orientation of the bat at contact, reinforcing the notion that where the hitter contacts the ball substantially constrains the resulting bat path and batted-ball direction. Only looking at swing angles without contextualizing contact depth is problematic.
For analysts/sport scientists, these insights carry several implications. First, contact depth should be incorporated as a covariate in models analyzing swing biomechanics. Second, when creating attack plans for pitchers, understanding how contact depth and attack angles, rather than only using the discrete vertical attack angle provides a more comprehensive picture of swing shape. For example, a hitter that hits to the opposite field often may have a much lower vertical attack angle, which may indicate vulnerability to low breaking balls. However, if the hitter only has a shallow attack angle due to a deeper contact point, their swing path may not be flatter than the average hitter, resulting in a flawed plan. Last, analysts should continue to scrutinize the concept of an “optimal contact depth” zone. This can be optimized by an individual hitter’s biomechanics and how this corresponds to proper swing decisions based on the hitter’s swing profile in that optimal contact depth zone.
For coaches and player development staff, they should be aware that looking at an attack angle may not provide a complete picture of the hitter’s swing. Coaches more familiar with biomechanics and swing metrics should blend contact point data with swing profile data. Coaches with less biomechanics training should blend simple swing profile data with their knowledge of a hitter’s tendencies/hitting approach to contextualize why a hitter may be succeeding or struggling with certain pitch types. Last, when intervening on a hitter’s swing to improve contact rates or batted ball profiles, these data suggest two primary routes: 1) intervening on a hitter’s swing biomechanics to alter the swing path, or 2) drilling to change a hitter’s typical contact point, which will change their recorded swing metrics without altering swing biomechanics.
This study should be interpreted with several limitations. First, as previously discussed, we did not account for the nested data structure because of the small cohort of home team players with many repeated measures, but the larger sample of hitters with very few samples that would have made a multilevel model difficult to interpret. We believe population level conclusions may be drawn, but this does limit our ability to interpret within hitter adjustments, which we hypothesize may explain some of the lack of relationship between contact depth and bat speed at ball contact. Second, for simplicity and interpretability by coaches and players, we kept this analysis to contact depth, rather than three-dimensional location of the contact point. There is likely a continuum of biomechanical compensations that occur in each cardinal plane that are driven by the distance the contact point is away from the hitter’s body COM, rather than just depth. Last, we remind the reader that motion technology is quickly improving, but there is measurement error in motion capture data, introducing noise into our models.
Author Contributions
Kevin Giordano: Conceptualization, data curation, formal analysis, investigation, methodology, supervision, visualization, writing—original draft, writing—review & editing; Ian Jump: Data curation, project administration, writing—review & editing. Ben Lerch: data curation: project administration, visualization, writing—review & editing; Gretchen Oliver: Resources, supervision, writing—review & editing.
Data Availability Statement
Due to proprietary collection sources, data are not publicly available from this study. However, analysis source code is available upon request of the corresponding author.
Ethical Approval Statement
The study received exempt approval from our Institutional Review Board (protocol 23-218 EX 2304).
Disclosure Statement
The authors have no conflict of interest and nothing to disclose.
References
- Ino, T.; Katsumata, H. Temporal Coordination Strategies in Baseball Hitting: Insights from Stationary vs. Oncoming Ball Analysis. Int. J. Kinesiol. Sports Sci. 2024, 12(no. 2), 68. [Google Scholar] [CrossRef]
- Katsumata, H.; Himi, K.; Ino, T.; Ogawa, K.; Matsumoto, T. Coordination of hitting movement revealed in baseball tee-batting. J. Sports Sci. 2017, 35(no. 24), 2468–2480. [Google Scholar] [CrossRef] [PubMed]
- Misaki, J.; Higuchi, T.; Tsuchikane, R.; Saeki, H.; Isaka, T. Hitting Kinematics for Precise Ball-Bat Contact in Collegiate Baseball Hitters. International Congr. Sport Sci. Res. Technol. Support. 2016, 1, SCITEPRESS. [Google Scholar]
- Nakashima, H.; Horiuchi, G.; Kimura, A.; Sakurai, S. Acceptable range of timing error at bat-ball impact in baseball depends on the bat swing path. Front. Sports Act. Living 2025, 7, 1557145. [Google Scholar] [CrossRef]
- R. C. Team. R: A language and environment for statistical computing; R Foundation for Statistical Computing: Vienna, Austria, 2016; Available online: http://www.R-project.org/.
- Wickham, H.; et al. Welcome to the Tidyverse. J. Open Source Softw. 2019, 4(no. 43), 1686. [Google Scholar] [CrossRef]
- Wickham, H. ggplot2. Wiley Interdiscip. Rev. Comput. Stat. 2011, 3(no. 2), 180–185. [Google Scholar] [CrossRef]
- Mevik, B.-H.; Wehrens, R. The pls package: principal component and partial least squares regression in R. J. Stat. Softw. 2007, 18, 1–23. [Google Scholar] [CrossRef]
- Benjamini, Y.; Hochberg, Y. Controlling the false discovery rate: a practical and powerful approach to multiple testing. J. R. Stat. Soc. Ser. B (Methodological) 1995, 57(no. 1), 289–300. [Google Scholar] [CrossRef]
- Baseball, M. L. Statcast bat tracking data. [Online]. Available online: https://baseballsavant.mlb.com/.
Figure 1.
Contact depth visual. Yellow line represents ball contact, red line represents center of mass location, distance between the two of them represents contact depth.
Figure 1.
Contact depth visual. Yellow line represents ball contact, red line represents center of mass location, distance between the two of them represents contact depth.
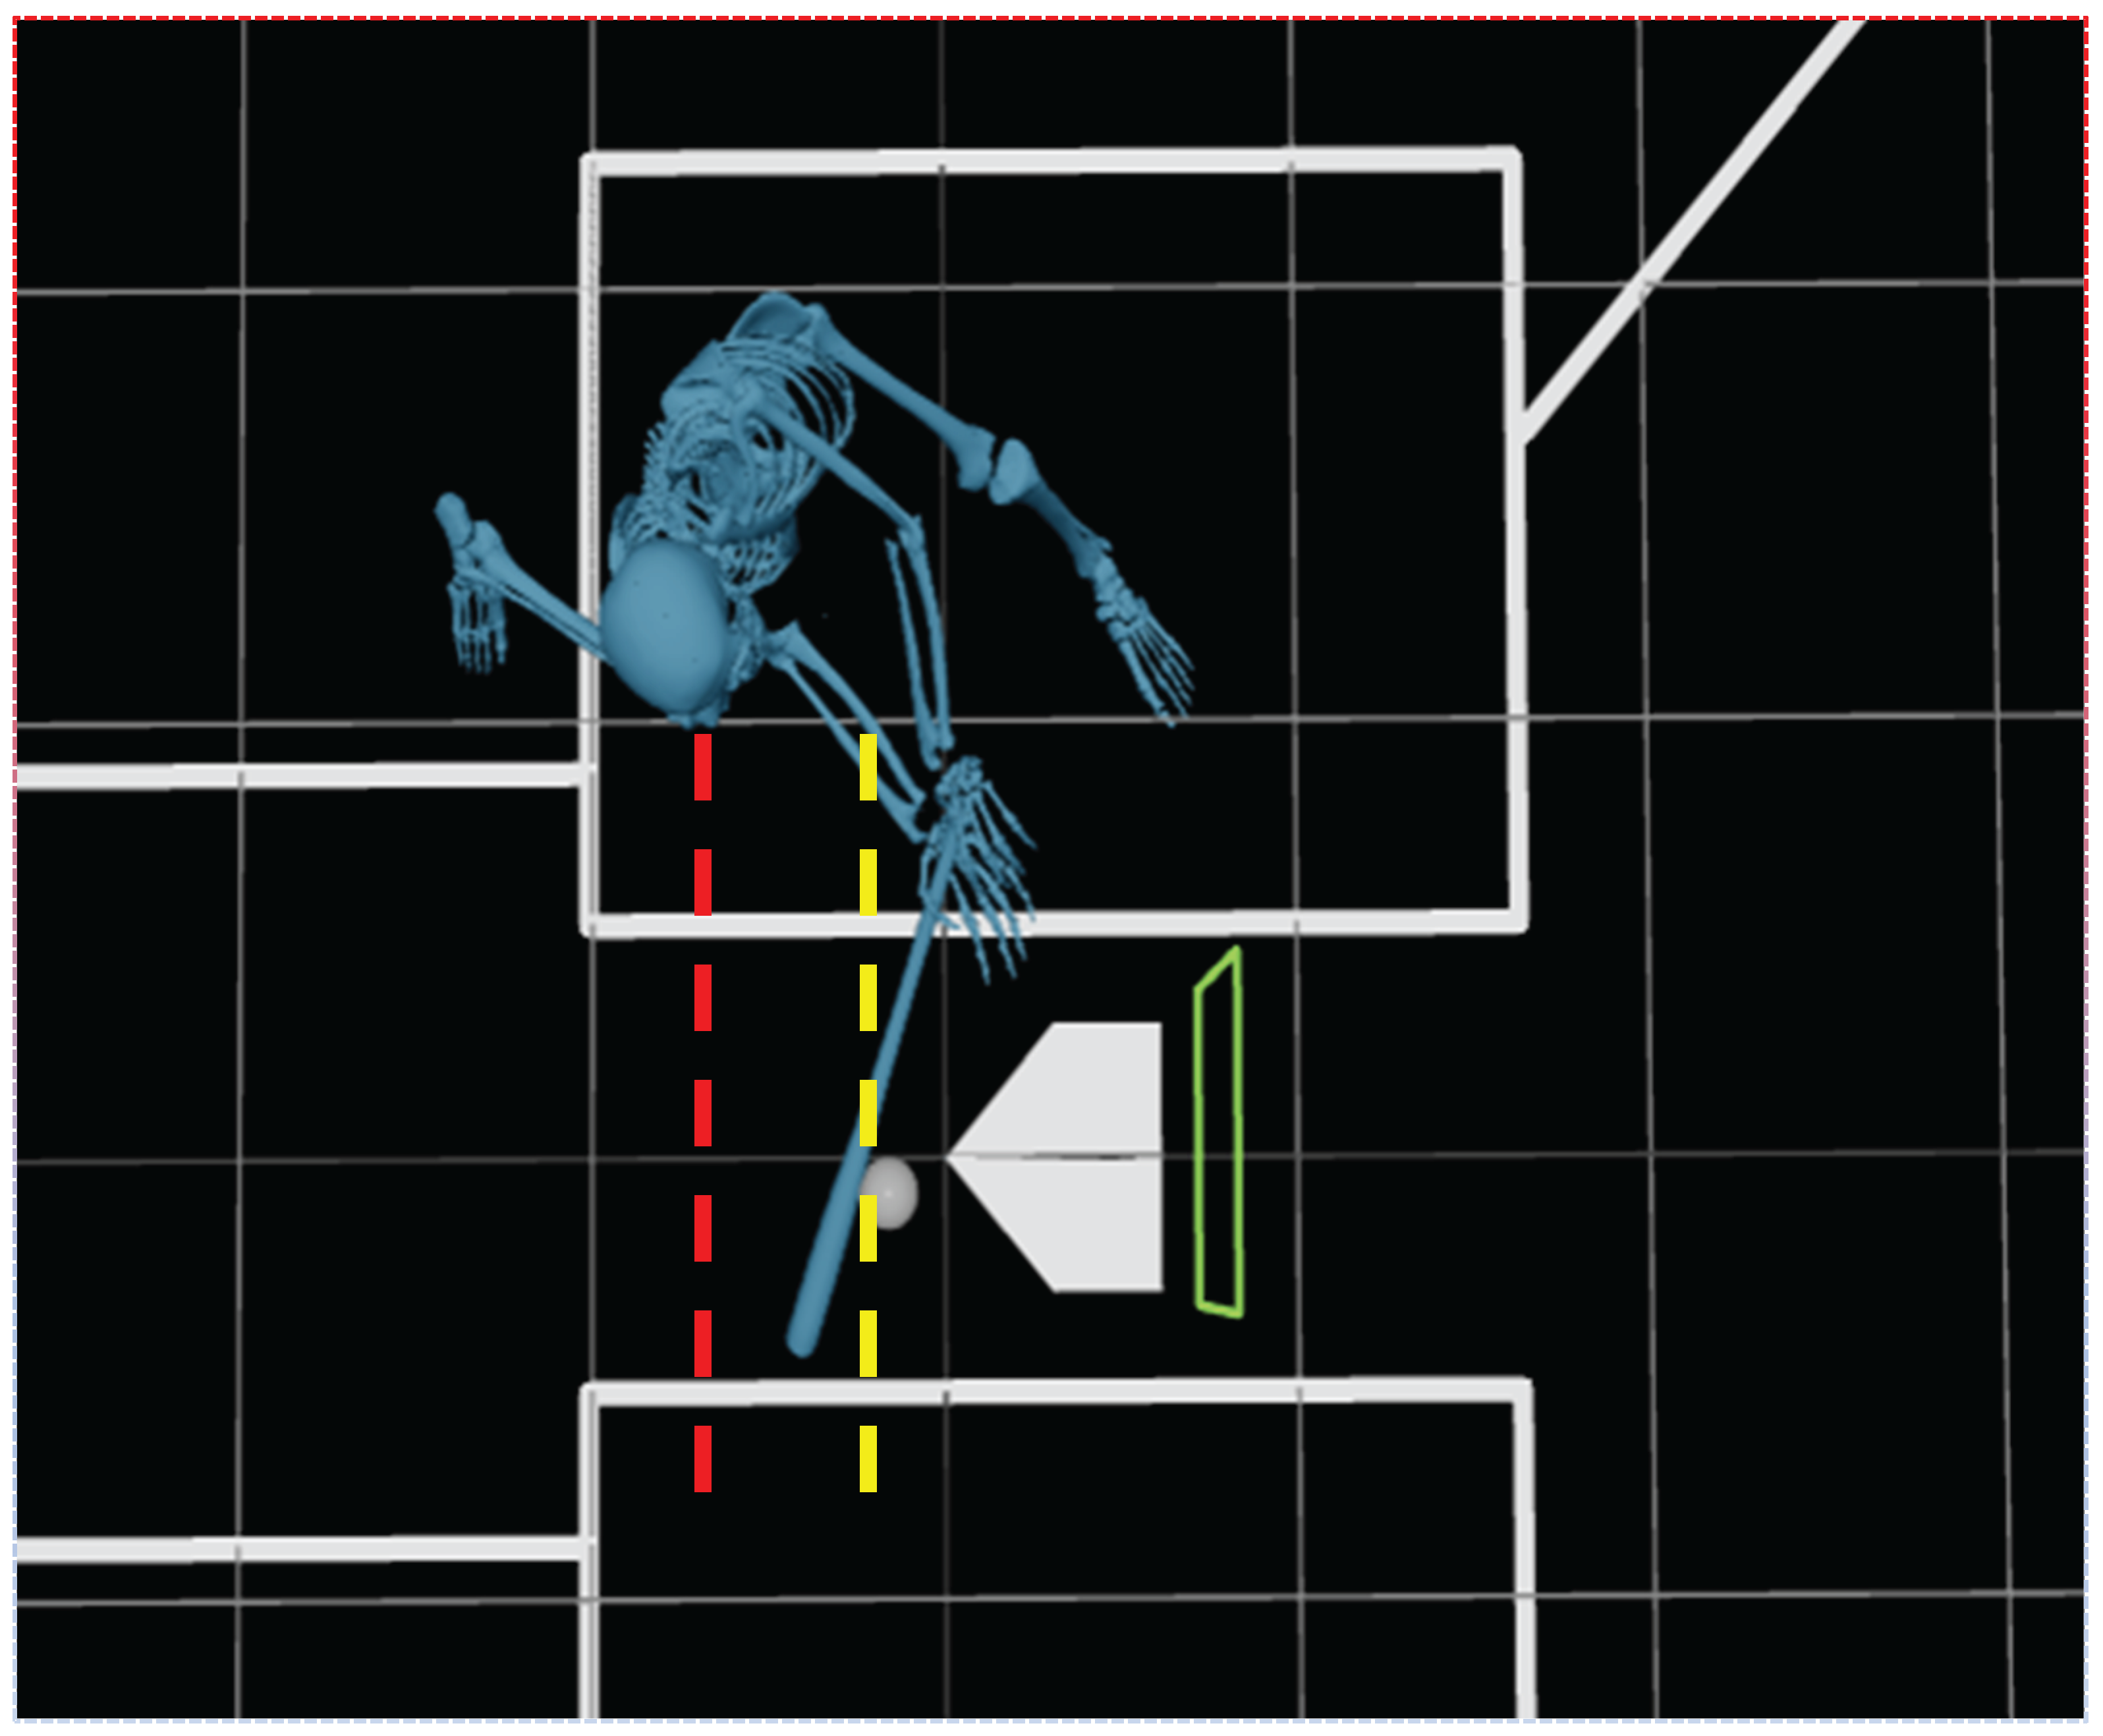
Figure 2.
Histogram of where ball contact occurs compared to body’s center of mass in the direction from home plate to the pitcher’s mound.
Figure 2.
Histogram of where ball contact occurs compared to body’s center of mass in the direction from home plate to the pitcher’s mound.
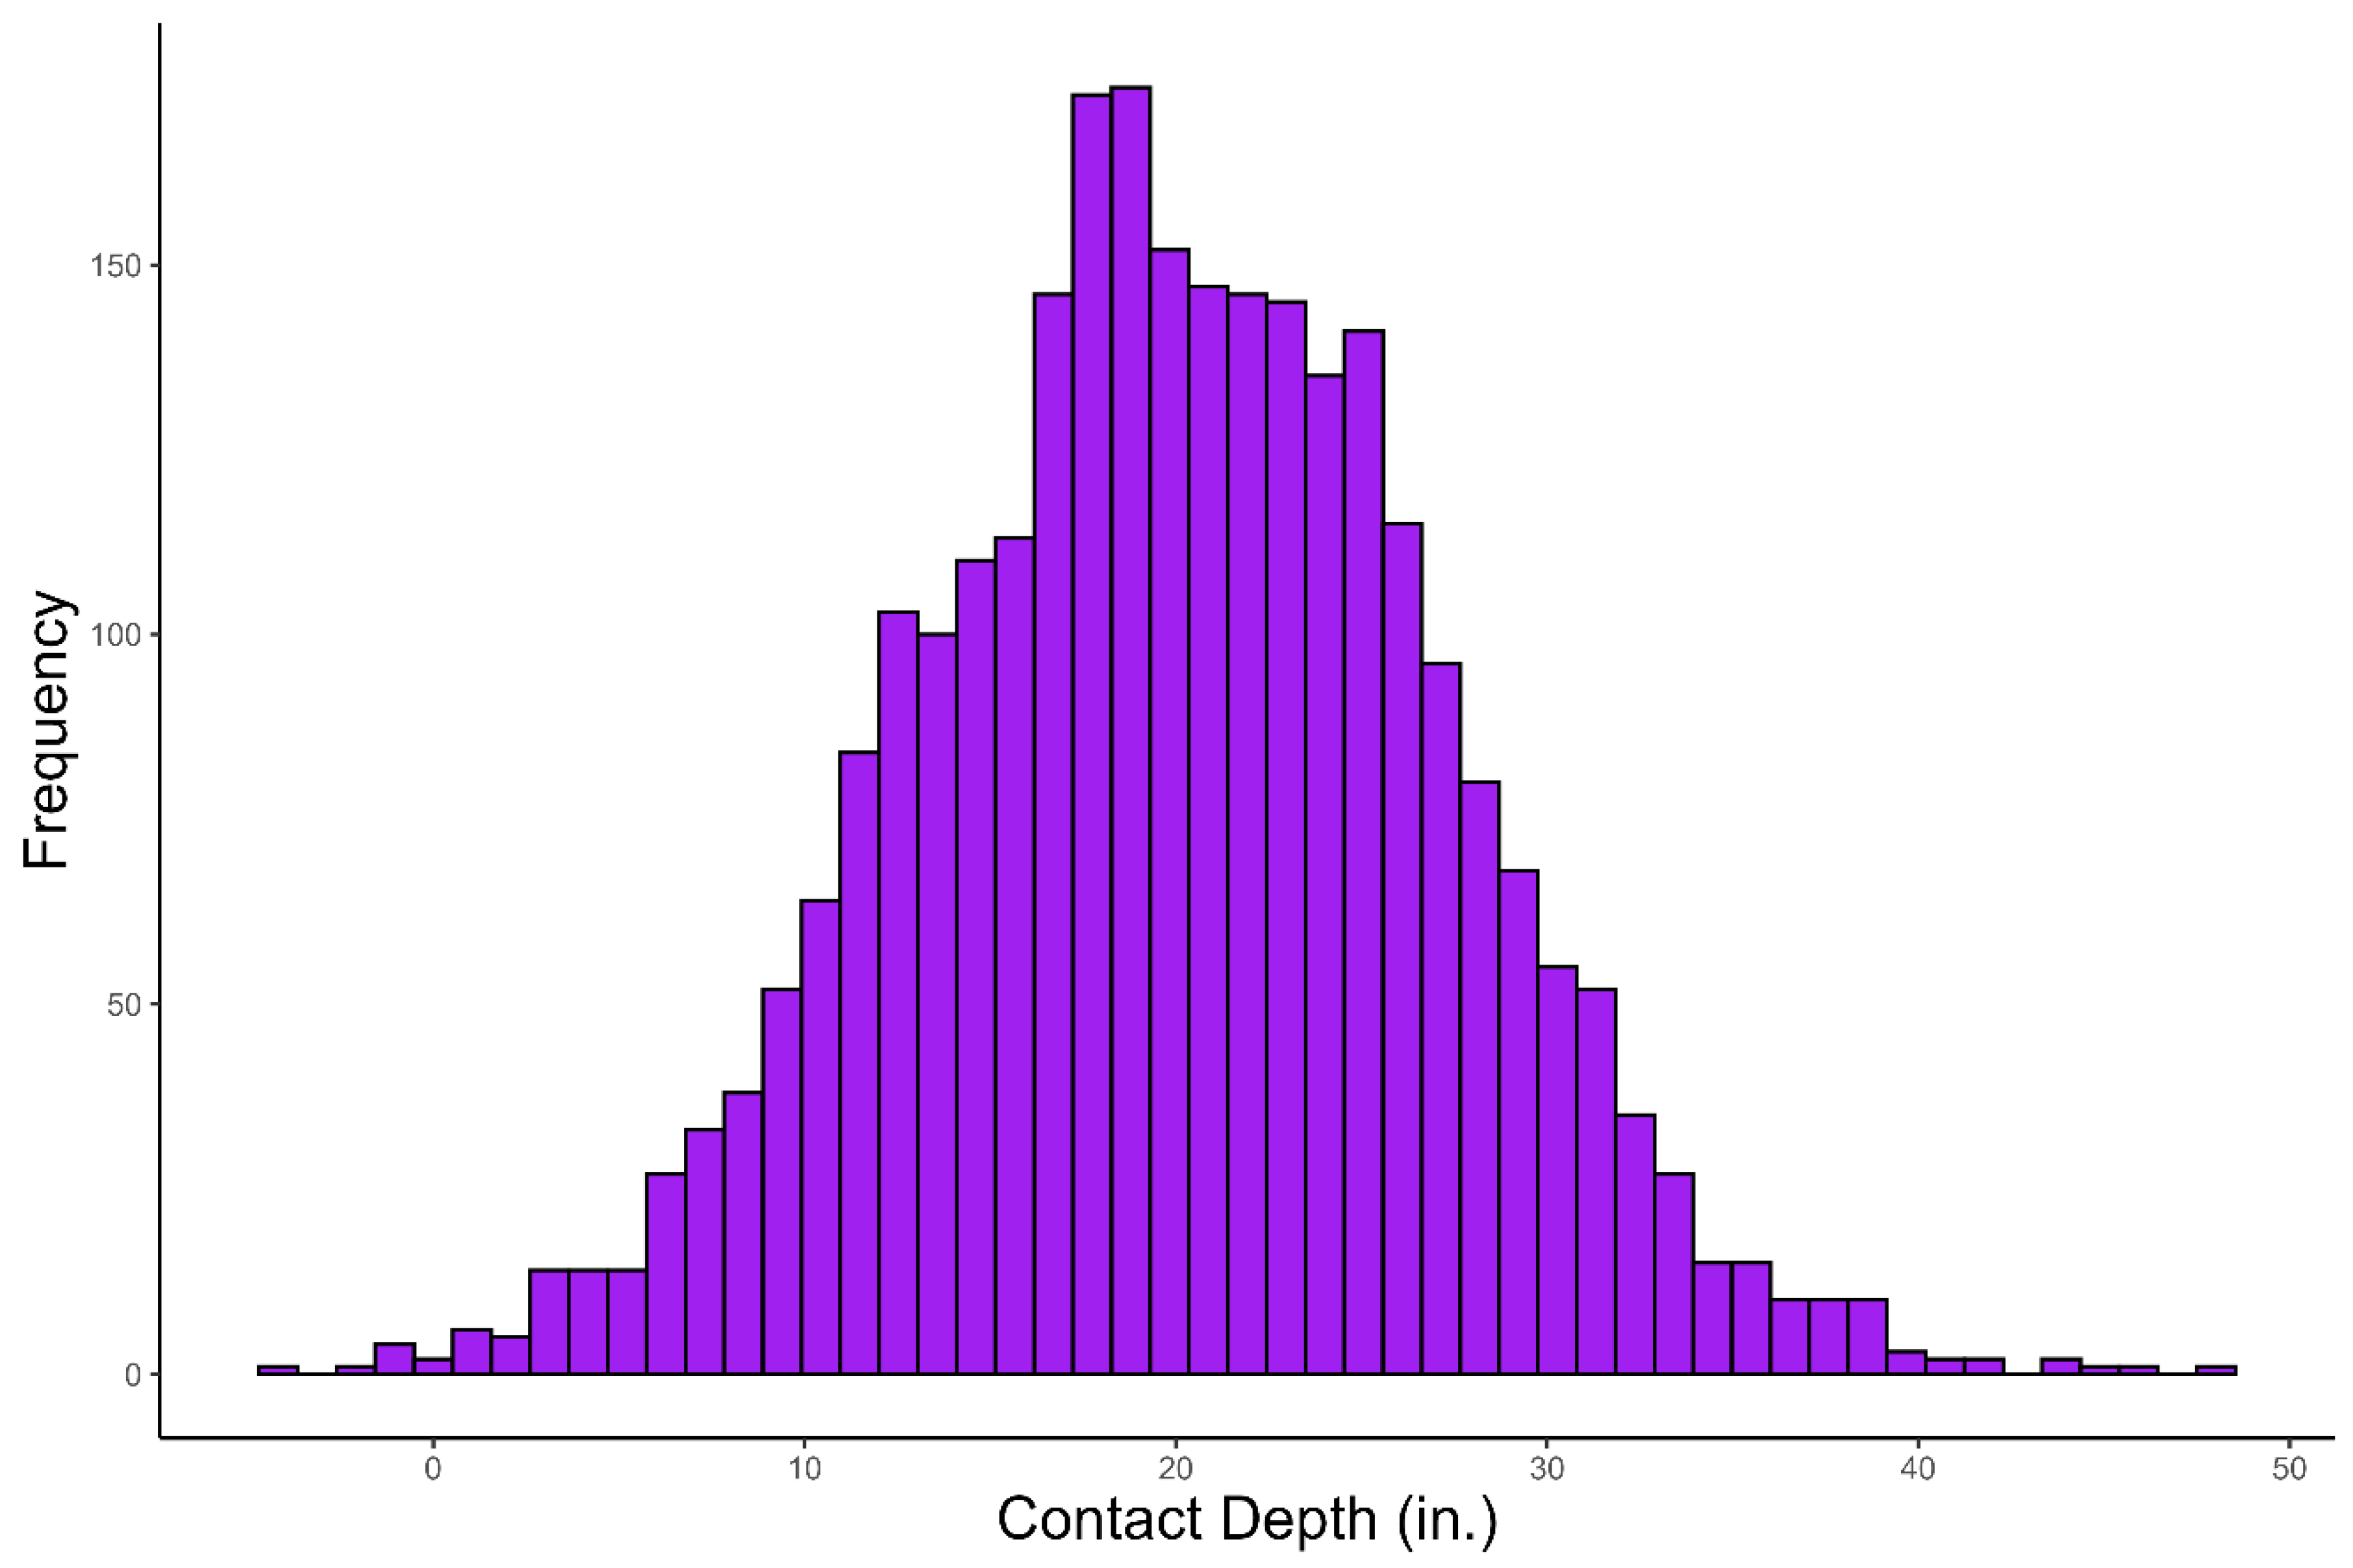
Figure 3.
Contact depth and exit velocity. Positive depth values indicate toward the pitcher.
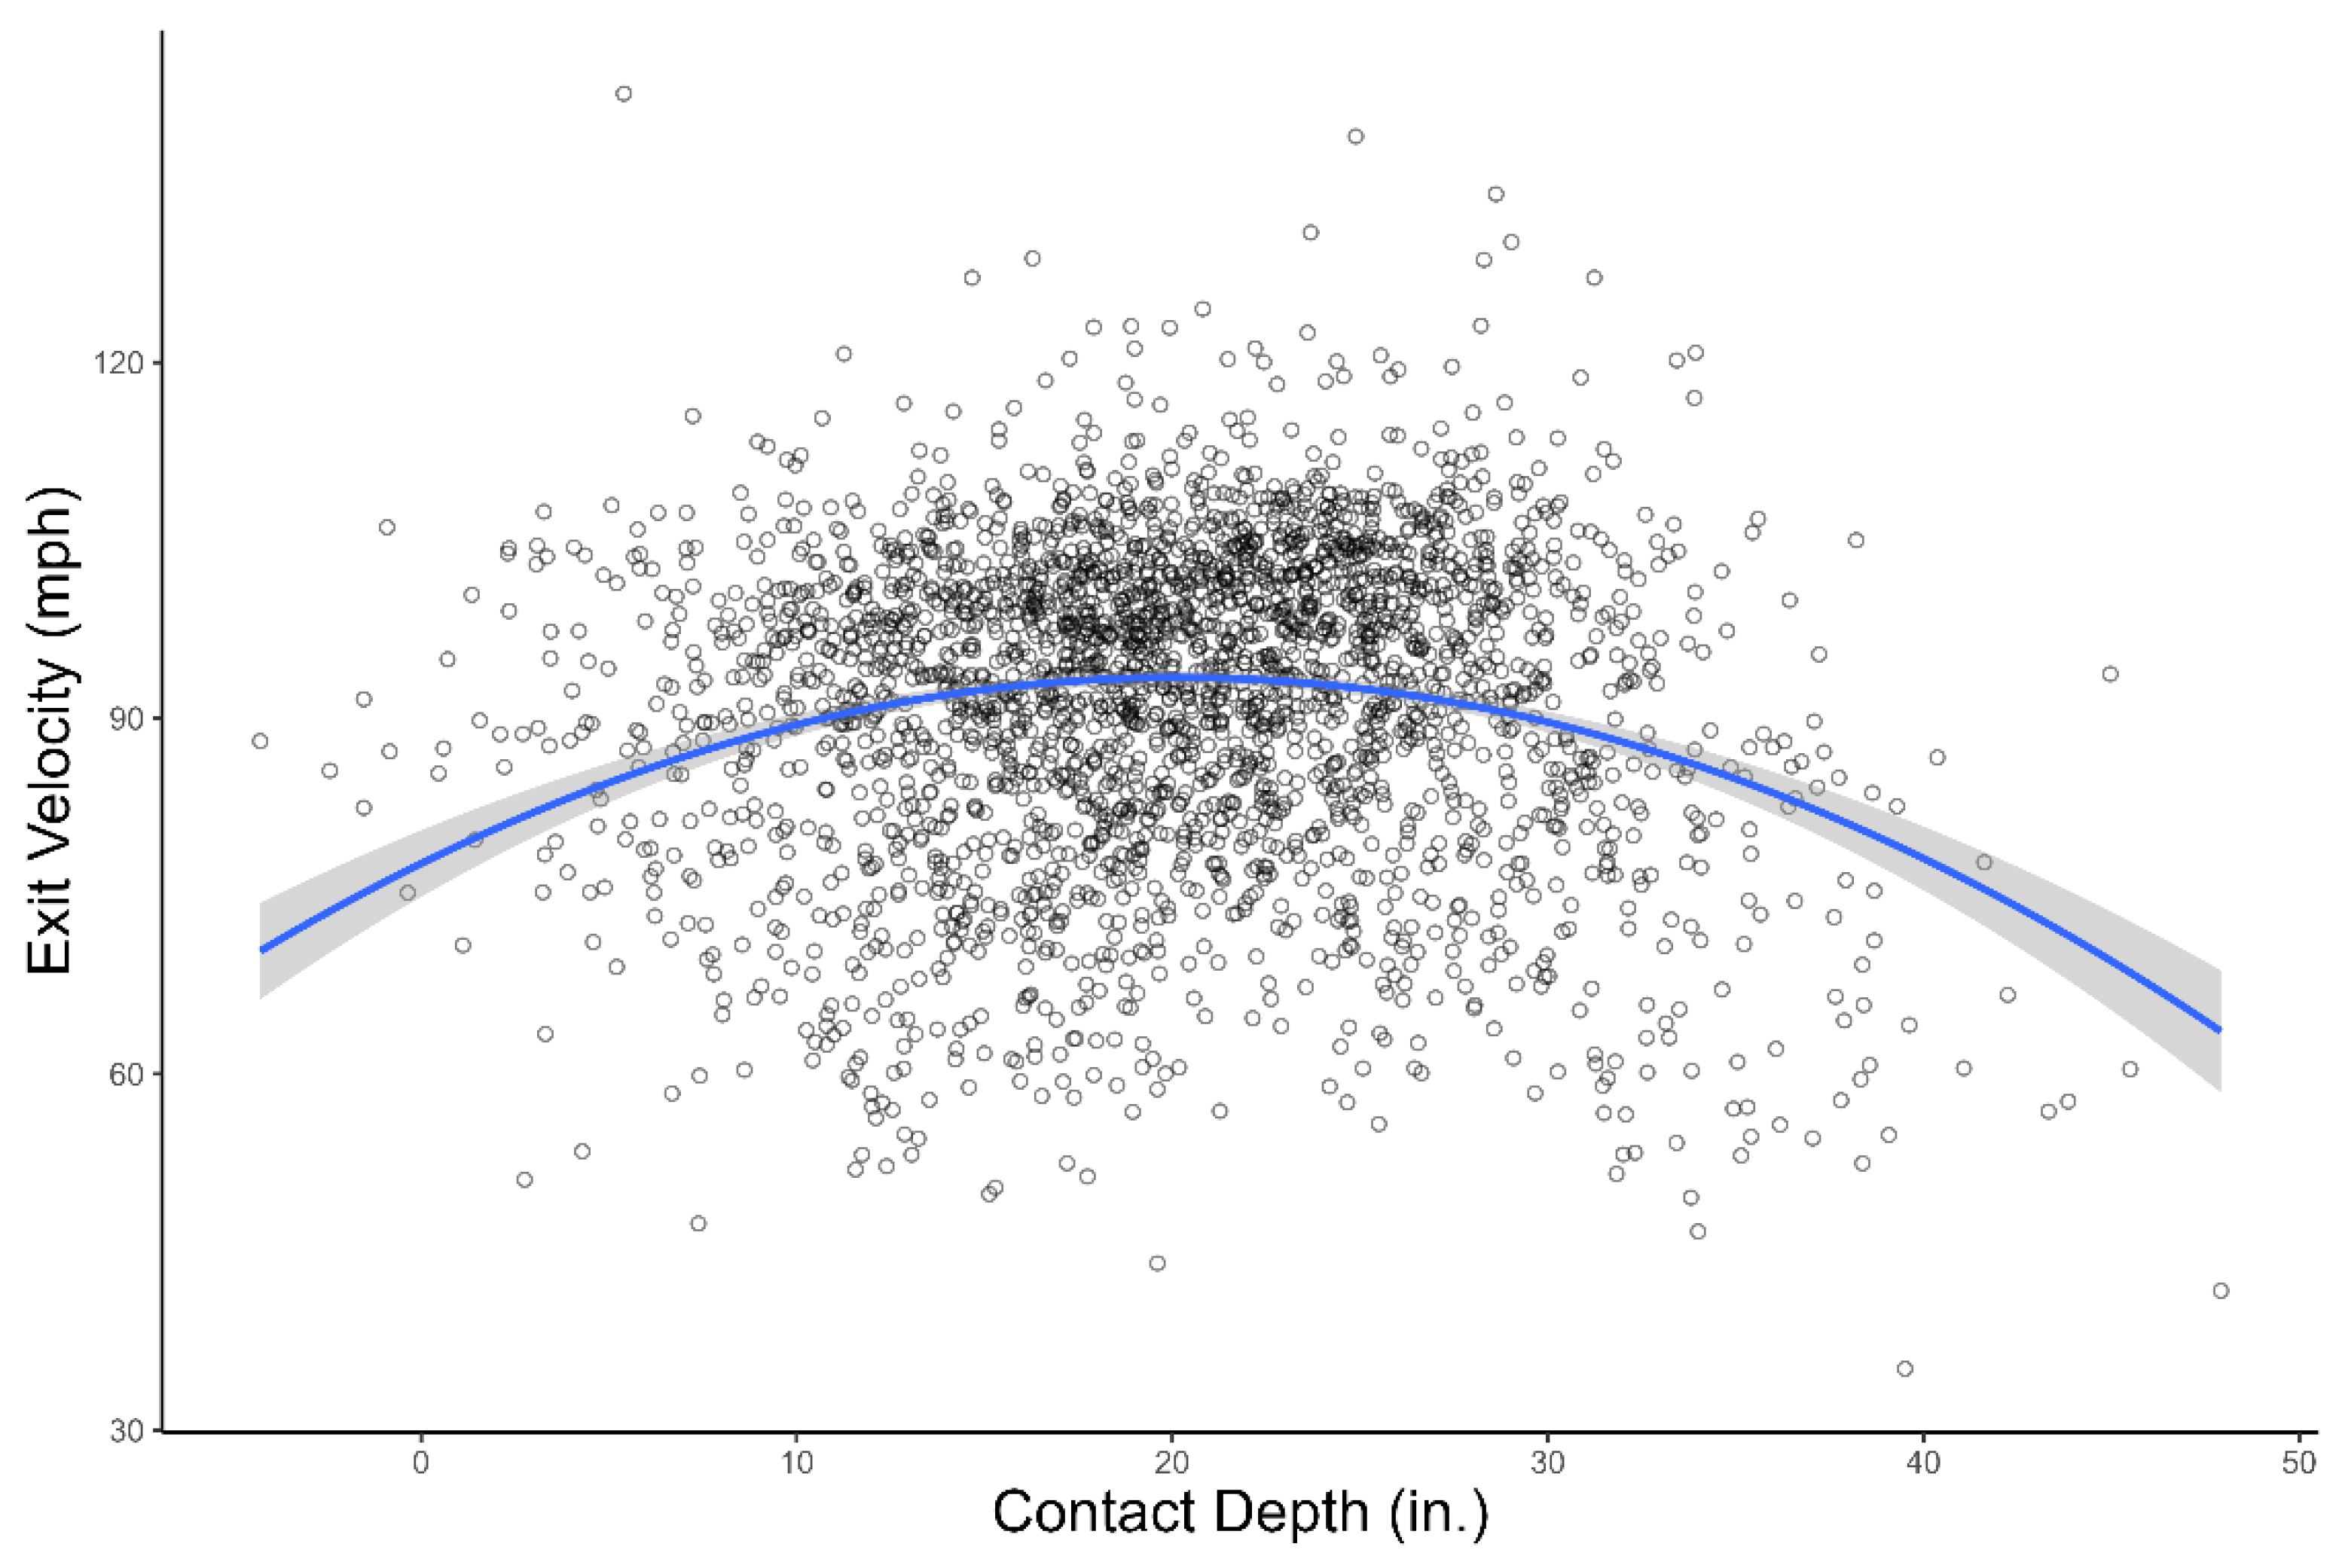
Figure 4.
Contact depth and maximum bat speed during the swing. Positive depth values indicate toward the pitcher.
Figure 4.
Contact depth and maximum bat speed during the swing. Positive depth values indicate toward the pitcher.
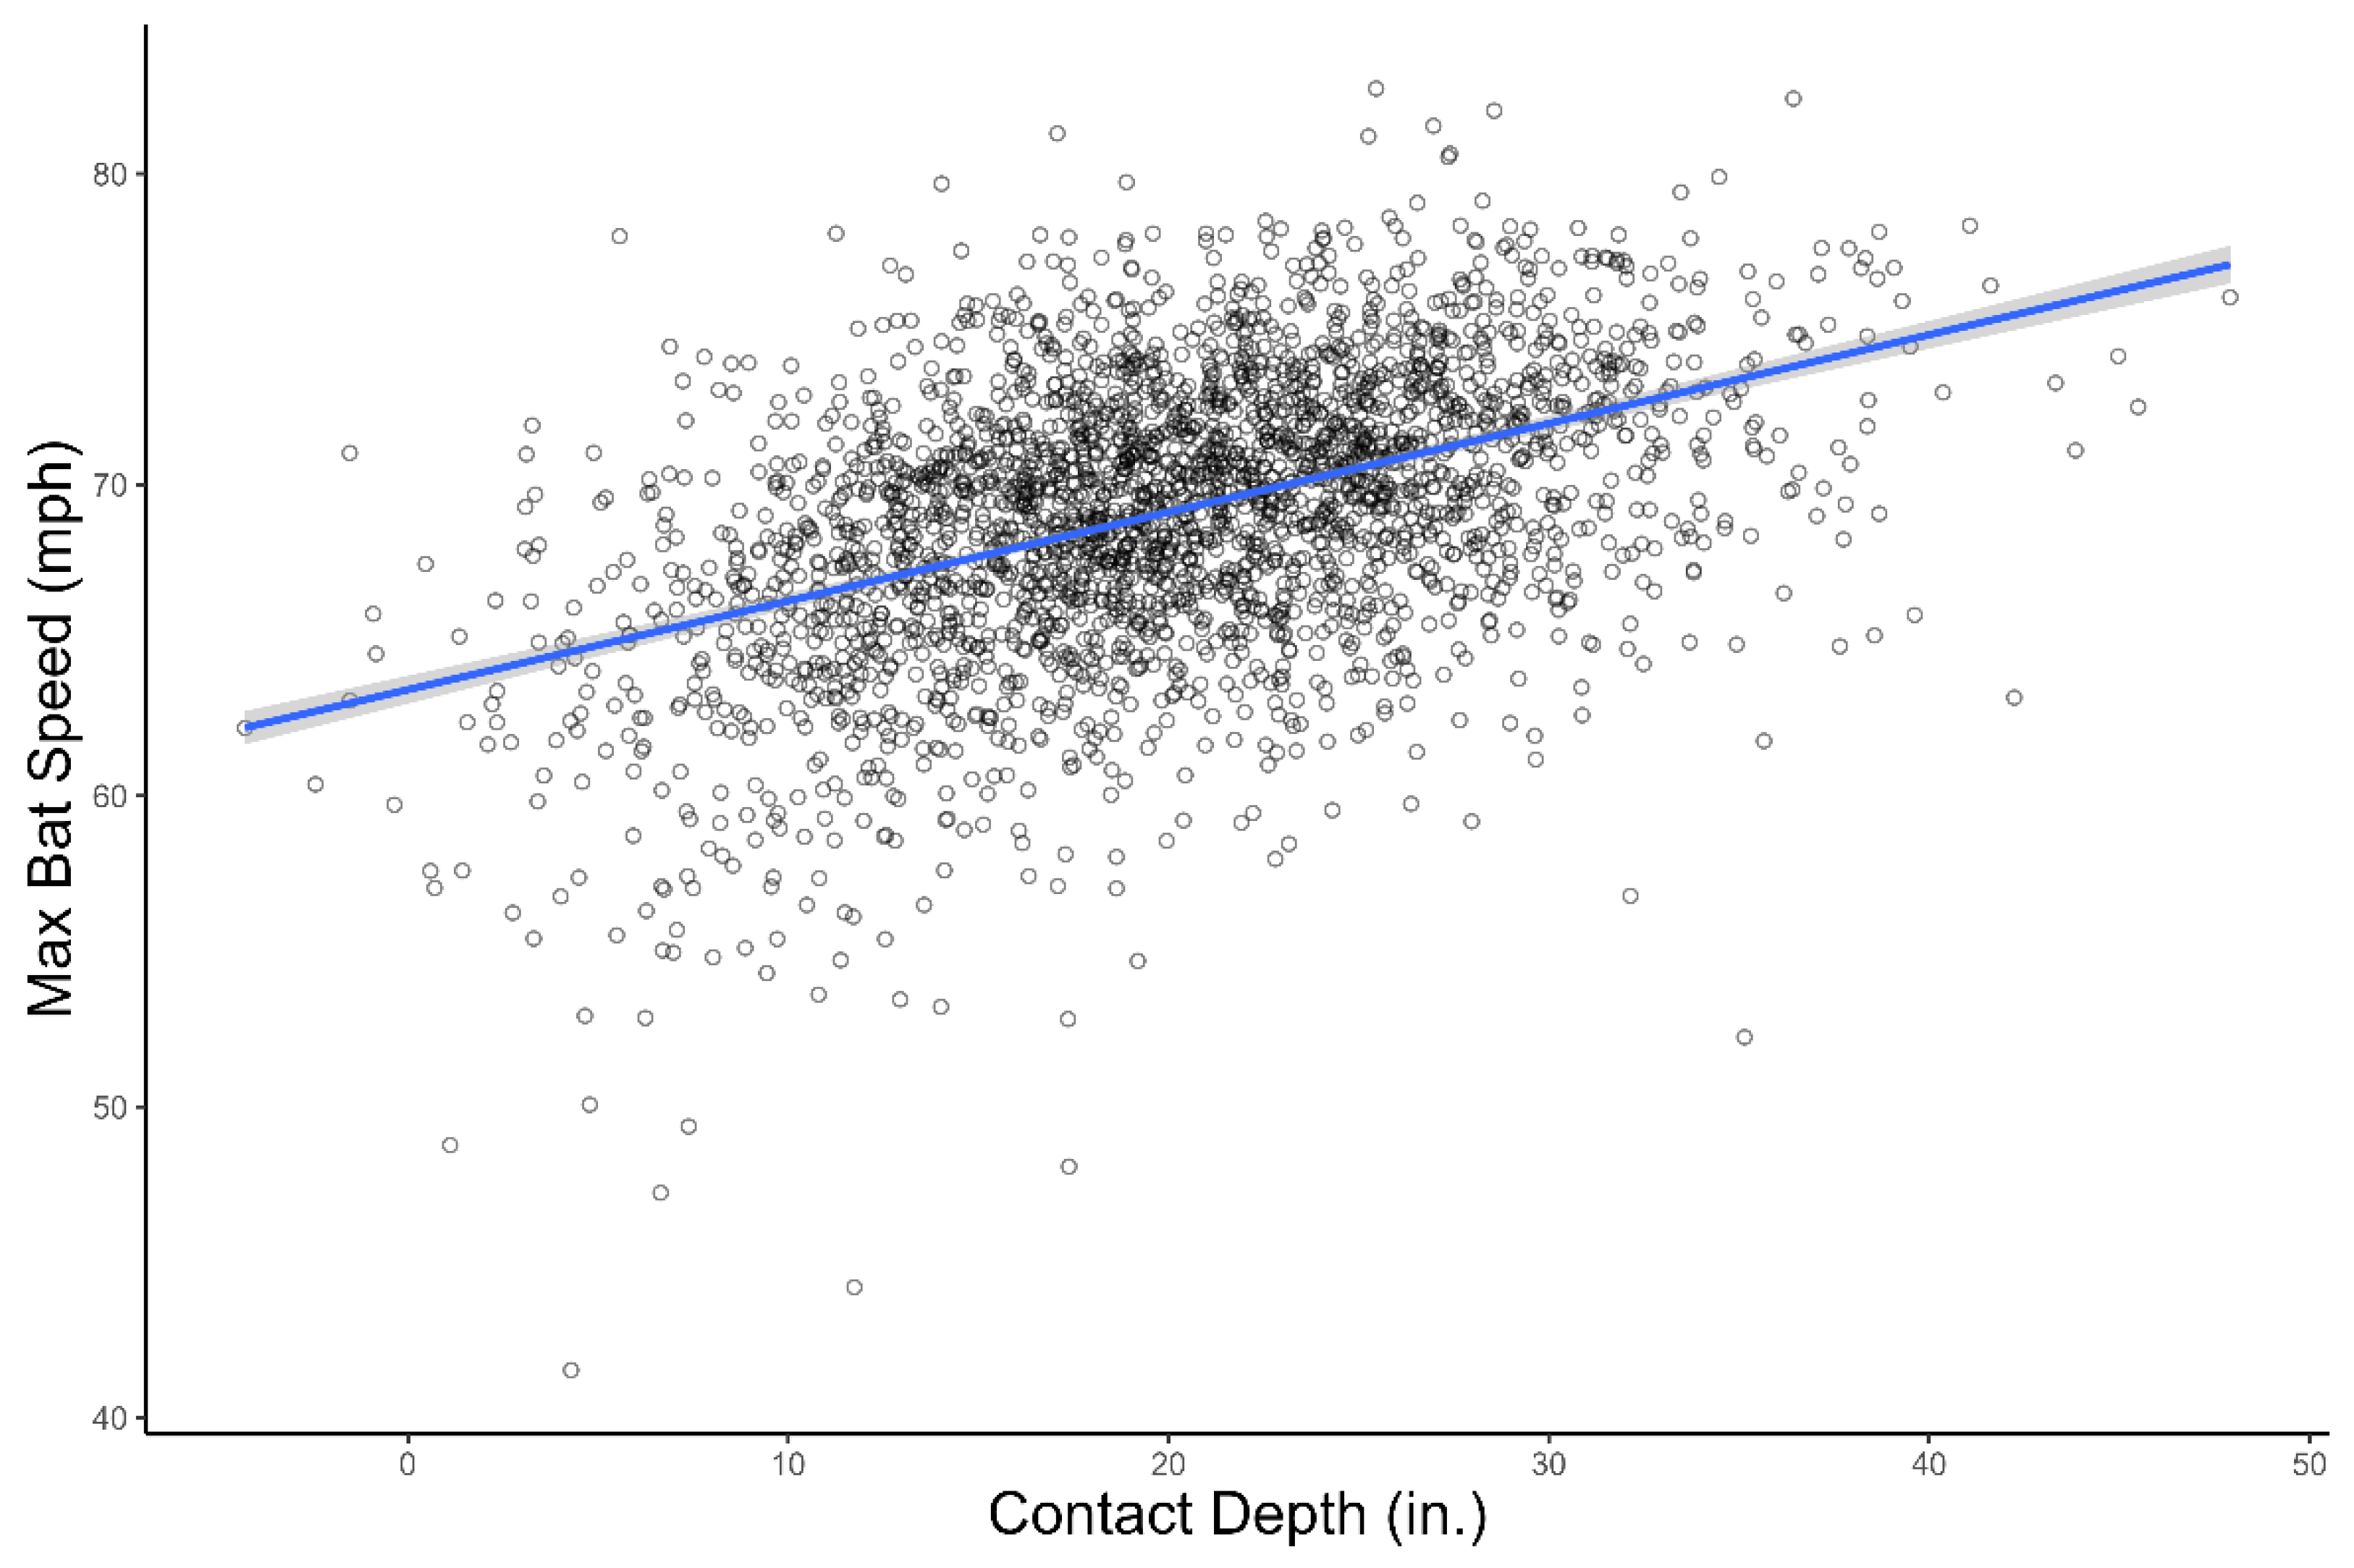
Figure 5.
Contact depth and bat speed at ball contact. Positive depth values indicate toward the pitcher.
Figure 5.
Contact depth and bat speed at ball contact. Positive depth values indicate toward the pitcher.
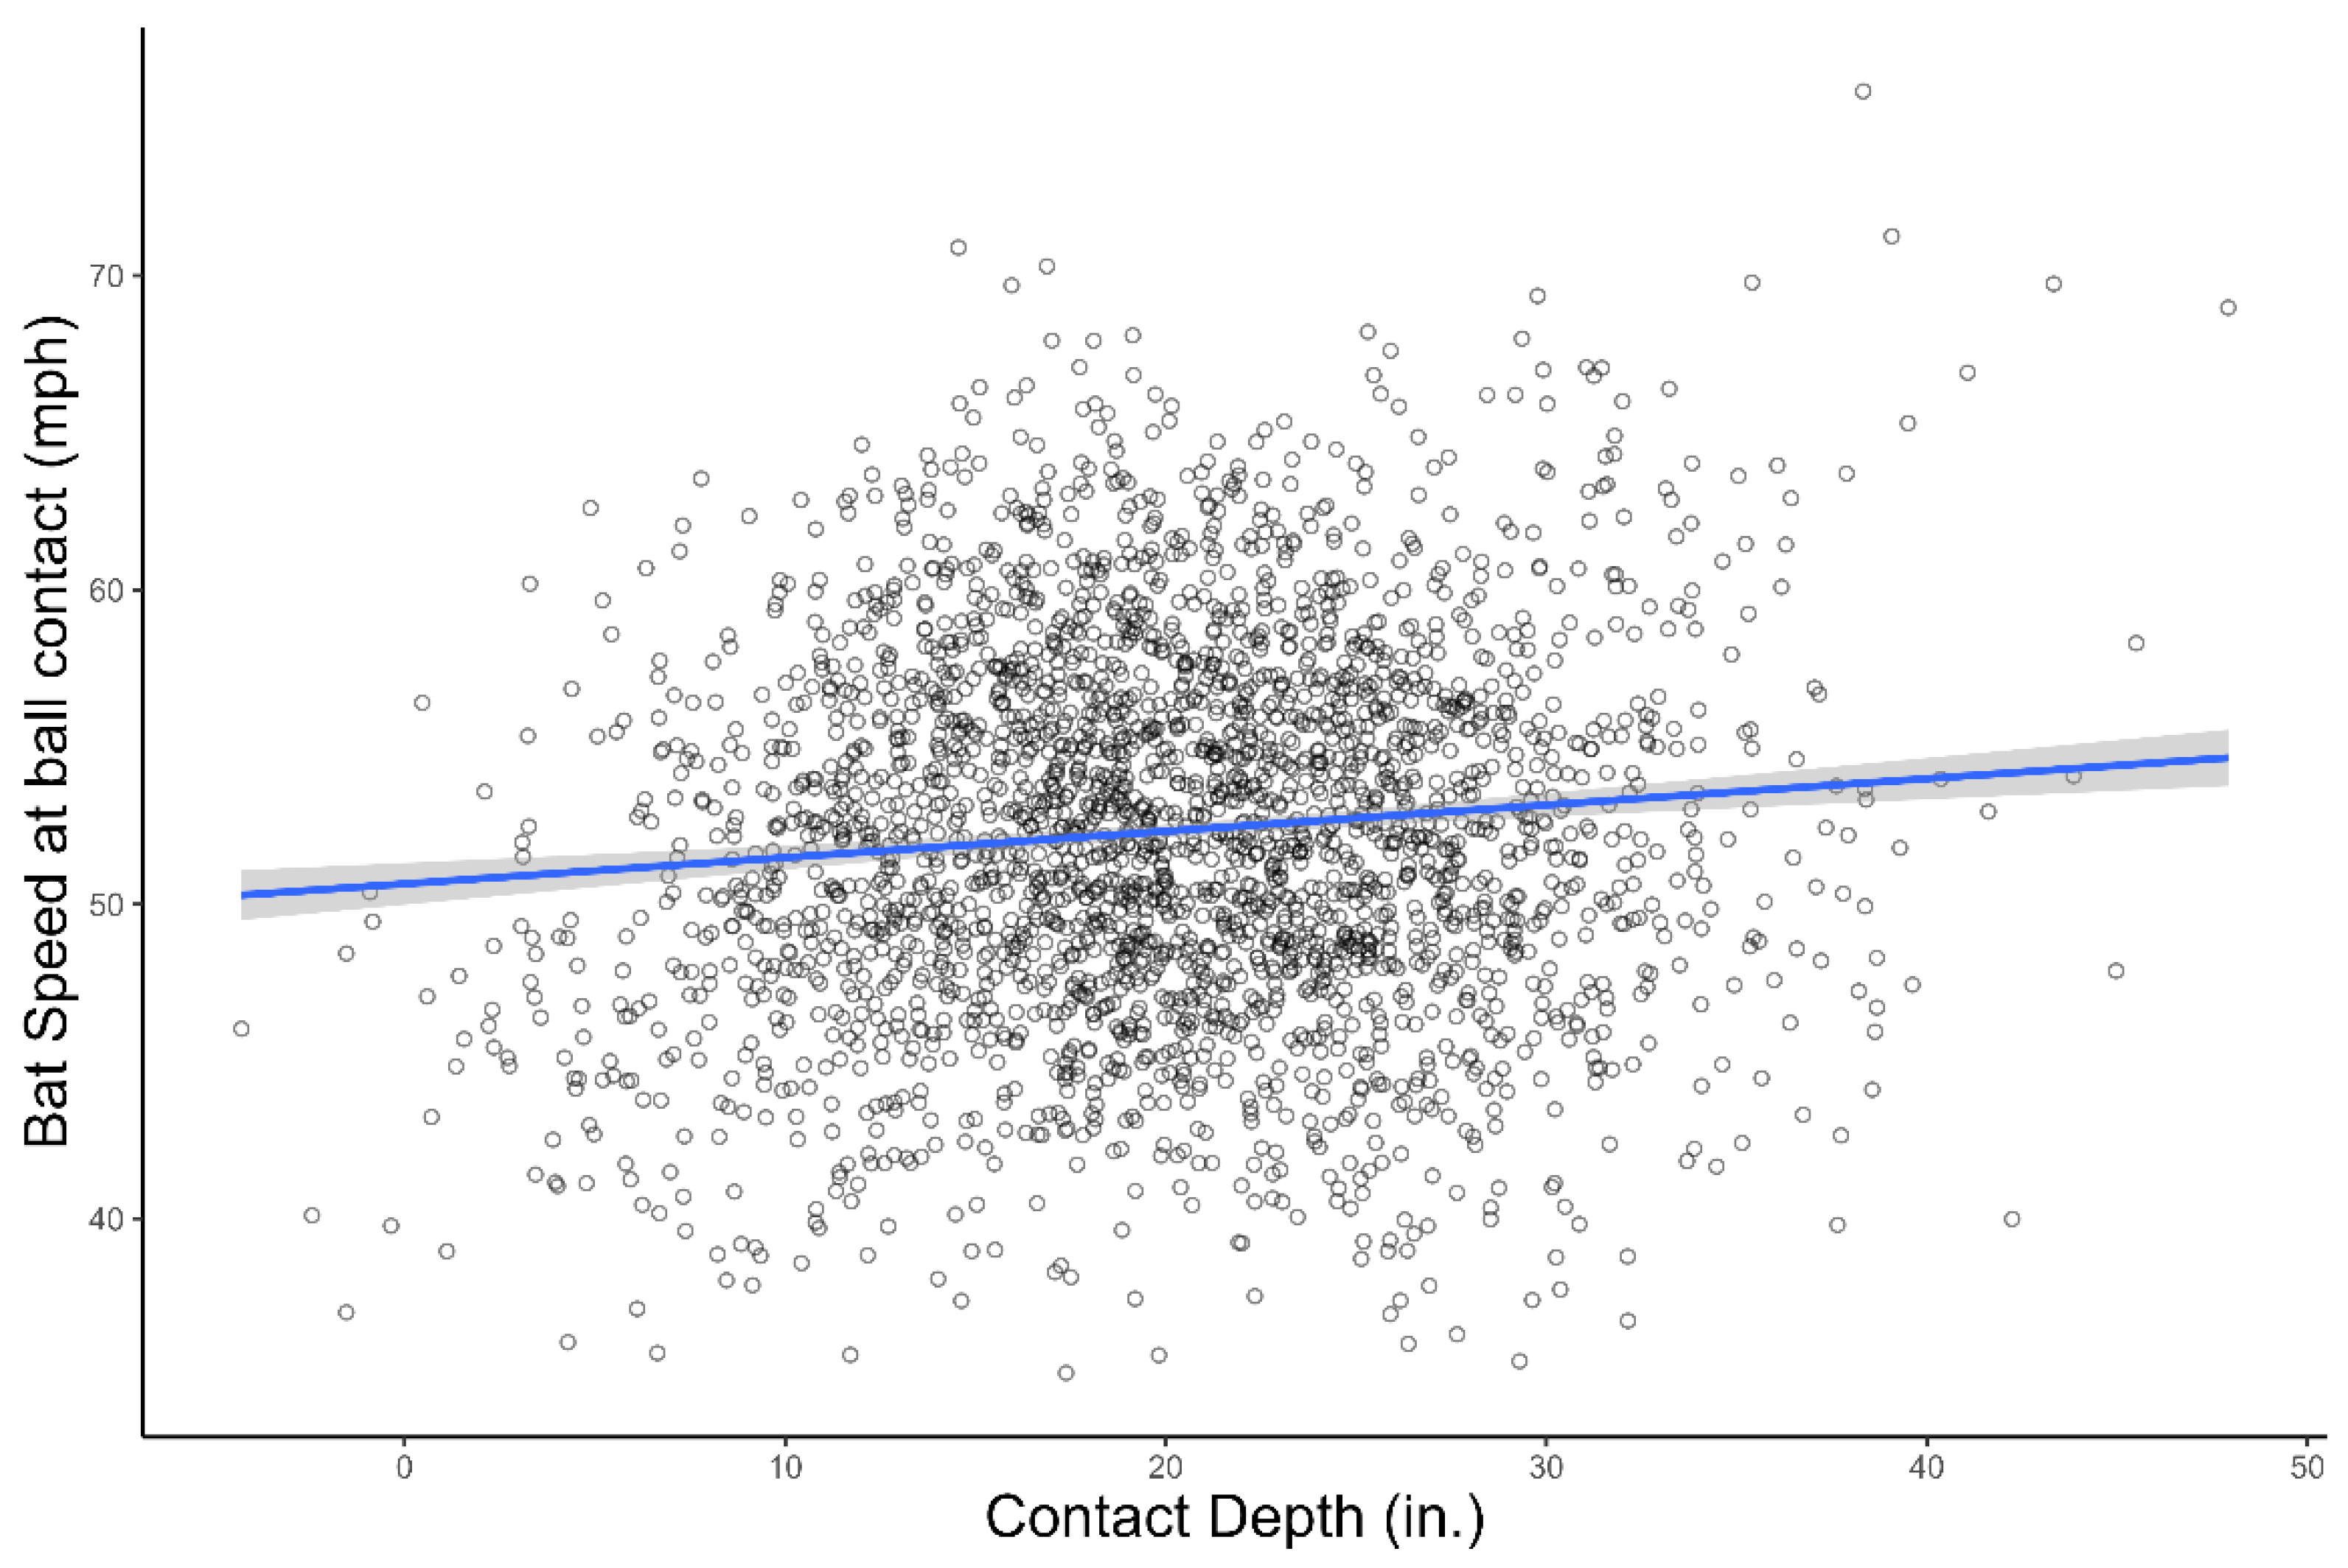
Figure 6.
Bat Speed and Bat Position. Contact depth occurred, on average 20.1 inches in front of the hitter’s COM. Plot is trimmed to 15 frames before, and after ball contact to only track forward bat progression. Positive depth values indicate toward the pitcher. **Note: Because this plot shows the location of the centroid of the bat, not the contact point from the centroid of the ball, the visual contact point on this plot appears slightly lower than the contact depth reported elsewhere in this paper.
Figure 6.
Bat Speed and Bat Position. Contact depth occurred, on average 20.1 inches in front of the hitter’s COM. Plot is trimmed to 15 frames before, and after ball contact to only track forward bat progression. Positive depth values indicate toward the pitcher. **Note: Because this plot shows the location of the centroid of the bat, not the contact point from the centroid of the ball, the visual contact point on this plot appears slightly lower than the contact depth reported elsewhere in this paper.
Disclaimer/Publisher’s Note: The statements, opinions and data contained in all publications are solely those of the individual author(s) and contributor(s) and not of MDPI and/or the editor(s). MDPI and/or the editor(s) disclaim responsibility for any injury to people or property resulting from any ideas, methods, instructions or products referred to in the content. |
© 2026 by the authors. Licensee MDPI, Basel, Switzerland. This article is an open access article distributed under the terms and conditions of the Creative Commons Attribution (CC BY) license.
Copyright: This open access article is published under a Creative Commons CC BY 4.0 license, which permit the free download, distribution, and reuse, provided that the author and preprint are cited in any reuse.


