

Submitted:
08 June 2026
Posted:
09 June 2026
You are already at the latest version
Abstract
Interpersonal synchrony is a time-dependent coordination pattern in which interacting partners' body movements become temporally aligned. This study frames interpersonal synchrony as a human motion analysis problem and presents Synchrony Vision, an RGB-D sensor-based system for real-time monitoring and event-level analysis of interpersonal motion synchrony in free dialog. The system transforms Kinect-derived skeletal positions into joint acceleration signals, applies sensor-specific conditioning, detects movement peaks, and estimates event-level phase differences between two participants within a ±1.0 s window. The operator-facing interface supports live RGB-D monitoring, acceleration visualization, joint selection, millisecond-scale phase-difference histograms, four synchrony metrics (Frequency, Direction, Width, and Strength), and exportable acceleration, timestamp, peak-pairing, and summary artifacts. We evaluated the deployed pipeline on 25 Kinect-tracked dyads engaged in unconstrained conversation. Across 200.6 min comprising 245,835 frames, the system detected 2,681 synchrony events, exceeded circular-surrogate baselines, and preserved between-dyad ordering across reasonable parameter settings. Motion Energy Analysis-style cross-correlation on the same acceleration signals also confirmed above-chance synchrony but produced different dyad rankings. These findings show that RGB-D skeletal sensing can extend human motion analysis from individual movement capture to transparent, event-level quantification of interpersonal coordination.
Keywords:
interpersonal synchrony
; human motion analysis
; RGB-D sensing
; markerless skeletal tracking
; phase difference
; real-time monitoring
; Kinect
1. Introduction
Sensor-based human motion analysis is increasingly central to the quantitative study of human behavior, enabling objective assessment of movement patterns in research, clinical, educational, rehabilitation, and interactive settings [1,2,3]. While traditional human motion analysis has predominantly focused on individual kinematics—such as gait, posture, or isolated upper-limb movements—the emergence of robust multi-person sensing technologies enables a shift toward analyzing social interactions. A persistent theme in this literature is interpersonal synchrony—the temporal alignment of partners’ body movements—which can be viewed as a dyadic extension of human motion analysis and has been associated with rapport, cooperation, and therapeutic processes [4,5]. To support such applications, sensing systems must balance measurement accuracy, latency, intrusiveness, scalability, and interpretability for end users [6].
Human communication combines verbal content with rich nonverbal cues, and body movement is a key channel for expressing affect, intent, and social affiliation [4,7]. A prominent nonverbal phenomenon is interpersonal synchrony, in which interaction partners’ movements become temporally coordinated during conversation and joint activity [8]. Prior work in psychology, communication, and HCI links higher movement synchrony to stronger rapport, cooperation, and more positive interaction outcomes, and it has also been discussed as a potentially useful signal in therapeutic and educational contexts where monitoring and supporting social engagement are important [9,10,11,12,13,14,15]. More broadly, coordinated body motion has been associated with social bonding, trust, empathy, and perceived interaction quality, suggesting that synchrony metrics can serve as informative behavioral markers when measured reliably [10,16,17,18].
Conventional approaches exhibit clear trade-offs. Visual observation is subjective and hard to scale; video analysis can be compute-intensive and sensitive to recording conditions; marker-based optical capture demands cost and setup; and IMU-based methods, while precise, require body-worn sensors that may alter natural behavior [19,20,21,22,23,24,25]. These constraints are particularly limiting when the goal is to capture dyadic timing relations rather than only individual kinematics, where sub-second phase relations matter for interpretation and intervention [6].
Affordable, non-invasive depth cameras such as Microsoft Kinect and Orbbec Femto Bolt provide an alternative by tracking multiple people simultaneously without on-body instrumentation. They offer RGB-D sensing, skeletal tracking, and sufficient temporal resolution for many communicative movements, making them attractive for markerless synchrony monitoring; classic work established real-time 3D skeleton estimation from depth, and subsequent analyses documented Kinect’s sensing characteristics and practical impact for human tracking [26,27,28,29]. Beyond cost and ease of deployment, such devices enable continuous measurement in ordinary rooms, which broadens the ecological validity of synchrony studies [6,29,30,31].
Building on this opportunity, phase-difference analysis has emerged as a practical and interpretable method to quantify interpersonal timing. Synchrony Vision operationalizes this idea by computing joint accelerations from tracked skeletons and detecting peaks to estimate time-lagged alignment between partners within a bounded window (±1.0 s) [32]. Because camera-derived accelerations differ from accelerometer outputs, several engineering adaptations are required: adding gravitational acceleration to the vertical axis to prevent peak inversion in norms, inverting the X-axis for one subject in face-to-face orientation to avoid 180° phase flips, and tuning peak-detection thresholds for Kinect data. Together these modifications align the camera pipeline with the assumptions of the original algorithm and stabilize peak-based synchrony detection.
Empirically, the algorithmic core has been validated on metronome-paced rhythmic tasks, showing an overall event-detection accuracy of approximately 89%, and has also shown a strong correlation with a wearable-accelerometer baseline for synchrony frequency during free-dialog recordings (r ≈ 0.73) [32]. However, those results focused mainly on event detection under controlled task conditions and frequency-based agreement with a wearable reference, rather than on the deployment-condition behavior of the user-facing metrics during unconstrained free conversation. What remains to be characterized is whether the full set of user-facing metrics—Frequency, Direction, Width, and Strength—behaves coherently under deployment-condition free conversation, which is the regime in which the Result workspace is intended to be used. The present manuscript evaluates the deployed, user-facing analysis pipeline under the conditions in which the software is intended to be used: unconstrained dyadic conversation. Specifically, we characterize frame-time behavior, phase-difference distributions, circular-surrogate baselines, parameter robustness, and MEA-style cross-method comparison for the four exported metrics.
For practical adoption, the computational pipeline must also be exposed through an interface that lets operators verify tracking, select target joints, inspect acceleration signals, and export auditable artifacts without relying on a separate offline workflow [33,34]. Accordingly, this study designs and implements the UI as a deployment-oriented component of the sensor-analysis method, focusing on interface functions that support measurement quality, interpretation, reproducibility, and practical use of synchrony monitoring.
This paper makes three contributions to sensor-based human motion analysis. First, it presents an RGB-D sensing pipeline that transforms markerless skeletal tracking data into acceleration-based motion signals and event-level phase-difference estimates between two interacting participants. Second, it implements these computations in an operator-facing monitoring system that supports live acquisition, joint selection, interpretable synchrony metrics, and exportable motion-analysis artifacts. Third, it evaluates the deployed pipeline on 25 Kinect-tracked free-dialog dyads, characterizing frame-time behavior, phase-difference distributions, surrogate-tested event density, dyad-level variability, parameter robustness, and correspondence with Motion Energy Analysis-style cross-correlation.
2. Materials and Methods
This section describes the materials, system components, and analytical procedures used to capture, process, visualize, and evaluate interpersonal motion synchrony from RGB-D skeletal tracking. It covers the sensing hardware, acceleration derivation, phase-difference analytics, data export, user-facing workflow, and statistical comparisons with surrogate and MEA-style baselines. Figure 1 provides a high-level synopsis of Synchrony Vision as an operator-facing pipeline that converts RGB-D skeletal motion into event-level synchrony cues.
2.1. Hardware and Sensing
The system uses the Microsoft Kinect v2 as a non-wearable RGB-D sensor that provides depth-based skeletal tracking in addition to color and depth streams [35]. In standard operation, the Kinect tracks up to six persons, estimating a 25-joint skeleton for each actively tracked subject over an effective range of approximately 0.5–4.5 m with a field of view of roughly 70.6° (horizontal) and 60° (vertical) [35,36,37,38]. Frames are processed at 30 fps, which is sufficient for many communicative movements such as head nods and upper-body gestures in face-to-face interaction [35,36,37,38]. By avoiding body-worn sensors, the sensing setup supports more naturalistic measurement in multi-person settings while retaining per-joint kinematic information needed for synchrony analysis.
Within the system, users can select target joints depending on the intended application. Although head and upper-body motion are commonly used for conversational synchrony, the interface supports configurable selection among the head, torso (upper body), and left/right elbows and hands, enabling the same pipeline to be applied to different body parts and interaction tasks [32].
2.2. Data Acquisition and Kinematic Derivation
The system converts Kinect skeletal joint positions into acceleration time series through a finite-difference chain. For each tracked joint, the position sequence is sampled at the device-native frame rate and differentiated to estimate velocity and acceleration. For each frame and selected joint, the system records three-axis accelerations (ax, ay, az) in units of . Internally, an acceleration magnitude is standardized to reduce amplitude differences across individuals and sessions, smoothed to suppress residual depth-sensor jitter, and then used for peak detection and phase-difference estimation as defined in Section 2.6.
2.3. Phase-Difference Analytics and Kinect-Specific Adaptations
Synchrony is estimated using a peak-based phase-difference approach [8]. Candidate motion events are defined as local maxima in the standardized acceleration magnitude. For each peak detected in one participant’s signal, the system searches for the temporally closest peak in the partner’s signal within a bounded time window (default ±1.0 s), and the minimum peak-to-peak time difference is recorded as the phase difference. The resulting set of phase differences is summarized as a histogram and used to derive four deployment-oriented statistics: the mean lag (Direction), dispersion (Width as the standard deviation), and a peakedness/coherence indicator (Strength, derived from distribution shape), along with a rate-based index of event occurrence (Frequency/Density, events per minute) [8,39,40]. In practice, the histogram provides an interpretable distributional context so that users can visually confirm whether the lead–lag tendency is concentrated or widely dispersed.
Because Kinect-derived kinematics differ from high-frequency accelerometer streams, the implementation includes three lightweight but important adaptations to align camera-based accelerations with the assumptions of the phase-difference method [32]. First, the system applies gravity compensation on the vertical axis by adding approximately 9.8 to the Y component before forming norms; this prevents negative valleys from becoming artificial peaks after squaring in magnitude computation and stabilizes peak structure (as illustrated by the “before/after” correction visualization). Second, in face-to-face interaction, one participant’s coordinate frame can be effectively mirrored, producing a 180° phase flip in horizontal motion; the system therefore applies a face-to-face orientation correction by inverting the X-axis sign for one participant to restore consistent phase alignment. Third, the system uses threshold tuning for peak detection appropriate to 30-fps camera signals, setting the Kinect threshold to 0.2 (in contrast to higher thresholds used for accelerometer signals). Threshold-sweep results demonstrate that this setting detects intended nod events across multiple amplitude conditions. Together, these adaptations allow the method to preserve its original lead–lag semantics while remaining stable under depth-camera sampling and noise characteristics.
2.4. Data Export and Configuration
The system is organized around a transparent input–output scheme designed to support auditability and downstream analysis. On the input side, the system produces or consumes per-subject acceleration CSV files (e.g., Subject1.csv–Subject6.csv or role-based files such as Teacher.csv and Student.csv), where each row records (ax, ay, az). Processing parameters are centralized in an external configuration file (e.g., ExtractPeak.ini), which specifies key values such as the sampling rate (FPS), peak threshold (THRESHOLD), smoothing span (SMA), phase window size (WSIZE), and histogram binning/range parameters. The documentation provides explicit schemas and examples for both the INI settings and CSV formats, enabling replication across machines and studies.
On the output side, the system exports the final analysis artifacts in human-readable CSV form. Participant-level acceleration data are saved as Subject1.csv, Subject2.csv, and additional subject-specific CSV files as needed; the phase-difference series are saved as Histgram.csv; and frame-level timestamps are saved as Time.csv.
2.5. Signal Processing and Phase-Difference Algorithm
This section details the end-to-end procedure that transforms per-frame joint positions into phase differences between two participants’ movements, and derives summary synchrony metrics [8,39,40].
2.5.1. From Joint Positions to Standardized Acceleration
Position → velocity → acceleration. Let denote the 3D position of joint at discrete time for a participant, sampled at rate (Kinect: fps). The sampling interval is . Velocity and acceleration are estimated by finite differences:
Norm and z-score normalization. To obtain a scalar signal suitable for peak-based event extraction, we compute the acceleration magnitude:
Because motion amplitude varies across participants, joints, and sessions, the magnitude is standardized using z-score normalization over the analysis interval :
Given the inherent spatial jitter and depth-estimation noise characteristic of consumer-grade depth sensors, the standardized signal is smoothed using a short moving average. This sensor-specific conditioning is crucial to prevent high-frequency artifacts from being falsely detected as motion peaks, while preserving salient movement bursts:
where is the SMA window length (default ). For Kinect at 30 fps, corresponds to approximately 0.37 s, and may be tuned depending on motion speed and noise conditions.
2.5.2. Peak Detection as Motion Events
Motion events are defined as local maxima of the smoothed standardized signal. A sample is considered a peak if:
where is an amplitude threshold. In practice, is modality-dependent: Kinect-derived accelerations at 30 fps require a lower threshold (default ) than standardized high-rate accelerometers.
2.5.3. Kinect-Specific Signal Adaptations
Skeleton-derived kinematics differ from wearable accelerometer streams, and three lightweight adaptations are used to align the camera pipeline with the assumptions of the phase-difference method.
Gravity compensation on the vertical axis. Before computing the magnitude in (3), the system adds a constant gravitational term to the vertical component (Y axis) to stabilize magnitude formation when camera-derived acceleration exhibits negative valleys. Concretely, for Kinect signals we use:
and compute the magnitude using in place of .
Face-to-face orientation correction. In face-to-face interaction, one participant’s horizontal axis may be mirrored by the coordinate convention, leading to an apparent 180° phase flip. The system therefore inverts the sign of the X component for one participant prior to magnitude computation, restoring consistent phase alignment for horizontal motion.
Threshold tuning for 30-fps camera signals. Because Kinect signals exhibit lower apparent amplitude after differentiation and smoothing, is tuned to a lower range (default 0.2). Practical tuning is performed by verifying that intended event counts (e.g., nods in rhythmic tasks) are recovered robustly across amplitude conditions.
These adaptations preserve the original lead-lag semantics of the algorithm while improving stability under depth-camera sampling and noise characteristics.
2.5.4. Phase-Difference Pairing and Deduplication
Let and denote the detected peak times for participants A and B, respectively. We define a maximum allowable lag (default 1.0 s). For each peak , we search for the closest counterpart in within the window:
and record the signed phase difference:
where indicates that A leads and indicates that B leads. Because multiple peaks may fall within , the implementation performs pairing in both directions (A-anchored and B-anchored) and then removes duplicates to enforce one-to-one matching and prevent double counting.
Edge cases. If no counterpart peak exists within , the anchor peak is discarded. If multiple candidates tie in temporal distance, the closest in time is chosen; optionally, peak amplitude can be used as a secondary tie-breaker when stored.
2.5.5. Output Metrics and Visualization
Given the set :
Density (activity) is defined as the synchronization event rate per minute:
Direction (lead–lag structure) shows the mean phase difference, which captures both the magnitude and sign of the average temporal offset:
A negative indicates that participant A tends to lead participant B, whereas a positive value indicates that participant B tends to lead.
Width (variability) is defined as the dispersion of the phase-difference distribution, computed as the standard deviation of the time lags .
Strength (coherence) is defined as the Pearson kurtosis of the phase-difference distribution, computed from the fourth central moment normalized by the squared variance. Higher values indicate a more sharply peaked distribution of Δt values; because it is distributional, Strength is interpreted together with Frequency and Width rather than as a standalone validation score.
Histogram of supports visual inspection of unimodality versus spread, and the horizontal axis is represented in milliseconds in the current UI to facilitate direct interpretation as conversational time delays.
All metrics are exported as CSV artifacts: PeakResult.csv (index pairs), Histgram.csv (series of ), and single-valued files Density.csv, Direction.csv, Width.csv, Strength.csv, enabling full auditability and downstream analysis.
2.6. User Interface and Export Workflow
This section describes the user interface (UI) that operationalizes phase-difference–based synchrony analytics for end-users. The UI is organized into two primary workspaces—Measurement and Result—and is complemented by a small set of configuration and export mechanisms. The central design intent is to keep complex analytics visible and interpretable while ensuring that the operator workflow remains lightweight during time-critical data acquisition.
2.6.1. Design Rationale
The UI was designed around three practical requirements. First, it keeps live camera feedback, acceleration traces, recording controls, and system messages on a stable measurement surface so that operators can verify state without context switching. Second, it exposes only frequent acquisition decisions—start/stop recording, target-joint selection, and graph scaling—while keeping advanced analysis parameters in an external configuration file. Third, it preserves auditable outputs so that every summary shown in the Result workspace can be checked or reanalyzed outside the application [33,34].
2.6.2. Measurement Workspace
Operationally, the UI supports a short and repeatable workflow: Launch → Recognition → Measurement Settings → Start (REC) → Stop → Results → Export. During recognition, color-coded body overlays and Body1–Body6 status indicators help operators verify which SDK-assigned tracking index corresponds to each physical participant before recording begins. This explicit recognition step reduces the risk of swapping participant roles in exported files when SDK-assigned body indices change or appear ambiguous at first detection. Target joints are then selected and visually confirmed, after which recording starts with persistent REC feedback. When recording ends, the software automatically executes the phase-difference analysis and transitions to the Result workspace for interpretation and export.
The Measurement screen presents a single integrated surface comprising (i) the live camera view with status overlays, including Tracking Count and Body1–Body6 “Tracked/–“ flags; (ii) real-time acceleration plots; (iii) a control panel for measurement; (iv) per-subject joint selection controls and y-axis range settings to keep salient peaks visible; and (v) a log pane, as shown in Figure 2. A dedicated log pane streams system messages and state transitions, supporting troubleshooting without requiring users to exit the main screen.
The camera display reports the current Tracking Count and Body1–Body6 status flags, while color-coded overlays help the operator map SDK-assigned body indices to physical participants. Per-subject selectors specify the target body part, so the same sensing pipeline can be applied to head, torso/upper-body, elbow, or hand motion depending on the study design. The acceleration plots visualize per-subject signals in real time, and graph-scale controls let the operator keep movement peaks within view when motion amplitudes differ across participants or tasks. Because the phase-difference method depends on event peaks, this immediate visual check is part of the measurement-quality workflow rather than only a display feature. Start/Stop/Show Results buttons manage the transition from acquisition to analysis. A persistent REC indicator and timestamped log messages mark recording state, device status, recognition events, file I/O, and analysis initiation, which helps operators detect setup or tracking problems while the session is still recoverable.
2.6.3. Result Workspace and Exported Artifacts
After recording ends and at least two participants are tracked, the software executes the phase-difference analysis and presents results in the Result workspace (Figure 3). The screen reports session metadata, selected body parts, synchrony count, and a millisecond-scale histogram of signed phase differences.
Four metric cards summarize complementary properties of the event-level synchrony distribution. Direction, defined as the mean phase difference, captures the signed lead–lag structure, including both the magnitude of the temporal offset and which participant tends to lead. Width, measured by the standard deviation of phase differences, reflects the temporal dispersion of alignment. Strength, derived from a kurtosis-related indicator, represents the peakedness and consistency of the phase-difference distribution. These cards support quick inspection while preserving continuous values for downstream analysis.
The histogram uses milliseconds rather than frames on the horizontal axis, making lead–lag values interpretable at conversational time scales. This display also helps users distinguish a near-zero, bidirectional distribution from a broad or systematically shifted distribution.
One-click export buttons save participant-level acceleration files (Subject1.csv, Subject2.csv), phase-difference series (Histgram.csv), and frame-level timestamps (Time.csv) as human-readable CSV files. Keeping these outputs human-readable sup-ports replication, reanalysis with external scripts, and comparison with alternative synchrony methods.
2.6.4. Configuration, Pre-Flight Checks, and Recoverability
To keep routine operation simple, algorithm parameters are centralized in an external INI file rather than exposed as on-screen controls. Key settings include FPS, the peak-detection threshold (default θ = 0.2 for Kinect signals), the SMA smoothing window (default W = 11 samples), the maximum pairing window (default = 1.0 s), histogram range/binning, and optional threshold values for metric ratings. This separation lets expert users standardize settings across studies while allowing non-experts to use fixed deployment defaults [33,34].
Figure 4 shows the Kinect Configuration Verifier used for pre-flight checks of hardware, drivers, USB bandwidth, and stream availability. This pre-flight step is intended to reduce installation and setup failures before field recording begins. Reporting pass/warn/fail status before acquisition reduces the risk of silent misconfiguration that would compromise motion recordings.
During operation, the system progresses through visible states—Idle, Tracking, Recording, Analysis, and Results—marked by tracking indicators, the REC badge, and timestamped log messages. Common recoverability paths, such as checking power/USB connection or re-confirming body-role mapping, are therefore available within the measurement workflow rather than requiring developer tools.
2.7. Evaluation Methods
Evaluation focused on deployment-condition behavior rather than re-reporting the prior controlled validation of the system implementation [32]. The practical question was whether the same timestamp-aware phase-difference computation that populates the Result workspace produces coherent Frequency, Direction, Width, and Strength values when applied to long, unconstrained dyadic conversations. We therefore evaluated the pipeline on a Kinect-acquired corpus at the dyad level, examined effective frame-time characteristics, tested event density against circular-surrogate baselines, assessed parameter robustness, and compared the event-based outputs with Motion Energy Analysis-style windowed cross-correlation [41,42].
2.7.1. Procedure
Twenty-five dyads of native Japanese speakers (50 participants, 25 conversational pairs) engaged in unconstrained, seated, face-to-face free dialog. Participants were instructed only to talk freely; no task, topic, or pacing was imposed. Upper-body motion was captured with a Microsoft Kinect sensor positioned at conversational distance and operated by the deployed Synchrony Vision software described in Section 2.1, Section 2.2, Section 2.3, Section 2.4, Section 2.5, Section 2.6 and Section 2.7. For each participant, the Kinect SDK reported skeletal joint positions at the device-native rate, which were converted to tri-axial acceleration time series (ax, ay, az) via the finite-difference chain defined above and exported as CSV through the standard UI export path (Subject1.csv, Subject2.csv) along with per-frame timestamps (Time.csv). This study was approved by the Ethics Committee of Kyoto University of Education (Approval No. 1805) and conducted in accordance with the Declaration of Helsinki.
2.7.2. Analysis Pipelines
Phase-difference pipeline. The pipeline applied to every dyad is the one described in Section 2.2, Section 2.3, Section 2.4, Section 2.5 and Section 2.6; no per-dyad tuning was performed, and all parameter values match the deployment defaults. Before synchrony analysis, inter-frame intervals were computed from Time.csv for each dyad, and effective frame-rate summaries were derived from these timestamp differences. The phase-difference analysis used the original frame sequence, and all timing computations—pairing windows, phase-difference values, and Frequency denominators—were based on Time.csv (wall-clock) timestamps. The resulting phase-difference outputs were then validated in three steps: first, by comparing observed event density against a within-dyad chance baseline; second, by characterizing per-dyad variability in the four UI metrics; and third, by testing the robustness of these metrics to reasonable changes in the peak-detection threshold, smoothing window, and pairing window.
Motion Energy Analysis pipeline. To enable a direct, parameter-matched comparison with the canonical Motion Energy Analysis (MEA) framework [41,42], we additionally applied the MEA windowed cross-correlation conventions to the same z-scored, smoothed acceleration magnitudes that were used as the input to the deployed phase-difference pipeline. We used the exact parameter set advocated by Ramseyer and Tschacher [41] and re-stated as the recommended default in Ramseyer’s primer [42]: 1-min non-overlapping windows (winSec = 60 s, incSec = 60 s) and a maximum lag of ±5 s. Within each window, we computed the cross-correlation function and took the absolute value of the peak r within the ±5 s lag range; the per-session synchrony index was the mean of these absolute peaks across windows, which is the quantity that the MEA literature reports as the dyad-level “synchrony” value. To compare observed synchrony with chance, we generated 100 pseudosynchrony surrogates by windows-wise shuffling of one participant’s time series, following the bootstrap convention introduced by Ramseyer and Tschacher [41] and described in detail by Moulder et al. [43]. For each dyad, the within-pair Cohen’s d against the surrogate distribution was computed in the same manner as in the MEA literature, enabling a direct numerical comparison of effect sizes with their published values.
3. Results
3.1. Frame-Time Characteristics
The effective frame-time series shows the expected Kinect behavior: nominal 30 fps with the irregular intervals introduced by occasional frame drops typical of USB-3.0 RGB-D streaming, yielding a corpus-wide arithmetic mean effective rate of 20.5 ± 2.7 Hz, while the median frame-rate estimate per dyad was 27.8 ± 1.3 Hz, indicating that most inter-frame intervals remained close to the nominal Kinect rate while occasional timestamp gaps lowered the arithmetic mean. Recording length per dyad averaged 8.0 ± 0.8 min, yielding a corpus total of 200.6 min of paired Kinect-tracked interaction comprising 245,835 frames.
3.2. Distribution of Phase Differences
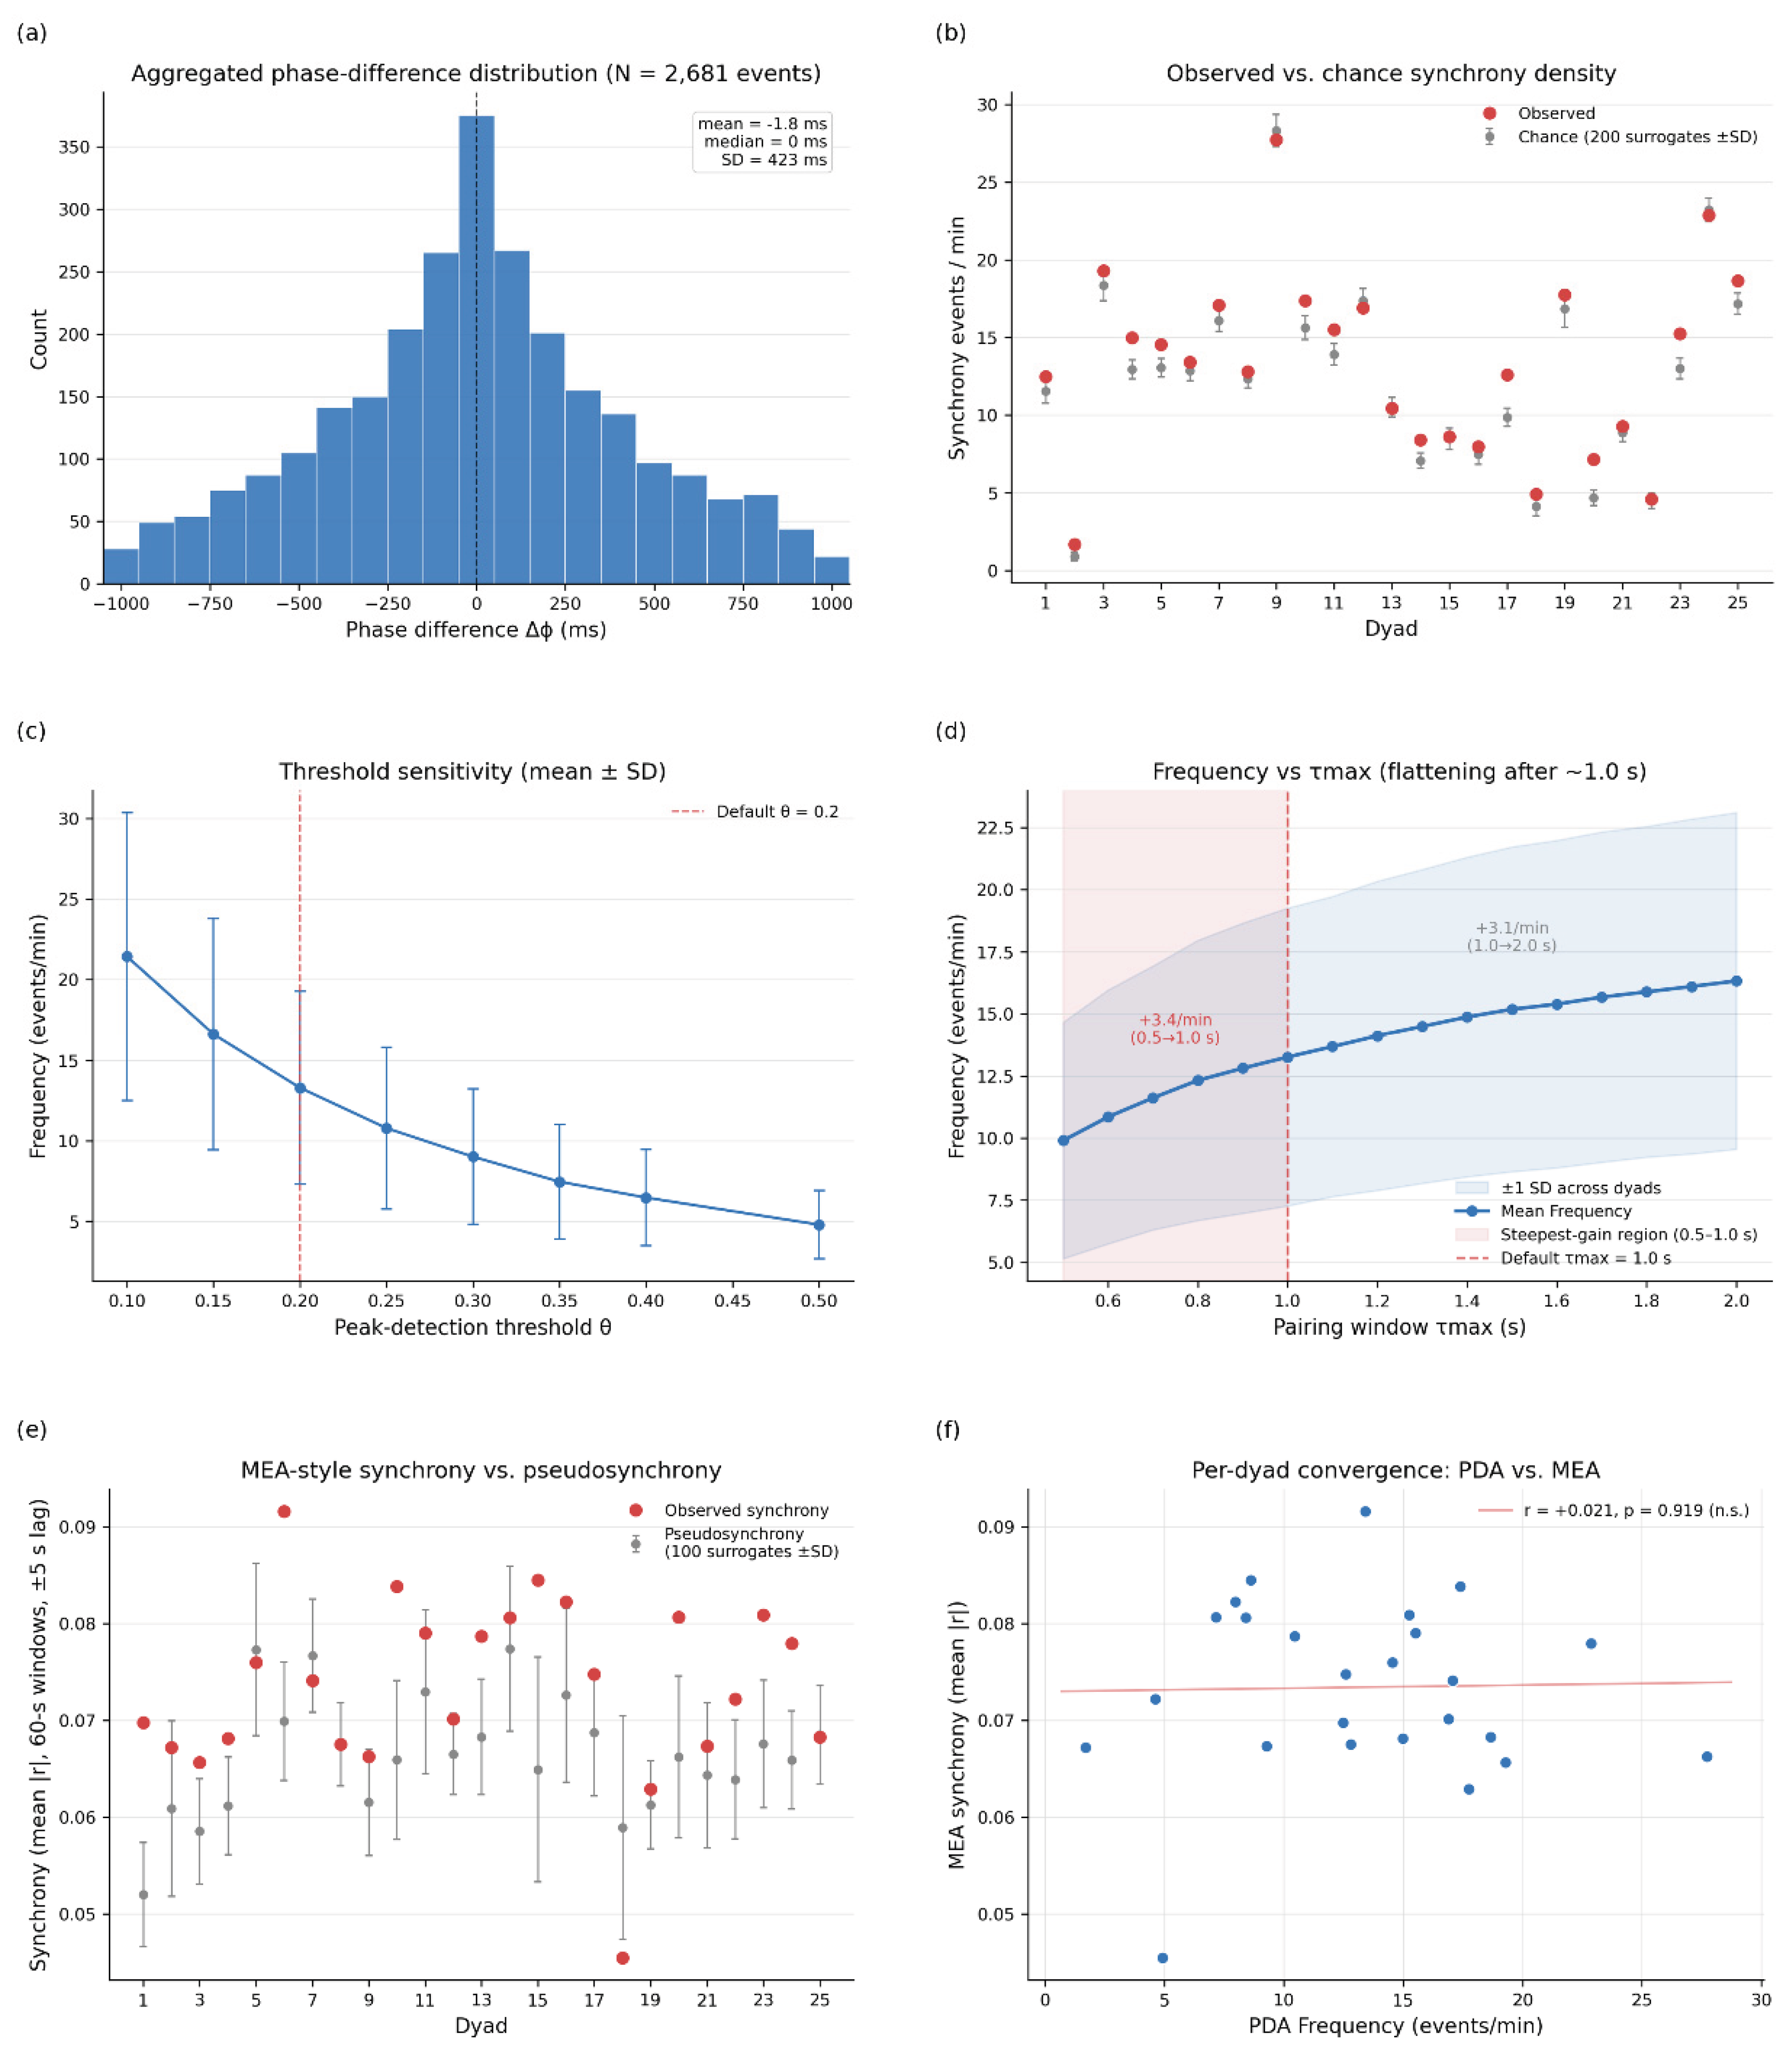
Across the 25 Kinect-tracked dyads, the phase-difference pipeline identified 2,681 matched synchrony events, using wall-clock timestamps from Time.csv for all temporal computations. Aggregating the signed phase differences across all events yields a unimodal distribution centered close to zero (Figure 5a; mean = 1.3 ms, median = 0 ms, SD = 423 ms). Of all detected events, 42.5% fell within ±200 ms of zero, 54.8% within ±300 ms, and 74.4% within ±500 ms, which is the time scale typically reported for conversational co-motion in prior synchrony work [8,39]. The near-zero center indicates the absence of a systematic lead–lag bias across the corpus, which is the expected pattern for unstructured dyadic conversation in which neither participant occupies a fixed leader role. The roughly symmetric tails on either side of zero, together with the millisecond axis of the histogram exposed in the Result workspace, allow operators to visually confirm that the analyzed session approximates a bidirectional mutual-coordination process rather than a unidirectional driving relation.
3.3. Comparison Against a Chance Baseline (Phase-Difference Pipeline)
To assess whether the observed event rate exceeds what would be expected from independently timed motion in each pair, a within-dyad surrogate test was conducted. For each dyad, participant B’s peak times were circularly shifted by a uniformly random offset within the recording window, the pairing procedure was repeated, and 200 such surrogates produced a chance distribution of event densities. Observed density exceeded the surrogate mean in 24 of 25 dyads (Figure 5b), and exceeded the upper 95% of surrogates in 11 of 25 dyads. Across the corpus, the observed Frequency (M = 13.31 events/min) was significantly higher than the chance density (M = 12.36 events/min; Wilcoxon signed-rank, p < .001; mean within-pair difference = +0.95 events/min, SD = 0.95; Cohen’s dz = 1.04). The non-trivial chance level (~12/min) reflects the fact that two people moving spontaneously at conversational pace will produce some accidental coincidences within a ±1.0 s window once the rate of detected peaks is high; the systematic excess of observed over chance therefore quantifies temporal structure above the circular-shift baseline rather than mere independent peak matching.
3.4. Per-Dyad Metrics and Inter-Pair Variability
At the corpus level, Frequency averaged 13.31 ± 5.98 events/min (median = 13.40, range 1.69–27.72). Dyad-level Direction values were centered near zero and were not significantly different from zero, whereas median absolute lag averaged 263.42 ± 51.08 ms, Width averaged 422.63 ± 31.64 ms, and Strength averaged +2.78 ± 0.36. Three properties of the dyad-level metrics are worth noting. First, the per-dyad Frequency spans more than an order of magnitude (1.7–27.7 events/min), indicating that the metric carries clear dyad-level signal rather than collapsing to a corpus-wide constant; this is the property required for the metric to function as a comparator on the Result screen. Second, Direction is small in absolute value, confirming that the deployed interface’s lead–lag rendering does not show a spurious corpus-level bias when used on neutral free conversation. Third, Width is comparatively stable across dyads (coefficient of variation 7.5% vs. 45.0% for Frequency), indicating that the temporal spread of synchrony is a relatively conserved property of free dialog. The magnitudes obtained here are consistent in order with those recently reported on independent typically developing dyads in a clinical-context study using the same algorithmic family [40].
3.5. Robustness to Parameter Choices
Although the deployed system fixes its analysis parameters in an external INI file (θ = 0.2, W = 11, = 1.0 s), we examined the sensitivity of the corpus-level results to each parameter so that the metrics shown in the UI can be interpreted as something other than threshold artifacts. Varying θ across [0.10, 0.50] produced a monotonic decrease in mean Frequency from 21.4 to 4.7 events/min (Figure 5c) while leaving the rank order of dyads largely intact (Spearman ρ between θ = 0.20 and θ = 0.30: 0.97). Varying the smoothing window W over [5,21] produced an analogous monotone decrease in Frequency, again preserving rank order. Varying over [0.5, 2.0 s] increased Frequency (Figure 5d), with most of the gain concentrated between 0.5 and 1.0 s, after which the curve flattened—consistent with the original justification for the ±1.0 s window as the upper plausible bound for conversational co-motion [8]. Taken together, these results indicate that the absolute magnitudes of the four metrics scale predictably with their underlying parameters, but the relative ordering of dyads is preserved across reasonable parameter neighborhoods. This preservation of rank order is the property that legitimizes the comparison-oriented use of the Result workspace in the field, where between-session and between-dyad comparisons matter more than absolute values.
3.6. Comparison with the Motion Energy Analysis Convention
To position the deployed pipeline within the established synchrony literature, we applied the windowed cross-correlation convention of Motion Energy Analysis [41,42] to the same 25 dyads using the parameters those authors recommend (1-min non-overlapping windows, ±5 s maximum lag, absolute-value aggregation, 100 windows-wise pseudosynchrony surrogates).
Observed vs. pseudosynchrony. At the corpus level, observed MEA-style synchrony averaged 0.0736 ± 0.0093, and pseudosynchrony averaged 0.0654 ± 0.0048 (Figure 5e). The paired comparison was significant (t(24) = 3.76, p < .001; mean within-pair difference = +0.008; Cohen’s dz = 1.07). Within-pair effect sizes (each dyad’s observed value standardized by its own surrogate distribution) averaged Cohen’s d = +1.07 ± 1.11, with 21 of 25 dyads exceeding d = 0 and 17 of 25 exceeding d = 0.5.
Lack of cross-method rank-order convergence. Despite the agreement on group-level effect size, the per-dyad rank ordering produced by the two methods was essentially uncorrelated: the Pearson correlation between PDA Frequency and MEA |r| across the 25 dyads was r = +0.021 (p = 0.919; Figure 5f). Thus, the two methods agreed that synchrony exceeded chance at the group level but did not produce the same dyad ranking. This supports the view that distinct algorithmic families capture distinct facets of dyadic coordination [6,43].
3.7. Summary
The evaluation provides four deployment-relevant findings. First, the modified Kinect phase-difference pipeline detected repeated event-level synchrony in all 25 free-conversation dyads while preserving a near-zero Direction appropriate for role-free dialogue. Second, observed phase-difference metrics exceeded within-dyad surrogate controls, indicating temporal coordination above chance-level peak matching. Third, MEA-style cross-correlation applied to the same acceleration-magnitude signals also distinguished observed dyads from surrogate controls, aligning the present Kinect-derived signals with established nonverbal synchrony methodology. Fourth, dyad-level rank ordering was not shared by phase-difference and cross-correlation metrics, indicating complementary rather than interchangeable measures.
4. Discussion
4.1. Principal Findings
This article presented Synchrony Vision, an RGB-D sensor-based human motion analysis system for real-time monitoring and event-level analysis of interpersonal motion synchrony from markerless skeletal tracking. We described its sensing pipeline, signal-processing core, user interface, and deployment-condition evaluation. The contribution is twofold. On the system side, Synchrony Vision provides an operator-facing workflow that transforms RGB-D skeletal motion into acceleration-derived synchrony metrics while preserving exportable artifacts for external analysis. On the evidence side, the evaluation on 25 dyads of unconstrained Kinect-tracked free dialog (245,835 frames and 200.6 min wall-clock; 2,681 events; phase differences computed from Time.csv timestamps) showed that the four user-facing metrics behaved coherently in the deployment regime: the aggregated phase-difference distribution was unimodal and centered near zero, event density exceeded circular-surrogate baselines, and dyad ordering was preserved across reasonable parameter neighborhoods. These findings extend prior controlled-task and accelerometer-comparison validation [32] by showing that the system produces stable and interpretable outputs in the type of role-free, naturalistic interaction for which it is intended.
4.2. Interpretability, Robustness, and Ecological Validity of the User-Facing Metrics
The phase-difference analysis detected 2,681 synchrony events over 200.6 min of free conversation. This finding is important because the evaluation was not based on repeated, externally paced, or experimentally simplified rhythmic movements. Instead, the data were obtained from spontaneous, role-free dyadic conversations in which participants freely produced irregular and heterogeneous movement events, such as nods, posture shifts, listener responses, and speaking-related body movements. Nevertheless, Synchrony Vision produced interpretable Frequency, Direction, Width, and Strength values across all dyads, consistent with prior phase-difference synchrony features used in communication and clinical studies [39,40]. These results indicate that the system can extend phase-difference analysis to markerless, timestamp-aware, free-dialog measurement.
The four metrics provide complementary information for interpreting the Result workspace. Frequency indicates how often synchrony events occur and served as a reliable descriptor of event density across dyads, showing clear dyad-level variability and consistent behavior under parameter changes. Direction summarizes the average temporal lead–lag structure. Width captures the temporal dispersion of event timing, and Strength reflects the peakedness of the phase-difference distribution. Together, these metrics provide users with a multidimensional profile of interpersonal coordination rather than a single opaque synchrony score.
The parameter-robustness analyses further support field deployment. Although the absolute magnitude of Frequency changed predictably with the peak-detection threshold θ, smoothing window W, and pairing window , the rank order of dyads was preserved across reasonable parameter neighborhoods. This invariance is important because it means that the substantive conclusion that one dyad shows more frequent synchrony than another does not depend on a single arbitrary parameter setting. It also suggests that rating thresholds defined in the INI file can be calibrated once for a deployment context, such as a clinic or classroom, and reused across sessions rather than requiring per-session tuning by non-expert operators.
The present evaluation therefore extends the earlier system paper by focusing on the design and implementation of the user-facing interface layer and by evaluating whether the user-facing synchrony metrics behave coherently under naturalistic free-conversation conditions [32]. The prior publication documented the implemented computation core and its feasibility. In contrast, the present study addresses a dyad-level deployment question: whether the four user-facing summary metrics behave coherently in their distribution, relation to chance, parameter dependence, and comparison to alternative synchrony formulations when applied to long, unconstrained conversations. Together, the findings indicate that Synchrony Vision can bridge algorithmic implementation and practical deployment by preserving the interpretability of phase-difference metrics under naturalistic free-conversation conditions.
4.3. Relationship with MEA-Style Cross-Correlation
The Motion Energy Analysis (MEA) framework developed by Ramseyer and Tschacher [41,42] is one of the most widely used approaches for quantifying nonverbal synchrony from video, particularly in psychotherapy research. Its analytical core is windowed cross-correlation of movement time series, typically using non-overlapping 1-min windows, a maximum lag of ±5 s, absolute-value aggregation, and pseudosynchrony controls [41,42,43]. Across independent samples, MEA studies have consistently shown that observed interactions exhibit stronger synchrony than pseudo-interactions, with standardized within-pair effect sizes in the approximate range of d = 0.20–1.02 [41,42].
The present Kinect-based analysis reproduced this core MEA pattern using acceleration-derived movement signals. Applying the same general windowed cross-correlation logic to the z-scored, smoothed acceleration magnitudes yielded above-chance synchrony, with a corpus-mean within-pair effect size of d = 1.07. This value is in the same standardized range as canonical MEA reports, suggesting that the exported Kinect-derived acceleration signals can serve as a useful substrate for MEA-style analyses. However, the raw synchrony coefficients should not be directly equated across modalities because MEA uses frame-differenced pixel-change motion energy, whereas the present system uses three-dimensional acceleration magnitude derived from skeletal tracking. Thus, convergence should be interpreted at the level of standardized observed-versus-surrogate effect size, not at the level of absolute correlation magnitude.
At the same time, the phase-difference and MEA-style analyses did not produce the same dyad-level ranking. PDA Frequency was essentially uncorrelated with MEA |r| (r = +0.021, p = 0.919), indicating that the two methods agree that synchrony exceeds chance at the group level but disagree about which dyads are most synchronized. This pattern is consistent with prior evidence that different synchrony algorithms may show limited convergent validity and may capture distinct facets of dyadic coordination [6,43]. The phase-difference pipeline identifies discrete motion events and quantifies their millisecond-scale temporal alignment within a ±1.0 s pairing window. In contrast, MEA-style cross-correlation integrates movement covariation across longer 60-s windows and is more sensitive to sustained changes in movement energy. Therefore, the two approaches should be interpreted as complementary measurement surfaces rather than interchangeable estimates of a single synchrony construct.
This distinction has practical implications for system use. Researchers interested in the timing of discrete co-motion events, such as nods, gestural adjustments, postural shifts, or brief backchannel responses, should primarily use the phase-difference metrics exposed in the Result workspace. Researchers interested in slower, sustained dyadic coupling may instead use the exported acceleration files for MEA-style or other continuous-signal analyses. By exposing both interpretable phase-difference outputs and raw acceleration artifacts, Synchrony Vision supports multiple analytical lenses while clarifying what each method is expected to reveal.
4.4. Practical Implications
In clinical contexts, the system has potential value as a scalable tool for quantifying nonverbal social timing. Recent work using the phase-difference framework in autism spectrum disorder (ASD) showed that synchrony-related features can distinguish TD–TD and TD–ASD dyads not only in synchrony frequency, but also in temporal variability and coherence, suggesting that phase-based metrics may serve as behavioral markers of atypical social coordination [40]. The present system extends this line of work by implementing a markerless, real-time, operator-facing platform that can export the same type of interpretable synchrony information without requiring head-mounted or body-worn sensors. This is important because many clinical populations, including children with ASD, individuals with sensory sensitivities, and people undergoing rehabilitation, may find wearable devices intrusive or distracting. By preserving a natural interaction setting, Synchrony Vision could support clinical assessment, intervention monitoring, and longitudinal tracking of social communication behaviors. This longitudinal potential is particularly important because the same metrics can be repeatedly computed across sessions.
In human–robot interaction, the implications are also substantial. Social robots and interactive agents increasingly require the ability to detect whether a human partner is engaged, responsive, or temporally aligned with the system. A real-time synchrony monitoring system could provide a behavioral feedback channel for adaptive robot timing, allowing robots to adjust speech pacing, gesture timing, gaze behavior, or turn-taking behavior based on the user’s movement coordination. Because Synchrony Vision estimates synchrony from markerless skeletal data, it could be integrated into HRI testbeds without requiring users to wear sensors. This is especially important in educational robots, care robots, and rehabilitation robots, where the interaction itself should remain natural and low burden. Event-level phase-difference metrics could help evaluate whether a robot’s behavior elicits human co-motion, whether the robot interrupts natural timing, or whether synchrony improves as the robot adapts to the user.
Finally, the system’s exportable artifacts support reproducibility and methodological flexibility. Researchers can use the Result workspace for immediate interpretation, while also reanalyzing the exported participant-level acceleration data, frame-level timestamps, and synchrony outputs with independent pipelines. This is practically important because synchrony is a multidimensional construct rather than a single latent value. The present comparison with MEA-style analysis shows that different algorithms can agree at the observed-versus-surrogate level while producing different dyad-level rankings. Therefore, a useful deployment system should not force a single interpretation of synchrony, but should provide transparent outputs that support multiple analytical lenses. Synchrony Vision contributes to this goal by combining real-time usability, interpretable event-level metrics, and compatibility with established synchrony analysis frameworks.
4.5. Future Work
Three directions follow naturally from the present results. First, formal usability studies should be conducted with target user populations, including clinicians, teachers, and HRI researchers. These studies should examine whether the metric cards and the millisecond-scale histogram support the inferences that users want to draw, using standardized usability instruments and field-based task scenarios. Second, the dyad-level corpus reported here should be extended to additional populations and tasks, including unidirectional speaker–listener configurations and clinical groups, to characterize how the distributions of Frequency, Direction, Width, and Strength shift across contexts; preliminary results on autism spectrum disorder dyads using the same algorithmic family are already encouraging in this respect [40]. Third, future implementations should extend the sensing architecture beyond RGB-D skeletal tracking by integrating multimodal streams, such as audio-visual nonverbal behavior, multisensory interaction cues, and physiological signals. Such multimodal fusion may enable more comprehensive modeling of complex social dynamics than motion-based synchrony metrics alone [44,45,46,47]. Although the present implementation used Kinect v2, the architecture is not tied to a specific sensor model; future implementations can replace the sensing backend with currently available RGB-D cameras (e.g., Azure Kinect or Orbbec Femto Bolt), provided that temporally aligned skeletal-position or body-pose signals can be exported for acceleration and phase-difference analysis.
5. Conclusions
Synchrony Vision provides a markerless, operator-friendly platform for RGB-D sensor-based human motion analysis of interpersonal synchrony. By combining real-time monitoring, phase-difference analysis, and a two-workspace interface, the system allows non-expert users to move from measurement to interpretation without relying on complex offline processing. Its live tracking feedback, real-time acceleration visualization, millisecond-scale phase-difference histogram, four interpretable synchrony metrics, and exportable acceleration, timestamp, and synchrony artifacts support both immediate inspection and reproducible downstream analysis. The evaluation on Kinect-tracked free-dialog dyads confirmed that the system can generate interpretable synchrony outputs under naturalistic conversation conditions. Overall, Synchrony Vision demonstrates how RGB-D skeletal sensing can be extended from individual motion capture to event-level analysis of interpersonal motion coordination, providing a transparent and extensible platform for education, clinical, rehabilitation, and human-robot interaction research.
Supplementary Materials
Not applicable.
Author Contributions
Conceptualization, J.K.; methodology, J.K.; software, J.K.; validation, J.K.; formal analysis, J.K.; investigation, J.K.; resources, J.K.; data curation, J.K.; writing—original draft preparation, J.K.; writing—review and editing, J.K.; visualization, J.K.; supervision, J.K.; project administration, J.K.; funding acquisition, J.K. The author has read and agreed to the published version of the manuscript.
Funding
This research was funded by the Japan Society for the Promotion of Science (JSPS) KAKENHI, grant numbers 25K06395, 21K13726 and 16K16243.
Institutional Review Board Statement
The study was conducted in accordance with the Declaration of Helsinki and approved by the Ethics Committee of Kyoto University of Education (Approval No. 1805).
Informed Consent Statement
Informed consent was obtained from all subjects involved in the study.
Data Availability Statement
The processed dyad-level summary metrics and figure-generation data underlying the reported results are available from the corresponding author upon reasonable request. Raw participant motion data are not publicly distributed because of privacy restrictions associated with human interaction recordings.
Acknowledgments
The author thanks the participants who took part in the free-dialog recordings.
Conflicts of Interest
The author declares no conflict of interest. The funders had no role in the design of the study; in the collection, analyses, or interpretation of data; in the writing of the manuscript; or in the decision to publish the results.
References
- Xia, J.; Siochi, R.A. A real-time respiratory motion monitoring system using KINECT: Proof of concept. Med. Phys. 2012, 39, 2682–2685. [Google Scholar] [CrossRef]
- Zhou, H.; Hu, H. Human motion tracking for rehabilitation—A survey. Biomed. Signal Process. Control 2008, 3, 1–18. [Google Scholar]
- Wang, X.; Yu, H.; Kold, S.; Rahbek, O.; Bai, S. Wearable sensors for activity monitoring and motion control: A review. Biomim. Intell. Robot. 2023, 3, 100089. [Google Scholar] [CrossRef]
- Hall, J.A.; Horgan, T.G.; Murphy, N.A. Nonverbal communication. Annu. Rev. Psychol. 2019, 70, 271–294. [Google Scholar] [CrossRef]
- daSilva, E.B.; Wood, A. How and why people synchronize: An integrated perspective. Pers. Soc. Psychol. Rev. 2025, 29, 159–187. [Google Scholar] [CrossRef] [PubMed]
- Delaherche, E.; Chetouani, M.; Mahdhaoui, A.; Saint-Georges, C.; Viaux, S.; Cohen, D. Interpersonal synchrony: A survey of evaluation methods across disciplines. IEEE Trans. Affect. Comput. 2012, 3, 349–365. [Google Scholar] [CrossRef]
- Bernieri, F.J.; Reznick, J.S.; Rosenthal, R. Synchrony, pseudosynchrony, and dissynchrony: Measuring the entrainment process in mother-infant interactions. J. Pers. Soc. Psychol. 1988, 54, 243–253. [Google Scholar] [CrossRef]
- Kwon, J.; Ogawa, K.-I.; Ono, E.; Miyake, Y. Detection of nonverbal synchronization through phase difference in human com-munication. PLoS ONE 2015, 10, e0133881. [Google Scholar] [CrossRef]
- Vacharkulksemsuk, T.; Fredrickson, B.L. Strangers in sync: Achieving embodied rapport through shared movements. J. Exp. Soc. Psychol. 2012, 48, 399–402. [Google Scholar] [CrossRef] [PubMed]
- Hove, M.J.; Risen, J.L. It’s all in the timing: Interpersonal synchrony increases affiliation. Soc. Cogn. 2009, 27, 949–960. [Google Scholar] [CrossRef]
- Miles, L.K.; Nind, L.K.; Macrae, C.N. The rhythm of rapport: Interpersonal synchrony and social perception. J. Exp. Soc. Psychol. 2009, 45, 585–589. [Google Scholar] [CrossRef]
- Cirelli, L.K. How interpersonal synchrony facilitates early prosocial behavior. Curr. Opin. Psychol. 2018, 20, 35–39. [Google Scholar] [CrossRef]
- Wiltermuth, S.S.; Heath, C. Synchrony and cooperation. Psychol. Sci. 2009, 20, 1–5. [Google Scholar] [CrossRef]
- Rennung, M.; Göritz, A.S. Prosocial consequences of interpersonal synchrony: A meta-analysis. Z. Psychol. 2016, 224, 168–189. [Google Scholar] [CrossRef] [PubMed]
- Koole, S.L.; Tschacher, W. Synchrony in psychotherapy: A review and an integrative framework for the therapeutic alliance. Front. Psychol. 2016, 7, 862. [Google Scholar] [CrossRef]
- Valdesolo, P.; DeSteno, D. Synchrony and the social tuning of compassion. Emotion 2011, 11, 262–266. [Google Scholar] [CrossRef]
- Cirelli, L.K.; Einarson, K.M.; Trainor, L.J. Interpersonal synchrony increases prosocial behavior in infants. Dev. Sci. 2014, 17, 1003–1011. [Google Scholar] [CrossRef] [PubMed]
- Mogan, R.; Fischer, R.; Bulbulia, J. To be in synchrony or not? A meta-analysis of synchrony’s effects on behavior, perception, cognition and affect. J. Exp. Soc. Psychol. 2017, 72, 13–20. [Google Scholar] [CrossRef]
- Menolotto, M.; Komaris, D.-S.; Tedesco, S.; O’Flynn, B.; Walsh, M. Motion capture technology in industrial applications: A systematic review. Sensors 2020, 20, 5687. [Google Scholar] [CrossRef]
- Robert-Lachaine, X.; Mecheri, H.; Müller, A.; Larue, C.; Plamondon, A. Validation of a low-cost inertial motion capture system for whole-body motion analysis. J. Biomech. 2020, 99, 109520. [Google Scholar]
- Longo, U.G.; De Salvatore, S.; Carnevale, A.; Tecce, S.M.; Bandini, B.; Lalli, A.; Schena, E.; Denaro, V. Optical motion capture systems for 3D kinematic analysis in patients with shoulder disorders. Int. J. Environ. Res. Public Health 2022, 19, 12033. [Google Scholar] [CrossRef]
- Niu, J.; Wang, X.; Wang, D.; Ran, L. A novel method of human joint prediction in an occlusion scene by using low-cost motion capture technique. Sensors 2020, 20, 1119. [Google Scholar] [CrossRef]
- Liu, S.; Zhang, J.; Zhang, Y.; Zhu, R. A wearable motion capture device able to detect dynamic motion of human limbs. Nat. Commun. 2020, 11, 5615. [Google Scholar] [CrossRef] [PubMed]
- Wade, L.; Needham, L.; McGuigan, P.; Bilzon, J. Applications and limitations of current markerless motion capture methods for clinical gait biomechanics. PeerJ 2022, 10, e12995. [Google Scholar] [CrossRef]
- Filippeschi, A.; Schmitz, N.; Miezal, M.; Bleser, G.; Ruffaldi, E.; Stricker, D. Survey of motion tracking methods based on inertial sensors: A focus on upper limb human motion. Sensors 2017, 17, 1257. [Google Scholar] [CrossRef]
- Shotton, J.; Fitzgibbon, A.; Cook, M.; Sharp, T.; Finocchio, M.; Moore, R.; Kipman, A.; Blake, A. Real-time human pose recog-nition in parts from single depth images. In Proceedings of the IEEE Conference on Computer Vision and Pattern Recognition, Colorado Springs, CO, USA, 20–25 June 2011; pp. 1297–1304. [Google Scholar] [CrossRef]
- Zhang, Z. Microsoft Kinect sensor and its effect. IEEE Multimed. 2012, 19, 4–10. [Google Scholar] [CrossRef]
- Wang, L.; Huynh, D.Q.; Koniusz, P. A comparative review of recent Kinect-based action recognition algorithms. IEEE Trans. Image Process. 2020, 29, 15–28. [Google Scholar]
- Milosevic, B.; Leardini, A.; Farella, E. Kinect and wearable inertial sensors for motor rehabilitation programs at home: State of the art and an experimental comparison. Biomed. Eng. Online 2020, 19, 25. [Google Scholar] [CrossRef]
- Kurillo, G.; Hemingway, E.; Cheng, M.L.; Cheng, L. Evaluating the accuracy of the Azure Kinect and Kinect v2. Sensors 2022, 22, 2469. [Google Scholar] [CrossRef] [PubMed]
- Tölgyessy, M.; Dekan, M.; Chovanec, Ľ.; Hubinský, P. Evaluation of the Azure Kinect and its comparison to Kinect v1 and Kinect v2. Sensors 2021, 21, 413. [Google Scholar] [CrossRef]
- Kwon, J. Synchrony Vision: Capturing body motion synchrony through phase difference using the Kinect. IEEE Access 2025, 13, 41658–41669. [Google Scholar] [CrossRef]
- Nielsen, J.; Molich, R. Heuristic evaluation of user interfaces. In Proceedings of the SIGCHI Conference on Human Factors in Computing Systems, Seattle, WA, USA, 1–5 April 1990; pp. 249–256. [Google Scholar] [CrossRef]
- Nielsen, J. Finding usability problems through heuristic evaluation. In Proceedings of the SIGCHI Conference on Human Factors in Computing Systems, Monterey, CA, USA, 3–7 May 1992; pp. 373–380. [Google Scholar]
- Otte, K.; Kayser, B.; Mansow-Model, S.; Verrel, J.; Paul, F.; Brandt, A.U.; Schmitz-Hübsch, T. Accuracy and reliability of the Kinect version 2 for clinical measurement of motor function. PLoS ONE 2016, 11, e0166532. [Google Scholar] [CrossRef]
- Tölgyessy, M.; Dekan, M.; Chovanec, Ľ. Skeleton tracking accuracy and precision evaluation of Kinect v1, Kinect v2, and the Azure Kinect. Appl. Sci. 2021, 11, 5756. [Google Scholar] [CrossRef]
- Giancola, S.; Valenti, M.; Sala, R. A Survey on 3D Cameras: Metrological Comparison of Time-of-Flight, Structured-Light and Active Stereoscopy Technologies; Springer: Cham, Switzerland, 2018. [Google Scholar] [CrossRef]
- Wang, Q.; Kurillo, G.; Ofli, F.; Bajcsy, R. Evaluation of pose tracking accuracy in the first and second generations of Microsoft Kinect. In Proceedings of the 2015 IEEE International Conference on Healthcare Informatics (ICHI), Dallas, TX, USA, 21–23 October 2015; pp. 380–389. [Google Scholar] [CrossRef]
- Kwon, J.; Kotani, H. Head motion synchrony in unidirectional and bidirectional verbal communication. PLoS ONE 2023, 18, e0286098. [Google Scholar] [CrossRef]
- Kwon, J.; Kotani, H. Quantifying body motion synchrony in autism spectrum disorder using a phase difference detection al-gorithm: Toward a novel behavioral biomarker. Diagnostics 2025, 15, 1268. [Google Scholar] [CrossRef] [PubMed]
- Ramseyer, F.T.; Tschacher, W. Nonverbal synchrony in psychotherapy: Coordinated body movement reflects relationship quality and outcome. J. Consult. Clin. Psychol. 2011, 79, 284–295. [Google Scholar] [CrossRef] [PubMed]
- Ramseyer, F.T. Motion energy analysis (MEA): A primer on the assessment of motion from video. J. Couns. Psychol. 2020, 67, 536–549. [Google Scholar] [CrossRef] [PubMed]
- Moulder, R.G.; Boker, S.M.; Ramseyer, F.; Tschacher, W. Determining synchrony between behavioral time series: An application of surrogate data generation for establishing falsifiable null-hypotheses. Psychol. Methods 2018, 23(4), 757–773. [Google Scholar] [CrossRef]
- Kwon, J.; Park, S.; Sakamoto, M.; Mito, K. The effects of vibratory frequency and temporal interval on tactile apparent motion. IEEE Trans. Haptics 2021, 14(3), 675–679. [Google Scholar] [CrossRef]
- Kwon, J.; Miyake, Y. Motion-binding property contributes to accurate temporal-order perception in audiovisual synchrony. Multisens. Res. 2023, 36(6), 557–572. [Google Scholar] [CrossRef]
- Hao, Q.; Ogata, T.; Ogawa, K.-I.; Kwon, J.; Miyake, Y. The simultaneous perception of auditory–tactile stimuli in voluntary movement. Front. Psychol. 2015, 6, 1429. [Google Scholar] [CrossRef] [PubMed]
- Kwon, J.; Ogawa, K.-I.; Miyake, Y. The effect of visual apparent motion on audiovisual simultaneity. PLoS ONE 2014, 9(10), e110224. [Google Scholar]
Figure 1.
Overview of Synchrony Vision: (top) trade-offs of conventional synchrony measurement methods; (middle) Capture–Analyze–Visualize workflow from RGB-D sensing to phase-difference analytics and UI feedback; (bottom) four deployment-oriented synchrony metrics (Frequency, Direction, Width, Strength) and deployment-evaluation context for the present study.
Figure 1.
Overview of Synchrony Vision: (top) trade-offs of conventional synchrony measurement methods; (middle) Capture–Analyze–Visualize workflow from RGB-D sensing to phase-difference analytics and UI feedback; (bottom) four deployment-oriented synchrony metrics (Frequency, Direction, Width, Strength) and deployment-evaluation context for the present study.
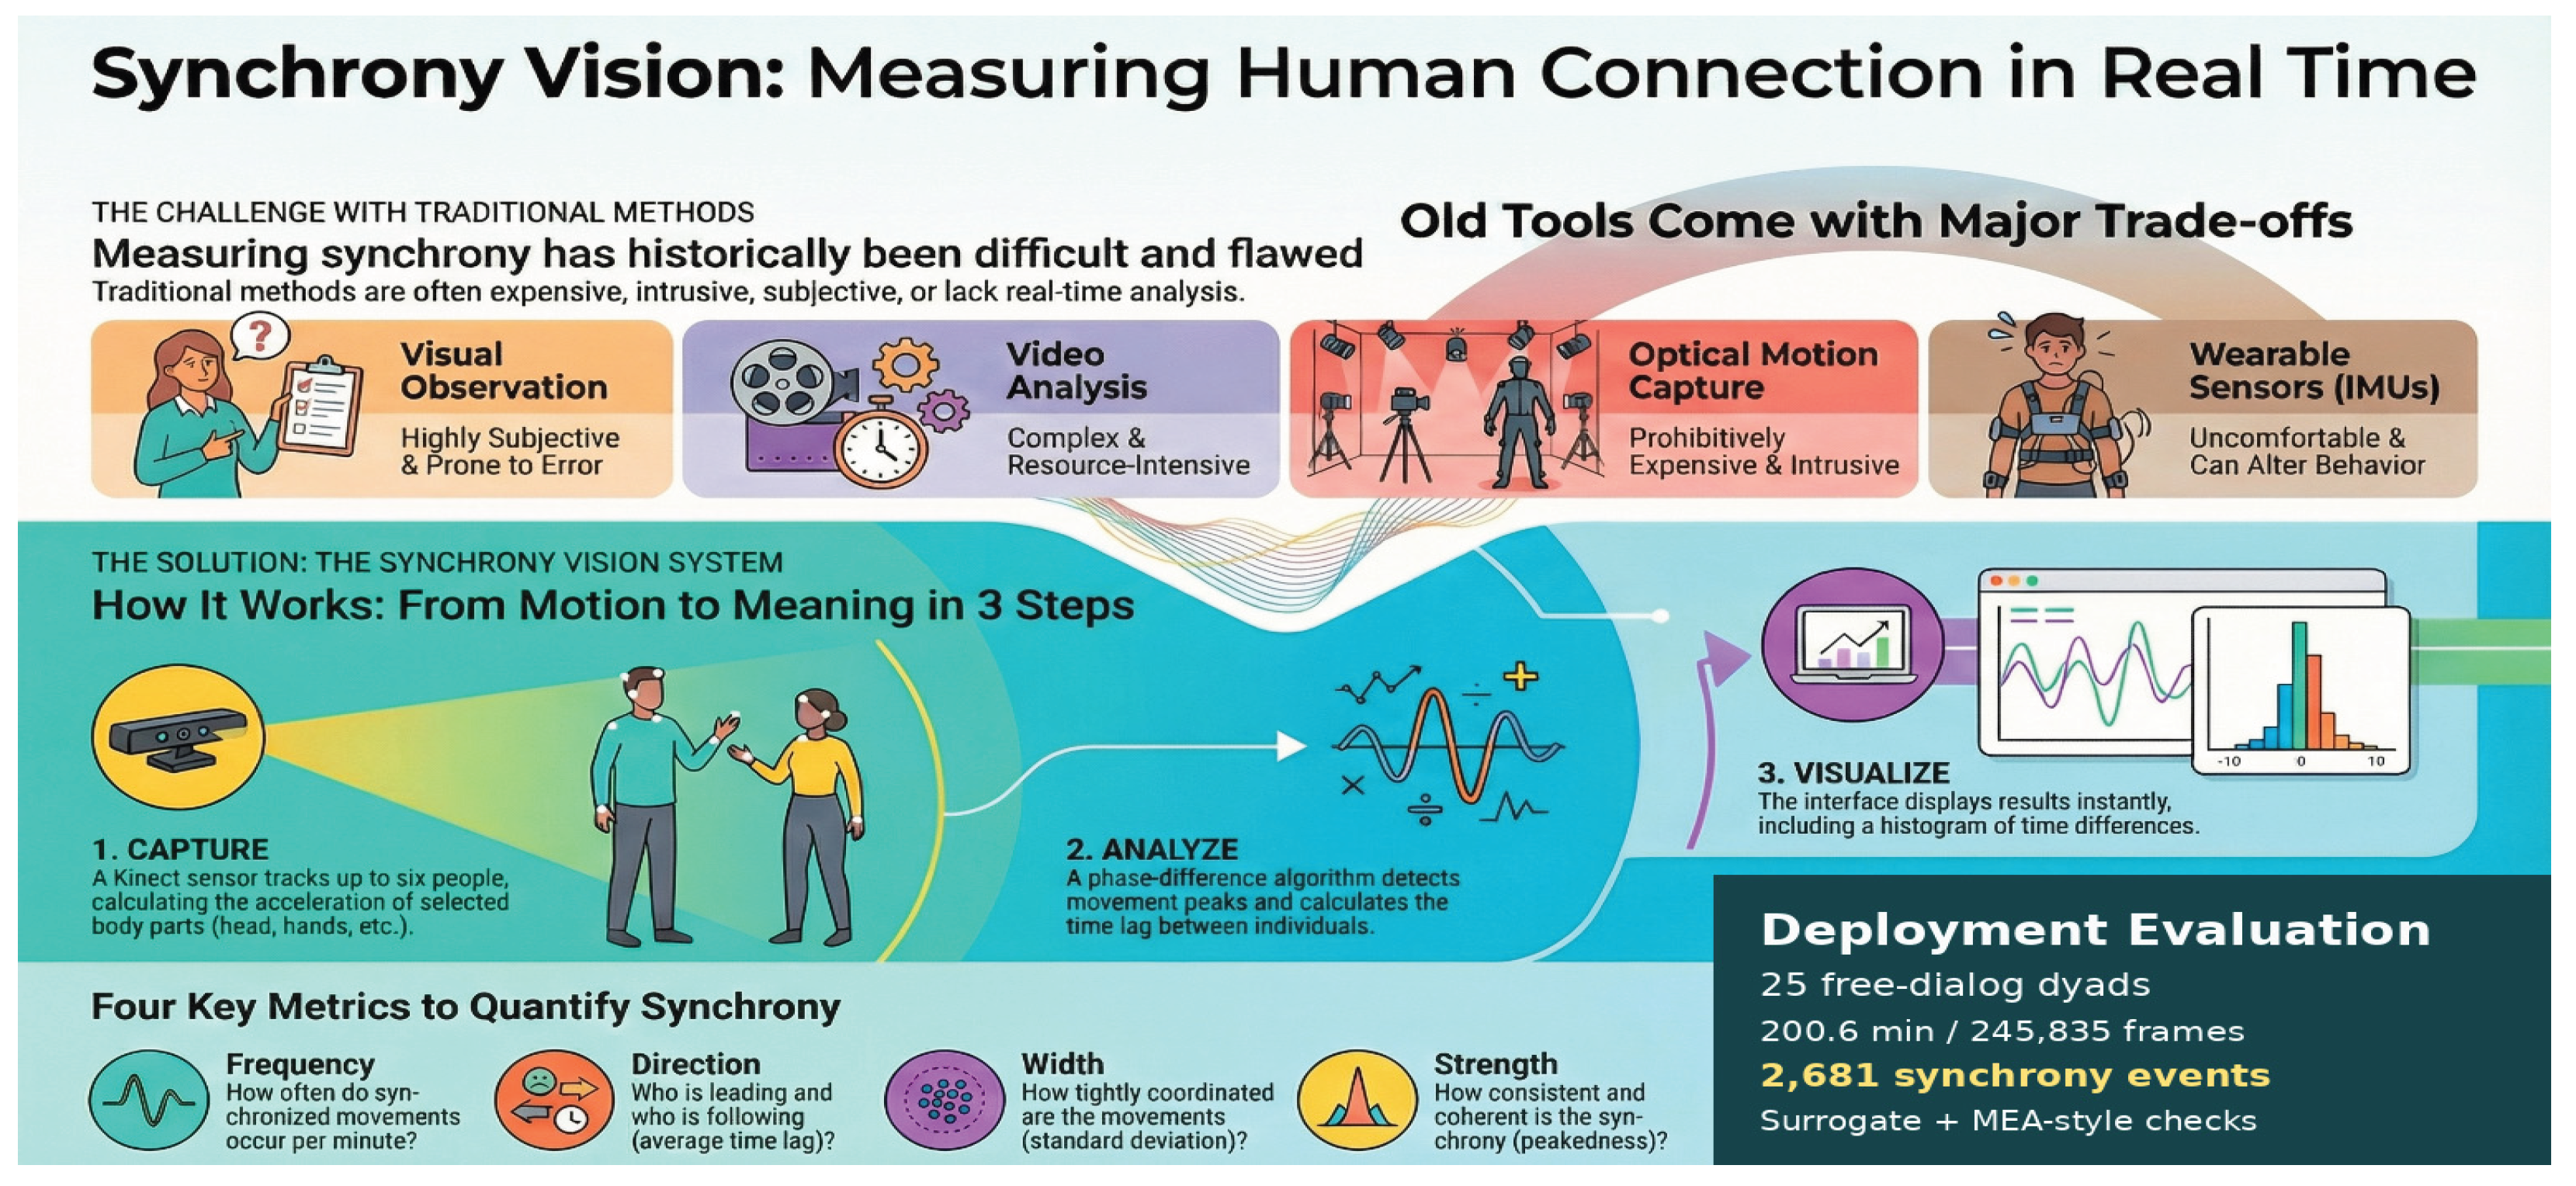
Figure 2.
Measurement workspace of Synchrony Vision (annotated screenshot). The Measurement screen integrates a live RGB-D camera view with tracking overlays, real-time acceleration traces for selected joints, recording controls with a persistent REC indicator, per-subject joint-selection controls, graph-scale controls, and a time-stamped system log for in-situ status monitoring and troubleshooting during capture.
Figure 2.
Measurement workspace of Synchrony Vision (annotated screenshot). The Measurement screen integrates a live RGB-D camera view with tracking overlays, real-time acceleration traces for selected joints, recording controls with a persistent REC indicator, per-subject joint-selection controls, graph-scale controls, and a time-stamped system log for in-situ status monitoring and troubleshooting during capture.
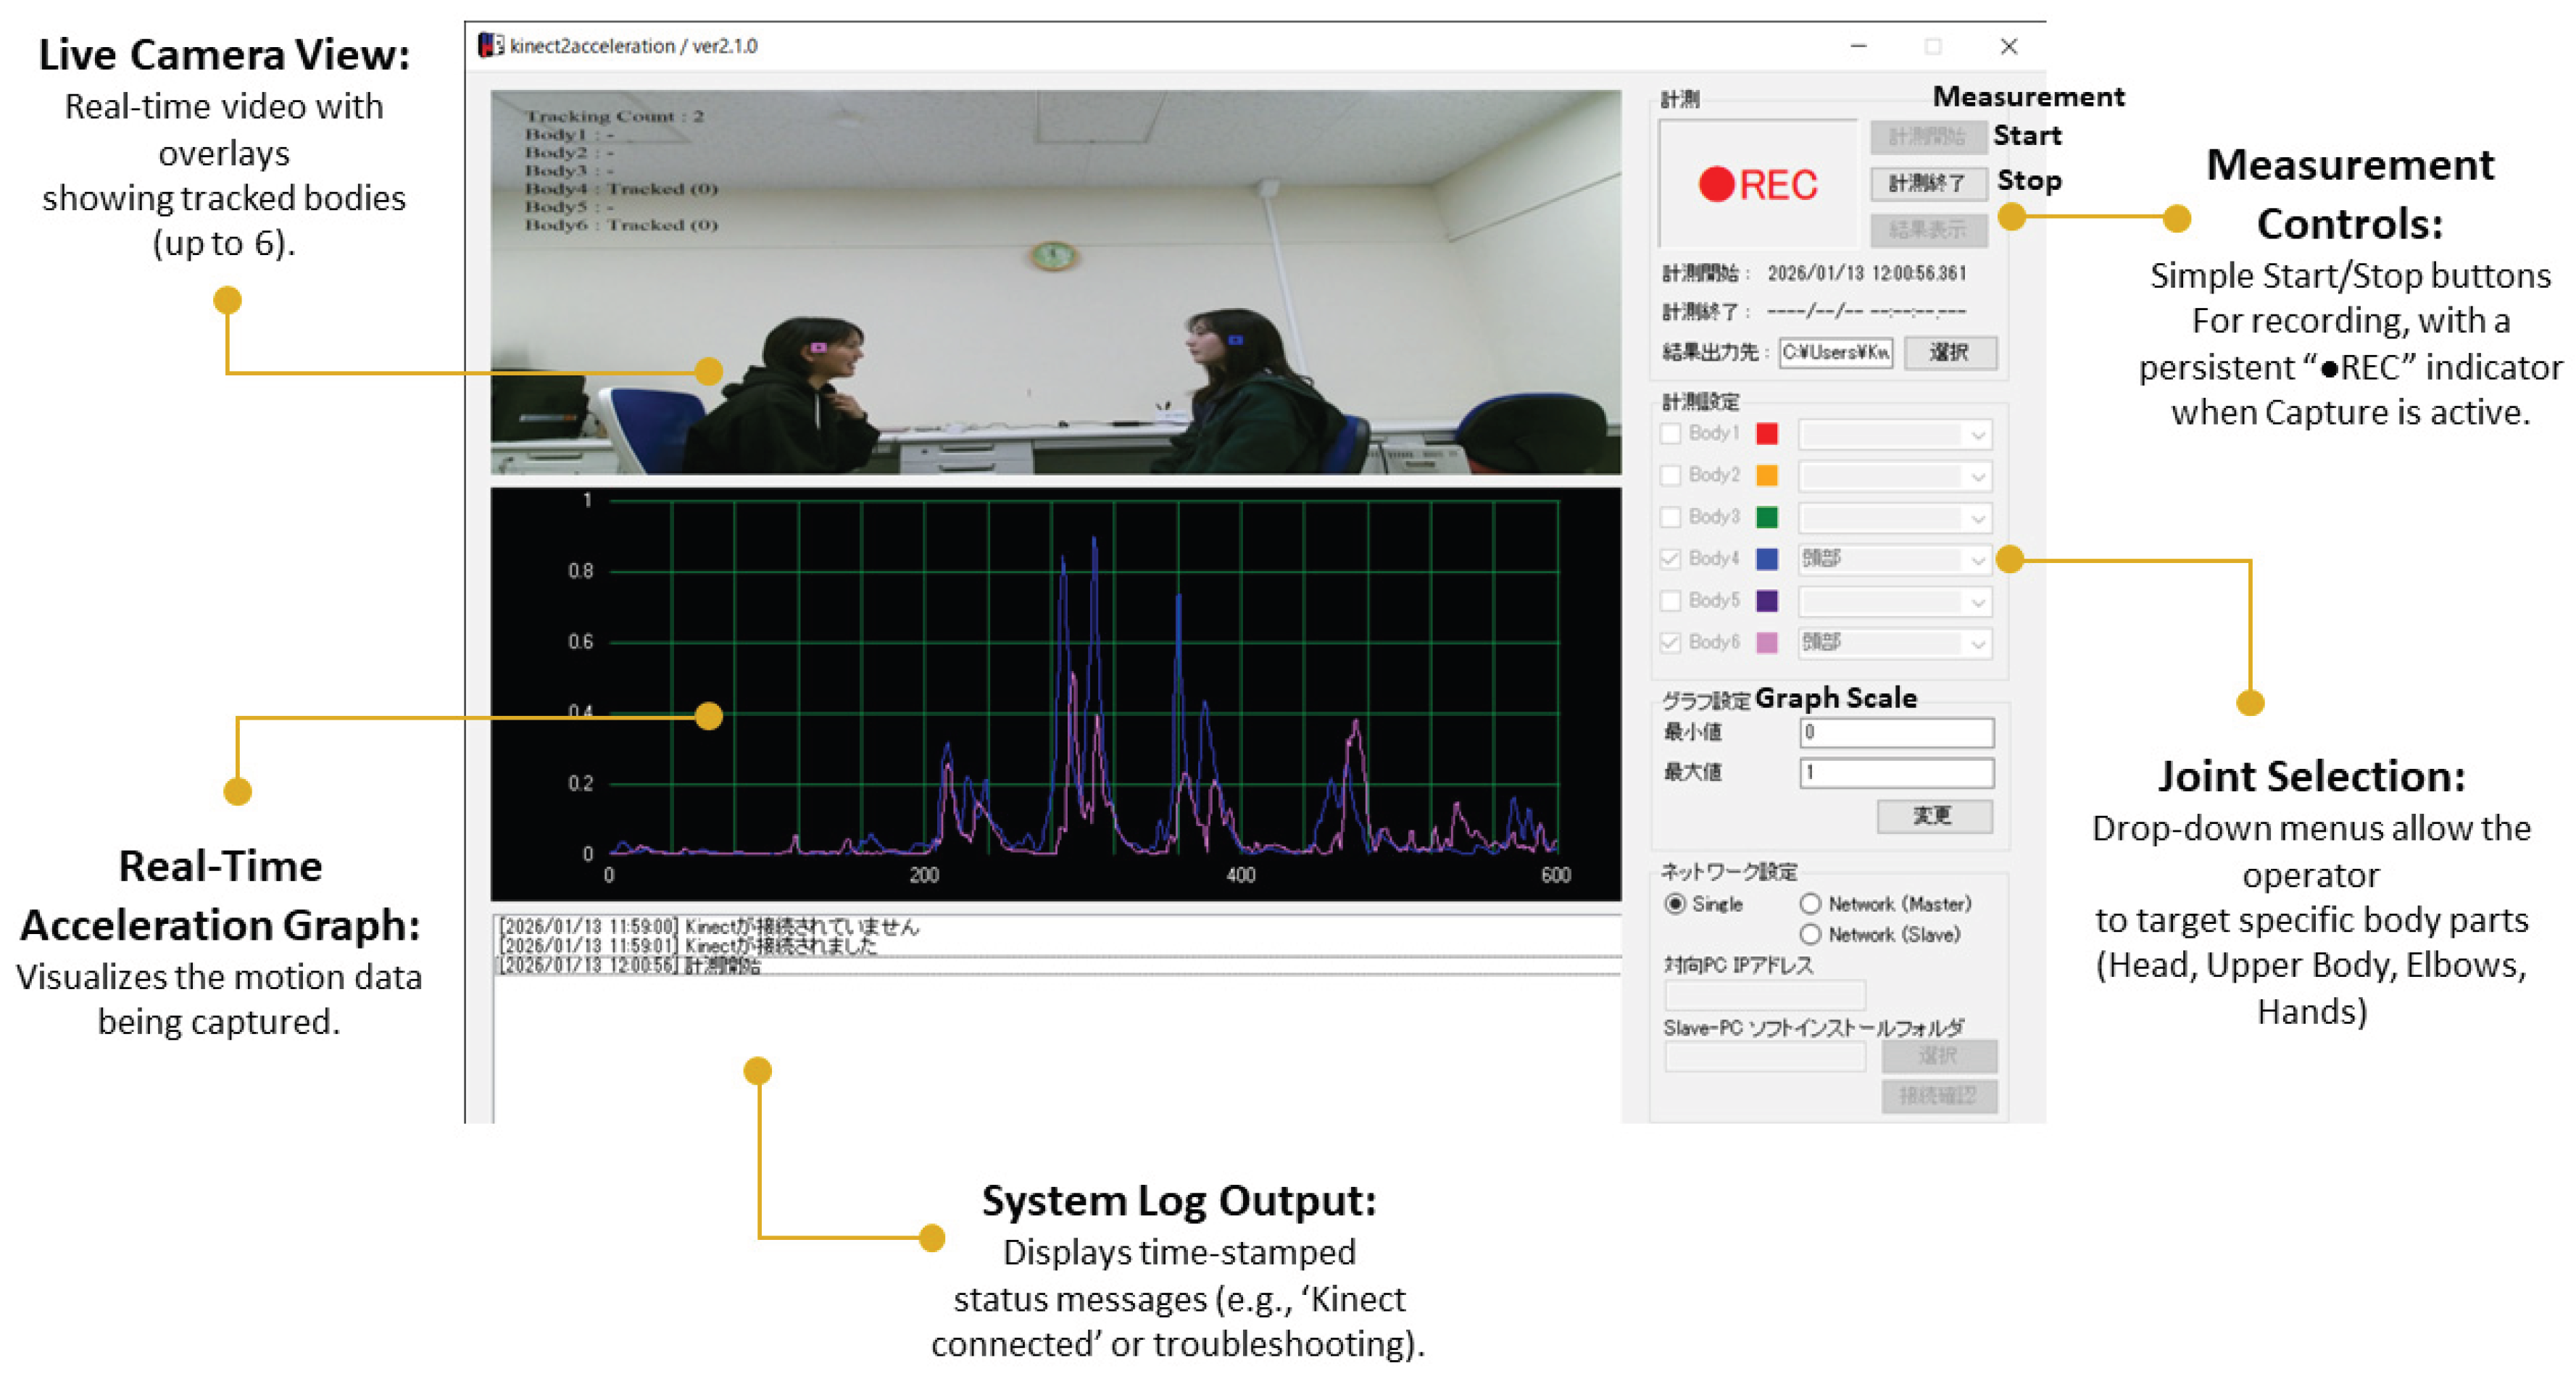
Figure 3.
Result workspace of Synchrony Vision (annotated screenshot). After recording, the Result screen summarizes session context and presents four deployment-oriented synchrony metrics—Frequency/Activity, Direction, Width, and Strength—together with a millisecond-scale phase-difference histogram and export controls for acceleration, timing, peak-pairing, and summary artifacts.
Figure 3.
Result workspace of Synchrony Vision (annotated screenshot). After recording, the Result screen summarizes session context and presents four deployment-oriented synchrony metrics—Frequency/Activity, Direction, Width, and Strength—together with a millisecond-scale phase-difference histogram and export controls for acceleration, timing, peak-pairing, and summary artifacts.
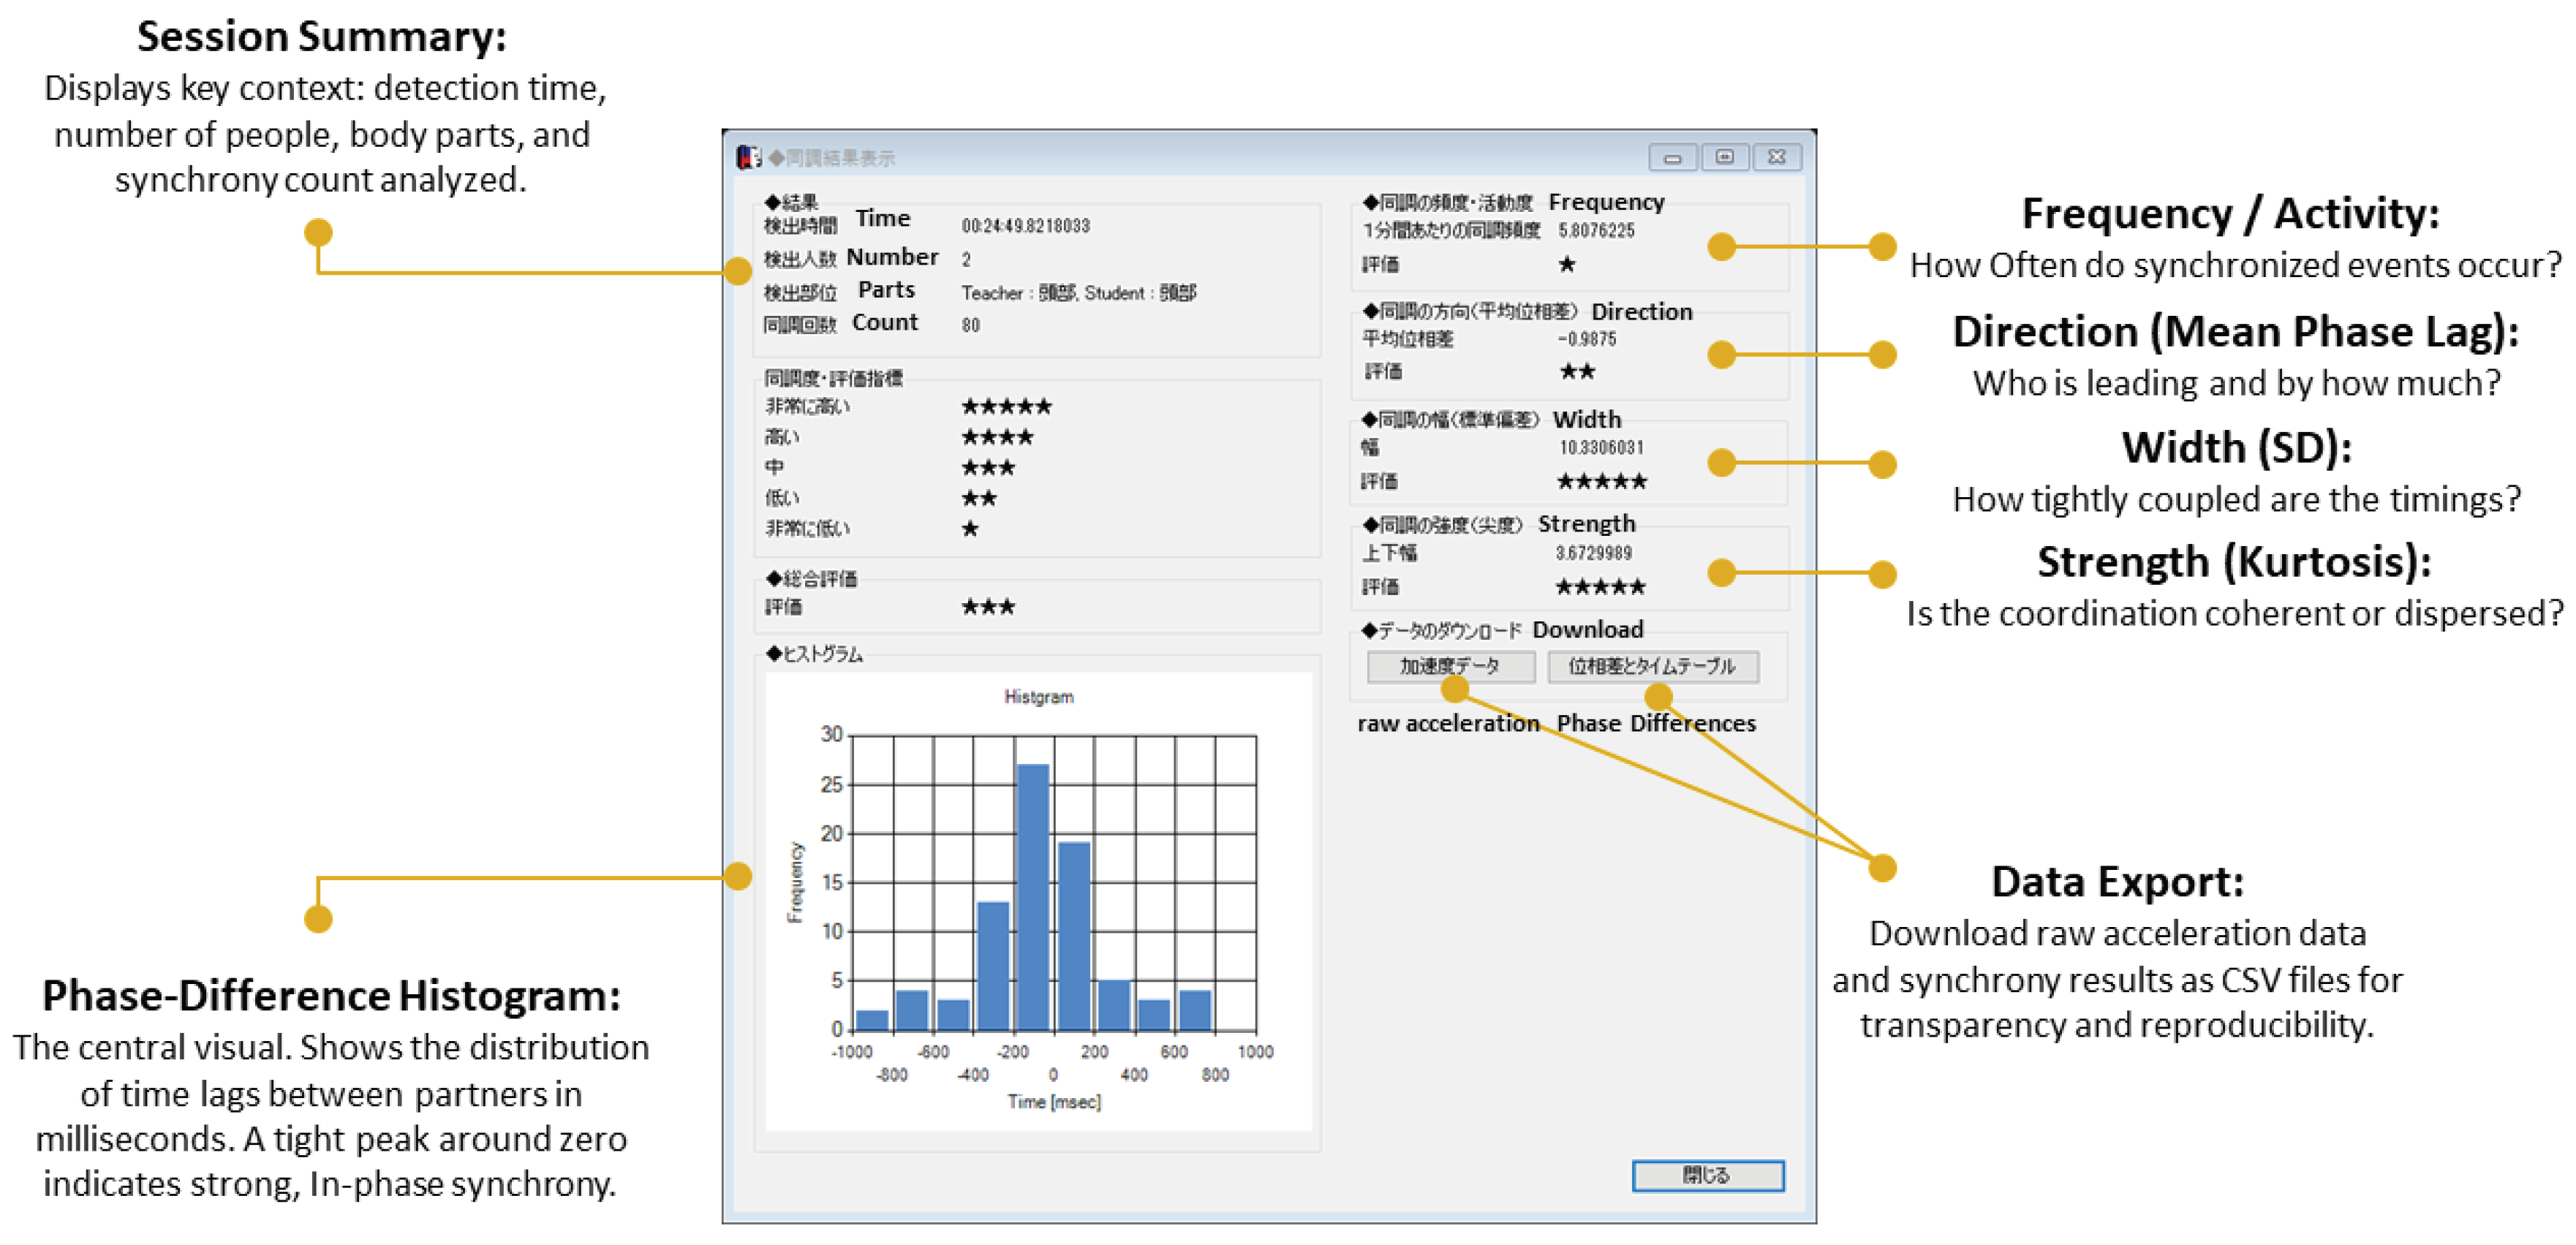
Figure 4.
Configuration Verifier (pre-flight check screen). The verifier reports system readiness for Kinect operation by checking configuration definitions, operating system, CPU cores, physical memory, graphics processor, USB controller bandwidth, device connection status, Kinect software installation, and availability of depth/color streams, using pass/warn/fail indicators to support rapid diagnosis before running the application.
Figure 4.
Configuration Verifier (pre-flight check screen). The verifier reports system readiness for Kinect operation by checking configuration definitions, operating system, CPU cores, physical memory, graphics processor, USB controller bandwidth, device connection status, Kinect software installation, and availability of depth/color streams, using pass/warn/fail indicators to support rapid diagnosis before running the application.
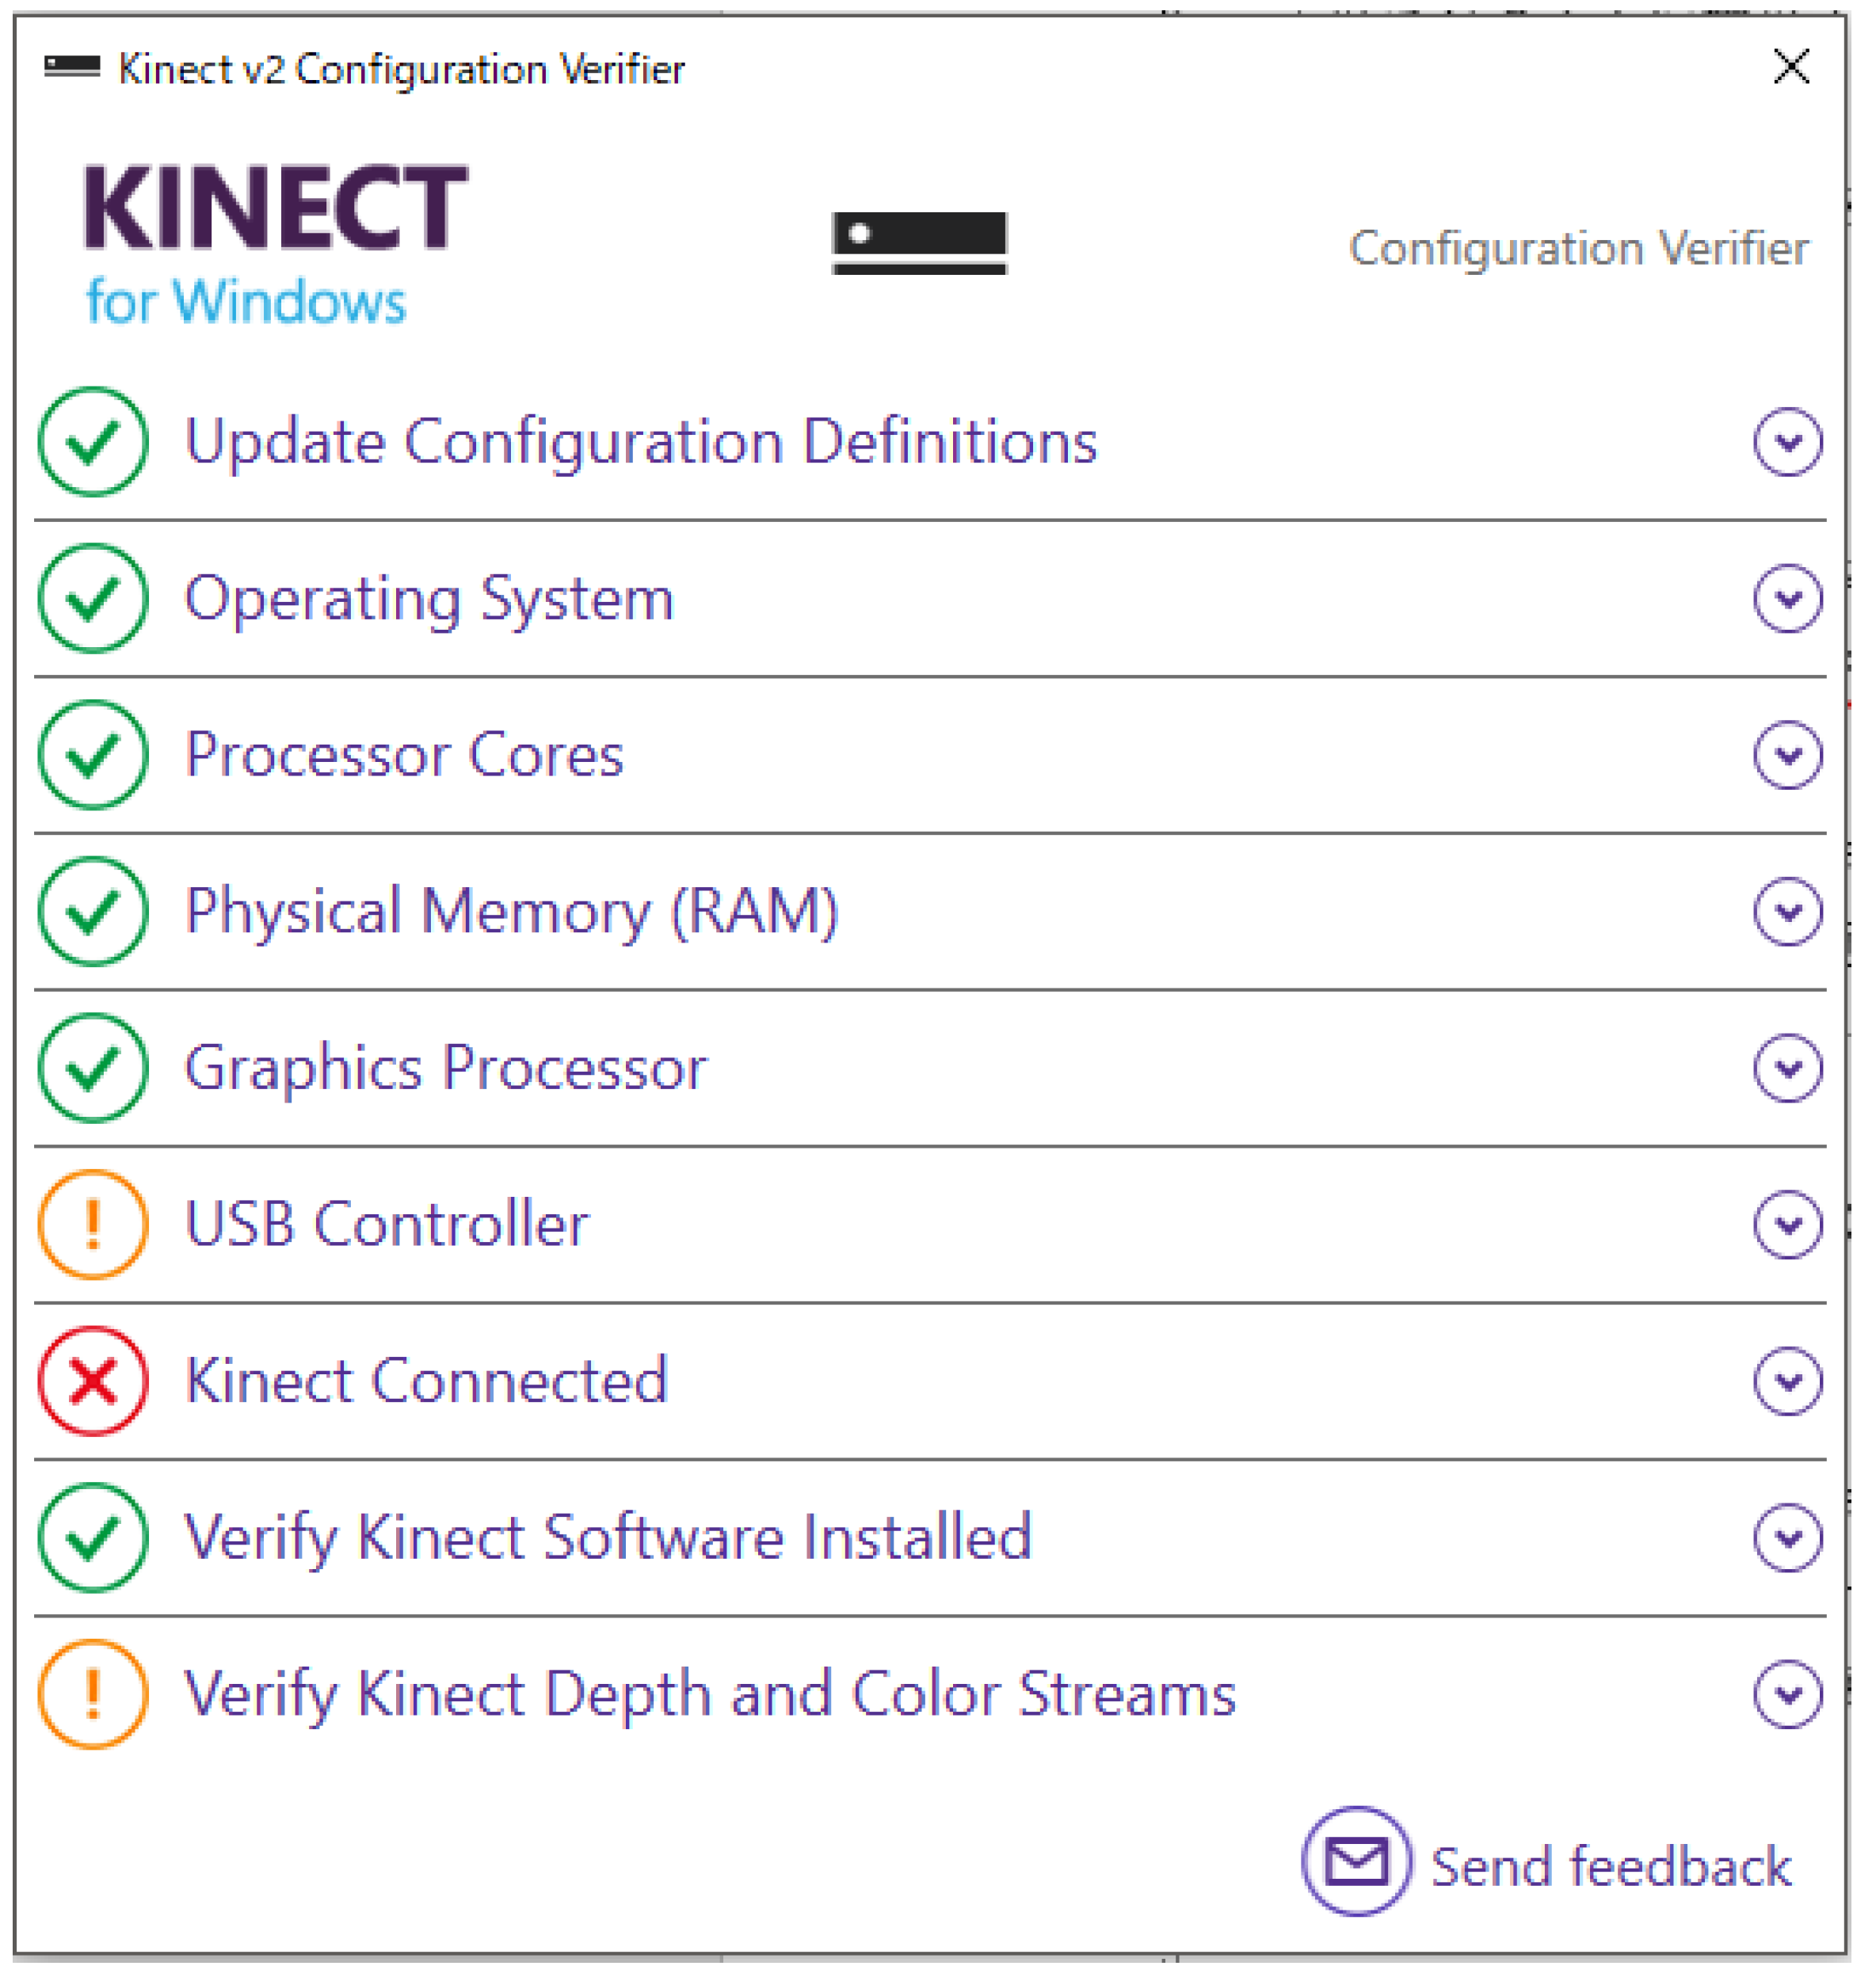
Figure 5.
Deployment-condition evaluation of Synchrony Vision on 25 Kinect-tracked free-dialog dyads. (a) Aggregated distribution of signed phase differences across 2,681 detected synchrony events, computed using wall-clock timestamps from Time.csv. (b) Per-dyad observed synchrony density compared with the mean +/- SD of 200 within-dyad circular-surrogate baselines; observed density generally exceeded the surrogate baseline. (c) Sensitivity of Frequency to the peak-detection threshold theta across [0.10, 0.50]. (d) Sensitivity of Frequency to the maximum pairing window across [0.5, 2.0 s]. (e) Motion Energy Analysis (MEA)-style windowed cross-correlation on the same 25 dyads, comparing observed synchrony with 100 window-wise pseudosynchrony surrogates using 1-min non-overlapping windows and a +/-5 s maximum lag. (f) Cross-method dyad-level relationship between phase-difference Frequency and MEA |r|, showing minimal rank-order convergence (r = +0.021, p = 0.919).
Figure 5.
Deployment-condition evaluation of Synchrony Vision on 25 Kinect-tracked free-dialog dyads. (a) Aggregated distribution of signed phase differences across 2,681 detected synchrony events, computed using wall-clock timestamps from Time.csv. (b) Per-dyad observed synchrony density compared with the mean +/- SD of 200 within-dyad circular-surrogate baselines; observed density generally exceeded the surrogate baseline. (c) Sensitivity of Frequency to the peak-detection threshold theta across [0.10, 0.50]. (d) Sensitivity of Frequency to the maximum pairing window across [0.5, 2.0 s]. (e) Motion Energy Analysis (MEA)-style windowed cross-correlation on the same 25 dyads, comparing observed synchrony with 100 window-wise pseudosynchrony surrogates using 1-min non-overlapping windows and a +/-5 s maximum lag. (f) Cross-method dyad-level relationship between phase-difference Frequency and MEA |r|, showing minimal rank-order convergence (r = +0.021, p = 0.919).
Disclaimer/Publisher’s Note: The statements, opinions and data contained in all publications are solely those of the individual author(s) and contributor(s) and not of MDPI and/or the editor(s). MDPI and/or the editor(s) disclaim responsibility for any injury to people or property resulting from any ideas, methods, instructions or products referred to in the content. |
© 2026 by the authors. Licensee MDPI, Basel, Switzerland. This article is an open access article distributed under the terms and conditions of the Creative Commons Attribution (CC BY) license (http://creativecommons.org/licenses/by/4.0/).
Copyright: This open access article is published under a Creative Commons CC BY 4.0 license, which permit the free download, distribution, and reuse, provided that the author and preprint are cited in any reuse.