

Submitted:
12 August 2026
Posted:
13 August 2026
You are already at the latest version
Abstract
This study evaluated spatial patterns and trends in surface urban heat island intensities (SUHIIs) across three major cities in Alabama, USA: Huntsville, Birmingham, and Mobile. Spatial expansion of developed areas and magnitudes and trends of SUHIIs were mapped and quantified using land-use/land-cover (LULC) data from the National Land Cover Database (NLCD) and land-surface temperature (LST) products from the Moderate Resolution Imaging Spectroradiometer (MODIS), respectively. Our findings reveal urban expansion over all three study areas, but at varying rates and patterns, with the highest rates observed over the Huntsville city area. The ISODATA clustering approach using LST time series mapped surface urban heat islands (SUHIs) as distinguished clusters of significantly (p=0.01) warmer surface temperatures compared to their surrounding non-urban areas. The SUHI clusters also resembled spatial distributions of NLCD-developed LULCs, with the highest resemblance between NLCD-developed LULC clusters and SUHI clusters mapped using summer daytime time series. Our SUHIIs estimated using the derived SUHI clusters correspond well with the values reported in SUHI literature. Yearly seasonal average SUHIIs varied significantly (p = 0.05) among the three study areas and during seasonal and diurnal cycles. However, SUHIIs during summer daytime were consistently larger across all sites and throughout the study period. During both seasons (winter and summer) and over all sites, the highest SUHIIs were reported over the SUHI-3 clusters that resembled high-intensity developed areas. These findings indicate novel insights suggesting our ISODATA clustering approach using time series of satellite-derived LST products is a promising approach for local-scale mapping and characterization of SUHIs. Our findings also provide detailed insights for improved understanding of the spatial distributions and temporal variations of SUHI developments over similar, less studied, but rapidly developing mid-size cities.
Keywords:
SUHII
; urbanization
; ISODATA clustering
; MODIS LST
; NLCD LULC
1. Introduction
Urbanization has emerged as one of the most transformative human activities on Earth’s surface, significantly influencing urban microclimates, environmental sustainability, and human well-being [1]. One of the most prominent consequences of rapid urban development is the urban heat island (UHI) effect, which explains relatively warmer temperatures over urban and suburban areas than their surrounding rural environments [2]. This temperature contrast is explained by complex interactions among land-cover change, surface material properties, urban geometry, and anthropogenic heat emissions, which collectively affect thermal energy interactions within cities [3]. As urbanization replaces vegetation and water bodies with impervious materials, the cooling effects through evapotranspiration and shading are decreased [4,5]. Vegetation loss weakens natural temperature regulation, causing urban areas to warm more rapidly and cool more slowly than surrounding rural landscapes [5]. Urban morphology further amplifies this effect, as dense building configurations and narrow street canyons restrict air circulation and trap heat, particularly at night [8,9]. Anthropogenic heat emissions from transportation, industrial activity, and cooling systems also intensify UHI effects by directly releasing waste heat into the urban atmosphere [10]. Together, these factors represent the core physical mechanisms driving UHI development [1,2]. Direct effects of UHI development include alterations to microclimates in urban areas. Among other microclimate alterations, elevated surface temperatures and more intense heat waves over urban areas are known to threaten the operation and habitability of rapidly developing cities.
UHI effects can be quantified using both air- and surface-temperature estimates. With recent advancements in satellite technologies and satellite data-driven approaches, remotely sensed land surface temperature (LST) products have become increasingly available across variable spatial and temporal scales. These products enable multi-decadal analyses to detect and quantify spatial and temporal variations and patterns in urban microclimates of rapidly developing cities [5,10,11]. UHIs can be of two types: (1) when the canopy layer/boundary layer temperature is of concern (canopy urban heat islands or boundary urban heat islands, respectively), and (2) when the radiative transfer of heat from the surfaces of different materials is estimated (surface urban heat islands—SUHIs). Remotely sensed LSTs, more specifically satellite-derived LSTs, are sensitive to the radiative skin temperature of the Earth’s surface and measure the thermal radiation emitted directly from the ground, vegetation, and built surfaces. Due to extensive spatial and temporal coverage and strong comparability, remote sensing technology has increasingly become the primary tool for SUHI studies [13,14]. Continuous spatial coverage of satellite-derived LST products also enables us to quantify UHI intensities (UHIIs) by capturing LST contrast between urban areas and their surrounding rural ones [15].
UHII is the most extensively used quantitative estimate of the UHI effect [16,17]. While UHII estimates generally rely on in-situ air temperature measurements, extensive use of remotely sensed LST data is more popular in recent scientific literature on SUHII studies [16,18]. Many studies using remotely sensed LST and LULC products estimated SUHIIs as the LST difference between pixels mapped as developed LULCs and their surrounding non-developed reference areas [19]. Precise mapping of SUHIs and estimates of SUHIIs, however, demand accurate LULC classifications [20,21]. In recent times, much public domain LULC data has become available from multiple sources. Among others, National Land Cover Database (NLCD) LULC products derived using Landsat data are a popular choice in studies over the conterminous United States, primarily due to their finer resolution (30m), spatial as well as temporal coverage (i.e., available for the conterminous United States as annual LULC products [22,23]). Among others, MODIS-derived LST products, being readily available with high spatial and temporal coverage, have been a popular choice in SUHI studies at local, regional, and global scales [16,18,19,20,24,25,26,27,28,29]. The most popular application of remotely sensed LULC products in UHI literature is for defining urban areas and their surrounding non-urban reference areas, while LST products were used to quantify their surface temperatures [11,12,19,20]. Some of these studies also employed long-term analyses using time series LST products, including MODIS-derived LST, primarily to investigate spatial, seasonal, and diurnal variations in LSTs and SUHIIs over cities [11,12,16,19,20], while a few evaluated long-term trends of SUHIIs [28,29]. However, to our knowledge, efforts for developing SUHI mapping approaches by integrating spatial and temporal variations of both variables (LST and LULC) have not been reported.
Findings from previous UHI studies also reveal noticeable features at the spatial, diurnal, and seasonal scales [27,28,29,30,31,32,33,34]. Despite extensive global research, comprehensive understanding of localized and comparative multi-city assessments of seasonal and diurnal SUHI dynamics remains limited [28,32]. Comprehensive understanding of UHI dynamics during seasonal and diurnal cycles, and across widely variable cities and regions, is essential for assessing possible changes in urban microclimates and informing sustainable urban development planning [28,32,35,36,37]. While most studies focused on larger metropolitan areas and megacities [11,32,34,35,36,37,38], rapidly developing mid-size cities are often overlooked and underrepresented in UHI literature despite their diverse land-cover configurations and development paths. Gaining a deeper understanding of the spatiotemporal variations in urban expansion and intensification as they relate to UHI developments remains crucial for guiding urban thermal management in these rapidly evolving midsize cities. This study thus aims to address this gap by conducting a long-term, comparative assessment of urbanization trends and possible effects on SUHI developments by quantifying the magnitudes and trends of SUHI intensities across three major Alabama cities, contributing region-specific insights to a broader understanding of urban thermal environments. In this study, we also evaluated an ISODATA clustering approach integrating time series of remotely sensed LST and LULC products to map and quantify SUHI effects using three major cities of Alabama, USA: Huntsville, Birmingham, and Mobile as our study sites. More specifically, we aim to 1) map and quantify spatial expansion and trends in urbanization using NLCD LULC products, 2) map and estimate spatial, diurnal, and seasonal variations of SUHIIs using MODIS-derived LST products, and 3) evaluate long-term trends in SUHI effects during extreme temperature events and over rapidly developing urban areas
2. Materials and Methods
2.1. Study Area
In this study, we included four counties of the state of Alabama: Madison and Limestone counties, Jefferson county, and mobile county, hosting three major cities, namely Huntsville, Birmingham, and Mobile, respectively (Figure 1). These four counties together are home to nearly one-third (~31.5%) of the state’s total population, while the three cities are ranked the top three population centers of the state. In terms of total population, Jefferson County ranked first with nearly 12.7% of the total population, followed by Madison and Limestone counties (10.9% of the total population) and Mobile County (7.9% of the total population) as the 2nd- and 3rd-most populated counties of the state, respectively [39].
Huntsville city, in terms of land extent, is the largest city in the state, while Mobile and Birmingham are ranked as 3rd and 4th, respectively. Huntsville city spans nearly 225 square miles, while Mobile and Birmingham city areas span nearly 151 and 147 square miles, respectively. Huntsville is also the fastest-growing urban area in the state, with an estimated population of 249,102 (as of July 2025). The city has experienced nearly 15.9% population growth, with more than 34,000 new residents joining the city’s community over the past five years (~18 new people choosing Huntsville as home each day). The Huntsville city area is also known to be the fastest-growing urbanized area within the state of Alabama [40,41]. These growing trends in population as well as urbanization are expected to continue [40] and will contribute to further expansion of the city’s developed areas. Birmingham reported rapid urban development over the period from 1988 to 2004 [42,43] and ranked as the largest metropolitan area of Alabama. Birmingham serves as a major regional economic, medical, and educational hub for Alabama as well as for the mid-South region. Mobile, one of the Gulf Coast’s cultural centers, is the most populous coastal city in Alabama. More interestingly, the population of Mobile decreased by 2.7% from 1990 to 2010, while the city’s metropolitan area increased during the same period [23]. More recent LULC change analyses also revealed urban expansion and development trends over the study area [44]. For example, between 2000 and 2024, within the Madison-Limestone counties (hosting the Huntsville City area), urban expansion in terms of developed area expansion was around 7% (increased from 17.7% in 2000 to 24.7% in 2024). This urban expansion occurred primarily at the expense of agricultural land, which was converted into suburban areas to accommodate the growing needs of a rapidly expanding population. During the same period, Jefferson and Mobile counties (hosting Birmingham and Mobile city areas, respectively) also experienced urban expansion but at considerably lower rates, with 3.5% and 3.2% increases in developed areas, respectively [44].
2.2. Data, Data Processing, and Analyses
Spatial expansion of developed areas and magnitudes and trends of SUHI developments were mapped and quantified using NLCD annual LULC products and MODIS-derived 8-day LST products, respectively. To detect the most recent conditions and trends over the past two decades, all analyses were performed using data available for the period from 2000 to 2024. NLCD LULC products were obtained from the Multi-Resolution Land Cover Consortium (MRLC) data archives. Data were available at 30m resolution for the conterminous USA for the calendar years 2000 to 2024. MODIS LST data were available at 1km spatial resolution from the MOD11A2 product. Administrative boundaries of the city areas and counties were available from the Tiger Line data archives of the US Census Bureau [45]. All raster processing and analyses were performed using ERDAS Imagine software (version 16.8), while statistical analyses and data compilations were performed using Python language (version 3.13) in Spyder IDE (version 6.0.7). Figure 2 below illustrates the graphical flowchart of the methodological approach used in this study.
2.2.1. Mapping Spatial Distributions and Expansion of Developed Areas Using NLCD Annual LULC Products
Annual LULC products were used to map spatial distribution and expansion of developed areas defined using NLCD developed LULCs: developed-open space, low intensity, medium intensity, and high intensity (LULC classes 21, 22, 23, & 24, respectively). Area estimates of developed LULCs within each city and during each year were used to quantify rates of urban expansion. These area estimates were derived from LULC histogram data as recorded in raster attribute tables. Area calculations were performed in ERDAS Imagine software (version 3.13) by keeping all NLCD products in Albers Conical Equal Area projection. Developed land extents were estimated as the total number of pixels mapped as NLCD developed LULCs. Rates of urban expansion were then evaluated based on yearly changes in relative proportions of the developed LULC extents within each city area. Relative proportions of developed LULCs were calculated for each site separately as the percentage of all developed LULC areas out of the total land extent within each city. Total land extents of each study site were derived as the cumulative of all NLCD LULCs excluding open water (NLCD class 11). Accuracies of the area estimates were verified by evaluating our estimates on total land extents within each city and county boundaries against published records available online. Total land extents within each city and county area were available from the US Census Bureau land area statistics tables [39] and are based on American Community Survey 5-year estimates for the period from 2020 to 2025.
2.2.2. Mapping SUHIs Using Time Series of MODIS LST Products
Our focus in this study was to evaluate SUHI developments during extreme conditions. Thus, all analyses were restricted to the summer and winter months only. Day and nighttime LST time series for each season were derived separately by overlaying all 8-day composites over the summer months (June, July & August) and the winter months (December of the current year and January and February of the following year). This process generated four sets of LST time series for summer daytime, summer nighttime, winter daytime, and winter nighttime. Our focus in this study was also to evaluate SUHIs within each city area. However, SUHI mapping was performed by expanding spatial boundaries to the entire land extent of the respective county boundaries (i.e., Madison-Limestone county area, Jefferson county, and Mobile county for the Huntsville city area, Birmingham city area, and Mobile city area, respectively—Figure 1). This was primarily due to the highly intensified urban development within each of our city areas, highly variable and irregular shapes of the city areas (Figure 1), and relatively low spatial resolution of the MODIS LST products. With this approach, we also attempted to capture SUHI developments and their expansion into adjacent non-developed/non-urban areas within the periphery of the city boundaries. This also allowed us to quantify SUHIIs by estimating LST variations between developed and surrounding non-developed areas (representing urban and non-urban areas, respectively) within each study area without limiting the non-urban reference area to a fixed distance threshold.
Spatial distributions of the SUHIs were mapped by performing ISODATA clustering on the derived LST time series products. The ISODATA algorithm stands for Iterative Self-Organizing Data Analysis Technique, a commonly used unsupervised clustering approach that assigns each pixel in the dataset to a specified number of clusters by iteratively updating cluster means and representativeness. The assignment of each pixel to a cluster is based on minimum Euclidean distance in multidimensional space using spectral distance between image pixels in feature space to a specified number of clusters characterized by unique spectral signatures. During the iterative clustering process, as new pixels are assigned to each cluster, cluster means are continuously updated [46]. Compared to other similar classification algorithms used in unsupervised classifications of multi-layer remote sensing data (i.e., k-means), ISODATA clustering is known for its ability to generate more compact clusters and increased flexibility, particularly in handling real-world, complex, and varied data sets, where the number of clusters is not already known [46]. In this study, as individual pixels in our time series datasets represent yearly average seasonal LSTs, cluster separation was achieved by maximizing pixel similarity within each cluster and also maximizing dissimilarity among the clusters in terms of both spatial and temporal variability in LSTs. Resulting cluster signatures thus reflect temporal variability in cluster mean LSTs over the study period and across derived clusters.
During the initial clustering, a relatively large number of clusters (i.e., a minimum of 30 and a maximum of 35) were generated to maximize the detection and separation of pixels with subtle LST differences recorded in the LST time series over a relatively long period (25 years). This allowed the generation of statistically dissimilar clusters with unique signature plots. To ensure accurate mapping of SUHI clusters representing urban areas, initial clusters were overlaid on the NLCD LULC 2024 product and evaluated for LULC distributions within each SUHI cluster. During this cluster merging process, descriptive statistics (mean and Std Dev) and signature plots of each of the initial clusters were also evaluated. Statistically similar clusters with identical signature plots that overlapped developed LULCs were recoded as SUHIs, while remaining clusters outside the developed LULCs were merged as surrounding non-urban reference areas. This process is recognized as supervised, due to the user involvement in separating SUHI clusters from surrounding non-urban areas. While ISODATA clustering assigned each pixel to statistically dissimilar clusters, the supervised approach used the spatial distribution of clusters among developed and non-developed areas as an additional determinant when separating SUHI clusters from their surrounding non-urban clusters. Within the SUHI clusters, statistically dissimilar classes were retained as separate SUHI clusters and were identified as SUHI clusters 1, 2 & 3. During this process, initial cluster statistics and signatures were merged to generate LST statistics and signatures for the resulting SUHI clusters and their surrounding non-urban reference areas.
The same clustering process was applied to the four different LST time series products (loops 1-4 in Figure 2 above) and for each study area separately, using the same clustering parameters across all sites and for all LST composites. To evaluate the efficacy of each time series in mapping SUHI clusters accurately representing developed LULC clusters, LULC distributions within the derived clusters (SUHI 1, 2, 3) and their non-urban reference areas were evaluated separately (for each of the study sites and four of the output SUHI layers) by overlaying derived SUHI cluster maps on the most recent NLCD LULC product (2024). This process generated LULC area estimates for each of the derived SUHI cluster maps. These area estimates were used to evaluate the applicability of different time series products for mapping SUHIs.
Derived SUHI cluster maps were overlaid on LST time series to extract LST statistics for each of the SUHI clusters and their surrounding non-urban areas as well. These statistics were evaluated for variations among the four cluster maps, within (among the 3 SUHI clusters and surrounding non-urban areas) and among the study sites, and during seasonal and diurnal cycles separately. Significance of the differences was tested using ANOVA (F tests).
2.2.3. Evaluation of Diurnal and Seasonal Variations of SUHIIs
For the derived SUHI clusters (SUHI 1, 2, & 3), yearly average seasonal day and nighttime SUHIIs during the study period were calculated using Equation 1.
where LST SUHI and LST non-urban represent average LSTs of each of the SUHI pixels and their surrounding non-urban pixels, respectively. These LST statistics were derived by overlaying the derived SUHI layers and each LST time series to generate SUHIIs during each season and day and nighttime, separately
SUHII = LSTSUHI − LSTnon-urban
Following the definition of SUHII as the temperature difference between the urban area and the surrounding non-urban reference area, this approach has been applied widely in previous studies, and derived SUHIIs have proven to detect LST contrast between urban and non-urban areas [26,28,33,36,38,47,48]. A major discrepancy between UHII studies arises from their approaches for defining non-urban reference areas [21,33,49,50]. While many previous studies applied set distance boundaries or thresholds for defining surrounding reference areas, many others used LULC data alone [49] or integrated LULC data with distance thresholds [29,33,51] or previously defined boundaries that included administrative boundaries [31]. However, the applicability of distance-based criteria for defining non-urban reference areas is limited by the challenge of defining a fixed distance threshold for cities of varying sizes [12,51]. This can even be challenging in the context of regional-scale studies and when the selected cities span a relatively large area [32,52], as in our study, in which the cities span across the state of Alabama in the northeast-to-southwest direction (Figure 1). Moreover, Irregular shapes of our city areas and their urban clusters, along with proximity to nearby smaller developed areas (Figure 1a-c), also limited the applicability of set distance thresholds for defining non-urban reference areas. Thus, in this study, we did not limit our non-urban reference areas using a set distance threshold or any distance criteria. Rather, SUHIIs were estimated for each mapped SUHI cluster by defining the reference area as the surrounding non-urban area within each study site. To minimize the influence of outliers, all pixels within the non-urban reference areas classified as water or developed LULCs were excluded by overlaying mapped SUHI layers with the NLCD 2024 LULC product. Our focus was also to evaluate spatio-temporal variations in UHI effects (as reflected in SUHIIs) among the three city areas of varying sizes, urbanization trends, and demographics. Including the entire non-urban surrounding areas enabled cross-comparisons among the selected sites.
For all SUHI clusters (SUHI 1, 2 & 3) within each study site, SUHIIs were calculated separately for day and nighttime of both seasons. SUHII estimates were used as a quantitative measure of relative warming of the developed areas as compared to their surrounding non-urban reference areas. Significance of SUHII variations among the four cluster maps, within (among 3 SUHI clusters and surrounding non-urban areas) and among the study sites, and during seasonal and diurnal cycles was then evaluated separately using ANOVA (F tests).
2.2.4. Evaluation of SUHII Trends
Long-term trends in mean seasonal LSTs and SUHIIs were assessed for the SUHI clusters as well as for their surrounding non-urban areas separately using the Mann-Kendall test, a robust method for detecting trends in climate data [53,54]. In addition, LST and SUHII anomalies were calculated as the deviation of yearly seasonal average LSTs and SUHIIs, respectively, from the respective long-term means. These LST and SUHII anomalies were also evaluated as an alternate measure of the long-term trends in SUHI developments. Anomalies were calculated using the respective long-term means of LSTs and SUHIIs for each SUHI cluster and surrounding non-urban areas separately for each study site, time period (day and nighttime), and season (winter and summer). Long-term trends in seasonal average day and nighttime LST and SUHII anomalies were also evaluated visually by plotting against time (year).
3. Results
3.1. Urban Expansions Mapped Using NLCD Annual LULC Products
Our results from the analysis of NLCD LULC data revealed continuous expansion of the developed areas across all study sites, but at varying rates. As expected, the Huntsville city area reported the highest rate of urban expansion with nearly 13% of the city’s total land area converted into developed areas over the past two decades (2000–2024). Urban expansion rates reported for the Birmingham and Mobile city areas were considerably lower, with nearly 3% and 3.8% of the total land extents, respectively, being mapped as newly developed over the study period (Table 1). Among the three, Birmingham and Mobile city areas are more extensively developed, with nearly 2/3rd of the total land extent covered by developed areas. Despite having the highest urban expansion rates, the Huntsville city area, the largest among the three (in terms of land extent), still contains nearly half of its land extent covered by non-developed areas (Table 1).
Further analysis of NLCD LULC data revealed expansion of developed areas at the expense of vegetated land covers. This was evident within the Huntsville city area, which reported a decrease in agricultural and other vegetated areas (forest and grassland) from 36.9% to 25.9% and from 26.9% to 24.8%, respectively (Figure 3).
To understand urban expansion over the period from 2000 to 2024, NLCD-developed LULCs were evaluated. When our most recent NLCD product of 2024 (Figure 4a) was evaluated against the 2000 and 2010 LULC products, expansion of the developed areas was clearly evident in all three cities, but at varying levels (Figure 4b). While most urban expansion was observed within the Huntsville city area (Figure 4b—left), urban developments in all three cities are visible as small clusters largely within the periphery of the city limits. However, relatively larger clusters of newly developed areas were observed in the Huntsville city area, mostly within the west and southeast boundaries of the city (Figure 4b—left).
3.2. SUHIs Mapped Using the ISODATA Clustering Approach
Evaluation of LULC distributions within the SUHI clusters revealed superior results when SUHIs were mapped using summer daytime LST time series products. For example, the SUHI-3 cluster of all study sites was characterized primarily by developed NLCD LULCs, with 94.9%, 93.3%, and 83.7% of the mapped SUHI-3 cluster area within Madison-Limestone, Jefferson, and Mobile counties, respectively, characterized by developed NLCD LULCs. Further, LULC distributions within the remaining SUHI clusters (SUHI 1 &, 2) indicated that developed LULCs accounted for more than half of the area, with varying results among the 3 sites (Table 2). These findings reveal that SUHI clusters mapped using summer daytime LST time series, in particular SUHI-3 clusters, accurately represent the developed areas and thus precisely capture the urban clusters of our study sites.
The ISODATA clustering approach also generated spectral signatures for each of the derived clusters. In this study, our input datasets were composed of a total of 25 layers providing pixel-based yearly seasonal average LSTs from 2000 to 2024. These spectral signature plots thus reflected temporal variations in seasonal average LSTs within each of the derived clusters. When all cluster signatures were evaluated, clearly distinguishable spectral signatures were observed for the SUHI clusters derived using daytime LST products (as compared to those of nighttime LST products). Thus, Figure 5 below illustrates signature plots of the final output clusters derived using summer daytime LST time series products.
When NLCD developed LULC maps were evaluated against the derived SUHI cluster layers, we observed SUHI clustering primarily around high-intensity developed areas mapped as NLCD LULC Class 24. This spatial match was more obvious in SUHI clusters derived using daytime LST time series (Figure 6a & Figure 6b) than in SUHI clusters derived using nighttime time series. Moreover, across all sites and during both seasons, close resemblance was also observed in spatial distributions of the derived SUHI clusters and spatial variations in their respective long-term average LSTs. This was again more obvious between the SUHI clusters derived using daytime LSTs (Figure 6b) and respective long-term average LST maps (Figure 6c).
Derived SUHI clusters were also characterized by distinguishable LST contrast from their surrounding non-urban areas. Across all sites and during both seasons, SUHI clusters reported significantly (p=0.01) warmer surface temperatures as compared to their surrounding non-urban areas. Similarly, LST differences among the three clusters were also significantly different across all sites and during all times (day and nighttime of both seasons). However, SUHI clusters derived using the 4 different time series products showed considerable variations in the LST contrast as well. Similar to our findings from SUHI LULC analyses and spectral signature evaluations, the best resemblance and highest LST contrasts were observed when SUHI clusters were derived using summer daytime LST products (Table 3), while LST variations among the SUHI clusters derived using nighttime LST time series were ambiguous, with mixed results (i.e., SUHIs were not significantly different (p=0.05) across most sites, in particular during the winter months). Therefore, in Figure 6b and Figure 6c above, only the clusters derived using daytime LST products (Figure 6b) are included in comparison to their respective long-term average LST maps (Figure 6c). Similarly, in Table 3 below, only the LST statistics over the SUHI clusters and their surrounding areas derived using summer daytime series are summarized.
As expected and interestingly, during all seasons and across all sites, both daytime and nighttime LSTs of the SUHI-3 cluster reported the highest LSTs as compared to the surrounding SUHI clusters (SUHI-2 & SUHI-1). Moreover, all SUHI clusters mapped (SUHI 1, 2 & 3) reported significantly warmer LSTs compared to their surrounding non-urban areas. When LSTs were compared among the three sites, inconsistencies in the LST gradient were observed. For example, during summer daytime, SUHI clusters within the Birmingham city area reported the highest LSTs, followed by the Huntsville city area, while SUHIs of the Mobile city area reported the lowest summer daytime LSTs. However, during all other times (summer night, winter day and night), as expected, the Mobile city area reported the highest LSTs over SUHIs as well as their surrounding non-developed areas (Table 3).
3.3. Spatial, Diurnal and Seasonal Variations of SUHIIs
Using the SUHI clusters mapped using summer daytime LSTs, SUHIIs were quantified as the difference in LSTs between each SUHI cluster and its surrounding non-urban reference areas. Similar to the LST variations observed among the SUHI clusters, magnitudes of the SUHIIs varied significantly (p=0.05) among the SUHI clusters (Figure 7a–Figure 7c), with slightly deviant results during winter nighttime (Figure 7d).
Evaluation of day and nighttime SUHIIs over two seasons revealed significant variations (p=0.05) among the study sites and during seasonal and diurnal cycles (Table 4). Throughout our study period, magnitudes of seasonal average SUHIIs were consistently higher during the summer daytime (across all years and sites), followed by SUHIIs of winter daytime and summer nighttime, with the smallest magnitudes reported during winter nighttime. During the summer daytime, the largest magnitude of long-term average SUHII was reported over the mapped SUHII-3 cluster of the Jefferson County area, representing the Birmingham city area, which reported an average SUHII of 7.10C, while the smallest magnitude of 2.30C was reported over the SUHII-1 cluster of the Mobile County area, representing Mobile city (Figure 7a). During winter nighttime, the mapped SUHI-1 and SUHI-2 clusters of Madison-Limestone counties, representing the Huntsville city area, reported negative long-term average SUHIIs (Figure 7d) and indicated the occurrence of surface urban cool islands (SUCIs) during winter.
3.4. Long-Term Trends in SUHI Developments
Our results from the analysis of Mann-Kendall tests to evaluate long-term trends in SUHIIs were highly ambiguous, with varying results over the three study sites. For example, SUHIIs over SUHI clusters 3 and 2 within the Madison-Limestone area hosting the Huntsville city area reported slightly increasing trends during summer daytime, while no other trends were observed in SUHIIs over any other areas and during other times. Thus, in this study, we also evaluated any trends in annual average LSTs over the derived SUHI clusters. Interestingly, our findings revealed slightly increasing trends that were similar across all three study sites and during both seasons. While daytime LST trends were again ambiguous, with no significant (p=0.05) trends over most study sites and during most times, significant (p=0.05) slightly increasing trends were observed in nighttime LSTs over all the mapped SUHI clusters and during both seasons. However, the trends observed during winter nighttime were relatively stronger than those observed in summer nighttime LSTs (Figure 8). While the observed trends over most sites and SUHI clusters reported similar slopes, SUHI-3 and SUHI-2 clusters of the Madison-Limestone county area representing the Huntsville city area reported relatively higher slopes.
4. Discussion
4.1. Urban Expansion Mapped Using NLCD Annual LULC Products
In this study, we evaluated the spatial expansion of the developed areas as a measure of urbanization patterns and trends within our study sites. Alterations in the spatial distribution patterns and extents of LULCs are a key consequence of urban expansion [12] and thus are extensively used to explain how land is utilized (i.e., agriculture, urban development) and their physical composition (i.e., vegetation, water, impervious surfaces) as well [49,50]. Among many other LULC products, NLCD LULC data are used in UHI studies primarily to determine the extent of urbanization based on the NLCD impervious or developed LULCs [49]. Our findings from NLCD analyses indicate continuous urban expansion during the study period and across all three cities, but at varying rates (Table 1 & Figure 3) and patterns (Figure 4). As expected, during our study period, the Huntsville city area reported the highest rates of urban expansion (13% of the city’s total land extent was mapped as newly developed), while the urban expansion rates reported for the Birmingham and Mobile city areas were considerably lower (only around 3% and 3.8% of land, respectively, were mapped as newly developed). Huntsville city area spans a relatively larger area within two counties (Figure 1) and is surrounded predominantly by vegetated (agricultural, grassland/herbaceous, forest) LULCs [44], and thus has provided more room for this spatial expansion, specifically into its northwest, southwest, and southeast peripheries. Our results from LULC change analysis (Figure 3a) also reveal Huntsville City area’s urban sprawl at the expense of vegetated LULCs. For example, during the study period, newly developed areas expanded into 13% of the city area while the city area’s vegetated LULCs reported 11% and 2% decreases in land extent, respectively, in vegetated LULCs. In a previous study evaluating urban expansion and LULC conversions during the same study period but over the entire county area, we found similar trends across the three study areas, with relatively higher rates of urban expansion within the Madison-Limestone county area compared to the two others [44]. Huntsville city area is the largest city within the state of Alabama and is well known for the rapid rates of urban growth and intensification over the recent past [41]. However, to our knowledge, quantitative estimates of urban expansion rates have not been reported in recent literature, limiting our ability to compare our estimates. These findings will thus bring new insights into the urban developments of the city. As compared to the Huntsville city area, as of 2024, the Birmingham and Mobile city areas are more intensively developed, with nearly 66% and 62% of the total city area occupied by developed LULCs, respectively (48% of the total land is mapped as developed in the Huntsville city area—Table 1). Already intensified urban developments within these two cities may have limited their ability for further urban expansion, reflecting reported lower rates of urban expansion. However, even within Birmingham and Mobile city areas, small clusters of newly developed areas, mainly within the periphery of the city limits, were observed (Figure 4b). Moreover, these newly developed clusters were distributed away from the high-intensity developed areas (Figure 4a and Figure 4b). In contrast, within the Huntsville city area, relatively larger clusters of newly developed areas were evident, with some of these larger clusters being mapped as high- and medium-intensity developed areas. These clusters can explain recent industrial and suburban developments reported within the city over the past two decades [41]. In most developed regions in North America and Europe, urban growth is known to have stabilized [55]. However, even in these regions, urban sprawl, characterized by low-density, dispersed expansion leading to habitat fragmentation, continues to impact urban environments [56]. Small clusters of newly developed areas mapped in this study thus reveal low-density, dispersed expansion of urban sprawl within our cities as well, and may reflect generalized patterns of urban sprawl in similar mid-size cities in the mid-south US and other similar cities.
4.2. SUHIs Mapped Using ISODATA Clustering Approach
Intensive studies have been performed to map SUHIs by using in situ temperatures from weather station records [1,36,58,59,60] or remotely sensed LST products [5,31,38,50,57,58,59,60,61]. Satellite-derived LST products have proven to be a crucial and effective approach for capturing LST variations at variable spatial and temporal scales [13,25,26,29,30,31,32,33,34]. Among others, MODIS-derived LST products have been the popular choice for mapping SUHIs [16]. While a wide range of methods are employed to map SUHIs, analysis of time series of remotely sensed LST products is a common approach [16,55].
In this study, to map SUHIs, we applied an unsupervised clustering approach, ISODATA clustering, on time series of MODIS LST products. This approach can detect LST clusters representative of SUHIs, avoiding the need to predefine the number of clusters, as is required by techniques commonly used in the literature [18]. To detect diurnal and seasonal variations in spatial distributions of SUHIs, we applied ISODATA clustering on day and nighttime LST time series of winter and summer seasons, separately. Interestingly, spatial distributions of SUHI clusters mapped using daytime LST time series closely resembled spatial distributions of the developed LULCs mapped using NLCD LULC products (Figure 4a and Figure 4b). Moreover, these SUHI clusters were also characterized by significantly warmer surface temperatures as compared to their surrounding non-SUHI pixels (Figure 4b and Figure 4c).
Assuming urban or developed areas are relatively warmer regions than surrounding non-developed areas, most previous studies mapped SUHIs based on LULC classifications [33]. In our approach, when assigning individual pixels into clusters, the ISODATA clustering approach maximized spatial and temporal variations in LSTs among the individual clusters. During the supervised cluster merging approach that followed the ISODATA clustering, LULC data were also incorporated for separating initial clusters into SUHIs and their surrounding non-urban areas. With this approach, we were able to map SUHI clusters that were characterized predominantly by developed LULCs, representing urban clusters, with the best results achieved using summer daytime LST time series (Table 2). Moreover, our SUHI clusters were characterized by significantly warmer surface temperatures as compared to their surrounding non-urban reference areas (Table 3). Surface temperatures over the mapped SUHI clusters also revealed significant variations among the 3 SUHI clusters and sites, and during diurnal and seasonal cycles, indicating strong clustering of SUHIs. These observed variations in LSTs among our study sites can be explained partly using geographical variation along the latitudinal gradient. Huntsville, located in the northernmost part of Alabama, near the Tennessee border, is characterized by relatively mild weather conditions, while Birmingham, located in central Alabama, is characterized by relatively warm weather conditions. Mobile, a coastal city in the southernmost part of the state, is characterized by warmer and more humid weather conditions. While this latitudinal temperature gradient was evident in LST variations among the SUHIs of our cities in general and during most of the time, we observed slightly different variations in summer daytime LSTs. For example, during summer daytime, seasonal average LSTs of Birmingham SUHI clusters were significantly higher than those of Mobile and Huntsville city areas (Table 3). Observed variations of LSTs among the SUHI clusters can also be attributed to variations in urban intensification among the three cities. Compared to Huntsville, Birmingham and Mobile city areas are characterized by more intensified urban development, with nearly 2/3 of the total land extents within each city area occupied by developed LULCs (Table 1). Developed and impervious land surfaces are known for their positive effects on LST, and thus, the proportion of developed land extents is used as a strong predictor of LSTs [57,62,63]. Relatively larger proportions of developed LULCs within the Birmingham city area should also have contributed to the elevated LSTs over its SUHI clusters and indicate positive effects of urban development on intensified UHI effects as reflected in the MODIS-derived LSTs. On the other hand, relatively cooler conditions within the Mobile city area (regardless of intensified urban development and location within a warmer region) can be due to its proximity to the coast. Previous findings from coastal cities reported inland penetration of cooling sea breeze over coastal cities as contributing factors that alleviate UHI effects with decreased surface temperatures in general [57,64], and more specifically, during warmer summer seasons [61].
Our findings also indicated that daytime LST time series products are more effective (as compared to nighttime products) for mapping SUHI clusters. While summer nighttime time series was also able to map similar SUHIs, clustering was more prominent when daytime time series was used. Results from ISODATA clustering of winter LST time series were also ambiguous, with similar but less prominent clustering during daytime and no clustering during nighttime. These findings correspond with previous findings indicating that summer daytime LSTs are more effective for mapping UHIs [64]. During periods of high heat availability, as in summer daytime, urban areas reach their highest land surface temperatures due to the combined effects of high solar radiation, abundant impervious surfaces, reduced vegetation cooling, and high anthropogenic heat release [1]. This can result in the largest difference between urban and rural LSTs, making the UHI signal strongest and most detectable in daytime LST products, more specifically during the summer and extreme heat events.
These findings indicate that our approach using ISODATA clustering and supervised merging of the initial clusters derived from time series of MODIS- LST will serve as a promising approach for accurately mapping SUHIs.
4.3. Spatial, Diurnal and Seasonal Variations of SUHIIs
Similar to our results from LST analyses, estimated SUHIIs over the SUHI clusters mapped using summer daytime time series also reported obvious spatial, diurnal, and seasonal differences, with consistently and substantially larger SUHIIs over the Birmingham area (Figure 7 & Table 4). Highly intensified urban developments were also observed within the Birmingham city area, with nearly 66% of the total area occupied by developed LULCs (Table 1). Moreover, nearly 93% of the area within the SUHI-3 cluster of the Birmingham city area was occupied by NLCD developed LULCs (Table 2). These findings further indicate that intensified UHI effects over the Birmingham city area can largely be attributed to the city’s high-intensity developments (i.e., high-rise buildings, high-density developments, and relatively lower proportions of vegetated LULCs) contributing to increased heat retention. Similar findings were reported from comparisons among cities within the US [45] and in other regions as well [47,48,49,54], and enhanced UHI effects were reported in cities characterized by highly contiguous, dense, and sprawling urban development [45]. However, the Mobile city area, which is characterized by similar urban intensification (62% mapped as developed area—Table 1), reported consistently and considerably smaller SUHII magnitudes (Figure 7, Table 4). The coastal proximity of the Mobile city area likely contributed substantially to the observed attenuation of UHI effects. The Huntsville city area, regardless of the location in the northernmost part of the state, reported significantly higher SUHIIs that were clearly evident during the summer daytime. Based on our LULC analyses, the SUHI-3 cluster of the Huntsville city area reported the highest proportion of developed area, with nearly 95% of the area mapped as developed LULCs (Table 2). Estimates of LSTs over SUHIs and their surrounding non-urban areas (Figure 6, Table 3) also indicate that the elevated SUHIIs in the Huntsville area are resulting primarily from increased heat retention within the SUHI clusters (as reflected in higher LSTs over SUHI clusters), while their non-urban areas maintained similar LSTs as in the Mobile area. Thus, the intensified UHI effects over the Huntsville city area can also be attributed to the intensified urban developments at the expense of vegetated LULCs that were evident over the last two decades.
Our results also revealed substantial variations of SUHIIs during the diurnal cycle. Studies that evaluated SUHII variations across relatively larger regions reported generalized diurnal patterns of SUHIIs driven primarily by urban LULC composition and morphologies (i.e., building characteristics) as well as climatic and topographic factors [38,50,52,53]. Our findings did not reveal contrasting patterns of SUHIIs among our study sites; rather, they revealed consistently higher SUHIIs during the daytime compared to the nighttime during both seasons and throughout the study period. Our results, however, align with the findings from previous studies that reported clearly larger magnitudes of SUHIIs during the daytime than at nighttime [50,52]. This diurnal variability in SUHIIs is attributed to UHI energetics between the day and nighttime [2,28,47,48,49]. The formation of SUHIs during the daytime is largely driven by more sensible heat and less latent heat owing to the increase in developed structures at the expense of vegetated surfaces in developed areas. In contrast, increased energy storage in developed structures and surfaces (trapped during the day and released at night) contributes to nighttime SUHIs. Given the geographic distribution of our study sites within a relatively confined and uniform climatic region, the intensified daytime UHI effects that are reflected in consistently higher daytime SUHIIs can be attributed primarily to variations in urban intensification and morphology.
We also observed substantial variations in SUHIIs between summer and winter seasons. During day as well as nighttime, consistently higher SUHIIs were observed during summer as compared to winter. For example, the long-term average daytime SUHII (average over all sites and all SUHII clusters) during summer was 4.20C, while it was only 1.70C during winter. Similarly, nighttime SUHIIs were 1.50C and 0.30C, respectively, during summer and winter. Moreover, as expected, across all sites, the highest SUHIIs were reported during summer daytime and correspond with previous findings that reported intensified SUHI effects during summer daytime [11,29,30,31,32,33,34,65]. During all other times, SUHII variations among the study sites followed the latitudinal gradient of their geographic locations (i.e., highest in Mobile, followed by Birmingham and Huntsville). Our estimates of SUHIIs based on MODIS-derived LSTs, however, may not have fully captured the contributive effects of urban developments on intensifying SUHI effects; specifically, during relatively cooler times and/or seasons. These findings also indicate that urban–rural temperature differences reflected in SUHII magnitudes can vary substantially depending on various factors, including the level of urban intensification and land cover distributions [66]. Considerably larger magnitudes of summer daytime SUHIIs reported in this study, particularly over the Birmingham and Huntsville city areas, also indicate the potential for intensified SUHI effects during extreme heat events (i.e., heat waves) in general, and more specifically over the cities of relatively warmer regions and with intensified urban development. These findings thus indicate the necessity of urban planning that considers the potential heat retention and cooling effects of different urban structures and landscapes to mitigate intensified UHI effects as cities undergo rapid urban development and spatial expansion. Further, given the highly variable nature of UHI occurrences and effects, findings from similar site-specific and comparative assessments across cities from different regions will be necessary for a comprehensive understanding of the variable effects of UHI developments across regions and cities characterized by variable LULCs as well as urban morphologies.
4.4. Long-Term Trends in SUHI Developments
Our findings from trend analysis are ambiguous, with varying results observed in LST as well as SUHII trends over our study areas and during different times. While significant and consistent SUHII trends were not evident in most sites and during most times, over the Madison-Limestone county area, slightly increasing and significant (p=0.05) SUHII trends were observed during summer daytime. The Huntsville city area within these two counties has experienced rapid urban development and extensive conversion of vegetated areas into developed areas. A few previous studies indicate the possibility of intensified UHI effects and maximum UHI intensities during summer [20,27,48,64]. This increasing trend can thus be attributed to the intensified UHI effects resulting from rapid urbanization reported during the past two decades.
Slightly different trends were observed in nighttime LSTs, with slight increases over time across most SUHI clusters and some surrounding non-urban areas as well. Moreover, observed trends in nighttime LSTs over the Mobile County area were highly significant (p=0.01) during both seasons. Regardless of the distinct nighttime thermal dynamics in urban climates, most previous UHI studies overlooked nighttime LST variations and focused primarily on daytime LST [12]. However, pronounced and contrasting effects of built environments on nighttime temperatures are also reported [12,59,64]. Similar to our findings, a few studies indicated increasing and relatively stronger trends during relatively cooler winter nighttime [11,12,64] and over cities characterized by mild climate conditions [65,66].
Winter conditions, characterized by lower solar radiation and different thermal demands, exhibit distinct UHI features and trends. Common urban materials such as asphalt and concrete exhibit lower albedo and higher heat storage capacity, intensifying surface heating during the day and delaying cooling at night [3,6,7]. Over rapidly developing cities, as in our study sites, expansion and intensification of urban structures and impervious surfaces at the expense of vegetated surfaces is evident [66,67]. Warming nighttime trends over rapidly developing urban areas can thus be attributed to long-term changes in urban energetics in general, and more specifically to the combined effects of increased heat accumulation over developed structures and surfaces during daytime and diminishing vegetative cooling effects during nighttime. These findings thus indicate the potential for long-term changes in urban microclimates as urban expansion and intensification continue. Stronger winter nighttime LST trends also indicate that UHI effects can be more pronounced during cooler seasons and can have implications for public health due to reduced nighttime cooling and, in some areas, energy demands. These findings thus suggest the need for sustainable urban planning strategies designed specifically to mitigate intensifying UHI effects.
5. Conclusions
Accurate mapping of SUHIs is a crucial first step for precise estimates of SUHIIs, advancing understanding of urbanization effects and supporting effective urban planning and implementation of strategies to mitigate UHI effects. In this study, we evaluated the applicability of integrating time series of remotely sensed LST and LULC products in an ISODATA clustering approach for spatial mapping of SUHIs. SUHI clusters mapped over the three study sites representing developed LULCs were further evaluated for spatial, diurnal, and seasonal variations of urban-rural temperature differences, quantified as SUHIIs.
The three study sites selected in this study represent mid-size cities characterized by different rates and patterns of urban expansion. Our findings from LULC changes within the city areas revealed continuous expansion of the developed area across all study sites, but at varying rates. The highest rate of urban expansion was observed in the Huntsville city area, with nearly 13% of the city’s total land extent mapped as newly developed and at the expense of vegetated areas, while the urban expansion rates reported for Birmingham and Mobile city areas were considerably lower (only around 3% and 3.8% of land, respectively, were mapped as newly developed).
Our approach, using ISODATA clustering of MODIS-derived yearly seasonal LST time series followed by supervised merging of the initial clusters based on cluster signals and LULC distributions, mapped SUHIs as distinguished clusters of significantly (p=0.01) warmer surface temperatures compared to their surrounding non-urban reference areas. The SUHI clusters closely resembled spatial distributions of NLCD-developed LULCs. Findings from LULC analyses within the mapped SUHI clusters revealed the highest resemblance when summer daytime time series was used, with nearly 95%, 93%, and 94% of the area within SUHI-3 clusters of Madison-Limestone, Jefferson, and Mobile counties, respectively, characterized by NLCD-developed LULCs.
The magnitudes of the SUHIIs quantified as the differences in LSTs between SUHI clusters (mapped using summer daytime time series) and their surrounding non-urban reference areas revealed significant (p=0.05) spatial, diurnal, as well as seasonal variations, with consistently larger magnitudes of SUHIIs during summer daytime across all SUHIs and sites, followed by gradually decreasing SUHIIs from winter daytime, summer nighttime, to winter nighttime. These observed SUHII magnitudes as well as seasonal and diurnal variations correspond well with findings from previous SUHI studies. While observed trends in SUHIIs were ambiguous with varying results across study sites and during different times, similar to findings from previous studies, significant and consistent trends were observed in nighttime LSTs reflecting increasing winter nighttime LSTs over time across all sites.
These findings indicate that our ISODATA clustering approach using time series of MODIS LST data is a promising approach for mapping and quantifying site-specific variations of UHI effects. Our analysis of spatial, diurnal, and seasonal SUHI variations underscores the necessity for targeted urban development strategies aimed at mitigating the impacts of intensifying UHI effects. In particular, evaluating site-specific trends is critical for protecting urban ecosystems and communities during extreme heat events, especially within underrepresented, rapidly developing mid-size cities.
Author Contributions
Conceptualization, R.K.; methodology, data processing and analysis: R.K. and S.C; writing—original draft preparation, R.K and RR; writing—review and editing, S.C., R.R., M.A., J.M, S.H and D.C.; funding acquisition, R.K., M.A., J.M, S.H and D.C. All authors have read and agree to the submitted version of this manuscript.
Funding
This research was funded by the US Department of Energy Grant No. DE-SC0024614 to PI Kulawardhana.
Data Availability Statement
Restrictions apply to the datasets. The datasets presented in this article are not readily available, as the data are part of an ongoing study and are not yet compiled for public release. Requests to access the datasets should be directed to the corresponding author & PI of the grant, Ranjani Kulawardhana.
Acknowledgments
Authors acknowledge financial support from the US Department of Energy Grant No. DE-SC0024614 to PI Kulawardhana. Initial support from Marvin Lotsah, a graduate scholar of the Applied Geospatial Data Science Initiative for Urban Climate Studies (AGDI UCS) of Alabama A&M University for data acquisition and pre-processing is acknowledged. Various other supports from Alabama A&M University (AAMU), Oak Ridge National Laboratory (ORNL), and Pacific Northwest National Laboratory (PNNL) are also acknowledged.
Conflicts of Interest
The authors declare no conflicts of interest.
References
- Arnfield, A.J. Two decades of urban climate research: A review of turbulence, exchanges of energy and water, and the urban heat island. Int. J. Climatol. 2003, 23, 1–26. [Google Scholar] [CrossRef]
- Oke, T.R. The energetic basis of the urban heat island. Q. J. R. Meteorol. Soc. 1982, 108, 1–24. [Google Scholar] [CrossRef]
- Voogt, J.A.; Oke, T.R. Thermal remote sensing of urban climates. Remote Sens. Environ. 2003, 86, 370–384. [Google Scholar] [CrossRef]
- Grimmond, C.S.B.; Oke, T.R. Aerodynamic properties of urban areas derived from analysis of surface form. J. Appl. Meteorol. 1999, 38, 1262–1292. [Google Scholar] [CrossRef]
- Imhoff, M.L.; Zhang, P.; Wolfe, R.E.; Bounoua, L. Remote sensing of the urban heat island effect across biomes in the continental USA. Remote Sens. Environ. 2010, 114, 504–513. [Google Scholar] [CrossRef]
- Akbari, H.; Pomerantz, M.; Taha, H. Cool surfaces and shade trees to reduce energy use and improve air quality in urban areas. Sol. Energy 2001, 70, 295–310. [Google Scholar] [CrossRef]
- Santamouris, M. Analyzing the heat island magnitude and characteristics in one hundred Asian and Australian cities and regions. Energy Build. 2015, 86, 46–60. [Google Scholar]
- Nakamura, Y.; Oke, T.R. Wind, temperature and stability conditions in an east–west oriented urban canyon. Atmos. Environ. 1988, 22, 2691–2700. [Google Scholar] [CrossRef]
- Roth, M. Review of urban climate research in (sub)tropical regions. Int. J. Climatol. 2007, 27, 1859–1873. [Google Scholar] [CrossRef]
- Zhang, H.; Mahmood, A.N.; Hu, T.; Mallick, K.; Didry, Y.; Hitzelberger, P.; Szantoi, Z.; Perez-Planells, L.; Göttsche, F.M.; Hulley, G.C.; Hook, S.J. Global evaluation of high-resolution ECOSTRESS land surface temperature and emissivity products: Collection 1 versus Collection 2. Remote Sens. Environ. 2025, 326, 114799. [Google Scholar] [CrossRef]
- Yang, N.; Lu, C.; Ouyang, L. Exploring spatial–temporal evolution patterns of urban heat islands in summer and winter: evidence from a megacity of China. Sci. Rep. 2025, 15, 13592. [Google Scholar] [CrossRef] [PubMed]
- Kim, Y.; Yoo, C.; Im, J. Nighttime satellite land surface temperature for urban applications: achievements, challenges, and future prospects. GIScience Remote Sens. 2025, 62, 2527990. [Google Scholar] [CrossRef]
- Weng, Q. Thermal infrared remote sensing for urban climate and environmental studies: Methods, applications, and trends. ISPRS J. Photogramm. Remote Sens. 2009, 64, 335–344. [Google Scholar] [CrossRef]
- Zhang, Y.; Middel, A.; Turner, B.L. Evaluating the effect of 3D urban form on neighborhood land surface temperature using Google Street View and geographically weighted regression. Landsc. Ecol. 2019, 34, 681–697. [Google Scholar] [CrossRef]
- Zhou, D.; Xiao, J.; Bonafoni, S.; Berger, C.; Deilami, K.; Zhou, Y.; Frolking, S.; Yao, R.; Qiao, Z.; Sobrino, J.A. Satellite remote sensing of surface urban heat islands: Progress, challenges, and perspectives. Remote Sens. 2019, 11, 48. [Google Scholar] [CrossRef]
- Phan, T.N.; Kappas, M. Application of MODIS land surface temperature data: A systematic literature review and analysis. J. Appl. Remote Sens. 2018, 12, 041501. [Google Scholar] [CrossRef]
- Cafaro, R.; Cardone, B.; D’Ambrosio, V.; Di Martino, F.; Miraglia, V. A new GIS-based framework to detect urban heat islands and its application on the city of Naples (Italy). Land 2024, 13, 1253. [Google Scholar] [CrossRef]
- Derdouri, A.; Wang, R.; Murayama, Y.; Osaragi, T. Understanding the links between LULC changes and SUHI in cities: Insights from two-decadal studies (2001–2020). Remote Sens. 2021, 13, 3654. [Google Scholar] [CrossRef]
- Stewart, I.D. A systematic review and scientific critique of methodology in modern urban heat island literature. Int. J. Climatol. 2011, 31, 200–217. [Google Scholar] [CrossRef]
- Deilami, K.; Kamruzzaman, M.; Liu, Y. Urban heat island effect: A systematic review of spatio-temporal factors, data, methods, and mitigation measures. Int. J. Appl. Earth Obs. Geoinf. 2018, 67, 30–42. [Google Scholar] [CrossRef]
- Li, H.; Zhou, Y.; Li, X.; Meng, L.; Wang, X.; Wu, S.; Sodoudi, S. A new method to quantify surface urban heat island intensity. Sci. Total Environ. 2018, 624, 262–272. [Google Scholar] [CrossRef] [PubMed]
- U.S. Geological Survey. Annual National Land Cover Database (NLCD) Collection1.0 Reference Data Product: U.S. Geological Survey data release. 2005. [Google Scholar] [CrossRef]
- Homer, C.; Dewitz, J.; Jin, S.; Xian, G.; Costello, C.; Danielson, P.; Gass, L.; Funk, M.; Wickham, J.; Stehman, S.; Auch, R. Conterminous United States land cover change patterns 2001–2016 from the 2016 National Land Cover Database. ISPRS J. Photogramm. Remote Sens. 2020, 162, 184–199. [Google Scholar] [CrossRef] [PubMed]
- Mathew, A.; Khandelwal, S.; Kaul, N. Analysis of diurnal surface temperature variations for the assessment of surface urban heat island effect over Indian cities. Energy Build. 2017, 159, 271–295. [Google Scholar] [CrossRef]
- Schwarz, N.; Lautenbach, S.; Seppelt, R. Exploring indicators for quantifying surface urban heat islands of European cities with MODIS land surface temperatures. Remote Sens. Environ. 2011, 115, 3175–3186. [Google Scholar] [CrossRef]
- Yao, R.; Wang, L.; Huang, X.; Zhang, W.; Li, J.; Niu, Z. Interannual variations in surface urban heat island intensity and associated drivers in China. J. Environ. Manag. 2018, 222, 86–94. [Google Scholar] [CrossRef] [PubMed]
- Zhou, D.; Zhang, L.; Li, D.; Huang, D.; Zhu, C. Climate–vegetation control on the diurnal and seasonal variations of surface urban heat islands in China. Environ. Res. Lett. 2016, 11, 074009. [Google Scholar] [CrossRef]
- Kim, W.; Brown, R. Urban heat island (UHI) intensity and magnitude estimations: A systematic literature review. Sci. Tot.Env. 2021, 146389. [Google Scholar] [CrossRef] [PubMed]
- Qiu, R.; Zhan, Q.; Tu, S. Long-term global trends and influencing factors of surface urban cool and heat islands. Int. J. Digit. Earth 2025, 18, 2489731. [Google Scholar] [CrossRef]
- Guan, Y.; Quan, J.; Ma, T.; Cao, S.; Xu, C.; Guo, J. Identifying Major Diurnal Patterns and Drivers of Surface Urban Heat Island Intensities across Local Climate Zones. Remote Sens. 2023, 15, 5061. [Google Scholar] [CrossRef]
- Shi, L.; Ling, F.; Foody, G.M.; Yang, Z.; Liu, X.; Du, Y. Seasonal SUHI Analysis Using Local Climate Zone Classification: A Case Study of Wuhan, China. Int. J. Environ. Res. Public Health 2021, 18, 7242. [Google Scholar] [CrossRef] [PubMed]
- Yang, Q.; Xu, Y.; Tong, X.; Hu, T.; Liu, Y.; Chakraborty, T.; Yao, R.; Xiao, C.; Chen, S.; Ma, Z. Influence of urban extent discrepancy on the estimation of surface urban heat island intensity: A global-scale assessment in 892 cities. J. Clean. Prod. 2023, 426, 139032. [Google Scholar] [CrossRef]
- Liu, H.; He, B.; Gao, S.; Zhan, Q.; Yang, C. Influence of Non-Urban Reference Delineation on Trend Estimate of Surface Urban Heat Island Intensity: A Comparison of Seven Methods. Remote Sens. Env. 2023, 296, 113735. [Google Scholar] [CrossRef]
- Li, K.; Chen, Y. Identifying and characterizing frequency and maximum durations of surface urban heat and cool island across global cities. Sci. Tot. Env. 2023, 859, 160218. [Google Scholar] [CrossRef] [PubMed]
- Rizwan, A.M.; Dennis, L.Y. A review on the generation, determination and mitigation of Urban Heat Island. J. Env. Sci. 2008, 20, 120–128. [Google Scholar] [CrossRef] [PubMed]
- Peng, S.; Piao, S.; Ciais, P.; Friedlingstein, P.; Ottlé, C.; Bréon, F.-M.; Nan, H.; Zhou, L.; Myneni, R.B. Surface urban heat island across 419 big global cities. Environ. Sci. Technol. 2012, 46, 696–703. [Google Scholar] [CrossRef] [PubMed]
- Mohamed, A.; Lorestani, N.; Shabani, F. Impact of urbanization on land surface temperature: A global perspective. Curr. Res. Environ. Sustain. 2025, 10, 100315. [Google Scholar] [CrossRef]
- Zhou, W.; Qian, Y.; Li, X.; Li, W.; Han, L. Relationships between land cover and the surface urban heat island: Seasonal variability and effects of spatial and thematic resolution of land cover data on predicting land surface temperatures. Landsc. Ecol. 2014, 29, 153–167. [Google Scholar] [CrossRef]
- U.S. Census Bureau. QuickFacts County Tables, American Community Survey 5-Year Estimates Subject Tables, Table SBO030223, 2025. Available online: https://www.census.gov/quickfacts/fact/table.
- City of Huntsville Planning Division. The Huntsville Development Review, Annual Edition; City of Huntsville: Huntsville, AL, USA, 2025. [Google Scholar]
- Guzman, L.A. The Impact of Urban Development and Precipitation Changes to Stream Quality in Huntsville. Honors Thesis, University of Alabama in Huntsville, 2020. [Google Scholar]
- Martin, M.; Hall, D.; Marzen, L.; Alexander, T. Remote sensing analysis of urban expansion in Birmingham, Alabama: 1988–2004. Proc. Appl. Geogr. Conf. 2007, 30, 147–156. [Google Scholar]
- Rahman, M. Growth of Alabama urban areas and its impact on changing environmental dynamics. Master’s Thesis, Auburn University, 2014. [Google Scholar]
- Chatterjee, S.; Kulawardhana, R.; Lotsah, M.; Rathnayaka, R.; Mao, J.F.; Allen-Dumas, M.; Hagos, S.; Chand, D. Remote Sensing-Based Assessment of Urban Heat Island Effects: A Case Study from Three Major Cities of Alabama, USA. Adv. Remote Sens. 2026, 15, 79–97. [Google Scholar]
- U.S. Census Bureau. Madison County, Alabama profile. 2025. Available online: https://data.census.gov.
- Theodoridis, S.; Koutroumbas, K. Chapter 14—Clustering Algorithms III: Schemes Based on Function Optimization. In Pattern Recognition (Fourth Edition); Academic Press, 2009; pp. 701–763. ISBN 9781597492720. [Google Scholar]
- Yao, R.; Wang, L.; Huang, X.; Gong, W.; Xia, X. Greening in rural areas increases the surface urban heat island intensity. Geophys. Res. Lett. 2019, 46, 2204–2212. [Google Scholar] [CrossRef]
- Si, M.; Li, Z.L.; Nerry, F.; Tang, B.H.; Leng, P.; Wu, H.; Zhang, X.; Shang, G. Spatiotemporal pattern and long-term trend of global surface urban heat islands characterized by dynamic urban-extent method and MODIS data. ISPRS J. Photogram. Remote Sens. 2022, 183, 321–335. [Google Scholar] [CrossRef]
- Foody, G.M. Status of land cover classification accuracy assessment. Remote Sens. Environ. 2002, 80, 185–201. [Google Scholar] [CrossRef]
- Zhou, D.; Zhao, S.; Liu, S.; Zhang, L.; Zhu, C. Surface urban heat island in China’s 32 major cities: Spatial patterns and drivers. Remote Sens. Environ. 2014, 152, 51–61. [Google Scholar] [CrossRef]
- Ma, Z.; Fu, H.; Wen, J.; Chen, Z. Evaluating Urban Heat Island Effects in the Southwestern Plateau of China: A Comparative Analysis of Nine Estimation Methods. Land 2025, 14, 37. [Google Scholar] [CrossRef]
- Lai, J.; Zhan, W.; Huang, F.; Voogt, J.; Bechtel, B.; Allen, M.; Peng, S.; Hong, F.; Liu, Y.; Du, P. Identification of typical diurnal patterns for clear-sky climatology of surface urban heat islands. Remote Sens. Env. 2018, 217, 203–220. [Google Scholar] [CrossRef]
- Mann, H.B. Nonparametric tests against trend. Econometrica 1945, 13, 245–259. [Google Scholar] [CrossRef]
- Kendall, M.G. Rank Correlation Methods; Griffin: London, UK, 1975. [Google Scholar]
- Bueno-Suárez, C.; Coq-Huelva, D. Sustaining what is unsustainable: A review of urban sprawl and urban socio-environmental policies in North America and Western Europe. Sustainability 2020, 12, 4445. [Google Scholar] [CrossRef]
- Angel, S.; Sheppard, S.; Civco, D.L.; Buckley, R.; Chabaeva, A.; Gitlin, L.; Perlin, M. The Dynamics of Global Urban Expansion; World Bank: Washington, DC, USA, 2005. [Google Scholar]
- Sun, Y.; Zhang, X.; Ren, G.; Zwiers, F.W.; Hu, T. Contribution of urbanization to warming in China. Nat. Clim. Chang. 2016, 6, 706–709. [Google Scholar] [CrossRef]
- Du, R.; Liu, C.H.; Li, X.; Lin, C.Y. Interaction among local flows, UHI, coastal winds, and complex terrain: Effect on urban-scale temperature and building energy consumption during heatwaves. Energy Build. 2024, 15, 113763. [Google Scholar] [CrossRef]
- Du, S.; Zhang, X.; Jin, X.; Zhou, X.; Shi, X. A review of multi-scale modeling, assessment, and improvement methods of the urban thermal and wind environment. Build. Env. 2022, 213, 108860. [Google Scholar] [CrossRef]
- Tzavali, A.; Paravantis, J.P.; Mihalakakou, G.; Fotiadi, A.; Stigka, E. Urban heat island intensity: A literature review. Fresenius Environ. Bull. 2015, 24(12b), 4537–4554. [Google Scholar]
- Clinton, N.; Gong, P. MODIS detected surface urban heat islands and sinks: Global locations and controls. Remote Sens. Environ. 2013, 134, 294–304. [Google Scholar] [CrossRef]
- Debbage, N.; Shepherd, J.M. The urban heat island effect and city contiguity. Comput. Envt. Urban Sys. 2015, 54, 181–194. [Google Scholar] [CrossRef]
- Zhou, B.; Rybski, D.; Kropp, J.P. The role of city size and urban form in the surface urban heat island. Sci. Rep. 2017, 7, 4791. [Google Scholar] [CrossRef] [PubMed]
- Zhou, Y.; Guan, H.; Gharib, S.; Batelaan, O.; Simmons, C.T. Cooling power of sea breezes and its inland penetration in dry-summer Adelaide, Australia. Atmos. Res. 2021, 250, 105409. [Google Scholar] [CrossRef]
- Dong, R.; Wurm, M.; Taubenböck, H. Seasonal and Diurnal Variation of Land Surface Temperature Distribution and Its Relation to Land Use/Land Cover Patterns. Int. J. Environ. Res. Public Health 2022, 19, 12738. [Google Scholar] [CrossRef] [PubMed]
- Giridharan, R.; Kolokotroni, M. Urban heat island characteristics in London during winter. Sol. Ener. 2009, 83, 1668–1682. [Google Scholar] [CrossRef]
- Zhang, Y.; Zhu, Y.; Yang, K.; Du, S.; Wang, Q.; Zhao, L.; Peng, Z.; Luo, Y. The response mechanism of urban precipitation to impervious surface expansion. J. Hydr. Reg. Stud. 2025, 62, 102789. [Google Scholar]
- Liang, Z.; Wu, S.; Wang, Y.; Wei, F.; Huang, J.; Shen, J.; Li, S. The relationship between urban form and heat island intensity along the urban development gradients. Sci. Total Environ. 2020, 708, 135011. [Google Scholar] [CrossRef] [PubMed]
Figure 1.
Map of the study sites: Location of Madison and Limestone (a), Jefferson (b), and Mobile (c) counties within the State of Alabama hosting three city areas: Huntsville, Birmingham, and Mobile, respectively. NLCD developed land cover classes mapped for the year 2024 are displayed for the state of Alabama and a closer view of the three study areas.
Figure 1.
Map of the study sites: Location of Madison and Limestone (a), Jefferson (b), and Mobile (c) counties within the State of Alabama hosting three city areas: Huntsville, Birmingham, and Mobile, respectively. NLCD developed land cover classes mapped for the year 2024 are displayed for the state of Alabama and a closer view of the three study areas.
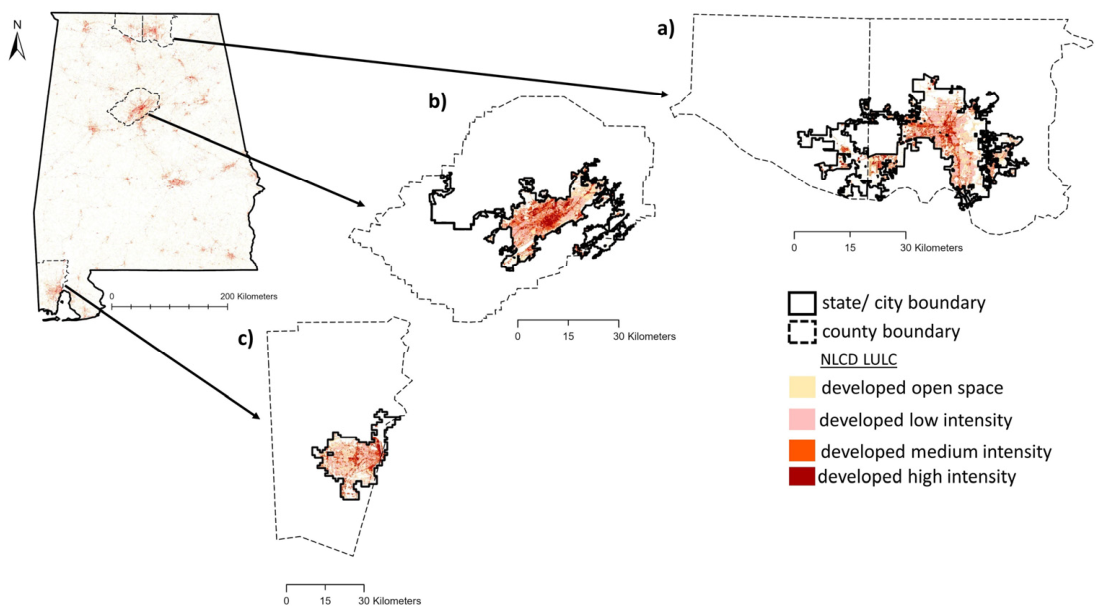
Figure 2.
Graphical flowchart summarizing data and methodological approach. * Indicate looping of the process using individual time series products at a time.
Figure 2.
Graphical flowchart summarizing data and methodological approach. * Indicate looping of the process using individual time series products at a time.
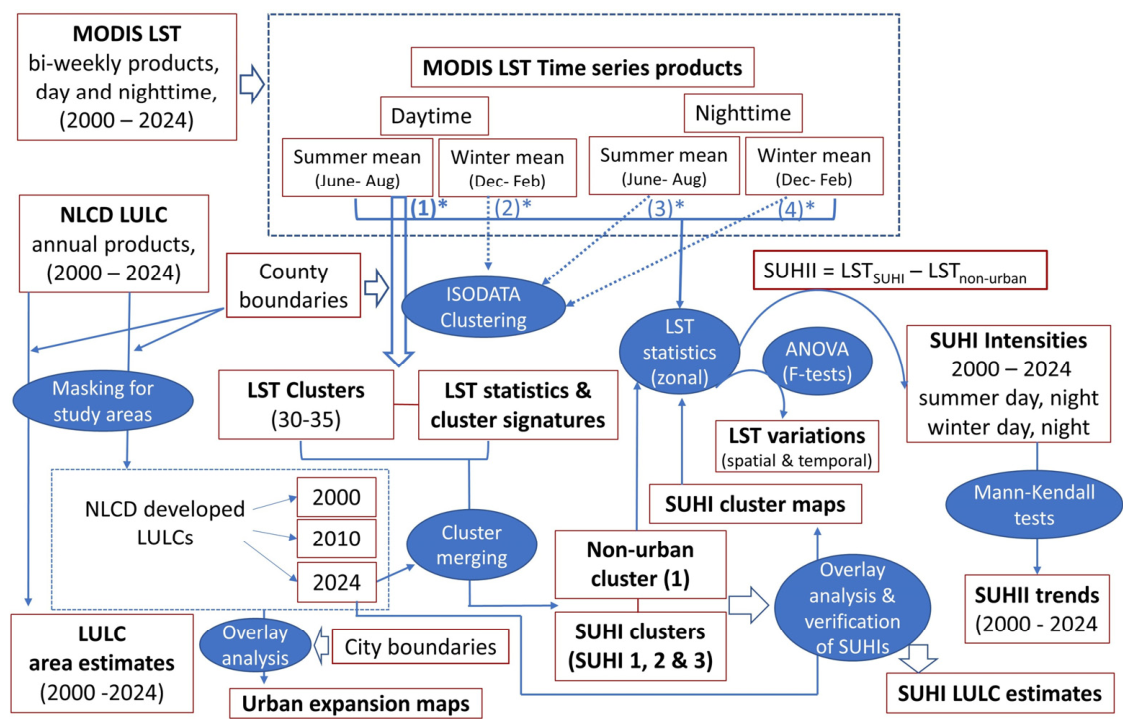
Figure 3.
LULC changes over the study period within the three cities: Huntsville (a), Birmingham (b), and Mobile (c). Percentage areas under each LULC were derived using the NLCD annual LULC products for the period from 2000 to 2024.
Figure 3.
LULC changes over the study period within the three cities: Huntsville (a), Birmingham (b), and Mobile (c). Percentage areas under each LULC were derived using the NLCD annual LULC products for the period from 2000 to 2024.
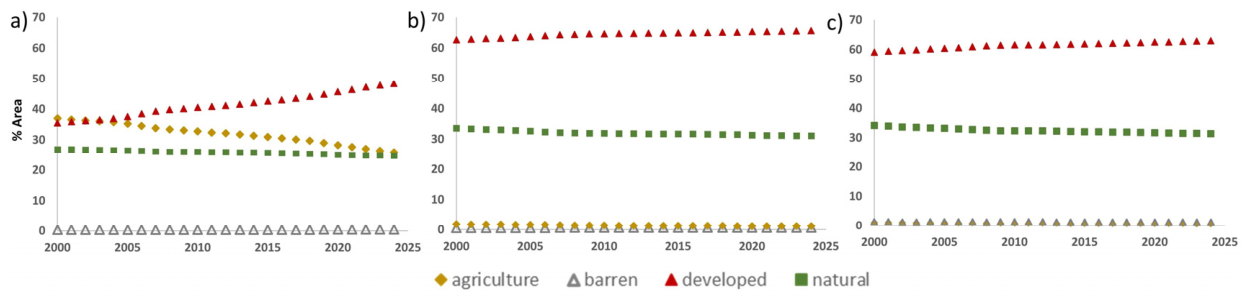
Figure 4.
Spatial distributions of the developed areas mapped using NLCD 2024 LULC data (a), and spatial expansion of the developed areas from 2000 to 2024 mapped using NLCD 2000, 2010, and 2024 LULC data products (b) within the three city areas: Huntsville (left), Birmingham (middle), and Mobile (right).
Figure 4.
Spatial distributions of the developed areas mapped using NLCD 2024 LULC data (a), and spatial expansion of the developed areas from 2000 to 2024 mapped using NLCD 2000, 2010, and 2024 LULC data products (b) within the three city areas: Huntsville (left), Birmingham (middle), and Mobile (right).
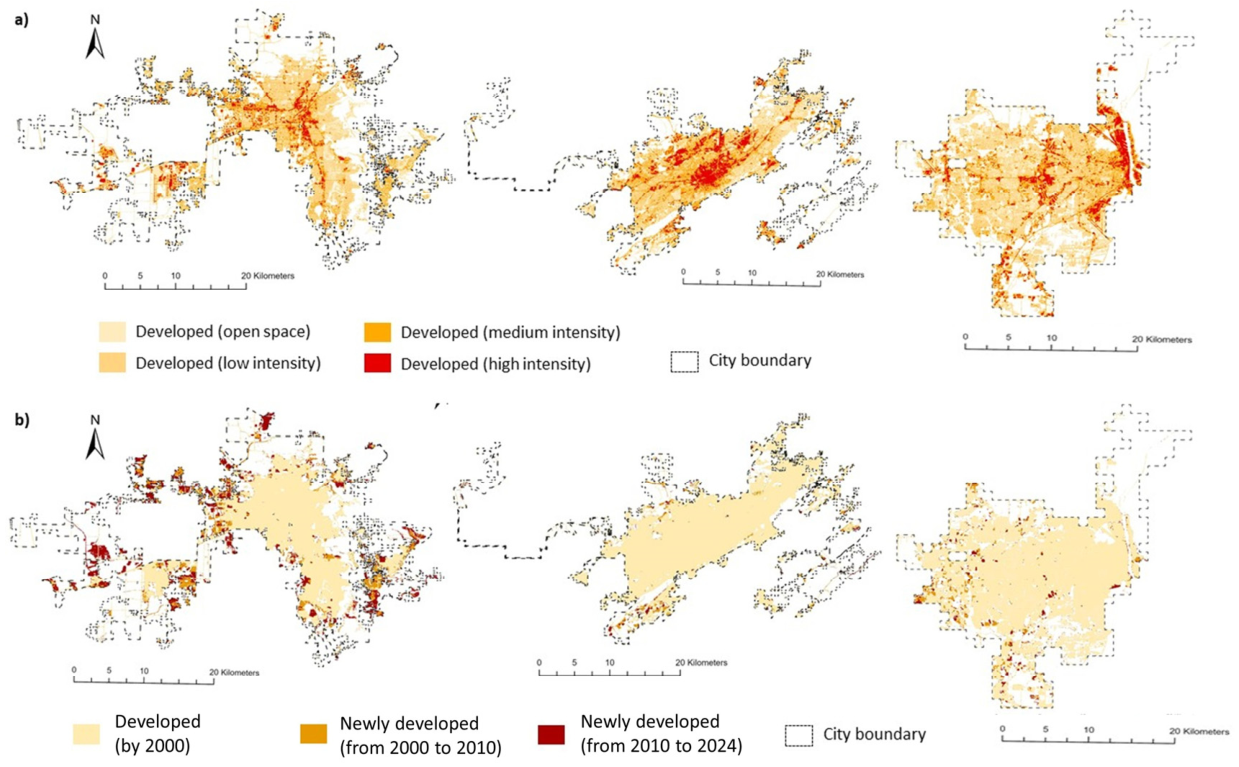
Figure 5.
Cluster signature plots reflecting temporal variations of seasonal average LSTs over the 3 SUHI clusters and their surrounding non-urban areas of Madison-Limestone counties (a), Jefferson county (b), and Mobile county (c) areas. Signature plots shown were derived by merging respective initial cluster signatures generated from ISODATA clustering of yearly average summer daytime LST time series products, and thus, the Y-axis reflects average summer daytime LSTs.
Figure 5.
Cluster signature plots reflecting temporal variations of seasonal average LSTs over the 3 SUHI clusters and their surrounding non-urban areas of Madison-Limestone counties (a), Jefferson county (b), and Mobile county (c) areas. Signature plots shown were derived by merging respective initial cluster signatures generated from ISODATA clustering of yearly average summer daytime LST time series products, and thus, the Y-axis reflects average summer daytime LSTs.
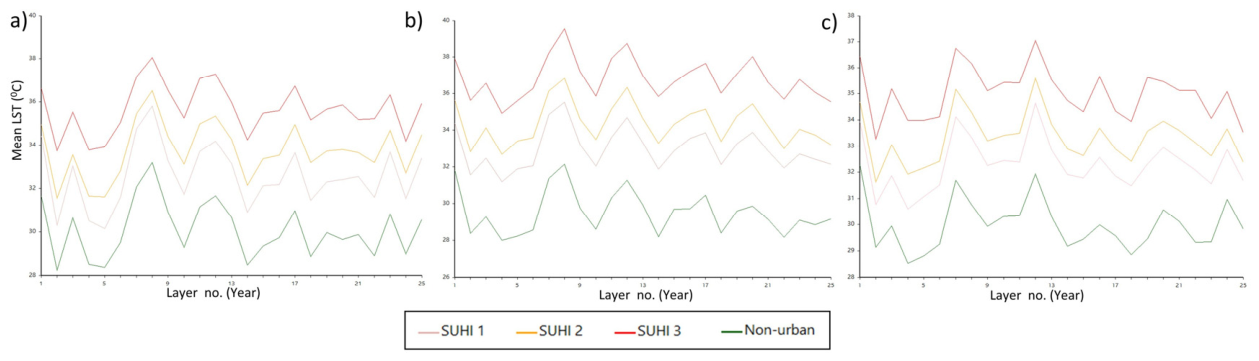
Figure 6.
Spatial distributions of the developed areas mapped using NLCD 2024 LULC products(a), SUHI clusters mapped using the ISODATA clustering approach on daytime LST products of summer (b-left) and winter (b-right), and long-term average daytime LSTs of summer (c-left) and winter (c-right). All maps of developed areas, SUHI clusters, and long-term mean LSTs for the Huntsville city area within the Madison-Limestone county boundary (top), the Birmingham city area within the Jefferson county boundary (middle), and the Mobile city area within the Mobile county boundary (bottom) are included.
Figure 6.
Spatial distributions of the developed areas mapped using NLCD 2024 LULC products(a), SUHI clusters mapped using the ISODATA clustering approach on daytime LST products of summer (b-left) and winter (b-right), and long-term average daytime LSTs of summer (c-left) and winter (c-right). All maps of developed areas, SUHI clusters, and long-term mean LSTs for the Huntsville city area within the Madison-Limestone county boundary (top), the Birmingham city area within the Jefferson county boundary (middle), and the Mobile city area within the Mobile county boundary (bottom) are included.
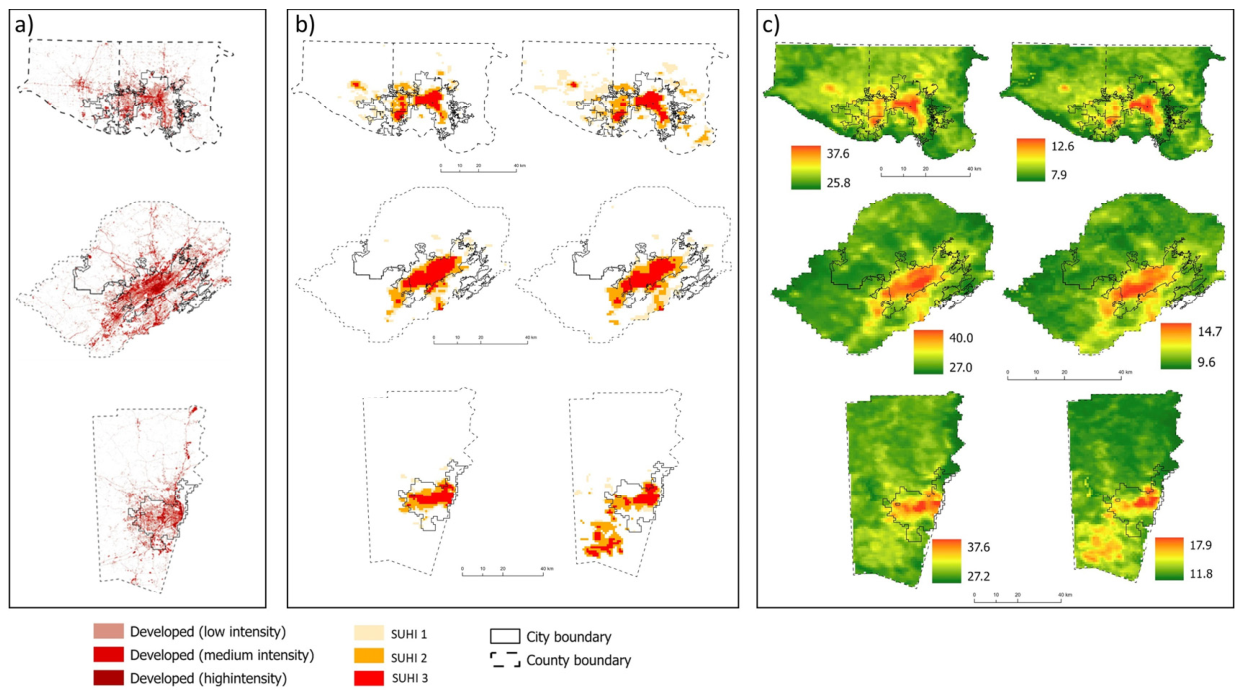
Figure 7.
SUHI intensities (long-term averages during 2000 to 2024) among the 3 SUHI clusters within each study site during (a) summer daytime, (b) summer nighttime, (c) winter daytime & (d) winter nighttime (* indicates non-significant difference at 95% CI).
Figure 7.
SUHI intensities (long-term averages during 2000 to 2024) among the 3 SUHI clusters within each study site during (a) summer daytime, (b) summer nighttime, (c) winter daytime & (d) winter nighttime (* indicates non-significant difference at 95% CI).
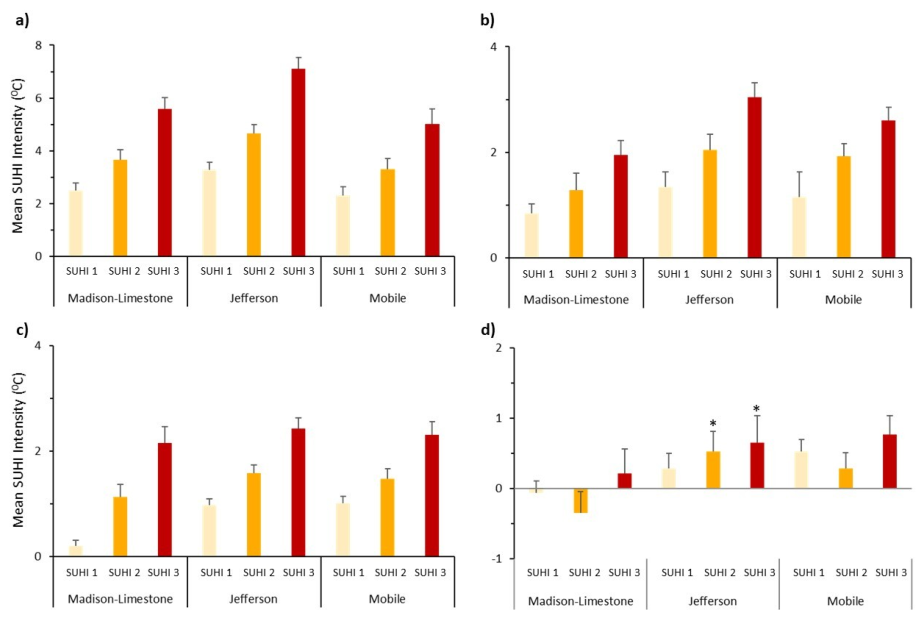
Figure 8.
Variations of nighttime LST means over time for the SUHI clusters and their surrounding non-urban areas within the 3 study sites: Madison-Limestone counties—hosting Huntsville city area(left), Jefferson county—hosting Birmingham city area (middle), and Mobile county—hosting the Mobile city area (right) during summer (a) and winter (b) months. (Mean LSTs were calculated by averaging LSTs of all pixels within each cluster).
Figure 8.
Variations of nighttime LST means over time for the SUHI clusters and their surrounding non-urban areas within the 3 study sites: Madison-Limestone counties—hosting Huntsville city area(left), Jefferson county—hosting Birmingham city area (middle), and Mobile county—hosting the Mobile city area (right) during summer (a) and winter (b) months. (Mean LSTs were calculated by averaging LSTs of all pixels within each cluster).
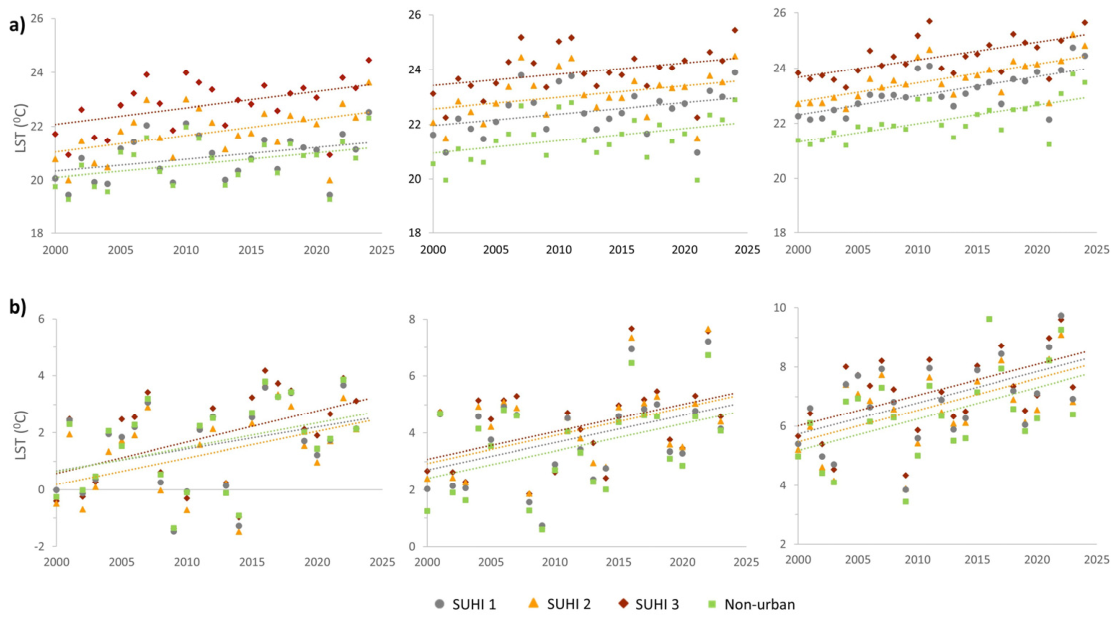

Table 1.
Spatial expansion in developed areas over the study period.
| Total land extent within the city limit km2 (sq miles) | Total land extent of developed areas km2 (sq miles) |
Developed area as a percentage of total land extent (%) | ||||
|---|---|---|---|---|---|---|
| 2000 | 2024 | 2000 | 2024 | % increase | ||
| Huntsville city area | 589 (227.5) |
209 (80.6) |
285 (110.1) |
35.44 | 48.38 | 12.94 |
| Birmingham city area | 386 (148.9) |
242 (93.3) |
253 (97.7) |
62.69 | 65.65 | 2.96 |
| Mobile city area | 406 (156.9) |
92.0 (238) |
254 (98.0) |
58.64 | 62.44 | 3.80 |
Table 2.
Distribution of NLCD LULCs within the mapped SUHI clusters. Percentage area estimates from overlay analyses between the SUHI cluster layers derived using summer daytime LST time series product and NLCD 2024 LULC data are summarized.
Table 2.
Distribution of NLCD LULCs within the mapped SUHI clusters. Percentage area estimates from overlay analyses between the SUHI cluster layers derived using summer daytime LST time series product and NLCD 2024 LULC data are summarized.
| NLCD LULC | % area | |||||
|---|---|---|---|---|---|---|
| SUHI-3 | SUHI-2 & SUHI-1 | |||||
| Madison-Limestone | Jefferson | Mobile | Madison-Limestone | Jefferson | Mobile | |
| Developed open space (NLCD 21) | 20.4 | 15.7 | 19.9 | 25.0 | 23.1 | 23.8 |
| Developed low intensity (NLCD 22) | 33.6 | 37.2 | 33.9 | 22.2 | 38.5 | 35.7 |
| Developed medium intensity (NLCD 23) | 27.0 | 25.6 | 21.9 | 12.0 | 18.7 | 16.1 |
| Developed high intensity (NLCD 24) | 13.9 | 14.8 | 8.0 | 1.2 | 4.4 | 3.5 |
| Other LULCs | 5.1 | 6.7 | 16.3 | 39.6 | 15.4 | 21.0 |
| All developed LULCs (NLCD 21-24) | 94.9 | 93.3 | 83.7 | 60.4 | 84.6 | 79.0 |
Table 3.
Variation of long-term average LSTs among the SUHI clusters* and their surrounding areas over 3 study sites.
Table 3.
Variation of long-term average LSTs among the SUHI clusters* and their surrounding areas over 3 study sites.
| Long-term average LSTs over the study period from 2000 to 2024±1 StdDev (0C) | |||||
|---|---|---|---|---|---|
| SUHI 3 | SUHI 2 | SUHI 1 | Non-urban | ||
| Summer daytime | Huntsville city area (Madison–Limestone) (H | 35.7 ± 0.9 | 33.7 ± 0.7 | 32.6 ± 0.8 | 30.1 ± 1.5 |
| Birmingham city area (Jefferson) | 36.8 ± 1.3 | 34.4 ± 0.8 | 33.0 ± 0.6 | 29.7 ± 1.3 | |
| Mobile city area (Mobile) | 35.0 ± 1.0 | 33.3 ± 0.7 | 32.3 ± 0.6 | 30.0 ± 0 | |
| Summer nighttime | Huntsville city area (Madison–Limestone) (H | 22.8 ± 0.6 | 21.8 ± 0.7 | 20.9 ± 0.4 | 20.7 ± 0.5 |
| Birmingham city area (Jefferson) | 23.9 ± 0.5 | 23.1 ± 0.5 | 22.5 ± 0.5 | 21.5 ± 0.4 | |
| Mobile city area (Mobile) | 24.4 ± 0.5 | 23.6 ± 0.5 | 23.1 ± 0.5 | 22.1 ± 0.4 | |
| Winter daytime | Huntsville city area (Madison–Limestone) (H | 11.9 ± 0.5 | 11.2 ± 0.4 | 10.7 ± 0.5 | 9.9 ± 0.7 |
| Birmingham city area (Jefferson) | 14.0 ± 0.5 | 13.0 ± 0.5 | 12.3 ± 0.4 | 10.9 ± 0.7 | |
| Mobile city area (Mobile) | 16.9 ± 0.5 | 16.2 ± 0.4 | 15.4 ± 0.4 | 14.3 ± 0.9 | |
| Winter nighttime | Huntsville city area (Madison–Limestone) (H | 1.8 ± 0.7 | 1.3 ± 0.7 | 1.6 ± 0.8 | 1.6 ± 0.8 |
| Birmingham city area (Jefferson) | 4.2 ± 0.6 | 4.1 ± 0.7 | 3.8 ± 0.7 | 3.5 ± 0.6 | |
| Mobile city area (Mobile) | 7.2 ± 1.0 | 6.7 ± 0.9 | 6.9 ± 1.4 | 6.4 ± 0.8 | |
All LSTs among the SUHI clusters and non-urban surrounding areas within each study site were significantly different at 95% CI. *LST statistics for the SUHI maps derived using summer daytime LST products are reported.
Table 4.
Diurnal and seasonal variations of SUHIIs among the study sites.
| Long-term average SUHIIs (2000–20024) ±1StdDev (0C) |
|||
|---|---|---|---|
| Madison-Limestone | Jefferson | Mobile | |
| Summer daytime | 3.92±0.07 | 5.01±0.07 | 3.54±0.11 |
| Summer nighttime | 1.17±0.10 | 1.66±0.03 | 1.60±0.06 |
| Winter daytime | 1.35±0.07 | 2.14±0.0 | 1.89±0.13 |
| Winter nighttime | 0.07±0.10 | 0.51±0.8 | 0.55±0.4 |
Disclaimer/Publisher’s Note: The statements, opinions and data contained in all publications are solely those of the individual author(s) and contributor(s) and not of MDPI and/or the editor(s). MDPI and/or the editor(s) disclaim responsibility for any injury to people or property resulting from any ideas, methods, instructions or products referred to in the content. |
© 2026 by the authors. Licensee MDPI, Basel, Switzerland. This article is an open access article distributed under the terms and conditions of the Creative Commons Attribution (CC BY) license (http://creativecommons.org/licenses/by/4.0/).
Copyright: This open access article is published under a Creative Commons CC BY 4.0 license, which permit the free download, distribution, and reuse, provided that the author and preprint are cited in any reuse.