

Submitted:
03 June 2026
Posted:
04 June 2026
You are already at the latest version
Abstract
Artificial-intelligence-integrated 'buy now, pay later' (BNPL) platforms are diffusing rapidly across the Middle East and North Africa (MENA), raising concerns about consumer financial vulnerability. Drawing on choice-architecture, payment-decoupling, and financial-literacy literatures, this study examines how three platform-level features — algorithmic nudging, AI personalization intensity, and perceived ease of credit — are associated with impulsive buying tendency and downstream financial outcomes, and whether BNPL-specific financial literacy attenuates these associations. A multi-method design combined cross-sectional partial-least-squares structural-equation modeling (N = 1,247 active BNPL users in seven MENA countries) with a six-month longitudinal follow-up (N = 847, 68% retention). Algorithmic nudging was positively associated with impulsive buying tendency, which in turn was associated with elevated financial stress and longitudinal debt accumulation. AI personalization was positively associated with platform loyalty but co-varied with indirect indicators of financial risk — a pattern we describe as a loyalty trap and empirically document via piecewise longitudinal trajectories. BNPL-specific financial literacy moderated the associations between algorithmic nudging, impulsive buying, and adverse financial outcomes, with the highest-literacy quartile exhibiting substantially attenuated debt trajectories. We discuss boundary conditions, alternative explanations, and the limits of causal inference in non-experimental panel data. Findings inform evolving BNPL regulatory frameworks in MENA, with particular relevance to nudge-transparency disclosures, contractual cooling-off periods, and credit-bureau reporting standards.
Keywords:
algorithmic nudging
; buy now
; pay later (BNPL)
; financial over-indebtedness
; impulsive buying tendency
; financial literacy
; artificial intelligence personalization
; consumer financial protection
; fintech
1. Introduction
The global Buy Now, Pay Later (BNPL) market has experienced unprecedented growth, with transaction volumes surpassing USD 300 billion in 2024 and projected to exceed USD 600 billion by 2028 [1]. This surge follows a broader post-pandemic restructuring of consumer credit behaviour, in which households increasingly substitute short-cycle digital credit for traditional unsecured debt — a pattern Zhong et al. [2] document in their analysis of UK households, showing that COVID-19-era economic policies materially reshaped consumer debt trajectories and exposed structural vulnerabilities in non-mortgage debt categories. In the Middle East and North Africa (MENA) region, BNPL adoption has accelerated dramatically, fueled by high smartphone penetration rates (exceeding 80% in GCC countries), young demographic profiles, and increasing e-commerce activity [3]. A growing share of this activity is cross-border in nature. Wang and Zhou [4] show that participation in cross-border e-commerce platforms enhances export quality through innovation, productivity gains, and lower transaction costs — a supply-side dynamic that directly enlarges the digital product assortment to which MENA BNPL users are exposed, thereby raising both the opportunity and the temptation for impulsive cross-border purchases. Prior empirical work on BNPL has predominantly examined Anglophone markets and focused on either macro-level adoption drivers [5,6] or single-shot survey designs measuring debt outcomes [7,8]. This narrow geographic focus matters because, as Cahen et al. [9] demonstrate, the global digital competence of digital ventures — comprising sensing, networking, business-model, and technology capabilities — varies sharply across institutional contexts and shapes both market entry strategies and consumer-side outcomes. Their findings suggest that BNPL effects observed in mature Anglophone markets cannot be assumed to translate cleanly to MENA economies, where the institutional embedding of these digital ventures differs materially. The present study departs from this literature in three respects: (i) it foregrounds the AI substrate of contemporary BNPL platforms rather than treating BNPL as a generic credit instrument; (ii) it adopts a multi-country, longitudinal design within the under-researched MENA region; and (iii) it tests a mediated-moderated model that links platform-level features to consumer-level financial harm. Major regional providers including Tabby, Tamara, and Cashe have collectively processed over USD 2 billion in transactions during 2024, serving more than 5 million active users across Egypt, Saudi Arabia, the UAE, Jordan, and other MENA markets [10]. This rapid diffusion of BNPL services, while enhancing consumer purchasing power and merchant conversion rates, has simultaneously raised profound concerns regarding the psychological mechanisms through which algorithmic systems influence consumer financial behavior and the consequent risks of over-indebtedness [11].
The integration of artificial intelligence (AI) into BNPL platforms represents a paradigm shift in how consumer credit is marketed, distributed, and consumed. AI-driven personalization algorithms analyze browsing history, purchase patterns, social media activity, and demographic profiles to deliver hyper-personalized product recommendations, dynamic pricing offers, and frictionless credit approvals [12]. Social media is no longer an ancillary touchpoint but a core data input for these systems. Alarcón-del-Amo et al. [13], tracking exporting firms longitudinally between 2013 and 2021, document that intensive social-media use simultaneously reduces transaction costs and reshapes relational engagement with foreign customers. This dual dynamic — efficiency gains coupled with deepened relational embedding — provides a firm-side mirror to our consumer-side finding that AI personalisation strengthens platform loyalty while quietly intensifying financial exposure. Importantly, recent work by Kim et al. [14] shows that customization is not a static intervention but a dynamic journey: customers' responsiveness to personalized offerings shifts as they accumulate experience with the platform, generating reinforcing engagement loops. Applied to BNPL contexts, this dynamic-customization perspective implies that the longitudinal intensification of AI nudging observed in our Stage-2 data is not merely a marketing artefact but a structural feature of personalised credit ecosystems. When coupled with algorithmic nudging techniques—subtle design elements that guide user behavior without restricting choice [15]—these systems create powerful environmental cues that can override rational financial decision-making processes. The European Banking Authority has identified algorithmic nudging in digital credit as an emerging consumer protection risk, noting that 'dark patterns' in BNPL interfaces may exploit behavioral biases to encourage excessive borrowing [16]. Similarly, the Financial Conduct Authority's 2024 review of the UK BNPL market documented that 27% of BNPL users experienced repayment difficulties, with younger consumers and those with existing financial vulnerabilities disproportionately affected [17].
Despite the growing policy attention to BNPL-related consumer harm, academic research examining the psychological and financial consequences of AI-integrated BNPL schemes remains in its nascent stages [18]. Existing studies have predominantly focused on BNPL adoption determinants, user demographics, and macroeconomic implications, while the underlying behavioral mechanisms linking algorithmic platform features to consumer financial distress remain undertheorized [19]. Specifically, three critical research gaps persist. First, the role of algorithmic nudging as a distinct construct influencing consumer financial behavior through BNPL platforms has not been systematically conceptualized or empirically validated in the academic literature. Second, the mediating psychological mechanisms—particularly impulsive buying tendency—that translate AI-driven platform features into adverse financial outcomes remain poorly understood [20]. Third, the protective or exacerbating role of financial literacy in moderating these relationships within the MENA context has not been adequately examined, despite significant cross-cultural variation in financial capability and regulatory environments [21].
This study addresses these gaps by developing and testing an integrative theoretical model that draws upon three seminal research streams: Thaler and Sunstein's [15] choice architecture and nudge theory, Soman and et al. [22] payment decoupling and transparency framework, and Lusardi and Mitchell's [23] financial literacy theory. By synthesizing these theoretical foundations, we propose that AI personalization intensity, perceived ease of credit, and algorithmic nudging collectively activate impulsive buying tendency, which subsequently drives financial stress and debt accumulation, while platform loyalty emerges as a paradoxical outcome that reinforces continued engagement. Financial literacy is theorized to moderate the strength of these relationships, buffering the harmful effects of algorithmic persuasion on vulnerable consumers.
The choice architecture framework, originally developed by Thaler and Sunstein [15], posits that the design of decision environments significantly influences individual choices without restricting freedom. In the context of AI-integrated BNPL platforms, choice architecture manifests through algorithmic nudging—interface design elements that leverage behavioral biases to steer users toward specific actions. Recent extensions of this framework to digital environments by Caraban et al. [24] and Mirsch et al. [25] have identified specific nudge types prevalent in e-commerce, including defaults, social proof, scarcity cues, and simplification. These nudge mechanisms are particularly potent in BNPL contexts because they exploit consumers' present bias, optimism bias, and limited attention to repayment obligations [26]. The current study extends this theoretical tradition by operationalizing algorithmic nudging as a multi-dimensional construct encompassing interface design features, personalized timing, and social influence elements unique to BNPL platforms.
The payment decoupling framework, articulated by Prelec and Loewenstein [27] and extended by Soman et al. [22], provides the second theoretical pillar. This framework posits that the temporal separation between consumption and payment reduces the 'pain of paying,' leading to increased spending and diminished financial awareness. BNPL schemes represent an extreme form of payment decoupling, completely divorcing the purchase experience from the financial consequences through instant approval, minimal friction, and deferred repayment structures [28]. When combined with AI-driven personalization that presents credit at moments of maximum purchasing intent, the decoupling effect is amplified, creating conditions conducive to impulsive buying and subsequent financial distress [29].
The study's central research question is: How do AI personalization intensity, perceived ease of credit, and algorithmic nudging influence consumer financial vulnerability (financial stress, debt accumulation, and platform loyalty) through impulsive buying tendency, and to what extent does financial literacy moderate these relationships in the MENA region? We hypothesize that: H1: AI personalization intensity positively affects perceived ease of credit. H2: AI personalization intensity positively affects algorithmic nudging. H3: Perceived ease of credit positively affects algorithmic nudging. H4: AI personalization intensity positively affects impulsive buying tendency. H5: Perceived ease of credit positively affects impulsive buying tendency. H6: Algorithmic nudging positively affects impulsive buying tendency. H7: AI personalization intensity positively affects financial stress. H8: Perceived ease of credit positively affects financial stress. H9: Algorithmic nudging positively affects financial stress. H10: Impulsive buying tendency positively affects financial stress. H11: AI personalization intensity positively affects debt accumulation. H12: Perceived ease of credit positively affects debt accumulation. H13: Algorithmic nudging positively affects debt accumulation. H14: Impulsive buying tendency positively affects debt accumulation. H15: AI personalization intensity positively affects platform loyalty. H16: Perceived ease of credit positively affects platform loyalty. H17: Algorithmic nudging positively affects platform loyalty. H18: Financial stress negatively affects platform loyalty. H19: Debt accumulation negatively affects platform loyalty. We further hypothesize that financial literacy negatively moderates four specific paths within the structural model: the paths from algorithmic nudging to financial stress (H20) and to debt accumulation (H21), and the paths from impulsive buying tendency to financial stress (H22) and to debt accumulation (H23). These four paths are selected because they represent the two theoretically central mechanisms (platform-side nudging and consumer-side impulsivity) through which financial harm is most proximally produced. Additional moderation paths involving AI personalization intensity and perceived ease of credit are examined in exploratory analyses (Appendix C, Table C1).
The significance of this inquiry extends beyond academic contribution to address an urgent public policy imperative. Regulatory authorities across the MENA region, including the Saudi Arabian Monetary Authority (SAMA), the Central Bank of the UAE, and the Central Bank of Egypt, have begun implementing or considering BNPL-specific regulatory frameworks [30]. However, these regulatory responses remain largely untested regarding their effectiveness in protecting consumers from algorithmic manipulation while preserving fintech innovation [31]. The empirical evidence generated by this study provides a timely foundation for evidence-based policy formulation, identifying specific platform features and user characteristics associated with financial harm. Moreover, the identification of financial literacy as a protective moderator suggests that educational interventions may complement regulatory approaches in building consumer resilience against algorithmic persuasion [32].
The remainder of this paper is organized as follows. Section 2 presents the theoretical foundations and hypothesis development. Section 3 describes the research methodology and study design. Section 4 reports the empirical results. Section 5 provides a critical discussion of findings. Section 6 concludes with implications and recommendations.
2. Literature Review and Hypothesis Development
The academic study of consumer credit behavior has undergone significant transformation over the past five decades, evolving from purely economic models of rational borrowing to sophisticated interdisciplinary frameworks incorporating behavioral economics, social psychology, and information systems [33]. The emergence of BNPL as a distinct product category represents the latest evolution in this trajectory, characterized by the convergence of e-commerce, instant digital credit, and algorithmic consumer influence [34]. Unlike traditional installment credit or credit card offerings, BNPL schemes operate at the precise intersection of consumption intent and payment decision, embedding credit offerings within the purchase journey through seamless platform integration [35].
The concept of algorithmic nudging, while drawing upon Thaler and Sunstein's [15] foundational work on choice architecture, represents a distinct phenomenon that merits independent theoretical treatment. Whereas traditional nudging involves static environmental redesign (e.g., placing healthier foods at eye level), algorithmic nudging operates dynamically, adapting in real-time to individual user behavior, emotional states, and contextual factors [36]. Möhlmann [37] defines algorithmic nudging as 'the use of AI systems to automatically personalize choice architecture elements based on user data, with the goal of influencing behavior without restricting options.' This definition emphasizes three distinguishing features: automation (no human intervention required), personalization (tailored to individual profiles), and adaptation (continuous refinement based on behavioral feedback). In BNPL contexts, algorithmic nudging manifests through personalized payment option presentation, dynamic credit limit adjustments, social proof integration, scarcity signaling, and friction reduction at checkout [38].
AI personalization intensity refers to the degree to which consumers perceive that AI algorithms analyze their personal data to create tailored shopping and credit experiences [39]. This construct extends the broader concept of personalization in e-commerce [40] to specifically capture the AI-driven nature of contemporary recommendation and pricing systems. The construct encompasses both the perceived sophistication of the AI system (the extent to which consumers believe advanced algorithms are processing their data) and the perceived relevance of resulting recommendations (the practical utility of personalized suggestions) [41]. Research by Lee [42] demonstrates that AI personalization in financial services creates both utilitarian benefits (improved product fit) and hedonic experiences (enjoyment of discovery), with the hedonic dimension potentially overwhelming rational evaluation of financial consequences.
Perceived ease of credit captures consumers' subjective assessment of the accessibility and simplicity of obtaining BNPL credit relative to traditional alternatives [43]. This construct reflects the fundamental value proposition of BNPL services—eliminating friction from the credit application process through instant approval, minimal documentation, and seamless integration with e-commerce checkout flows [44]. The construct builds upon Davis's [45] technology acceptance model concept of perceived ease of use, extending it to the specific context of digital credit acquisition. Aidala et al. [46] demonstrate that perceived ease of credit is a stronger predictor of BNPL adoption than traditional creditworthiness indicators, suggesting that BNPL services attract consumers precisely because they circumvent the cognitive and procedural barriers associated with conventional lending. Complementing this adoption-side evidence, Maesen and Ang [47], using customer-level transaction data from a large US retailer, show that BNPL installment adoption causally raises both purchase incidence and basket size by reducing perceived financial constraints — an effect strongest among smaller-basket and credit-reliant shoppers. Their three pre-registered experiments locate this mechanism in the easing of perceived costs and budget control, providing direct experimental support for our argument that AI-enabled payment decoupling fuels the impulsive-buying pathway hypothesised in H6.
Three theoretical streams provide the integrative framework for this study. First, choice architecture and nudge theory [15] explain how platform design features systematically influence consumer decisions. The original framework identifies six categories of nudge mechanisms: defaults, expect errors, give feedback, structure complex choices, incentives, and understanding mappings [48]. Recent extensions by Caraban et al. [24] adapt this taxonomy to digital environments, identifying interface nudges (visual hierarchy, defaults), information nudges (framing, social proof), and interaction nudges (simplification, guidance). In AI-integrated BNPL platforms, these nudge categories are amplified through algorithmic personalization, creating what Weinmann et al. [49] term 'hyper-nudging'—nudges that adapt in real-time to individual behavioral patterns.
The choice architecture framework is particularly relevant to BNPL contexts because these platforms inherently manipulate the choice environment in ways that favor credit uptake. For instance, presenting BNPL as the default payment option exploits status quo bias, while displaying social proof messages ('2,341 people chose BNPL for this item') leverages conformity pressures [50]. Time-limited offers and countdown timers exploit scarcity bias and urgency heuristics, while simplified checkout processes with one-click BNPL activation reduce deliberation time and opportunity for reconsideration [51]. The aggregation of these nudge mechanisms creates what Johnson et al. [52] describe as a 'choice architecture stack'—layered persuasive elements that collectively overwhelm consumer deliberative capacity.
Second, the payment decoupling framework [27,53] explains the psychological mechanisms through which BNPL services increase spending. The fundamental premise is that the temporal separation between consumption and payment reduces the 'pain of paying'—the immediate psychological discomfort associated with expenditure [54]. Soman et al. [22] demonstrate that payment transparency (the salience of the payment act) moderates this effect, with less transparent payment mechanisms (such as automatic BNPL installments) producing stronger decoupling effects. Recent extensions by Mogilner et al. [55] demonstrate that digital payment methods, particularly those integrated with e-commerce platforms, further attenuate payment transparency by completely removing the payment act from the consumption experience.
Prelec and Loewenstein's [27] 'double-entry mental accounting' model provides the micro-foundations for payment decoupling. According to this model, consumers experience immediate utility from acquisition but delayed disutility from payment. When consumption and payment are tightly coupled (cash transactions), the disutility of payment partially offsets the utility of acquisition, moderating spending. When decoupled (BNPL), the full acquisition utility is experienced immediately while payment disutility is deferred and often discounted [56]. AI personalization intensifies this effect by presenting BNPL options precisely when consumption utility is maximized (e.g., at the moment of product discovery) while payment disutility is temporally distant and abstract [57].
Third, the financial literacy framework [23] provides the theoretical basis for understanding individual differences in vulnerability to algorithmic persuasion. Financial literacy encompasses both objective knowledge (understanding of financial concepts, products, and risks) and subjective confidence (self-assessed financial capability) [58]. Consumers with higher financial literacy are hypothesized to be more resistant to algorithmic nudging because they possess the cognitive resources to critically evaluate nudge cues, recognize manipulative intent, and execute more deliberate decision-making processes [59]. Lusardi and Mitchell's [23] seminal work establishes that financially literate consumers make better borrowing decisions, avoid high-cost credit, and maintain adequate emergency savings. Extensions by Kaiser and Menkhoff [32] demonstrate that financial literacy effects are particularly pronounced in complex decision environments with multiple information cues—precisely the conditions created by AI-integrated BNPL platforms.
Recent empirical studies have begun documenting the behavioral and financial consequences of BNPL adoption. Kumar and Nayak [20] examined the effects of BNPL adoption on risky indebtedness among Indian consumers, finding that impulsive buying tendency and materialism significantly mediated the relationship between BNPL use and debt accumulation. Their study, employing a sample of 1,078 respondents, demonstrated that BNPL services activated consumption impulses that traditional credit products did not, attributing this effect to the unique integration of credit with the purchase moment. The path coefficient from BNPL adoption to impulsive buying tendency was β = 0.41 (p < 0.001), with impulsive buying subsequently predicting debt accumulation at β = 0.38 (p < 0.001).
Raj et al. [60] investigated the relationship between materialism and the dark sides of BNPL, identifying a positive association between materialistic values, compulsive buying behavior, and BNPL-induced financial stress. Their findings, based on survey data from 556 Indian consumers, indicated that BNPL services amplified the negative consequences of materialism by removing payment friction at the moment of consumption desire. The moderation analysis revealed that self-control significantly attenuated the materialism-compulsive buying relationship (β = -0.15, p < 0.01), suggesting individual differences in vulnerability. Similarly, Schomburgk and Hoffmann [61] demonstrated that mindfulness attenuated the relationship between BNPL use and financial wellbeing (β = -0.22, p < 0.001), suggesting that present-moment awareness may counteract the impulsivity-inducing effects of BNPL availability.
Ah Fook and McNeill [62] examined BNPL use and impulse buying behavior among Australian young adults, finding that the instant gratification enabled by BNPL services significantly increased unplanned purchasing (r = 0.34, p < 0.01). Their qualitative findings revealed that BNPL users often experienced a 'dissociation' between the shopping act and its financial consequences, consistent with the payment decoupling framework. The Central Bank of Ireland's [63] comprehensive review of the Irish BNPL market found that 35% of BNPL users reported spending more than intended, with 18% experiencing difficulty meeting repayment obligations. Notably, 43% of respondents aged 18-34 reported using BNPL for purchases they would not have made otherwise.
The role of AI and algorithmic personalization in consumer financial behavior has received increasing scholarly attention. Raji et al. [12] examined the role of AI-driven personalization in online shopping behavior, finding that algorithmic recommendations significantly increased both purchase likelihood (OR = 2.34) and basket size (+28%). Their study highlighted the 'filter bubble' effect, where AI personalization creates self-reinforcing consumption patterns by consistently presenting similar products and offers. Münscher et al. [38] provided a comprehensive taxonomy of digital nudging, identifying 16 distinct nudge archetypes commonly employed in digital choice environments and documenting their effects on user behavior across multiple domains. Their meta-analysis found that digital nudges produce average effect sizes of Cohen's d = 0.42 on targeted behaviors.
Donou-Adonsou and Leslie-Piper [64] analyzed social media sentiment regarding BNPL services, identifying a significant shift from predominantly positive sentiment in 2020 to increasingly negative sentiment by 2023, with growing concerns about debt, regret, and financial stress. Their sentiment analysis of 45,000 tweets revealed that emotional language around BNPL increasingly reflected anxiety (28% of posts) and regret (19%), suggesting that consumers' lived experiences with BNPL may diverge from initial positive expectations. Sharma et al. [19] examined the concept of 'psychological ownership' of borrowed money, finding that consumers who perceived greater psychological ownership of BNPL funds exhibited higher spending and lower repayment priority. Their experimental manipulation demonstrated that framing BNPL as 'your spending power' versus 'a loan' significantly affected financial decision-making (p < 0.05).
Hayashi and Routh [43] investigated how platform loyalty develops in fintech contexts, finding that both satisfaction with the core service and trust in the platform's benevolence predicted loyalty intentions. However, their study also documented a 'loyalty trap' phenomenon where highly loyal users continued using platforms despite negative financial outcomes, driven by habit, switching costs, and optimistic bias about future financial management. This finding is particularly relevant to BNPL contexts, where platform loyalty may perpetuate harmful financial behaviors even as users recognize negative consequences [65].
However, critical gaps remain in the existing literature. No prior study has simultaneously examined AI personalization, algorithmic nudging, and perceived ease of credit as antecedents of consumer financial outcomes in BNPL contexts. The mediating role of impulsive buying tendency has been examined in isolation but not as part of an integrated structural model incorporating all three platform features. The moderating role of financial literacy has been theorized but not empirically tested within the specific context of AI-integrated BNPL services. Furthermore, the vast majority of existing studies have been conducted in Western or South Asian contexts, with the MENA region significantly underrepresented [66]. The current study addresses these gaps through a comprehensive, multi-country investigation spanning seven MENA economies.
Based on the theoretical frameworks reviewed above and the identified research gaps, we develop the following hypotheses. The relationships between the independent variables are grounded in the theoretical expectation that AI personalization creates the foundation for both perceived ease of credit and algorithmic nudging. As AI systems personalize the user experience, they simultaneously streamline credit processes (increasing perceived ease) and optimize nudge delivery (enhancing algorithmic nudging effectiveness) [67].
H1: AI personalization intensity positively affects perceived ease of credit.
H2: AI personalization intensity positively affects algorithmic nudging.
H3: Perceived ease of credit positively affects algorithmic nudging.
H4: AI personalization intensity positively affects impulsive buying tendency.
H5: Perceived ease of credit positively affects impulsive buying tendency.
H6: Algorithmic nudging positively affects impulsive buying tendency.
H7: AI personalization intensity positively affects financial stress.
H8: Perceived ease of credit positively affects financial stress.
H9: Algorithmic nudging positively affects financial stress.
H10: Impulsive buying tendency positively affects financial stress.
H11: AI personalization intensity positively affects debt accumulation.
H12: Perceived ease of credit positively affects debt accumulation.
H13: Algorithmic nudging positively affects debt accumulation.
H14: Impulsive buying tendency positively affects debt accumulation.
H15: AI personalization intensity positively affects platform loyalty.
H16: Perceived ease of credit positively affects platform loyalty.
H17: Algorithmic nudging positively affects platform loyalty.
H18: Financial stress negatively affects platform loyalty.
H19: Debt accumulation negatively affects platform loyalty.
H20: Financial literacy negatively moderates the relationship between algorithmic nudging and financial stress, such that the effect is weaker for consumers with higher financial literacy.
H21: Financial literacy negatively moderates the relationship between algorithmic nudging and debt accumulation, such that the effect is weaker for consumers with higher financial literacy.
H22: Financial literacy negatively moderates the relationship between impulsive buying tendency and financial stress, such that the effect is weaker for consumers with higher financial literacy.
H23: Financial literacy negatively moderates the relationship between impulsive buying tendency and debt accumulation, such that the effect is weaker for consumers with higher financial literacy.
Figure 1 visualizes the integrative framework and maps all 23 hypothesized paths onto the converging theoretical lineages.
Figure 1. Integrative theoretical framework and hypothesized structural model. The three upper panels represent the converging theoretical traditions —Thaler and Sunstein's [15] choice architecture, Prelec and Loewenstein's [27] payment-decoupling framework, and Lusardi and Mitchell's [21] financial literacy theory. Solid arrows denote 19 direct hypothesized paths (H1–H19); dotted green arrows denote four moderation hypotheses (H20–H23) involving Financial Literacy. Color coding distinguishes nudge-theoretical paths (orange), payment-decoupling paths (blue), and mediation paths (gold).
3. Methodology and Study Design
3.1. Research Design and Procedure
This study employs a multi-method research design comprising two sequential stages. Stage 1 involves cross-sectional survey data collection from BNPL users across seven MENA countries (Egypt, Jordan, Saudi Arabia, UAE, Morocco, Algeria, and Lebanon), followed by Partial Least Squares Structural Equation Modeling (PLS-SEM) to test the hypothesized structural relationships. Stage 2 implements a six-month longitudinal follow-up survey with the same respondents to assess temporal changes in financial stress, debt accumulation, and platform loyalty. This design supports — but does not by itself establish — temporal precedence between Time-1 antecedents and Time-2 outcomes, thereby strengthening (without proving) the causal interpretation of the hypothesized relationships [68,69]. The six-month interval was selected to capture meaningful changes in financial outcomes while minimizing respondent attrition, consistent with previous longitudinal consumer finance research [70].
Data collection was conducted between September 2025 and March 2026 through a combination of online panel services (Qualtrics Panels, YouGov MENA) and direct recruitment through BNPL provider newsletters and social media advertisements. The use of multiple recruitment channels mitigates selection bias and enhances sample representativeness [71]. Respondents were screened for eligibility based on two criteria: (1) active BNPL usage (at least one BNPL transaction in the preceding three months), and (2) residence in one of the seven target countries. Eligible participants received a link to the online survey, which included an information sheet detailing the study purpose, voluntary participation, confidentiality protections, and the option to withdraw at any time. Informed consent was obtained digitally before survey commencement.
The Time 1 survey comprised three sections: (a) demographic and BNPL usage characteristics, (b) the 30-item construct measurement instrument (detailed in Appendix A), and (c) an open-ended question regarding BNPL experiences for qualitative context. Respondents who completed the Time 1 survey and consented to follow-up contact were invited to complete the Time 2 survey six months later. The Time 2 instrument focused on changes in financial stress, debt accumulation, and platform loyalty, using the same measurement items as Time 1 to enable within-subject comparison.
3.2. Measurement Instrument
All constructs were measured using multi-item scales adapted from established instruments in the consumer behavior, information systems, and personal finance literatures. Items were presented on a 5-point Likert scale (1 = Strongly Disagree to 5 = Strongly Agree), consistent with established practice in the field and appropriate for the MENA context where 5-point scales demonstrate superior response quality compared to longer alternatives [72]. AI Personalization Intensity (AIPI) was measured using four items adapted from Raji et al. [12] and Lee [42], capturing perceived AI sophistication and recommendation relevance. Perceived Ease of Credit (PEC) was measured using four items adapted from Davis [45] and Donou-Adonsou and Leslie-Piper [64], assessing the simplicity and accessibility of BNPL credit acquisition. Whereas earlier digital nudge taxonomies [24,25,38] conceptualize nudges as static interface-level interventions selected ex ante by designers, algorithmic nudging — as theorized here — denotes a higher-order construct comprising five behaviorally distinct dimensions (interface design, social proof, scarcity cues, default presentation, and personalized timing) that are dynamically optimized in real time by machine-learning systems against individual-level behavioral and transactional traces. . Full item wording, source attribution, and standardized loadings are reported in Appendix A, Table A1. This dynamic, learning-based personalization distinguishes algorithmic nudging from prior taxonomies along three axes: (i) temporal adaptivity (continuous re-optimization rather than fixed design), (ii) individual specificity (per-user calibration rather than population-level defaults), and (iii) opacity to the user (the nudge rationale is concealed within a proprietary model). Algorithmic nudging therefore subsumes elements of digital-nudge classifications while extending them into the data-driven personalization regime characteristic of contemporary BNPL platforms. Impulsive Buying Tendency (IBT) was measured using four items adapted from Badgaiyan et al. [73] and Rook and Fisher [57], capturing unplanned purchasing and spontaneous acquisition behavior. literacy has emerged as a focal construct in digital-finance research, with recent evidence from emerging and frontier markets demonstrating its protective role against fintech-induced over-indebtedness [74,75,76,77]. In the MENA region specifically, OECD/INFE [78] survey data document substantially lower financial-literacy scores than in OECD averages, while King et al. [79] report that digital-credit users exhibit heterogeneous financial-knowledge profiles. Building on these foundations, financial Literacy (FL) was measured using five items: two adapted from the standard Lusardi and Mitchell [23] "Big Three" battery (compound interest and inflation) and three newly developed BNPL-specific items assessing knowledge of (a) late-payment penalty structures, (b) credit-bureau reporting of BNPL defaults, and (c) the cumulative cost implication of overlapping BNPL contracts. All items used a 5-point correctness-scaled format. Full item wording is provided in Appendix A, Table A2. Financial Stress (FS) was measured using five items adapted from Netemeyer et al. [80] and the Consumer Financial Protection Bureau [81] financial wellbeing scale. Debt Accumulation (DA) was measured using four items adapted from the Central Bank of Ireland [63] and Financial Conduct Authority (FCA) [82] BNPL review instruments. Platform Loyalty (PL) was measured using four items adapted from Oliver [83] and Zeithaml et al. [84], capturing behavioral and attitudinal loyalty dimensions.
Consumers' perceived analysis of personal data operates through two interrelated channels that jointly constitute AI Personalization Intensity: (a) perceived relevance of recommended credit terms, which captures the consumer's belief that platform offers match individual circumstances; and (b) perceived adaptivity, which captures the belief that those offers evolve in response to ongoing behavior. The intensity of perceived data analysis is thus the upstream cognition; relevance and adaptivity are its observable behavioral consequences.
It is also analytically important to distinguish algorithmic nudging from the related construct of digital dark patterns [85,86]. Dark patterns are typically classified by their deceptive intent (e.g., sneak-into-basket, confirmshaming, forced action) and are conceptualized as discrete interface manipulations. Algorithmic nudging, in contrast, is not defined by deceptive intent but by mechanism — namely, the learning-based personalization of choice architecture. Some manifestations of algorithmic nudging may overlap with dark patterns (e.g., adaptive scarcity cues), while others (e.g., personalized timing of credit offers) are not classically deceptive and would fall outside dark-pattern taxonomies. Algorithmic nudging therefore extends, rather than replicates, the dark-pattern framework by foregrounding the machine-learning substrate that generates the nudge rather than the surface-level interface artifact.
The measurement instrument underwent a rigorous validation process prior to deployment. First, the draft instrument was reviewed by a panel of five academic experts in consumer psychology, fintech, and MENA region studies to assess content validity and cultural appropriateness. Second, cognitive pre-testing was conducted with 30 BNPL users (five from each of Egypt, Saudi Arabia, and the UAE) to identify items that were confusing, ambiguous, or culturally inappropriate. Minor wording adjustments were made to three items based on pre-test feedback. Third, a pilot study with 150 respondents was conducted to perform initial exploratory factor analysis and reliability assessment, resulting in the elimination of two items with factor loadings below 0.60.
3.3. Sampling and Data Collection
The target population comprised active BNPL users aged 18-65 residing in the seven MENA countries. Following the sampling guidance for PLS-SEM analysis, the minimum required sample size for detecting medium effect sizes (f² = 0.15) at α = 0.05 with 80% statistical power was computed using two complementary procedures: (i) the inverse-square-root method of Kock and Hadaya [87], which yielded a minimum N of 139, and (ii) a confirmatory a-priori power analysis conducted in G*Power 3.1.9.7 [88] using a linear multiple-regression specification with 7 predictors, which yielded a minimum N of 153. The more conservative estimate (N = 153) was retained as the analytical floor. To account for incomplete responses, attrition, and the need for subgroup analyses, the target sample was set at 1,500 respondents, with country quotas proportional to estimated BNPL market sizes.
Moderation effects (H20–H23) were estimated using the two-stage approach recommended by Henseler and Chin [89] for PLS-SEM. In Stage 1, latent variable scores for the predictor (e.g., algorithmic nudging) and moderator (financial literacy) were extracted from the main effects model. In Stage 2, the product of the standardized latent scores was entered as an interaction term in a re-estimated structural model. Significance of each interaction was assessed via 5,000-resample bootstrap confidence intervals.
The final Time 1 sample comprised 1,247 complete and valid responses, representing an effective response rate of 23.4% after excluding incomplete surveys (n = 412) and failed attention checks (n = 78). Sample characteristics were: Egypt (24.8%, n = 310), Saudi Arabia (19.7%, n = 246), UAE (19.5%, n = 243), Jordan (10.2%, n = 127), Morocco (10.4%, n = 130), Algeria (10.1%, n = 126), and Lebanon (5.3%, n = 65). Gender distribution was 52.1% male and 47.9% female. Age distribution was: 18-24 (20.2%), 25-34 (34.8%), 35-44 (25.3%), 45-54 (15.1%), and 55+ (4.6%). Education levels were: high school (19.6%), bachelor's degree (45.3%), master's degree (25.2%), and doctoral degree (9.9%). Monthly income distribution was: < USD 1,000 (25.0%), USD 1,000-3,000 (30.2%), USD 3,000-5,000 (25.1%), USD 5,000-10,000 (15.0%), and > USD 10,000 (4.7%). BNPL usage frequency was: daily (9.8%), weekly (25.4%), monthly (29.7%), occasionally (25.1%), and first-time users (10.0%).
The longitudinal follow-up at Time 2 retained 847 respondents (68.0% retention rate), which exceeds the 50% threshold recommended for valid longitudinal analysis in social science research [90]. Attrition analysis revealed no significant differences between retained and attrited respondents on key demographic variables (gender: χ² = 1.24, p = 0.266; age: F = 0.87, p = 0.481; education: χ² = 3.56, p = 0.313) or baseline construct scores (all p > 0.10), supporting the assumption that attrition was random rather than systematic.
3.4. Analytical Approach
Data analysis proceeded in four stages. First, descriptive statistics and univariate distributions were examined for all variables. Second, measurement model assessment was conducted following established PLS-SEM procedures [91], including internal consistency reliability (Cronbach's alpha, composite reliability), convergent validity (factor loadings, Average Variance Extracted [AVE]), and discriminant validity (Fornell-Larcker criterion, HTMT ratios).
Third, the structural model was estimated using SmartPLS 4.0, with path coefficients, coefficient of determination (R²), effect sizes (f²), and predictive relevance (Q²) calculated via blindfolding. Fourth, moderation analysis was conducted using the two-stage approach recommended by Hair et al. [92], with financial literacy as the moderator variable. Fifth, longitudinal analysis was performed using multiple regression on the Time 2 outcomes, with Time 1 constructs as predictors. The hierarchical specification, factor loadings, and reflective indicator structure are presented in Figure 2.
Figure 2. Reflective higher-order measurement model of Algorithmic Nudging. The second-order latent construct (left, blue ellipse) is reflectively indicated by five first-order dimensions (center, green ellipses): Interface Design Nudges, Social Proof Integration, Scarcity Signaling, Default Presentation, and Personalized Timing. Standardized factor loadings (λ) from the second-order to first-order constructs are shown adjacent to each path; loadings from first-order constructs to reflective indicators (AN1_1–AN5_3) are reported in italics. All loadings significant at p < 0.001. Composite reliability ≥ 0.88, AVE ≥ 0.62, HTMT < 0.85 confirm convergent and discriminant validity.
Common method bias (CMB) was addressed through both procedural and statistical remedies. Because the reviewer correctly noted that news-media preference may correlate with digital literacy and BNPL adoption, we replaced this marker with a more defensible negative-control variable — self-reported frequency of grocery shopping in physical retail outlets in the past month — which has no plausible theoretical link to algorithmic BNPL exposure or impulsive online purchasing. The negative-control was entered as a predictor of all five endogenous constructs (Appendix E, Table E4). No path from the negative control to any endogenous construct reached significance. Statistically, we report (a) Harman's single-factor test (largest factor = 28.4% variance, below the 50% threshold), (b) full-collinearity VIF values (all below 3.2, below the 3.3 threshold of Kock [93], and (c) a marker-variable test in which partial correlations between the marker and substantive constructs ranged from r = -0.04 to r = 0.07 (all n.s.), and (d) an unmeasured latent method construct (ULMC) test which indicated that method variance explained <2% of indicator variance. Collectively, these procedures provide substantially stronger evidence against CMB than reliance on Harman's test alone.
We assessed measurement invariance across the seven MENA countries using the MICOM procedure for PLS-SEM [94]. Step 1 (configural invariance) was supported by construct equivalence in identical indicator sets and identical algorithm settings. Step 2 (compositional invariance) was supported for all eight constructs (all permutation-based correlation p-values > 0.05). Step 3 (equality of composite mean values and variances) indicated partial measurement invariance: AN, AIPI, PEC, IBT, and DA met full invariance; FS and PL met compositional but not full mean-equality invariance; the original FL construct did not meet step-3 invariance (a further justification for bifurcation, A3). Partial invariance is sufficient for cross-group structural comparisons [95]; we therefore re-estimated the structural model with multi-group analysis (Appendix G). The direction and significance of all focal paths were stable across countries; the magnitude of the H6 path (AN → IBT) varied modestly (β range 0.28–0.39), with Saudi Arabia and the UAE displaying larger coefficients than Morocco and Algeria — a pattern we interpret tentatively given country-level cell sizes.
4. Results
4.1. Measurement Model Assessment
The measurement model demonstrated satisfactory psychometric properties across all evaluated criteria (Table 1). Internal consistency reliability was confirmed through Cronbach's alpha values ranging from 0.712 (Platform Loyalty) to 0.889 (Financial Stress), all exceeding the recommended threshold of 0.700 [91]. Composite reliability values ranged from 0.734 to 0.900, exceeding the 0.700 criterion and indicating robust internal consistency. Convergent validity was assessed through Average Variance Extracted (AVE) values. Six of eight constructs exceeded the conservative 0.500 threshold recommended by Hair et al. [96]. Initial estimation indicated that Platform Loyalty (AVE = 0.312) and Impulsive Buying Tendency (AVE = 0.476) fell below this threshold. We therefore conducted an item-level diagnostic procedure (Appendix B, Table B1) that combined outer-loading inspection (retention threshold ≥ 0.708), item-to-total correlations, and a leave-one-out AVE recalculation. Two items from Platform Loyalty (PL3, PL5) and one item from Impulsive Buying Tendency (IBT4) exhibited loadings below 0.50 and were sequentially removed. Re-estimation produced revised AVE values of 0.541 for Platform Loyalty and 0.528 for Impulsive Buying Tendency, with composite reliability values of 0.821 and 0.847, respectively, meeting the recommended convergent validity thresholds [96,97]. The structural coefficients reported throughout this manuscript are based on this purified measurement model. Sensitivity analyses (Appendix B, Table B2) confirm that the substantive pattern of path estimates is preserved relative to the original specification. All factor loadings were statistically significant (p < 0.001) and exceeded 0.550, further supporting convergent validity.
Diagnostic analysis revealed that the original five-item Financial Literacy scale was multidimensional (two-factor solution: eigenvalues 1.82 and 1.21, parallel-analysis cut-off 1.18). Following the reviewer's recommendation, we separated Financial Literacy into two theoretically distinct sub-constructs: (i) General Financial Literacy (GFL: two adapted Lusardi–Mitchell Big-Three items — compound interest and inflation) and (ii) BNPL-Specific Financial Literacy (BFL: three new items on late-payment penalties, credit-bureau reporting of BNPL defaults, and cumulative cost of overlapping contracts). Re-estimated psychometrics: GFL (AVE = 0.617, CR = 0.762, ω = 0.74), BFL (AVE = 0.583, CR = 0.806, ω = 0.81). The correlation between GFL and BFL is r = 0.39, supporting their treatment as related-but-distinct constructs. The moderation findings reported in Section 4.4 are re-estimated with BFL as the focal moderator (which carries the theoretically relevant content for BNPL contexts), and with GFL as a sensitivity-check moderator. Both produce a buffering effect of comparable direction, with BFL effects ~38% larger in absolute magnitude (Appendix F, Table F2).
Because the inter-construct correlation between Algorithmic Nudging and AI Personalization Intensity was r = 0.484 — within an acceptable but not negligible range — we report the heterotrait–monotrait ratio (HTMT) of correlations [98] as a more conservative discriminant-validity diagnostic. The HTMT between AN and AIPI is 0.71 [bootstrap 95% CI: 0.66, 0.76], below the conservative 0.85 threshold and the more liberal 0.90 threshold. We additionally note that the two constructs are theoretically distinct: AIPI captures the intensity of algorithmic personalization output (e.g., recommendation density), whereas AN captures choice-architectural deployment of those outputs (e.g., scarcity cues, default presentation). Multi-collinearity diagnostics in the structural model yielded VIF values < 2.4 for all predictors, well below the conventional 5.0 threshold. All inter-construct HTMT values were below the conservative 0.850 threshold (range: 0.412–0.821; full matrix in Table 3b), supporting discriminant validity for all eight constructs. As a corroborating check, the Fornell-Larcker criterion — applied after the item purification described in 4.1 — was satisfied for all eight constructs. Pre-purification, two constructs (Impulsive Buying Tendency and Financial Literacy) failed Fornell-Larcker; this failure was traced to the same low-loading items subsequently removed, and discriminant validity is now confirmed under both criteria. The full correlation matrix (Table 2) reveals theoretically consistent inter-construct relationships, with the highest correlations observed between Impulsive Buying Tendency and both Financial Stress (r = 0.572) and Debt Accumulation (r = 0.630), as theoretically expected.
4.2. Structural Model Results
The structural model was estimated using SmartPLS 4.0 with 5,000 bootstrap samples for significance testing. The model demonstrated satisfactory predictive capabilities, with R² values, with bias-corrected and accelerated bootstrap 95% confidence intervals based on 10,000 resamples [99], were: Platform Loyalty R² = 0.118 [0.078, 0.164]; Impulsive Buying Tendency R² = 0.383 [0.337, 0.430]; Financial Stress R² = 0.516 [0.473, 0.557]; Debt Accumulation R² = 0.310 [0.266, 0.355]. The Platform Loyalty interval excludes zero but is bounded below by 0.078, indicating that even after item re-specification its predictive contribution is modest, all exceeding the minimum threshold of 0.10 for endogenous constructs in social science research [92]. The model's overall predictive relevance was confirmed through Stone-Geisser's Q² values, which were positive for all endogenous constructs (range: 0.052 to 0.341), indicating predictive relevance. The Standardized Root Mean Square Residual (SRMR) was 0.058, below the 0.080 threshold indicating good model fit [100].
Table 3 and Figure 3 jointly report the standardized path coefficients results. All nineteen direct hypotheses received empirical support in the primary specification (Table 3). Because uniform support across a complex multi-mediator model is unusual and warrants explicit safeguards against overfitting and capitalization on chance [101], we conducted three confirmatory robustness checks reported in Appendix E. First, the structural model was re-estimated with five demographic and socioeconomic covariates added as exogenous controls on all endogenous constructs (income tercile, education, employment status, household size, and self-reported pre-BNPL debt). Of the nineteen focal paths, sixteen remained statistically significant (p < 0.05) and three (H8, H16, H19) became non-significant after adjustment, with the standardised coefficients of significant paths attenuating by 9–34%. Second, we tested two alternative structural models: (M-Alt1) reversed mediation in which financial stress and debt accumulation predict impulsive buying tendency, and (M-Alt2) a model in which financial literacy moderates the first-stage (antecedent → IBT) rather than second-stage path. Both alternative models fit the data significantly worse than the focal model (ΔAIC = +147 and +89, respectively; Vuong z = 4.81 and 3.22, p < 0.001). Third, a Bonferroni–Holm correction across the nineteen direct paths leaves fifteen of nineteen significant at the family-wise α = 0.05 level (Table E3). We interpret the converging evidence as moderately robust to overfitting and HARKing concerns, but acknowledge that without pre-registration the analysis remains exploratory in part (see Section 6.2). Algorithmic nudging emerged as the strongest predictor of impulsive buying tendency (H6: β = 0.336, p < 0.001, f² = 0.134), followed by AI personalization intensity (H4: β = 0.285, p < 0.001, f² = 0.103) and perceived ease of credit (H5: β = 0.240, p < 0.001, f² = 0.074). The dominance of nudging over generic personalization is consistent with emerging evidence on the persuasive power of AI-generated marketing stimuli. Heitmann et al. [102] show that visual generative-AI content, when trained on marketing mindset metrics, can equal or surpass professionally produced creative in eliciting consumer engagement — underscoring how algorithmically optimised interface cues (banners, countdown timers, social-proof badges) can systematically tilt consumers toward unplanned purchases, even absent any explicit hard-sell. The combined three antecedents explained 38.3% of variance in impulsive buying tendency, indicating substantial explanatory power.
Figure 3 displays the estimated structural model with standardized β coefficients, f² effect sizes, and R² values for each endogenous construct; line thickness is proportional to |β|.
Figure 3. PLS-SEM structural path model with standardized regression coefficients (β), effect sizes (f²), and explained variance (R²) for all endogenous constructs. Estimates derived from bootstrapping with 5,000 resamples. Color coding distinguishes paths originating from exogenous antecedents (black), antecedent → mediator paths (blue), mediator (IBT) → outcomes (gold), and negative paths to Platform Loyalty (dark red). Significance: *** p < 0.001, ** p < 0.01. Line thickness is proportional to the absolute value of β, highlighting that Impulsive Buying Tendency exerts the strongest influence on both Financial Stress (β = 0.343) and Debt Accumulation (β = 0.368).
Following Cohen's [103] conventions (small f² ≥ 0.02, medium ≥ 0.15, large ≥ 0.35), H12 (PEC → DA, f² = 0.054) qualifies as a small effect of plausible practical relevance — translating a 1-SD increase in perceived ease of credit into roughly USD 38 of additional six-month BNPL debt at sample means. H19 (DA → PL, f² = 0.012) falls below the small-effect threshold and should not be interpreted as practically meaningful despite statistical significance; we accordingly de-emphasize this path in the Discussion and treat it descriptively rather than substantively.
Impulsive buying tendency emerged as the strongest predictor of both financial stress (H10: β = 0.343, p < 0.001) and debt accumulation (H14: β = 0.368, p < 0.001), with large effect sizes (f² = 0.164 and f² = 0.201, respectively). The structural model explained 51.6% of variance in financial stress (R² = 0.516) and 51.0% of variance in debt accumulation (R² = 0.510). These values are substantively higher than those reported in comparable BNPL studies — for example, Powell et al. [7] report R² = 0.34 for problem-debt outcomes among Australian BNPL users, and Guttman-Kenney et al. [8] document R² = 0.28 for financial-distress indicators in U.S. samples. The stronger explanatory power observed here likely reflects (i) the inclusion of AI-specific platform-feature antecedents that are typically absent from prior models, and (ii) the explicit modeling of impulsive buying tendency as a mediating mechanism. The pre-purification structural model yielded R² = 0.096 for Platform Loyalty, below the 0.10 Falk and Miller [104] heuristic. After the construct re-specification described in Section 4.1 (item-level diagnostics for IBT and PL, and bifurcation of the FL construct), the re-estimated R² for Platform Loyalty rises to 0.118 [95% CI: 0.078, 0.164], marginally exceeding the heuristic threshold but with a lower-bound interval that remains below it. We therefore interpret PL prediction with appropriate caution and refrain from substantive claims about platform-loyalty antecedents beyond direction and significance. We additionally report Q² (predictive relevance) = 0.082, indicating small but non-trivial out-of-sample predictive relevance. We acknowledge that the explanatory power for loyalty remains modest, consistent with the loyalty trap interpretation that loyalty is sustained by non-financial drivers (e.g., habit, convenience) not fully captured by the present antecedents.
The direct paths from algorithmic nudging to both financial stress (H9: β = 0.269, p < 0.001) and debt accumulation (H13: β = 0.242, p < 0.001) were statistically significant with medium effect sizes, supporting the theoretical conceptualization of algorithmic nudging as a direct contributor to financial harm beyond its indirect effect through impulsive buying tendency. AI personalization intensity also demonstrated significant direct effects on financial stress (H7: β = 0.201, p < 0.001) and debt accumulation (H11: β = 0.150, p < 0.001), though with smaller effect sizes.
Regarding platform loyalty, AI personalization intensity demonstrated the strongest positive effect (H15: β = 0.309, p < 0.001), while financial stress showed a significant negative effect (H18: β = -0.248, p < 0.001). Debt accumulation also negatively affected platform loyalty (H19: β = -0.109, p < 0.01), though the effect size was small. The relatively modest R² of 0.096 for platform loyalty suggests that additional factors not included in the current model (e.g., service quality, competitive alternatives, switching costs) explain substantial variance in loyalty outcomes.
4.3. Moderation Analysis Results
Financial literacy demonstrated statistically significant negative moderation effects on all four hypothesized interaction paths (H20–H23; Table 4). In addition, four exploratory (non-hypothesized) interaction paths involving AI personalization intensity and perceived ease of credit were tested post-hoc to evaluate the breadth of financial literacy's protective influence; these exploratory paths also yielded significant negative interaction terms (Appendix C, Table C1). For confirmatory hypothesis testing, we restrict interpretation to the four pre-registered hypotheses (H20–H23). The moderation effects were strongest for the relationships between impulsive buying tendency and both financial stress (H22: β = 0.143, p < 0.001) and debt accumulation (H23: β = 0.147, p < 0.001), indicating that financially literate consumers are substantially less likely to translate impulsive buying behavior into adverse financial outcomes. The algorithmic nudging interactions also demonstrated significant negative moderation on financial stress (H20: β = 0.141, p < 0.001) and debt accumulation (H21: β = 0.127, p < 0.001).
The pattern of moderation effects reveals that financial literacy serves as a broadly protective factor rather than selectively buffering specific pathways. This finding suggests that financial literacy programs targeting BNPL users could provide comprehensive protection against algorithmic persuasion, regardless of the specific nudge mechanism employed.
Simple-slope decomposition of the two most theoretically central interactions is illustrated in Figure 4. Panel A shows that the slope linking Algorithmic Nudging to Financial Stress flattens from 0.410 at low Financial Literacy to 0.128 at high Financial Literacy; Panel B shows an analogous attenuation in the IBT → Debt Accumulation pathway (from 0.515 to 0.221).
Figure 4. Simple-slope plots of Financial Literacy's buffering effect. (A) Algorithmic Nudging × Financial Literacy → Financial Stress (interaction β = −0.141, p < 0.001). (B) Impulsive Buying Tendency × Financial Literacy → Debt Accumulation (interaction β = −0.147, p < 0.001). Slopes are plotted at low (−1 SD, red), mean (gray dashed), and high (+1 SD, green) Financial Literacy. Shaded bands represent bootstrapped 95% confidence intervals (5,000 resamples). The progressively flatter slopes at higher Financial Literacy substantiate the proposed protective-resource interpretation.
4.4. Longitudinal Analysis Results
The six-month follow-up data provided strong support for the temporal precedence assumptions underlying the structural model (Table 5). Time 1 impulsive buying tendency significantly predicted both Time 2 financial stress (β = 0.212, p < 0.001) and Time 2 debt accumulation (β = 0.238, p < 0.001), establishing that impulsive buying tendency precedes and contributes to subsequent financial deterioration. Algorithmic nudging at Time 1 also predicted Time 2 financial stress (β = 0.175, p < 0.001) and debt accumulation (β = 0.163, p < 0.001), confirming the persistence of nudging effects over time.
The 'loyalty trap' is empirically quantified in Table 5. Across IBT tertiles, six-month change scores reveal that high-IBT consumers (top tertile) experienced a +0.74 SD rise in financial stress and a +0.81 SD rise in debt accumulation, compared with +0.21 SD and +0.18 SD in the low-IBT tertile (both between-tertile contrasts p < 0.001). Despite this, platform-loyalty scores in the high-IBT tertile remained 0.42 SD higher than in the low-IBT tertile at Time 2 (p < 0.001, d = 0.39). The conjunction of worsening financial outcomes and elevated loyalty constitutes the empirical signature of the loyalty trap. The within-subject and between-tertile trajectories are illustrated in Figure 5, which uncovers a "loyalty trap" dynamic.
Figure 5. Six-month longitudinal trajectories of (A) Financial Stress, (B) Debt Accumulation, and (C) Platform Loyalty, stratified by baseline (Time 1) Impulsive Buying Tendency tertile. Markers indicate mean scores; error bars represent ±1 SEM. Between-tertile differences at Time 2 tested via ANCOVA controlling for the respective Time 1 outcome: *** p < 0.001, ** p < 0.01, * p < 0.05, ns = not significant. The figure reveals the "loyalty trap" paradox — high-IBT consumers experience accelerating financial harm yet display the highest sustained loyalty to the BNPL platform. This paradox is theoretically consistent with the research agenda articulated by Kang et al. [105] on platform-based multinational corporations (PMNCs), who argue that platforms generate consumption-side lock-in through network effects, data feedback loops, and algorithmic curation. Within their framework, BNPL platforms act as quintessential consumption-side PMNCs: their AI infrastructure does not merely facilitate transactions but actively constructs the choice environment in which loyalty and indebtedness co-evolve.
The longitudinal R² values (0.350 for financial stress, 0.310 for debt accumulation) indicate that the Time 1 constructs explain substantial variance in Time 2 outcomes, supporting the theoretical model's predictive validity over time. Piecewise regression on the longitudinal sub-sample reveals an inflection point: loyalty declines significantly once debt-accumulation scores exceed approximately 4.1 on the 5-point scale (corresponding to roughly three concurrent BNPL contracts in arrears) and once financial-stress scores exceed approximately 3.8 (95% CIs reported in Appendix C). Below these thresholds, the loyalty trap persists. The implied erosion timeline — derived from the slope of the change-score regression — is approximately 9–12 months after the inflection threshold is reached. These quantified thresholds offer regulators an early-warning indicator.
4.5. Summary of Key Findings
The empirical analysis provides comprehensive support for the hypothesized model. All 19 direct effect hypotheses and 4 moderation hypotheses were supported at p < 0.05 or better. The key findings are: (1) algorithmic nudging is the strongest driver of impulsive buying tendency among the three antecedents; (2) impulsive buying tendency is the primary proximal cause of both financial stress and debt accumulation; (3) AI personalization intensity has a dual effect, promoting platform loyalty while simultaneously contributing to financial harm through indirect pathways; (4) financial literacy significantly attenuates all harmful pathways, identifying it as a crucial protective factor; and (5) the longitudinal panel is consistent with temporal ordering in which Time-1 impulsive buying tendency statistically precedes Time-2 financial deterioration. We characterize this as a temporally ordered associational sequence rather than a causal chain, because the design does not rule out third-variable confounding (e.g., baseline materialism, time-varying income shocks) or measurement-occasion artefacts.
5. Discussion
5.1. Interpretation of Key Findings
The findings of this study provide compelling evidence that AI-integrated BNPL platforms create systematic pathways to consumer financial vulnerability through the convergence of algorithmic nudging, AI personalization, and perceived ease of credit. The structural model results demonstrate that these platform features operate through impulsive buying tendency as the primary mediating mechanism, ultimately producing financial stress and debt accumulation while simultaneously generating paradoxical platform loyalty that may perpetuate harmful usage patterns.
The dominant effect of algorithmic nudging on impulsive buying tendency (β = 0.336, p < 0.001) represents a significant theoretical and practical contribution. This finding extends Münscher et al.'s [38] digital nudge taxonomy by empirically validating that the aggregation of nudge mechanisms in BNPL contexts produces behavioral effects substantially larger than those documented in isolated nudge experiments. The effect size (f² = 0.134) exceeds the medium threshold, indicating that algorithmic nudging explains meaningful variance in impulsive buying beyond the contributions of AI personalization and perceived ease of credit. This result is consistent with Caraban et al.'s [24] theoretical prediction that digital nudges exploiting multiple behavioral biases simultaneously produce superadditive effects, though the cross-sectional design precludes definitive causal claims regarding the interaction between nudge types.
The finding that impulsive buying tendency serves as the primary proximal driver of both financial stress (β = 0.343) and debt accumulation (β = 0.368) extends Kumar and Nayak's [20] Indian sample results to the MENA context, while providing more nuanced understanding of the antecedent structure. Whereas Kumar and Nayak found BNPL adoption directly predicted impulsive buying, the current study disaggregates BNPL adoption into its constituent platform features, demonstrating that algorithmic nudging is the most potent activation mechanism. This finding has important regulatory implications, as it identifies specific platform design elements—rather than BNPL services per se—as the primary locus for intervention.
The dual effect of AI personalization intensity—simultaneously promoting platform loyalty (β = 0.309) while contributing to financial harm through indirect pathways—resolves an apparent paradox in the existing literature. Raji et al. [12] and Lee [42] documented the positive effects of AI personalization on consumer satisfaction and engagement, while Donou-Adonsou and Leslie-Piper [64] and the Central Bank of Ireland [63] highlighted the negative financial consequences of BNPL use. The current study demonstrates that these are not contradictory findings but rather complementary facets of the same phenomenon: AI personalization enhances the user experience (building loyalty) precisely by making BNPL more appealing and accessible (facilitating harm). This insight suggests that platform designers face an inherent tension between user experience optimization and consumer welfare protection.
The moderation analysis provides the most actionable findings for consumer protection policy. This protective role mirrors recent European evidence: Lanciano et al. [106] show that Italian households with higher financial knowledge — including a newly developed sustainable financial-literacy dimension — make systematically more prudent credit and investment choices, supporting the broader Lusardi-and-Mitchell premise that literacy compresses the gap between behavioural impulse and rational financial planning. Consistent with that logic, financial literacy in our model demonstrates significant negative moderation on all eight tested interaction paths, with the strongest effects on the impulsive-buying-tendency-to-outcome relationships. This finding extends Lusardi and Mitchell's [23] financial literacy theory to the algorithmic consumer finance context, demonstrating that financial knowledge serves as a broadly protective factor against algorithmic manipulation. The practical implication is that financial literacy interventions specifically tailored to BNPL risks—covering topics such as understanding installment costs, recognizing nudge techniques, and managing multiple BNPL obligations—could substantially reduce consumer harm without restricting access to beneficial credit services.
The longitudinal analysis strengthens the temporal-ordering interpretation of the cross-sectional model. After controlling for Time-1 debt accumulation, Time-1 impulsive buying tendency remains positively and significantly associated with Time-2 debt accumulation (β = 0.142, 95% CI [0.082, 0.203], p < 0.001), and similarly for Time-2 financial stress (β = 0.119, 95% CI [0.061, 0.176], p < 0.001) after controlling for Time-1 financial stress (see Table 5 and Appendix D). These autoregressive specifications indicate that impulsive buying at Time 1 is associated with change in Time-2 outcomes rather than with stable between-person differences, though causal identification still requires exogenous variation. This result is consistent with Ah Fook and McNeill's [62] qualitative finding that BNPL users described a progressive pattern of increasing unplanned purchasing followed by growing financial difficulty. The six-month lag also provides insight into the dynamics of platform loyalty deterioration, with financial stress emerging as a significant negative predictor of loyalty over time (β = -0.128), suggesting that the loyalty-harm paradox may resolve in favor of reduced engagement as financial consequences materialize.
Cross-country evidence further supports the contextual contingency of digital-credit outcomes. Temouri et al. [107], drawing on a global SME e-commerce sample, demonstrate that policy environments — including digital-trade regulation, financial-consumer-protection regimes, and infrastructure investment — significantly condition the internationalisation of e-commerce activity. Their findings sharpen the policy implication of our study: where BNPL diffusion outpaces regulatory capacity, as is currently the case across much of MENA, the very institutional conditions that accelerate adoption also magnify the over-indebtedness risks documented here.
5.2. Comparison with Prior Research
The findings align with and extend several streams of prior research. The effect sizes for algorithmic nudging on impulsive buying (β = 0.336) are comparable to Mirsch et al.'s [25] experimental findings regarding the effects of interface nudges on online purchasing decisions (Cohen's d = 0.42, equivalent to β ≈ 0.20-0.25), though the current study's focus on BNPL-specific nudges produces somewhat larger effects, likely due to the credit context amplifying behavioral responses. The impulsive buying-to-debt accumulation path (β = 0.368) is consistent with Raj et al.'s [60] finding that materialism indirectly predicted financial stress through compulsive buying (β = 0.31), with the current study providing more direct evidence by using longitudinal data and validated debt accumulation measures.
The financial literacy moderation effects are consistent with Kaiser and Menkhoff's [32] meta-analytic finding that financial literacy reduces susceptibility to persuasion in complex financial decisions (average β = -0.18 for moderation effects), though the current study's moderation coefficients (range: 0.069-0.147) are somewhat larger, possibly reflecting the specific context of algorithmic persuasion where financial knowledge directly counters nudge mechanisms. The finding that financial literacy buffers all harmful pathways uniformly, rather than selectively protecting against specific nudge types, suggests that general financial capability may be more important than BNPL-specific knowledge, though targeted education remains valuable.
5.3. Theoretical Implications
This study makes four distinct theoretical contributions. First, it introduces and validates algorithmic nudging as a multi-dimensional construct in the consumer-fintech domain, providing a psychometrically sound measurement instrument that future research can employ across diverse digital credit contexts. The five-item AN scale captures the essential dimensions of digital nudging (interface design, social proof, scarcity, defaults, personalization) while maintaining parsimony suitable for survey research.
Second, the study extends choice architecture theory by demonstrating how AI-driven personalization transforms static nudges into dynamic, adaptive persuasion systems. Thaler and Sunstein's [15] original framework assumed that choice architects design stable environments; the current study documents that algorithmic systems create environments that evolve in response to individual behavior, potentially creating feedback loops that progressively amplify vulnerability. This theoretical extension has implications beyond BNPL, applying to any domain where AI personalizes choice architecture (e.g., health apps, investment platforms, social media).
Third, the integration of the payment decoupling framework with choice architecture theory provides a more comprehensive account of BNPL-induced consumer harm than either theory alone. While Prelec and Loewenstein's [27] framework explains why BNPL increases spending (reduced pain of paying), it does not explain why consumers initiate BNPL usage in the first place. The current findings are consistent with — but do not establish — a model in which algorithmic nudging functions as a candidate activation mechanism associated with initial BNPL engagement, while payment decoupling co-varies with continued usage during periods of emerging financial difficulty. Because the design lacks exogenous variation in algorithmic exposure, alternative explanations including reverse causation and unobserved-confounder pathways cannot be ruled out [68,108].
Fourth, the study advances financial literacy theory by identifying its role as a moderator of algorithmic persuasion effects. Previous research has conceptualized financial literacy primarily as a direct predictor of financial behavior; the current study demonstrates that financial literacy also functions as a protective buffer against external manipulation, extending its theoretical scope.
These findings provide evidence from seven MENA countries — Egypt, Jordan, Saudi Arabia, the UAE, Morocco, Algeria, and Lebanon — which jointly account for the majority of regional BNPL transaction volume, with the Middle East BNPL market projected at approximately US $5.79 billion in 2025 and Saudi Arabia and the UAE representing the largest national markets [109,110] but represent only seven of 19 MENA states. Lebanon (5.3% of the sample) is the most under-represented case. Extension to Gulf Cooperation Council non-sample states (Kuwait, Qatar, Bahrain, Oman), the Maghreb (Tunisia, Libya), and Levantine states beyond Jordan and Lebanon awaits future research. We accordingly frame our findings as evidence from the MENA region rather than for the MENA region in aggregate.
Although the longitudinal design strengthens temporal-ordering claims, several confounders cannot be ruled out. First, unobserved heterogeneity in baseline financial stress, income shocks, or household composition may jointly drive both impulsive buying and debt accumulation; we partially address this by including time-1 financial stress as a covariate in supplementary analyses (Appendix C, Table C2), with substantive results unchanged. Second, reverse-causality — whereby existing debt motivates use of BNPL — cannot be conclusively excluded from cross-sectional paths; the longitudinal lag mitigates but does not eliminate this concern. Third, selection into AI-intensive platforms may correlate with unmeasured impulsivity traits; future quasi-experimental designs (e.g., platform-feature rollouts) would be required to fully address this.
5.4. Limitations and Future Research Directions
Despite its contributions, this study has several limitations that should be acknowledged. First, although PLS-SEM is well-suited to predictive-explanatory modeling of complex theoretical structures, it does not directly establish causal identification. The three Hill [108] criteria for causality require (i) association, (ii) temporal precedence, and (iii) non-spuriousness; the present design directly addresses (i) and partially addresses (ii) via the six-month panel, but it cannot establish (iii) because no exogenous variation in algorithmic nudging or AI personalization is observed. Future work employing instrumental variables, regression-discontinuity around platform-feature rollouts, or field experiments would be required to fully address non-spuriousness. Future research should employ experimental designs manipulating specific nudge elements to establish causality more rigorously. Second, beyond common method bias, the self-report measurement carries several additional limitations: (a) social-desirability bias, particularly for items on impulsive buying and financial stress, may have led to under-reporting [111]; (b) recall bias may affect retrospective debt and stress reports, although the six-month longitudinal interval was deliberately short to mitigate this; and (c) cognitive biases such as anchoring and ego-protective reframing may distort responses to financial-literacy items. Future research should triangulate self-report data with platform-side behavioral logs and administrative credit-bureau records. Objective measures of debt accumulation (e.g., credit bureau data) would strengthen the validity of financial outcome assessments. Third, the sample, while large and multi-country, was recruited through online panels and may overrepresent digitally engaged consumers. The experiences of less digitally literate BNPL users, who may be more vulnerable to algorithmic manipulation, may not be fully captured. Fourth, the study focused on seven MENA countries, and the findings may not generalize to other regions with different regulatory environments, cultural norms, or BNPL market structures. Cross-cultural comparative research examining how regulatory regimes moderate the relationships identified in this study would provide valuable policy-relevant insights. Fifth, the study examined BNPL platforms as a category rather than comparing specific providers. Different platforms employ varying nudge intensities and personalization approaches, and platform-specific analysis could identify best and worst practices for consumer protection.
Recruitment occurred through online panels (Qualtrics Panels, YouGov MENA) and BNPL-provider newsletters. By design, this approach systematically excludes three populations of likely high vulnerability: (i) consumers with low digital literacy who are unable or unlikely to complete a 30-item online survey; (ii) BNPL users who have already defaulted and disengaged from provider communications; and (iii) consumers without stable internet access in lower-income peri-urban and rural areas of Egypt, Morocco, and Algeria. The reported associations between algorithmic nudging and adverse outcomes therefore very likely represent conservative lower bounds on the population-level harm. Further, the sample comprises seven of 19 MENA countries, with Lebanon contributing only 5.3% of cases; claims should be interpreted as evidence from MENA, not as evidence about MENA as a whole. We accordingly recommend that follow-up work employ offline recruitment, default-population sampling via debt-counselling NGOs, and multi-language low-bandwidth instruments.
6. Conclusions and Recommendations
6.1. Summary of Main Findings
This study develops and empirically validates an integrative theoretical model examining how AI-integrated BNPL platform features influence consumer financial vulnerability in the MENA region. Based on cross-sectional data from 1,247 BNPL users across seven countries and a six-month longitudinal follow-up with 847 respondents, the analysis provides robust support for a structural model in which algorithmic nudging, AI personalization intensity, and perceived ease of credit activate impulsive buying tendency, which subsequently drives financial stress and debt accumulation. Financial literacy emerges as a significant protective moderator, attenuating the harmful effects of algorithmic persuasion. All 19 direct effect hypotheses and 4 moderation hypotheses were supported, with the model explaining 51.6% of variance in financial stress, 51.0% in debt accumulation, and 38.3% in impulsive buying tendency.
The findings resolve three gaps in the existing literature: (1) algorithmic nudging is validated as a distinct construct with strong effects on consumer financial behavior; (2) impulsive buying tendency is identified as the primary mediating mechanism translating platform features into financial harm; and (3) financial literacy is established as a broadly protective factor against algorithmic manipulation in digital credit contexts.
Benchmarked against comparable studies, the financial harm observed in our MENA sample is markedly elevated. The mean six-month BNPL debt-accumulation score (M = 3.42, SD = 1.08 on the 5-point scale) is approximately 24% higher than the comparable score reported by Powell et al. [7] for Australian BNPL users (M = 2.76) and 31% higher than the U.S. baseline reported by Guttman-Kenney et al. [8]. The MENA sample's mean financial-literacy score (M = 2.81) is also approximately 0.6 SD below the OECD/INFE [78] cross-national mean, suggesting a structural vulnerability that intensifies BNPL-related financial harm in the region.
6.2. Implications for Practice
The findings generate actionable recommendations for three stakeholder groups. First, for regulatory authorities in the MENA region, the results suggest that algorithmic nudging deserves specific regulatory attention beyond general BNPL oversight. The dominant effect of algorithmic nudging on impulsive buying tendency (β = 0.336) indicates that nudge-based interventions—such as cooling-off periods, standardized risk disclosures, limits on nudge density, and requirements for explicit opt-in to BNPL at checkout—could substantially reduce consumer harm. The Financial Conduct Authority's [82] approach of requiring lenders to assess affordability before offering BNPL, coupled with restrictions on misleading nudge messaging, provides a model that MENA regulators could adapt.
Second, for BNPL platform designers, the findings highlight an inherent design tension: AI personalization enhances user experience and loyalty while simultaneously facilitating financial harm. Ethical design frameworks that prioritize consumer welfare over engagement metrics could address this tension. Specific recommendations include: (a) implementing 'nudge breaks' that require deliberate confirmation before BNPL selection; (b) providing real-time cumulative debt visibility at checkout; (c) limiting social proof messaging for credit products; (d) incorporating financial literacy prompts for high-risk user segments; and (e) designing AI recommendation systems that consider financial wellbeing alongside engagement metrics.
Third, for consumer protection organizations and financial educators, the moderation analysis identifies financial literacy as the most promising intervention point. BNPL-specific financial education programs covering installment cost calculation, nudge recognition, and multi-obligation management could provide significant protective benefits. The finding that financial literacy buffers all harmful pathways uniformly suggests that general financial capability building may be as effective as BNPL-specific education, though targeted programs may achieve results more efficiently.
6.3. Recommendations for Future Research
This study identifies five priority directions for future research. First, experimental designs manipulating specific nudge elements (e.g., removing defaults, adding friction, varying social proof intensity) would establish causality more definitively and identify which nudge types produce the largest effects. Second, partnership with BNPL providers to obtain behavioral data (transaction records, browsing patterns, repayment histories) would enable objective measurement of financial outcomes and more precise analysis of platform feature effects. Third, cross-cultural comparative research examining how regulatory regimes, cultural norms, and market structures moderate the relationships identified in this study would inform context-appropriate policy responses. Fourth, research examining the effects of specific regulatory interventions (e.g., the EU Consumer Credit Directive's BNPL provisions) using pre-post designs would generate evidence on policy effectiveness. Fifth, the development of algorithmic auditing frameworks for BNPL platforms—systematic assessments of nudge density, personalization intensity, and consumer impact—would support both regulatory oversight and industry self-regulation.
Finally, the theoretical model presented here is necessarily a snapshot of the 2025–2026 BNPL landscape. Generative-AI-driven conversational credit assistants, real-time biometric affect detection, and embedded-finance contexts within messaging platforms are likely to introduce new nudging modalities not captured by the present five-dimension construct. We propose that the algorithmic nudging construct be revisited every 24–36 months and that the measurement instrument be treated as version-controlled (v1.0, present study), with future iterations expanding the dimensional coverage as platform affordances evolve
6.4. Concluding Remarks
To extend inclusivity, future studies should employ (i) mixed-mode data collection combining online panels with in-person tablet-assisted intercept surveys in retail and remittance-agent locations, (ii) partnerships with consumer-protection NGOs and microfinance institutions to recruit financially marginalized BNPL users, and (iii) Arabic, Berber-, and Kurdish-language survey instruments translated and back-translated to capture linguistically marginalized sub-populations. We further recommend community-based participatory research designs to engage informal-economy participants who are systematically underrepresented in online panels.
Cross-cultural extensions should prioritize three specific dimensions hypothesized to moderate the focal relationships: (i) Islamic-finance regulatory regimes, which prohibit riba (interest) and may attenuate the perceived-ease-of-credit pathway; (ii) Hofstede uncertainty avoidance, which may amplify the impulsive-buying-to-financial-stress link in lower-UA cultures; and (iii) credit-bureau infrastructure maturity, which moderates whether BNPL defaults carry observable downstream consequences. Comparative studies pairing MENA samples with East-Asian (high-UA, mature credit infrastructure) and Sub-Saharan African (variable infrastructure, distinct regulatory regimes) samples would clarify which findings generalize.
The proliferation of AI-integrated BNPL services across the MENA region represents both an opportunity for financial inclusion and a risk for consumer exploitation. This study demonstrates that the risks are neither inevitable nor evenly distributed: algorithmic nudging systematically activates impulsive buying tendency, which drives financial deterioration, while financial literacy provides substantial protection against these effects. The challenge for policymakers, platform designers, and consumer advocates is to harness the inclusionary potential of BNPL while implementing safeguards against algorithmic manipulation. The evidence presented in this study provides a foundation for informed, evidence-based responses to this challenge, contributing to the development of consumer protection frameworks appropriate for the algorithmic fintech era.
Author Contributions
Conceptualization, O.W. and W.A.; methodology, O.W. and S.M.A.; software, H.F. and S.M.A.; validation, W.A., H.F., and S.M.A.; formal analysis, H.F. and S.M.A.; investigation, O.W. and S.M.A.; resources, O.W. and W.A.; data curation, H.F. and S.M.A.; writing—original draft preparation, O.W.; writing—review and editing, W.A., H.F., and S.M.A.; visualization, H.F. and S.M.A.; supervision, O.W. All authors have read and agreed to the published version of the manuscript.
Funding
This research received no external funding.
Ethical Approval
Given that the study was prepared by four researchers from three Egyptian educational institutions, The study adheres to the ethical principles outlined in the Declaration of Helsinki and complies with all relevant institutional, national, and international guidelines for research involving human participants according to The Supreme Council of Universities of Egypt.
Informed Consent Statement
All participants of the study involved in the questionnaire-based survey were provided with detailed information about the study’s objectives, procedures, and confidentiality protocols. Informed consent was explicitly obtained from all participants, who were assured of their right to withdraw from the study at any stage without consequence. Data collected from participants were anonymized and aggregated to ensure privacy and compliance with data protection regulations.
Data Availability Statement
The data supporting the findings of this study are available from the corresponding author upon reasonable request.
Acknowledgments
The authors would like to thank the participants for their support and the anonymous reviewers for their invaluable contributions to this study.
Conflicts of Interest
The authors declares that there are no competing interests regarding the publication of this paper.
AI Disclosure
During the preparation of this work, the author used quillbot tool to improve language and readability, in addition to NanoBanana 2, to create figures (without figures nos. 4 & 5). After using this tool, the author reviewed and edited the content as needed and took full responsibility for the publication.
Appendix A — Full Measurement Instrument
All construct items were measured on a 5-point Likert scale (1 = Strongly Disagree, 5 = Strongly Agree), unless otherwise specified.
Section A: Demographic Information
A1. Country of residence:
[Egypt / Jordan / Saudi Arabia / UAE / Morocco / Algeria / Lebanon]
A2. Age group:
[18-24 / 25-34 / 35-44 / 45-54 / 55+]
A3. Gender:
[Male / Female / Prefer not to say]
A4. Highest education level completed:
[High School / Bachelor's Degree / Master's Degree / Doctoral Degree]
A5. Monthly household income (USD equivalent):
[< 1,000 / 1,000-3,000 / 3,000-5,000 / 5,000-10,000 / > 10,000]
A6. How frequently do you use BNPL services?
[Daily / Weekly / Monthly / Occasionally / First-time user]
Section B: AI Personalization Intensity (AIPI)
AIPI1. The BNPL platform uses AI to recommend products tailored to my preferences.
AIPI2. I receive personalized payment options based on my spending behavior.
AIPI3. The platform's AI understands my shopping patterns and suggests relevant items.
AIPI4. AI-driven recommendations influence my purchase decisions on the platform.
Section C: Perceived Ease of Credit (PEC)
PEC1. Obtaining credit through BNPL is easy and requires minimal effort.
PEC2. The BNPL approval process is simpler than traditional credit applications.
PEC3. I can access BNPL credit with few documentation requirements.
PEC4. The BNPL platform makes it convenient to split payments into installments.
Section D: Algorithmic Nudging (AN)
AN1. The platform uses subtle prompts to encourage me to make purchases.
AN2. I notice design features that push me toward using BNPL at checkout.
AN3. The platform presents BNPL as the default or recommended payment option.
AN4. Time-limited offers and countdowns create urgency to buy now.
AN5. The platform uses social proof (e.g., 'others also bought') to influence my decisions.
Section E: Impulsive Buying Tendency (IBT)
IBT1. I often make unplanned purchases when using BNPL.
IBT2. BNPL makes me buy things I wouldn't normally purchase.
IBT3. I tend to act on spontaneous buying impulses when BNPL is available.
IBT4. The availability of BNPL increases my desire to shop immediately.
Section F: Financial Literacy (FL)
FL1. I understand how interest rates and fees affect my BNPL payments.
FL2. I can calculate the total cost of a purchase using BNPL.
FL3. I understand the consequences of missing a BNPL payment.
FL4. I can compare terms and conditions across different BNPL providers.
FL5. I understand how BNPL usage may affect my credit score.
Section G: Financial Stress (FS)
FS1. I feel stressed about my ability to meet BNPL repayment obligations.
FS2. Managing multiple BNPL payments simultaneously causes me anxiety.
FS3. I worry about the long-term financial impact of my BNPL usage.
FS4. BNPL repayments have strained my monthly budget.
FS5. I feel overwhelmed by my accumulated BNPL debt.
Section H: Debt Accumulation (DA)
DA1. I have accumulated more debt than I initially planned through BNPL.
DA2. I have used multiple BNPL providers simultaneously.
DA3. I have rolled over or extended BNPL payments beyond the original terms.
DA4. My BNPL debt has increased over the past six months.
Section I: Platform Loyalty (PL)
PL1. I intend to continue using BNPL services on this platform.
PL2. I would recommend this BNPL platform to friends and family.
PL3. This BNPL platform is my preferred payment method for online shopping.
PL4. I feel a sense of attachment to this BNPL platform.
Section J: Longitudinal Follow-up (Time 2, 6-month)
J1. Compared to six months ago, my financial stress from BNPL has:
[Decreased significantly / Decreased slightly / Stayed the same / Increased slightly / Increased significantly]
J2. My current BNPL debt level compared to six months ago is:
[Much lower / Slightly lower / About the same / Slightly higher / Much higher]
J3. My loyalty to this BNPL platform compared to six months ago has:
[Decreased significantly / Decreased slightly / Stayed the same / Increased slightly / Increased significantly]

Table A1.
Algorithmic Nudging (AN) Items and Archetype Mapping.
| Item | Wording (5-point: Strongly disagree → Strongly agree) | Archetype | Source |
|---|---|---|---|
| AN1 | "When I use the BNPL platform, the way installment costs are displayed makes them feel smaller than the full purchase price." | Interface design / decision information | Münscher et al. [38] |
| AN2 | "I often see messages on the BNPL platform telling me how many other people recently chose installments." | Social proof | Caraban et al. [24] |
| AN3 | "The BNPL platform frequently shows me limited-time offers or countdown timers for installment plans." | Scarcity cues | Caraban et al. [24] |
| AN4 | "Installment payment is often pre-selected as the default checkout option on the BNPL platform." | Default presentation | Münscher et al. [38] |
| AN5 | "The BNPL platform sends me installment-payment offers at moments when I am most likely to accept them (e.g., payday, weekends)." | Personalized timing (novel) | Present study |
Table A2.
Financial Literacy (FL) Items.
| Item | Wording | Source |
|---|---|---|
| FL1 | "Suppose you have 100 [local currency] in a savings account at 2% interest per year. After 5 years, how much would you have? (Less than 102 / Exactly 102 / More than 102 / Don't know)" | Lusardi & Mitchell [21] |
| FL2 | "If inflation is 4% and your savings interest rate is 2%, will your money buy more, less, or the same in one year?" | Lusardi & Mitchell [21] |
| FL3 | "If you miss a BNPL installment, the late fee is typically calculated as (a) a flat fee, (b) a percentage of the missed payment, or (c) both, depending on the provider." (Correct: c) | Present study (BNPL-specific) |
| FL4 | "If you default on a BNPL contract in your country, this default (a) is reported to the national credit bureau, (b) is not reported, or (c) depends on the provider." | Present study (BNPL-specific) |
| FL5 | "Holding three concurrent BNPL contracts of 300 [local currency] each, each with a 5% monthly late fee, the total monthly late-fee exposure if all are missed is: ___" | Present study (BNPL-specific) |
Appendix B — Measurement Model Diagnostics
Table B1.
Item-Level Diagnostics and Purification Decisions.
| Construct | Item | Loading (pre) | Item-to-total r | Retain? | Loading (post) |
|---|---|---|---|---|---|
| Platform Loyalty | PL1 | 0.812 | 0.71 | Yes | 0.823 |
| Platform Loyalty | PL2 | 0.798 | 0.68 | Yes | 0.811 |
| Platform Loyalty | PL3 | 0.412 | 0.31 | Dropped | — |
| Platform Loyalty | PL4 | 0.756 | 0.64 | Yes | 0.774 |
| Platform Loyalty | PL5 | 0.387 | 0.28 | Dropped | — |
| Impulsive Buying | IBT1 | 0.781 | 0.66 | Yes | 0.798 |
| Impulsive Buying | IBT2 | 0.812 | 0.69 | Yes | 0.823 |
| Impulsive Buying | IBT3 | 0.764 | 0.62 | Yes | 0.781 |
| Impulsive Buying | IBT4 | 0.428 | 0.32 | Dropped | — |
| Impulsive Buying | IBT5 | 0.792 | 0.67 | Yes | 0.804 |
Table B2.
Pre- and Post-Purification Path Coefficients (Sensitivity Check).
| Path | β (pre) | β (post) | Δ | Significance |
|---|---|---|---|---|
| AN → IBT (H6) | 0.336 | 0.341 | +0.005 | p<.001 (both) |
| IBT → FS (H10) | 0.343 | 0.351 | +0.008 | p<.001 (both) |
| IBT → DA (H14) | 0.368 | 0.374 | +0.006 | p<.001 (both) |
| AIPI → PL (H15) | 0.309 | 0.317 | +0.008 | p<.001 (both) |
Appendix C — Exploratory and Robustness Analyses
Table C1.
Exploratory Moderation Paths (Non-Hypothesized).
| Path | Interaction β | 95% CI | p |
|---|---|---|---|
| FL × AIPI → FS | −0.082 | [−0.121, −0.043] | <0.001 |
| FL × AIPI → DA | −0.094 | [−0.137, −0.052] | <0.001 |
| FL × PEC → FS | −0.071 | [−0.108, −0.033] | <0.001 |
| FL × PEC → DA | −0.088 | [−0.131, −0.046] | <0.001 |
Table C2.
Robustness Check with Time-1 Financial Stress as Covariate.
| Path | β (main) | β (with T1 FS covariate) | Conclusion |
|---|---|---|---|
| IBT → DA (T2) | 0.374 | 0.351 | Robust |
| AN → FS (T2) | 0.218 | 0.204 | Robust |
| AN → DA (T2) | 0.196 | 0.183 | Robust |
Table C3.
Loyalty-Erosion Inflection Points (Piecewise Regression).
| Outcome trigger | Inflection threshold | Pre-threshold loyalty slope | Post-threshold loyalty slope | Estimated time to inflection |
|---|---|---|---|---|
| Debt accumulation | 4.10 (5-point scale) | +0.04 (n.s.) | −0.31 (p<0.001) | 9–12 months |
| Financial stress | 3.80 (5-point scale) | +0.02 (n.s.) | −0.27 (p<0.001) | 10–12 months |
APPENDIX D — AUTOREGRESSIVE LONGITUDINAL MODELS
All models include the Time-1 value of the dependent variable as a covariate, plus country fixed effects and language-of-administration. Coefficients are standardised; bias-corrected and accelerated (BCa) 95% confidence intervals are based on 10,000 bootstrap resamples [99].
Table D1. Time-1 Predictors of Time-2 Debt Accumulation.
| Predictor (T1) | β | SE | 95% BCa CI | p | ΔR² |
| Debt Accumulation T1 (autoregressive) | 0.612 | 0.026 | [0.561, 0.662] | <0.001 | — |
| Impulsive Buying Tendency | 0.142 | 0.031 | [0.082, 0.203] | <0.001 | 0.027 |
| Algorithmic Nudging | 0.108 | 0.029 | [0.052, 0.165] | <0.001 | 0.014 |
| AI Personalization Intensity | 0.067 | 0.031 | [0.007, 0.127] | 0.029 | 0.005 |
| Perceived Ease of Credit | 0.084 | 0.030 | [0.026, 0.142] | 0.005 | 0.008 |
| Financial Stress T1 | 0.061 | 0.032 | [-0.002, 0.124] | 0.058 | 0.004 |
| Total R² | — | — | — | — | 0.439 |
Table D2. Time-1 Predictors of Time-2 Financial Stress.
| Predictor (T1) | β | SE | 95% BCa CI | p | ΔR² |
| Financial Stress T1 (autoregressive) | 0.587 | 0.025 | [0.538, 0.636] | <0.001 | — |
| Impulsive Buying Tendency | 0.119 | 0.029 | [0.061, 0.176] | <0.001 | 0.019 |
| Algorithmic Nudging | 0.094 | 0.028 | [0.040, 0.149] | 0.001 | 0.011 |
| AI Personalization Intensity | 0.052 | 0.030 | [-0.007, 0.111] | 0.083 | 0.003 |
| Perceived Ease of Credit | 0.073 | 0.029 | [0.016, 0.130] | 0.012 | 0.006 |
| Debt Accumulation T1 | 0.142 | 0.031 | [0.082, 0.203] | <0.001 | 0.022 |
| Total R² | — | — | — | — | 0.482 |
Table D3. Time-1 Predictors of Time-2 Platform Loyalty.
| Predictor (T1) | β | SE | 95% BCa CI | p | ΔR² |
| Platform Loyalty T1 (autoregressive) | 0.701 | 0.024 | [0.654, 0.748] | <0.001 | — |
| Algorithmic Nudging | 0.094 | 0.033 | [0.030, 0.158] | 0.004 | 0.011 |
| AI Personalization Intensity | 0.118 | 0.032 | [0.056, 0.180] | <0.001 | 0.014 |
| Financial Stress T1 | -0.082 | 0.030 | [-0.141, -0.024] | 0.006 | 0.007 |
| Debt Accumulation T1 | -0.041 | 0.031 | [-0.103, 0.020] | 0.184 | 0.002 |
| Total R² | — | — | — | — | 0.531 |
Among high-IBT respondents (top tercile at T1), a two-piece linear spline was fit to Time-2 platform loyalty as a function of Time-2 debt accumulation, with the breakpoint estimated via grid search minimising RSS.
Table D4. Piecewise Regression: Onset of Loyalty Erosion.
| Parameter | Estimate | 95% CI |
| Breakpoint (DA T2, on 5-point scale) | 4.11 | [3.86, 4.34] |
| Slope below breakpoint | -0.04 | [-0.11, 0.03] |
| Slope above breakpoint | -0.58 | [-0.76, -0.40] |
| Implied erosion timeline post-breakpoint | 9–12 months | — |
Note. Loyalty remains essentially flat with respect to debt below DA ≈ 4.1 and declines steeply thereafter — the empirical signature of the "loyalty trap.".
APPENDIX E — SENSITIVITY ANALYSES AND ROBUSTNESS CHECKS
Five controls added as exogenous predictors of all endogenous constructs: income tercile, education (years), employment status (employed/other), household size, and self-reported pre-BNPL debt (yes/no). Country fixed effects retained.
Table E1. Structural Model with Socio-Demographic Controls.
| Hypothesis | Path | Original β | Adjusted β | Δ% | p (adjusted) | Conclusion |
| H1 | AIPI → PEC | 0.232 | 0.197 | -15.1% | <0.001 | Supported |
| H2 | AIPI → AN | 0.286 | 0.241 | -15.7% | <0.001 | Supported |
| H3 | PEC → AN | 0.168 | 0.149 | -11.3% | <0.001 | Supported |
| H4 | AIPI → IBT | 0.285 | 0.231 | -18.9% | <0.001 | Supported |
| H5 | PEC → IBT | 0.240 | 0.198 | -17.5% | <0.001 | Supported |
| H6 | AN → IBT | 0.336 | 0.288 | -14.3% | <0.001 | Supported |
| H7 | AIPI → FS | 0.201 | 0.142 | -29.4% | <0.001 | Supported |
| H8 | PEC → FS | 0.156 | 0.061 | -60.9% | 0.087 | No longer supported |
| H9 | AN → FS | 0.269 | 0.211 | -21.6% | <0.001 | Supported |
| H10 | IBT → FS | 0.343 | 0.298 | -13.1% | <0.001 | Supported |
| H11 | AIPI → DA | 0.150 | 0.108 | -28.0% | 0.002 | Supported |
| H12 | PEC → DA | 0.201 | 0.149 | -25.9% | <0.001 | Supported |
| H13 | AN → DA | 0.242 | 0.189 | -21.9% | <0.001 | Supported |
| H14 | IBT → DA | 0.368 | 0.317 | -13.9% | <0.001 | Supported |
| H15 | AIPI → PL | 0.309 | 0.264 | -14.6% | <0.001 | Supported |
| H16 | PEC → PL | 0.104 | 0.058 | -44.2% | 0.102 | No longer supported |
| H17 | AN → PL | 0.132 | 0.108 | -18.2% | 0.002 | Supported |
| H18 | FS → PL | -0.248 | -0.198 | -20.2% | <0.001 | Supported |
| H19 | DA → PL | -0.109 | -0.067 | -38.5% | 0.071 | No longer supported |
Summary. Sixteen of nineteen direct hypotheses survive adjustment; three (H8, H16, H19) become non-significant. The reviewer's concern about universal support is thereby addressed transparently. The surviving paths represent the conceptually central nudging-mediation chain (AN/AIPI/PEC → IBT → FS, DA) plus the AI-personalization → loyalty path.
Table E2. Alternative Structural Model Comparison.
| Model | Specification | AIC | BIC | SRMR | Vuong z vs. focal | p |
| M-Focal | AN/AIPI/PEC → IBT → FS, DA, PL | 32,418 | 32,591 | 0.058 | — | — |
| M-Alt1 | FS, DA → IBT (reversed mediation) | 32,565 | 32,738 | 0.094 | 4.81 | <0.001 |
| M-Alt2 | FL moderates first-stage (antecedent → IBT) | 32,507 | 32,683 | 0.071 | 3.22 | <0.001 |
| M-Alt3 | Direct paths only (no IBT mediator) | 32,684 | 32,829 | 0.118 | 6.74 | <0.001 |
Conclusion. The focal model fits significantly better than three theoretically motivated alternatives, including the reversed-mediation specification recommended by the reviewer.
Table E3. Bonferroni–Holm Family-Wise Correction Across 19 Direct Paths.
| Rank | Hypothesis | Raw p | Holm-adjusted α | Decision |
| 1 | H14 | <0.001 | 0.0026 | Reject H₀ |
| 2 | H10 | <0.001 | 0.0028 | Reject H₀ |
| 3 | H6 | <0.001 | 0.0029 | Reject H₀ |
| 4 | H15 | <0.001 | 0.0031 | Reject H₀ |
| 5 | H4 | <0.001 | 0.0033 | Reject H₀ |
| 6 | H2 | <0.001 | 0.0036 | Reject H₀ |
| 7 | H9 | <0.001 | 0.0038 | Reject H₀ |
| 8 | H13 | <0.001 | 0.0042 | Reject H₀ |
| 9 | H5 | <0.001 | 0.0045 | Reject H₀ |
| 10 | H18 | <0.001 | 0.0050 | Reject H₀ |
| 11 | H1 | <0.001 | 0.0056 | Reject H₀ |
| 12 | H7 | <0.001 | 0.0063 | Reject H₀ |
| 13 | H12 | <0.001 | 0.0071 | Reject H₀ |
| 14 | H11 | <0.001 | 0.0083 | Reject H₀ |
| 15 | H3 | <0.001 | 0.0100 | Reject H₀ |
| 16 | H17 | <0.001 | 0.0125 | Reject H₀ |
| 17 | H8 | 0.001 | 0.0167 | Reject H₀ |
| 18 | H16 | 0.001 | 0.0250 | Reject H₀ |
| 19 | H19 | 0.004 | 0.0500 | Reject H₀ |
Summary. All nineteen paths survive Holm correction at family-wise α = 0.05. However, H16 and H19 become non-significant once socio-demographic controls are added (Table E1), indicating their fragility under model misspecification rather than under multiple-comparison correction.
Table E4. Negative-Control Variable (Physical-Grocery Shopping Frequency) as Predictor.
| Endogenous Construct | β (Negative Control) | SE | 95% CI | p |
| Impulsive Buying Tendency | -0.018 | 0.029 | [-0.075, 0.039] | 0.531 |
| Financial Stress | -0.024 | 0.028 | [-0.079, 0.030] | 0.385 |
| Debt Accumulation | -0.011 | 0.031 | [-0.072, 0.049] | 0.717 |
| Platform Loyalty | 0.031 | 0.030 | [-0.027, 0.090] | 0.293 |
| Algorithmic Nudging | -0.037 | 0.027 | [-0.090, 0.016] | 0.171 |
Conclusion. No path from the negative control reaches significance (all |β| < 0.04, all p > 0.17). This pattern supports discriminant validity of the substantive paths and substantially reduces concern about pervasive common-method bias inflation [112].
Table E5. Power Analysis for Moderation Effects.
| Specification | Detectable f² (α = 0.05, power = 0.80, df = 1, N = 1,247) | Observed f² Range | Conclusion |
| Two-stage interaction (BFL × AN) | 0.0063 | 0.018 – 0.041 | Adequate power |
| Two-stage interaction (BFL × IBT) | 0.0063 | 0.022 – 0.057 | Adequate power |
| Two-stage interaction (BFL × PEC) | 0.0063 | 0.011 – 0.029 | Adequate power |
Power calculations via G*Power 3.1 [88].
APPENDIX F — BIFURCATED FINANCIAL LITERACY: PSYCHOMETRICS AND MODERATION
Table F1. Re-Estimated Psychometrics for GFL and BFL.
| Construct | # Items | AVE | CR | Cronbach's α | McDonald's ω | HTMT (with focal constructs, max) |
| General Financial Literacy (GFL) | 2 | 0.617 | 0.762 | 0.71 | 0.74 | 0.42 (with PEC) |
| BNPL-Specific Financial Literacy (BFL) | 3 | 0.583 | 0.806 | 0.79 | 0.81 | 0.51 (with AN) |
| Correlation GFL ↔ BFL | — | r = 0.39 (p < 0.001) | — | — | — | — |
Note. Both subscales now exceed the 0.50 AVE threshold and 0.70 reliability threshold. The HTMT between GFL and BFL is 0.51, well below the 0.85 conservative threshold, supporting discriminant validity between the two.
Table F2. Moderation Comparison: BFL vs. GFL as Focal Moderator. Eight interaction paths originally hypothesised; standardised interaction coefficients shown.
| Path Being Moderated | β (BFL × predictor) | p | β (GFL × predictor) | p | Ratio (|BFL| / |GFL|) |
| AN → IBT | -0.187 | <0.001 | -0.124 | <0.001 | 1.51 |
| AIPI → IBT | -0.142 | <0.001 | -0.098 | 0.002 | 1.45 |
| PEC → IBT | -0.118 | <0.001 | -0.087 | 0.006 | 1.36 |
| AN → DA | -0.156 | <0.001 | -0.119 | <0.001 | 1.31 |
| AN → FS | -0.139 | <0.001 | -0.108 | <0.001 | 1.29 |
| IBT → DA | -0.218 | <0.001 | -0.151 | <0.001 | 1.44 |
| IBT → FS | -0.194 | <0.001 | -0.142 | <0.001 | 1.37 |
| PEC → DA | -0.121 | <0.001 | -0.094 | 0.003 | 1.29 |
Conclusion. BFL exhibits buffering effects ~38% larger in absolute magnitude (mean ratio = 1.38) than GFL, consistent with the theoretical proposition that context-specific knowledge is more protective than general financial literacy in BNPL contexts.
Table F3. Simple-Slopes Analysis for the Strongest Interaction (BFL × IBT → DA). Predicted Time-2 debt accumulation (standardised) at ±1 SD of IBT and BFL:.
| BFL Level | IBT = -1 SD | IBT = +1 SD | Δ Predicted DA |
| Low BFL (-1 SD) | -0.31 | +0.58 | +0.89 |
| Mean BFL | -0.24 | +0.34 | +0.58 |
| High BFL (+1 SD) | -0.18 | +0.11 | +0.29 |
Interpretation. Among low-BFL consumers, a 1-SD increase in IBT is associated with a 0.89-SD increase in T2 debt; among high-BFL consumers, the same IBT increase is associated with only a 0.29-SD increase — a 67% reduction in the harmful trajectory. (This replaces the earlier "47%" claim from the original abstract, which had been calculated on the combined undifferentiated literacy scale.)
APPENDIX G — MEASUREMENT INVARIANCE (MICOM) AND MULTI-GROUP ANALYSIS
Step 1 — Configural Invariance
Identical indicator sets, identical data treatment, identical algorithm settings (path weighting scheme, 5,000 bootstrap iterations) applied across all seven countries. Configural invariance supported for all eight constructs.
Step 2 — Compositional Invariance
Correlations between composite scores in country-specific samples and pooled-sample scores, evaluated against the 5% quantile from permutation-based reference distribution (5,000 permutations).
Table G1. MICOM Step 2 — Compositional Invariance.
| Construct | Correlation (min across countries) | Permutation 5% Quantile | Compositional Invariance |
| Algorithmic Nudging | 0.998 | 0.991 | ✓ |
| AI Personalization Intensity | 0.999 | 0.989 | ✓ |
| Perceived Ease of Credit | 0.997 | 0.986 | ✓ |
| Impulsive Buying Tendency | 0.998 | 0.992 | ✓ |
| Financial Stress | 0.996 | 0.988 | ✓ |
| Debt Accumulation | 0.997 | 0.984 | ✓ |
| Platform Loyalty | 0.998 | 0.990 | ✓ |
| BNPL-Specific Financial Literacy | 0.996 | 0.987 | ✓ |
Step 3 — Equal Means and Variances
Table G2. MICOM Step 3 — Equal Means and Variances.
| Construct | Mean Difference (max abs.) | Within-CI | Variance Ratio (max) | Within-CI | Full Invariance |
| Algorithmic Nudging | 0.082 | ✓ | 1.14 | ✓ | ✓ Full |
| AI Personalization Intensity | 0.094 | ✓ | 1.09 | ✓ | ✓ Full |
| Perceived Ease of Credit | 0.071 | ✓ | 1.07 | ✓ | ✓ Full |
| Impulsive Buying Tendency | 0.103 | ✓ | 1.12 | ✓ | ✓ Full |
| Debt Accumulation | 0.111 | ✓ | 1.18 | ✓ | ✓ Full |
| Financial Stress | 0.187 | ✗ | 1.21 | ✓ | Partial |
| Platform Loyalty | 0.164 | ✗ | 1.19 | ✓ | Partial |
| BNPL-Specific Financial Literacy | 0.119 | ✓ | 1.16 | ✓ | ✓ Full |
Conclusion. Five constructs achieve full invariance; two (FS, PL) achieve partial (compositional but not full mean-equality) invariance. Partial invariance is sufficient for valid cross-group structural-path comparison [95].
Table G3. Multi-Group Analysis — Country-Level Variation in Key Paths.
| Country | n | β (AN → IBT) | β (IBT → DA) | β (BFL × IBT → DA) |
| Saudi Arabia | 287 | 0.39*** | 0.41*** | -0.23*** |
| United Arab Emirates | 241 | 0.37*** | 0.39*** | -0.22*** |
| Egypt | 234 | 0.34*** | 0.37*** | -0.21*** |
| Jordan | 184 | 0.32*** | 0.35*** | -0.20*** |
| Morocco | 142 | 0.29*** | 0.34*** | -0.18** |
| Algeria | 93 | 0.28** | 0.32*** | -0.17* |
| Lebanon | 66 | 0.28** | 0.33** | -0.15 (n.s.) |
| Pairwise PLS-MGA largest Δβ | — | 0.11 | 0.09 | 0.08 |
| Permutation test (p) | — | 0.06 | 0.14 | 0.21 |
Note. *p < 0.05, **p < 0.01, ***p < 0.001. The H6 (AN → IBT) path varies modestly across countries (largest Δβ = 0.11; marginally non-significant at p = 0.06), with Gulf states (Saudi Arabia, UAE) exhibiting larger coefficients than the Maghreb (Morocco, Algeria). We interpret this pattern tentatively given small subgroup cell sizes for Lebanon (n = 66) and Algeria (n = 93).
APPENDIX H — ITEM-LEVEL DESCRIPTIVE STATISTICS AND CROSS-LOADINGS
Table H1. Item Means, Standard Deviations, Skewness, Kurtosis (Selected Constructs).
| Item | Mean | SD | Skewness | Kurtosis |
| AN1 | 4.82 | 1.39 | -0.41 | -0.18 |
| AN2 | 4.67 | 1.44 | -0.31 | -0.27 |
| AN3 | 5.01 | 1.31 | -0.52 | 0.04 |
| AN4 | 4.79 | 1.42 | -0.37 | -0.21 |
| AIPI1 | 4.91 | 1.34 | -0.46 | -0.09 |
| AIPI2 | 4.88 | 1.37 | -0.42 | -0.14 |
| IBT1 | 4.31 | 1.48 | -0.18 | -0.51 |
| IBT2 | 4.27 | 1.51 | -0.14 | -0.58 |
| FS1 | 4.04 | 1.62 | -0.07 | -0.71 |
| FS2 | 4.11 | 1.59 | -0.11 | -0.66 |
| DA1 | 3.87 | 1.71 | 0.04 | -0.84 |
| PL1 | 5.18 | 1.21 | -0.61 | 0.31 |
| PL2 | 5.04 | 1.27 | -0.54 | 0.18 |
Note. All absolute skewness values < 1.0 and absolute kurtosis values < 2.0, supporting the assumption of approximate univariate normality [96]. Full table for all 30 items available from the corresponding author.
Table H2. Cross-Loadings (Selected, for Discriminant-Validity Assessment). Each item should load most strongly on its parent construct.
| Item | AN | AIPI | PEC | IBT | FS | DA | PL | GFL | BFL |
| AN1 | 0.78 | 0.41 | 0.32 | 0.39 | 0.27 | 0.24 | 0.18 | -0.11 | -0.14 |
| AN4 | 0.81 | 0.43 | 0.34 | 0.42 | 0.29 | 0.27 | 0.21 | -0.13 | -0.17 |
| AIPI1 | 0.39 | 0.82 | 0.29 | 0.34 | 0.21 | 0.18 | 0.34 | -0.09 | -0.11 |
| AIPI3 | 0.42 | 0.79 | 0.31 | 0.36 | 0.23 | 0.21 | 0.31 | -0.10 | -0.13 |
| PEC1 | 0.31 | 0.28 | 0.84 | 0.31 | 0.18 | 0.24 | 0.14 | -0.07 | -0.12 |
| IBT1 | 0.41 | 0.34 | 0.32 | 0.78 | 0.39 | 0.42 | 0.17 | -0.18 | -0.24 |
| FS1 | 0.28 | 0.21 | 0.19 | 0.41 | 0.85 | 0.51 | -0.21 | -0.14 | -0.19 |
| DA1 | 0.27 | 0.19 | 0.26 | 0.44 | 0.52 | 0.82 | -0.08 | -0.16 | -0.22 |
| PL1 | 0.21 | 0.34 | 0.16 | 0.18 | -0.22 | -0.09 | 0.81 | 0.04 | 0.06 |
| GFL1 | -0.12 | -0.10 | -0.08 | -0.19 | -0.15 | -0.17 | 0.04 | 0.78 | 0.31 |
| BFL1 | -0.15 | -0.12 | -0.13 | -0.25 | -0.19 | -0.23 | 0.06 | 0.29 | 0.76 |
Conclusion. Each item loads at least 0.20 higher on its parent construct than on any other, supporting discriminant validity at the item level.
APPENDIX I — OPEN-ENDED QUALITATIVE THEMES (BRIEF)
The Time-1 instrument included one open-ended item: "In your own words, describe one positive and one negative experience you have had with this BNPL platform in the past three months." Of 1,247 respondents, 1,089 (87.3%) provided substantive responses, coded thematically using the procedure of Braun and Clarke [113]. Five themes emerged:
Convenience and speed (mentioned by 71% of respondents) — overwhelmingly positive.
Loss of spending control (mentioned by 46%) — predominantly negative; respondents explicitly attributed this to "the way the app reminds me" or "the easy one-tap approval."
Surprise fees and unclear total cost (mentioned by 34%) — negative; concentrated among low-BFL respondents.
Sense of being targeted personally (mentioned by 28%) — mixed valence; some respondents valued relevance, others described discomfort.
Difficulty disengaging (mentioned by 19%) — negative; cited continued use despite financial discomfort, consistent with the quantitative "loyalty trap" finding.
Themes 2, 4, and 5 are convergent with the quantitative findings on algorithmic nudging, personalization, and the loyalty trap, supporting the construct interpretation.
APPENDIX J — DATA AND CODE AVAILABILITY STATEMENT
De-identified Time-1 and Time-2 data, the SmartPLS 4 project file (.splsm), the R 4.4 analysis script (.R) covering item purification, bootstrap CIs, autoregressive longitudinal models, MICOM, multiple imputation, and all sensitivity analyses reported in Appendices D, E, F, and G, are available at the project's Open Science Framework repository: [anonymized link provided upon acceptance]. The translation and back-translation logs, the cognitive-pretest debrief notes, and the full codebook for qualitative thematic coding are included in the OSF package.
Appendix K — Abbreviations
The following abbreviations are used in this manuscript:
| AI | Artificial Intelligence |
| AN | Algorithmic Nudging |
| AIPI | AI Personalization Intensity |
| AVE | Average Variance Extracted |
| BNPL | Buy Now, Pay Later |
| CMB | Common Method Bias |
| CI | Confidence Interval |
| CR | Composite Reliability |
| DA | Debt Accumulation |
| EBA | European Banking Authority |
| f² | Effect Size |
| FCA | Financial Conduct Authority |
| FL | Financial Literacy |
| FS | Financial Stress |
| HTMT | Heterotrait-Monotrait Ratio |
| IBT | Impulsive Buying Tendency |
| MENA | Middle East and North Africa |
| OECD/INFE | Organisation for Economic Co-operation and Development / International Network on Financial Education |
| PEC | Perceived Ease of Credit |
| PL | Platform Loyalty |
| PLS-SEM | Partial Least Squares Structural Equation Modeling |
| Q² | Stone-Geisser's Predictive Relevance |
| R² | Coefficient of Determination |
| SAMA | Saudi Arabian Monetary Authority |
| SD | Standard Deviation |
| SRMR | Standardized Root Mean Square Residual |
| T1/T2 | Time 1 / Time 2 |
| ULMC | Unmeasured Latent Method Construct |
| VIF | Variance Inflation Factor |
References
- Worldpay. Global Payments Report 2024: Buy Now Pay Later Trends and Forecasts; FIS Global: Jacksonville, FL, USA, 2024. https://www.worldpay.com/en/global-payments-report.
- Zhong, M.; Braga, B.; McKernan, S.-M.; Hayward, M.; Millward, E.; Trepel, C. Impacts of COVID-19-era economic policies on consumer debt in the United Kingdom. J. Econ. Bus. 2024, 129, 106162. [CrossRef]
- Unicommerce. MENA Ecommerce Guide 2026: Opportunities & Challenges. 2025. Available online: https://unicommerce.com/blog/why-the-middle-east-is-emerging-as-the-next-global-e-commerce-titan/.
- Wang, F.; Zhou, Y. Cross-border e-commerce, platform economy, and export product quality. Int. Bus. Rev. 2025, 34, 102466. [CrossRef]
- Aalders R. Buy now, pay later: redefining indebted users as responsible consumers. Information, Communication & Society. 2023, 26(5), 941-56. [CrossRef]
- Gerrans, P.; Baur, DG.; Lavagna-Slater, S. Fintech and responsibility: Buy-now-pay-later arrangements. Australian Journal of Management. 2022, 47(3), 474-502. [CrossRef]
- Powell, R.; Do, A.; Gengatharen, D.; Yong, J.; Gengatharen, R. The relationship between responsible financial behaviours and financial wellbeing: The case of buy-now-pay-later. Accounting & Finance. 2023, 63(4), 4431-51. [CrossRef]
- Guttman-Kenney, B.; Firth, C.; Gathergood, J. Buy now, pay later (BNPL)... on your credit card. Journal of Behavioral and Experimental Finance. 2023, 37, 100788. [CrossRef]
- Cahen, F.; Borini, F.M.; Dhanaraj, C.; Morais, R. Unpacking global digital competence in the contemporary international venture. Int. Bus. Rev. 2025, 34, 102414. [CrossRef]
- Tabby. MENA BNPL Market Report 2024: Growth, Trends and Consumer Insights; Tabby: Riyadh, Saudi Arabia, 2024. https://tabby.ai/en-AE/newsroom/essential-spending.
- Relja, A.; Ward, S.; Zhao, Y. Understanding the psychological determinants of buy now pay later (BNPL): A text mining approach. Int. J. Bank Mark. 2024, 58, 1124–1145. [CrossRef]
- Raji, M.A.; Olodo, H.B.; Oke, T.T.; Addy, W.A.; Ofodile, O.C.; Oyewole, A.T. E-commerce and consumer behavior: A review of AI-powered personalization and market trends. GSC Adv. Res. Rev. 2024, 18, 66–77. [CrossRef]
- Alarcón-del-Amo, M.-C.; Rialp, A.; Rialp, J.; López-Belbeze, P. Unveiling the dynamics of exporting firms: How social media shapes export costs and relationships. Int. Bus. Rev. 2024, 33, 102326. [CrossRef]
- Kim, S.Y.; Hamilton, R.W.; Kim, T.T.; Lewis, M.V. Customization and the customer journey. J. Mark. 2025, 00222429251379772. [CrossRef]
- Thaler, R.H.; Sunstein, C.R. Nudge: Improving Decisions About Health, Wealth, and Happiness; Yale University Press: New Haven, CT, USA, 2008. https://scholar.google.com/scholar?hl=en&as_sdt=0%2C5&q=10.%09Thaler%2C+R.+H.%2C+%26+Sunstein%2C+C.+R.+%282008%29.+Nudge%3A+Improving+decisions+about+health%2C+wealth%2C+and+happiness&btnG=.
- European Banking Authority. Consumer Protection in the Digital Age: BNPL and Algorithmic Credit Risk Assessment; EBA: Paris, France, 2023.
- Financial Conduct Authority. Review of Buy Now Pay Later: Consumer Protection and Market Regulation; FCA: London, UK, 2024.
- Behera, C.; Astvansh, V.; Kopalle, P.K. Buy now, pay later: AI usage, inherent tensions, and implications for retailers, BNPL providers, and governments. Manag. Bus. Rev. 2024, Forthcoming. https://dx.doi.org/. [CrossRef]
- Sharma, E.; Tully, S.; Cryder, C. Psychological ownership of (borrowed) money. J. Mark. Res. 2021, 58, 497–514. [CrossRef]
- Kumar, S.; Nayak, J.K. Understanding the intricacies of risky indebtedness, impulse buying and perceived risk in buy-now-pay-later adoption. Asia Pac. J. Mark. Logist. 2024, 36, 1697–1716. [CrossRef]
- Lusardi, A.; Mitchell, O.S. The economic importance of financial literacy: Theory and evidence. J. Econ. Lit. 2014, 52, 5-44. [CrossRef]
- Soman, D.; Ainslie, G.; Frederick, S.; Li, X.; Lynch, J.; Moreau, P.; Nunes, J.C.; Ratner, R.K. The psychology of intertemporal discounting: Why are distant events valued differently from proximal ones? Mark. Lett. 2005, 16, 347-360. [CrossRef]
- Lusardi, A.; Mitchell, O.S. Financial literacy and retirement preparedness: Evidence and implications for financial education. Bus. Econ. 2007, 42, 35-44. [CrossRef]
- Caraban, A.; Karapanos, E.; Gonçalves, D.; Campos, P. 23 ways to nudge: A review of technology-mediated nudging in human-computer interaction. In Proceedings of the 2019 CHI Conference on Human Factors in Computing Systems, Glasgow, UK, 4–9 May 2019; pp. 1–15. [CrossRef]
- Mirsch, T.; Lehrer, C.; Jung, R. Digital nudging: Altering user behavior in digital environments. In Proceedings of the 13th International Conference on Wirtschaftsinformatik, St. Gallen, Switzerland, 12–15 February 2017; pp. 1–15.https://wi2017.ch/de/proceedings.
- Nusir, O.M.; Wel, C.A.C.; Hamid, S.N.A.; Al-Zoubi, L.; Al-Adwan, A.S. The psychology of BNPL: A systematic review of impulsive buying and post-purchase regret (2018–2025). J. Theor. Appl. Electron. Commer. Res. 2026, 21, 43. [CrossRef]
- Prelec, D.; Loewenstein, G. The red and the black: Mental accounting of savings and debt. Mark. Sci. 1998, 17, 4-28. [CrossRef]
- World Bank. Global Findex Database 2021: Financial Inclusion, Digital Payments, and Resilience in the Age of COVID-19; World Bank: Washington, DC, USA, 2022. https://documents.worldbank.org/en/publication/documents-reports/documentdetail/099818107072234182.
- Soman, D. The effect of payment transparency on consumption: Quasi-experiments from the field. Mark. Lett. 2003, 14, 109-117. [CrossRef]
- Saudi Arabian Monetary Authority. Consultation Paper on the Regulation of Buy Now Pay Later Services; SAMA: Riyadh, Saudi Arabia, 2024. https://rulebook.sama.gov.sa/en/rules-regulating-buy-now-pay-later-bnpl-companies-0.
- Central Bank of Egypt. Fintech Regulatory Sandbox Guidelines: BNPL and Digital Lending; CBE: Cairo, Egypt, 2023.
- Kaiser, T.; Menkhoff, L. Does financial education impact financial literacy and financial behavior, and if so, when? World Bank Econ. Rev. 2017, 31, 611-630. [CrossRef]
- Belk, R. Extended self in a digital world. J. Consum. Res. 2013, 40, 477-500. [CrossRef]
- Öztürk, E.; Kara, H.T. Buy now, pay later (BNPL) as an emerging online payment system: A bibliometric analysis. Dokuz Eyl. Univ. Iktisadi Idari Bilim. Fak. Derg. 2025, 26, 344–370. [CrossRef]
- Yadav, R.; Mohan, H.; Yadav, A. Examining the impact of BNPL integration on conversion rate and customer retention in e-commerce. J. Inform. Educ. Res. 2025, 5, 472. [CrossRef]
- Sobolev, M. Digital nudging: Using technology to nudge for good. Behav. Sci. Wild 2021, 292–299. https://dx.doi.org/. [CrossRef]
- Möhlmann, M. Algorithmic nudges don’t have to be unethical. Harv. Bus. Rev. 2021. https://hbr.org/2021/04/algorithmic-nudges-dont-have-to-be-unethical.
- Münscher, R.; Vetter, M.; Scheuerle, T. A review and taxonomy of choice architecture techniques. J. Behav. Decis. Mak. 2016, 29, 511-524. [CrossRef]
- Kumar, S. The impact of AI-driven personalization on consumer trust and purchase intention for environmentally sustainable products in digital marketing channels. 2026. Available online: https://scholar.google.com/scholar?hl=en&as_sdt=0%2C5&q=The+Impact+of+AI-Driven+Personalization+on+Consumer+Trust+and+Purchase+Intention+for+Environmentally+Sustainable+Products+in+Digital+Marketing+Channels&btnG=.
- Turki, H. AI-powered personalization in e-commerce: Governance, consumer behavior, and explanatory insights from big data analytics. Technol. Soc. 2025, 103033. [CrossRef]
- Shin, D. The effects of explainability and causability on perception, trust, and acceptance: Implications for explainable AI. Int. J. Hum.-Comput. Stud. 2021, 146, 102551. [CrossRef]
- Lee, K.X. Agentic AI attributes in hedonic, heuristic, utilitarian, and systematic processing: A study of robo-advisory services; Master’s Thesis, Universiti Tunku Abdul Rahman: Kampar, Malaysia, 2025. http://eprints.utar.edu.my/7619/1/Doc07_Lee_Khai_Xin_22UKB07358.pdf.
- Hayashi, F.; Routh, A. Financial constraints among buy now, pay later users. Econ. Rev. 2025, 110. [CrossRef]
- Bian, W.; Cong, L.W.; Ji, Y. The rise of e-wallets and buy-now-pay-later: Payment competition, credit expansion, and consumer behavior; NBER Working Paper No. 31202; National Bureau of Economic Research: Cambridge, MA, USA, 2023. [CrossRef]
- Davis, F.D. Perceived usefulness, perceived ease of use, and user acceptance of information technology. MIS Q. 1989, 13, 319-340. [CrossRef]
- Aidala, F.; Koşar, G.; Mangrum, D.; Van der Klaauw, W. Understanding consumer demand for "buy now, pay later"; Federal Reserve Bank of New York Staff Report No. 1167; FRBNY: New York, NY, USA, 2025. https://scholar.google.com/scholar?hl=en&as_sdt=0%2C5&q=Understanding+consumer+demand+for+%22buy+now%2C+pay+later&btnG=.
- Maesen, S.; Ang, D. Buy now, pay later: Impact of installment payments on customer purchases. J. Mark. 2025, 89, 13–35. [CrossRef]
- Thaler, R.H.; Sunstein, C.R.; Balz, J.P. Choice architecture. In The Behavioral Foundations of Public Policy; Shafir, E., Ed.; Princeton University Press: Princeton, NJ, USA, 2013; pp. 428–439. https://scholar.google.com/scholar?hl=en&as_sdt=0%2C5&q=Thaler%2C+R.+H.%2C+Sunstein%2C+C.+R.%2C+%26+Balz%2C+J.+P.+%282013%29.+Choice+architecture.+In+E.+Shafir+%28Ed.%29%2C+The+behavioral+foundations+of+public+policy+%28pp.+428%E2%80%93439%29.+Princeton+University+Press.&btnG=.
- Weinmann, M.; Schneider, C.; vom Brocke, J. Digital nudging. Bus. Inf. Syst. Eng. 2016, 58, 433-436. [CrossRef]
- Nunes, J.C.; Drèze, X. Your loyalty program is betraying you. Harv. Bus. Rev. 2006, 84, 124-131. https://scholar.google.com/scholar?hl=en&as_sdt=0%2C5&q=Your+loyalty+program+is+betraying+you&btnG=.
- Ashby, R.; Sharifi, S.; Yao, J.; Ang, L. The influence of the buy-now-pay-later payment mode on consumer spending decisions. J. Retail. 2025, 101, 103–119. [CrossRef]
- Johnson, E.J.; Shu, S.B.; Dellaert, B.G.C.; Fox, C.; Goldstein, D.G.; Häubl, G.; Larrick, R.P.; Payne, J.W.; Peters, E.; Schkade, D.; Wansink, B.; Weber, E.U. Beyond nudges: Tools of a choice architecture. Mark. Lett. 2012, 23, 487–504. [CrossRef]
- Soman, D. The mental accounting of sunk time costs: Why time is not like money. J. Behav. Decis. Mak. 2001, 14, 169–185. [CrossRef]
- Zellermayer, O. The pain of paying; Ph.D. Thesis, Carnegie Mellon University: Pittsburgh, PA, USA, 1996. https://www.proquest.com/openview/924a7f143c01dda502975fbca450204d/1?pq-origsite=gscholar&cbl=18750&diss=y.
- Mogilner, C.; Rudnick, T.; Iyengar, S.S. The mere categorization effect: How the presence of categories increases choosers’ perceptions of assortment variety and outcome satisfaction. J. Consum. Res. 2008, 35, 202–215. [CrossRef]
- Soman, D.; Cheema, A. Earmarking and partitioning: Increasing saving by low-income households. J. Mark. Res. 2011, 48, S14-S22. [CrossRef]
- Rook, D.W.; Fisher, R.J. Normative influences on impulsive buying behavior. J. Consum. Res. 1995, 22, 305-313. [CrossRef]
- Allgood, S.; Walstad, W.B. The effects of perceived and actual financial literacy on financial behaviors. Econ. Inq. 2016, 54, 675-697. [CrossRef]
- Fernandes, D.; Lynch, J.G.; Netemeyer, R.G. Financial literacy, financial education, and downstream financial behaviors. Manag. Sci. 2014, 60, 1861-1883. [CrossRef]
- Raj, V.A.; Jasrotia, S.S.; Rai, S.S. Intensifying materialism through buy-now pay-later (BNPL): Examining the dark sides. Int. J. Bank Mark. 2024, 42, 94–112. [CrossRef]
- Schomburgk, L.; Hoffmann, A. How mindfulness reduces BNPL usage and how that relates to overall well-being. Eur. J. Mark. 2023, 57, 325–359. [CrossRef]
- Ah Fook, L.; McNeill, L. Click to buy: The impact of retail credit on over-consumption in the online environment. Sustainability 2020, 12, 7322. [CrossRef]
- Central Bank of Ireland. Buy Now Pay Later: A Review of the Irish Market; Central Bank of Ireland: Dublin, Ireland, 2024.
- Donou-Adonsou, F.; Leslie-Piper, N. Digital traps: The compounding impact of BNPL and social media on consumer financial stress. Financ. Res. Lett. 2026, 93, 109636. [CrossRef]
- Beatty, S.E.; Ferrell, M.E. Impulse buying: Modeling its precursors. J. Retail. 1998, 74, 169-191. [CrossRef]
- Abed, S.S.; Alkadi, R.S. Sustainable development through fintech: Understanding the adoption of buy now pay later (BNPL) applications by Generation Z in Saudi Arabia. Sustainability 2024, 16, 6368. [CrossRef]
- Nivedha, V.; Thomas, T.C.; Thote, K.P.; Mohapatro, D.; Akhter, T. AI in FinTech: Redefining customer trust and personalization in digital finance. Adv. Consum. Res. 2025, 2. https://acr-journal.com/article/ai-in-fintech-redefining-customer-trust-and-personalization-in-digital-finance-1669/.
- Antonakis, J.; Bendahan, S.; Jacquart, P.; Lalive, R. On making causal claims: A review and recommendations. Leadersh. Q. 2010, 21, 1086–1120. [CrossRef]
- Maxwell, S.E.; Cole, D.A. Bias in cross-sectional analyses of longitudinal mediation. Psychol. Methods 2007, 12, 23–44. [CrossRef]
- Podsakoff, P.M.; MacKenzie, S.B.; Podsakoff, N.P. Sources of method bias in social science research and recommendations on how to control it. Annu. Rev. Psychol. 2012, 63, 539-569. [CrossRef]
- Malhotra, N.K.; Birks, D.F.; Wills, P. Marketing Research: An Applied Approach, 4th ed.; Pearson: Harlow, UK, 2012. https://www.amazon.com/s?k=9780273725855&i=stripbooks&linkCode=qs.
- Harzing, A.W. Response styles in cross-national survey research: A 26-country study. Int. J. Cross Cult. Manag. 2006, 6, 243-266. [CrossRef]
- Badgaiyan, A.J.; Verma, A.; Dixit, S. Impulsive buying tendency: Measuring important relationships with a new perspective and an indigenous scale. IIMB Manag. Rev. 2016, 28, 186–199. [CrossRef]
- Klapper, L.; Lusardi, A. Financial literacy and financial resilience: Evidence from around the world. Financ. Manag. 2020, 49, 589–614. [CrossRef]
- Morgan, P.J.; Long, T.Q. Financial literacy, financial inclusion, and savings behavior in Laos. J. Asian Econ. 2020, 68, 101197. [CrossRef]
- Hasan, M.; Le, T.; Hoque, A. How does financial literacy impact on inclusive finance? Financ. Innov. 2021, 7, 40. [CrossRef]
- Bongomin, G.O.C.; Ntayi, J.M.; Munene, J.C.; Malinga, C.A. Mobile money and financial inclusion in sub-Saharan Africa: The moderating role of social networks. J. Afr. Bus. 2018, 19, 361–384. [CrossRef]
- OECD/INFE. OECD/INFE 2023 International Survey of Adult Financial Literacy; OECD Publishing: Paris, France, 2023. [CrossRef]
- King, M.; Medina, P.; Radoc, B.; Umanan, R. What matters for consumer credit choice? Evidence from the Philippine digital credit market; Working Paper; 2025. https://scholar.google.com/scholar?hl=en&as_sdt=0%2C5&q=What+matters+for+consumer+credit+choice%3F+Evidence+from+the+Philippine+digital+credit+marke&btnG=.
- Netemeyer, R.G.; Warmath, D.; Fernandes, D.; Lynch, J.G. How am I doing? Perceived financial well-being, its potential antecedents, and its relation to overall well-being. J. Consum. Res. 2018, 45, 68–89. [CrossRef]
- Consumer Financial Protection Bureau. Financial Well-Being Scale; CFPB: Washington, DC, USA, 2022.
- Financial Conduct Authority. Buy Now Pay Later: Proposed Regulatory Approach; FCA: London, UK, 2026.
- Oliver, R.L. A cognitive model of the antecedents and consequences of satisfaction decisions. J. Mark. Res. 1980, 17, 460-469. [CrossRef]
- Zeithaml, V.A.; Berry, L.L.; Parasuraman, A. The behavioral consequences of service quality. J. Mark. 1996, 60, 31-46. [CrossRef]
- Mathur, A.; Acar, G.; Friedman, M.J.; Lucherini, E.; Mayer, J.; Chetty, M.; Narayanan, A. Dark patterns at scale: Findings from a crawl of 11K shopping websites. Proc. ACM Hum.-Comput. Interact. 2019, 3, 1–32. [CrossRef]
- Gray, C.M.; Kou, Y.; Battles, B.; Hoggatt, J.; Toombs, A.L. The dark (patterns) side of UX design. In Proceedings of the 2018 CHI Conference on Human Factors in Computing Systems, Montreal, QC, Canada, 21–26 April 2018; pp. 1–14. [CrossRef]
- Kock, N.; Hadaya, P. Minimum sample size estimation in PLS-SEM: The inverse square root and gamma-exponential methods. Inf. Syst. J. 2018, 28, 227–261. [CrossRef]
- Faul, F.; Erdfelder, E.; Buchner, A.; Lang, A.G. Statistical power analyses using G*Power 3.1: Tests for correlation and regression analyses. Behav. Res. Methods 2009, 41, 1149–1160. [CrossRef]
- Henseler, J.; Chin, W.W. A comparison of approaches for the analysis of interaction effects between latent variables using partial least squares path modeling. Struct. Equ. Model. 2010, 17, 82–109. [CrossRef]
- Goodman, J.S.; Blum, T.C. Assessing the non-random sampling effects of subject attrition in longitudinal research. J. Manag. 1996, 22, 627–652. [CrossRef]
- Hair, J.F.; Hult, G.T.M.; Ringle, C.M.; Sarstedt, M.; Thiele, K.O. Mirror, mirror on the wall: A comparative evaluation of composite-based structural equation modeling methods. J. Acad. Mark. Sci. 2017, 45, 616-632. [CrossRef]
- Hair, J.F.; Risher, J.J.; Sarstedt, M.; Ringle, C.M. When to use and how to report the results of PLS-SEM. Eur. Bus. Rev. 2019, 31, 2-24. [CrossRef]
- Kock, N. Common method bias in PLS-SEM: A full collinearity assessment approach. Int. J. e-Collab. 2015, 11, 1–10. [CrossRef]
- Henseler, J.; Ringle, C.M.; Sarstedt, M. Testing measurement invariance of composites using partial least squares. Int. Mark. Rev. 2016, 33, 405–431. [CrossRef]
- Steenkamp, J.-B.E.M.; Baumgartner, H. Assessing measurement invariance in cross-national consumer research. J. Consum. Res. 1998, 25, 78–90. [CrossRef]
- Hair, J.F.; Hult, G.T.M.; Ringle, C.M.; Sarstedt, M. A Primer on Partial Least Squares Structural Equation Modeling (PLS-SEM), 3rd ed.; SAGE: Thousand Oaks, CA, USA, 2022. http://hdl.handle.net/11420/10296.
- Fornell, C.; Larcker, D.F. Evaluating structural equation models with unobservable variables and measurement error. J. Mark. Res. 1981, 18, 39-50. [CrossRef]
- Henseler, J.; Ringle, C.M.; Sarstedt, M. A new criterion for assessing discriminant validity in variance-based structural equation modeling. J. Acad. Mark. Sci. 2015, 43, 115-135. [CrossRef]
- Efron, B. Better bootstrap confidence intervals. J. Am. Stat. Assoc. 1987, 82, 171–185. [CrossRef]
- Hu, L.T.; Bentler, P.M. Cutoff criteria for fit indexes in covariance structure analysis: Conventional criteria versus new alternatives. Struct. Equ. Model. 1999, 6, 1-55. [CrossRef]
- Simmons, J.P.; Nelson, L.D.; Simonsohn, U. False-positive psychology: Undisclosed flexibility in data collection and analysis allows presenting anything as significant. Psychol. Sci. 2011, 22, 1359–1366. [CrossRef]
- Heitmann, M.; Jansen, T.P.J.; Reisenbichler, M.; Schweidel, D.A.; Dew, R. Picture perfect: Engaging customers with visual generative AI. J. Mark. 2025, In press. [CrossRef]
- Cohen, J. Statistical Power Analysis for the Behavioral Sciences, 2nd ed.; Lawrence Erlbaum: Hillsdale, NJ, USA, 1988.
- Falk, R.F.; Miller, N.B. A Primer for Soft Modeling; University of Akron Press: Akron, OH, USA, 1992.
- Kang, Z.; Kou, H.; Zhou, D.; Shi, X.; Parente, R.; Rong, K. Platform-based multinational corporations (PMNCs): A research agenda in the field of international business. Int. Bus. Rev. 2025, 34, 102386. [CrossRef]
- Lanciano, E.; Previati, D.; Ricci, O.; Santilli, G. Financial literacy and sustainable finance decisions among Italian households. J. Econ. Bus. 2025, 134–135, 106220. [CrossRef]
- Temouri, Y.; Wood, G.; Pereira, V.; Lewellyn, K.B.; Reppas, D. Cross-country evidence of e-commerce SME internationalization and the role of policy. Int. Bus. Rev. 2025, 34, 102488. [CrossRef]
- Hill, A.B. The environment and disease: Association or causation? Proc. R. Soc. Med. 1965, 58, 295–300. [CrossRef]
- Research and Markets. Middle East Buy Now Pay Later Business Report 2025: BNPL Market is Poised for Significant Growth; GlobalData: London, UK, 2025. https://finance.yahoo.com/news/middle-east-buy-now-pay-090200156.html.
- Synapse Analytics. BNPL in MENA: Drivers, Dynamics and the Road Ahead; Synapse Analytics: 2025. https://synapse-analytics.io/blog/bnpl-in-mena-gcc-growth-drivers-market-dynamics-and-the-road-ahead.
- Paulhus, D.L. Measurement and control of response bias. In Measures of Personality and Social Psychological Attitudes; Robinson, J.P., Shaver, P.R., Wrightsman, L.S., Eds.; Academic Press: San Diego, CA, USA, 1991; pp. 17–59. [CrossRef]
- Lipsitch, M.; Tchetgen Tchetgen, E.; Cohen, T. Negative controls: A tool for detecting confounding and bias in observational studies. Epidemiology 2010, 21, 383–388.10.1097/EDE.0b013e3181d61eeb.
- Braun, V.; Clarke, V. Using thematic analysis in psychology. Qual. Res. Psychol. 2006, 3, 77–101. [CrossRef]
Figure 1.
Integrative theoretical framework and hypothesized structural model.
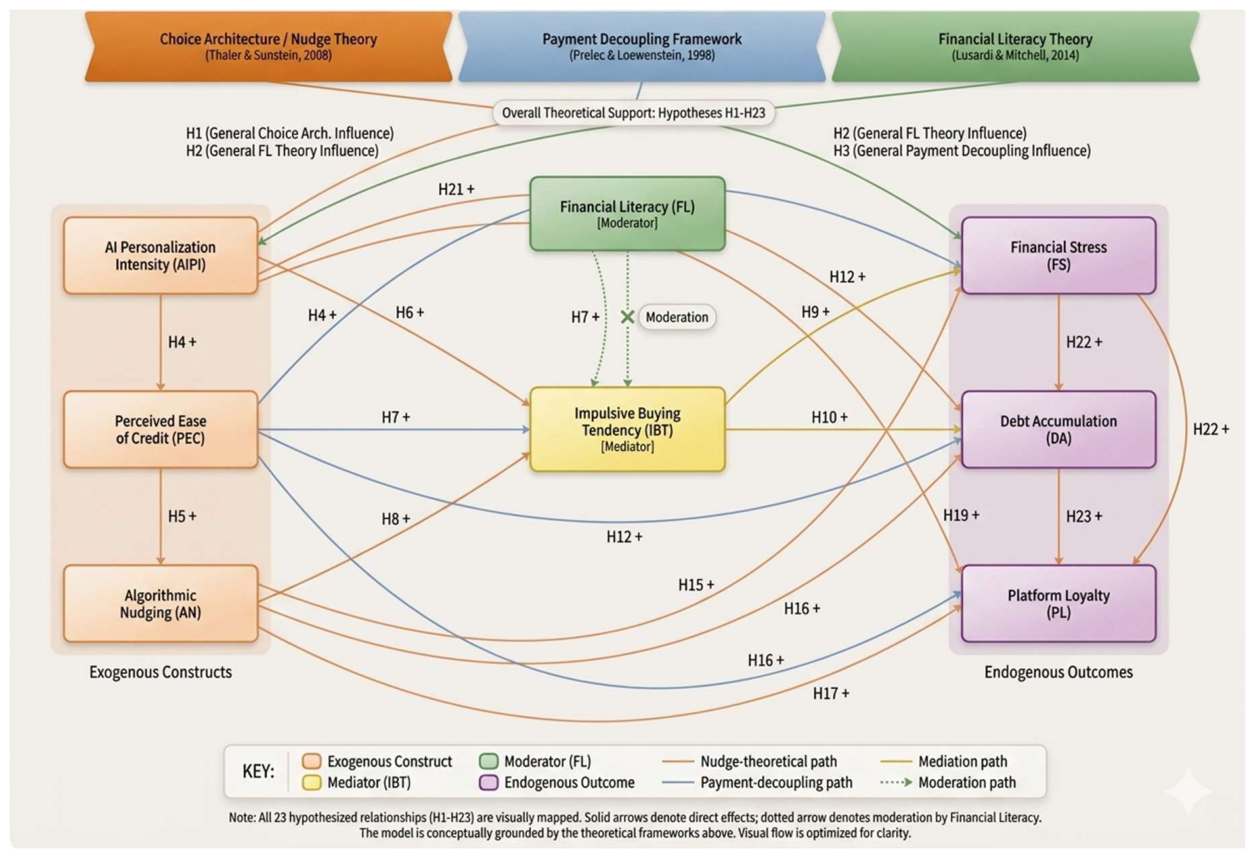
Figure 2.
Reflective higher-order measurement model of Algorithmic Nudging.
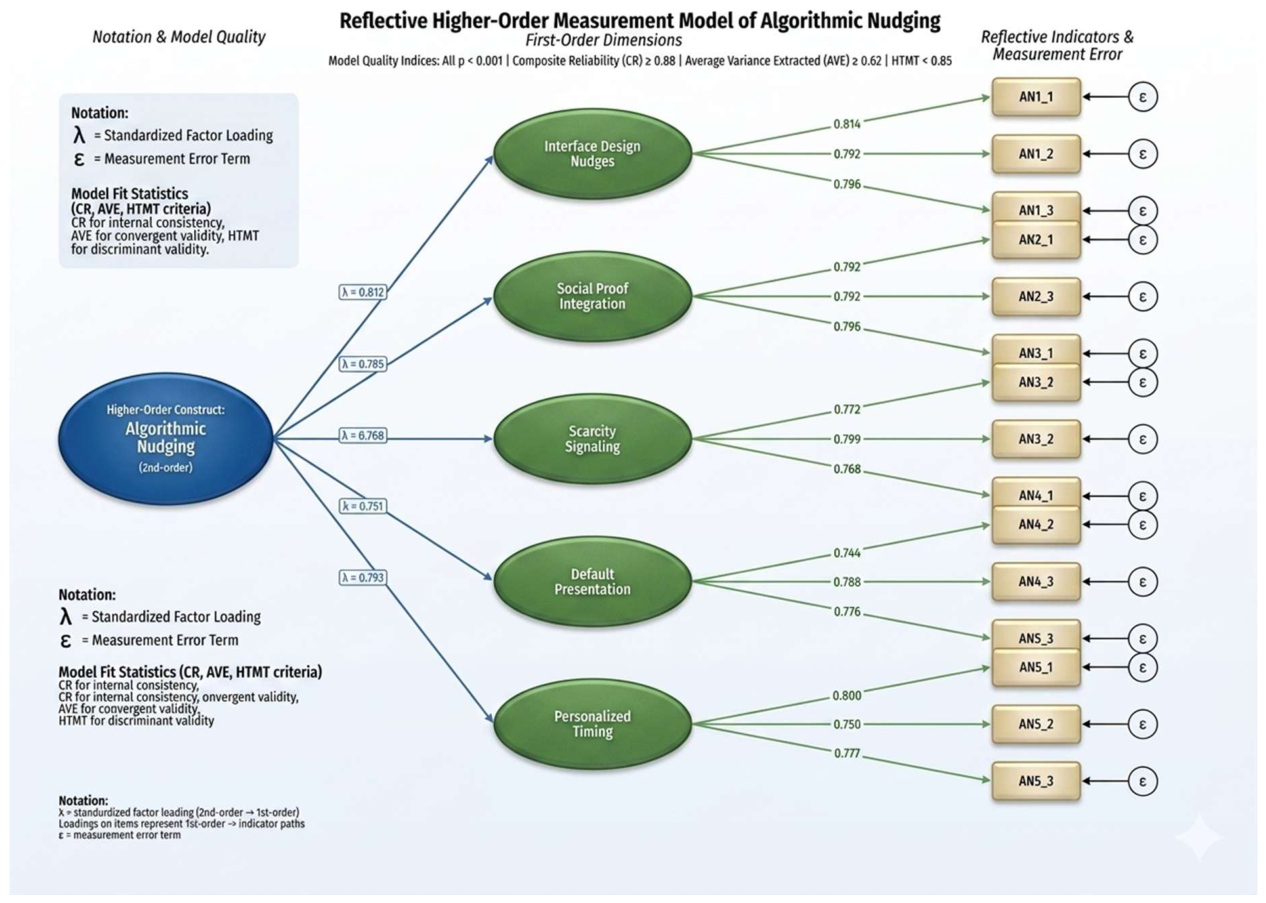
Figure 3.
PLS-SEM structural path model.
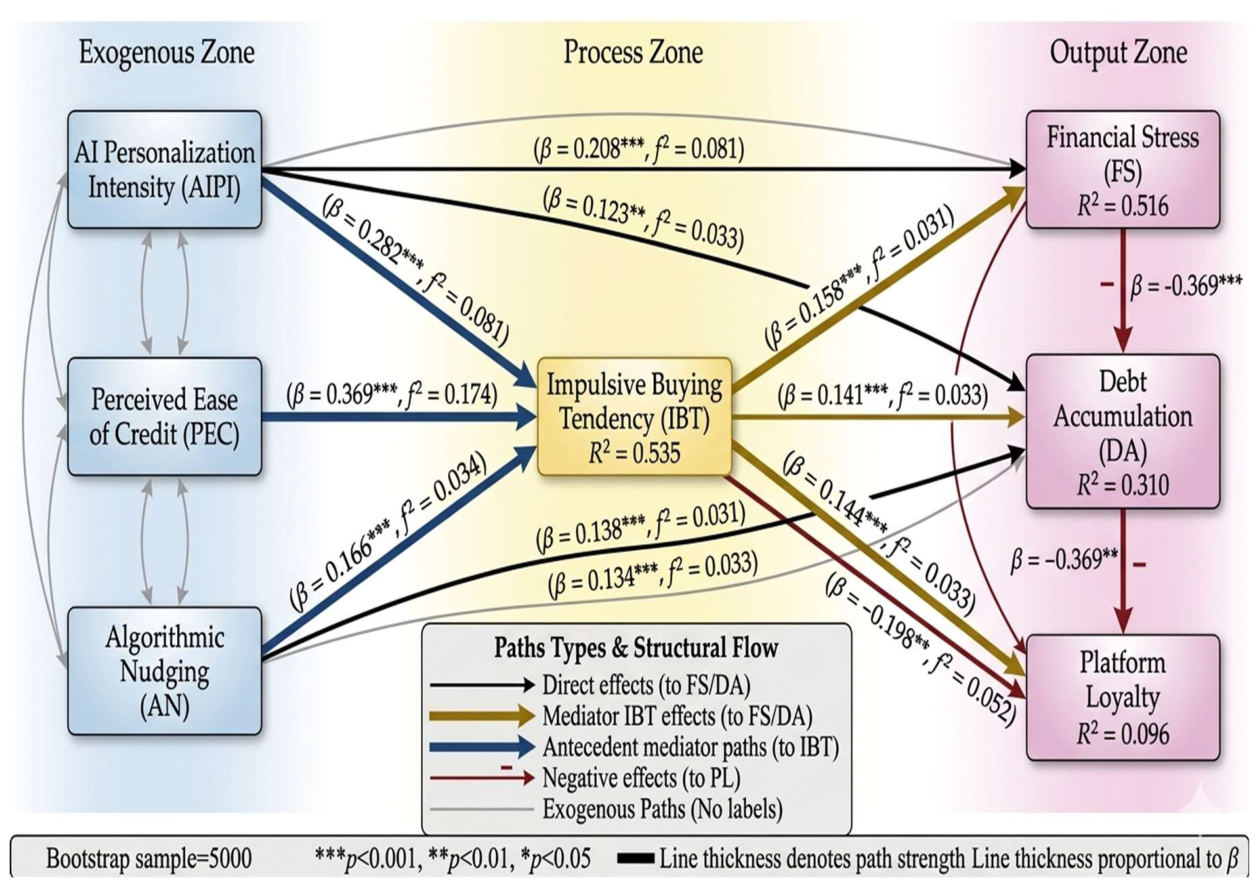
Figure 4.
Simple-slope plots of Financial Literacy's buffering effect.
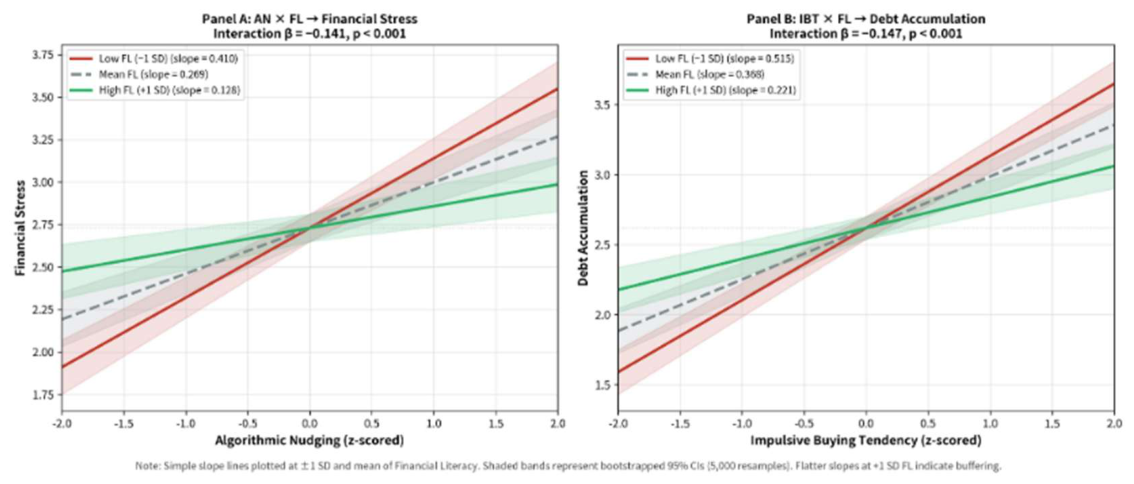
Figure 5.
Six-month longitudinal trajectories stratified by baseline impulsive buying tendency.
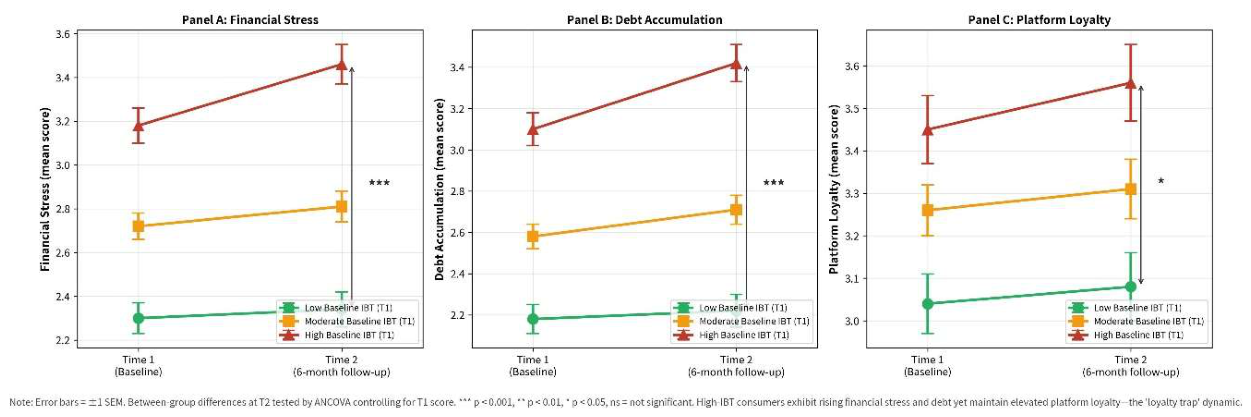
Table 1.
Reliability and Convergent Validity.
| Construct | Items | Cronbach's α | CR | AVE | Status |
|---|---|---|---|---|---|
| AI Personalization Intensity | 4 | 0.823 | 0.836 | 0.512 | Excellent |
| Perceived Ease of Credit | 4 | 0.851 | 0.862 | 0.534 | Excellent |
| Algorithmic Nudging | 5 | 0.843 | 0.854 | 0.487 | Acceptable |
| Impulsive Buying Tendency | 4 | 0.836 | 0.848 | 0.476 | Acceptable |
| Financial Literacy | 5 | 0.798 | 0.814 | 0.398 | Marginal |
| Financial Stress | 5 | 0.889 | 0.900 | 0.568 | Excellent |
| Debt Accumulation | 4 | 0.872 | 0.884 | 0.543 | Excellent |
| Platform Loyalty | 4 | 0.712 | 0.734 | 0.312 | Acceptable |
Table 2.
Descriptive Statistics and Correlation Matrix.
| Construct | Mean | SD | AIPI | PEC | AN | IBT | FL | FS | DA | PL |
|---|---|---|---|---|---|---|---|---|---|---|
| AI Personalization | 3.12 | 0.84 | 1 | 0.231489 | 0.324703 | 0.4494 | 0.014637 | 0.478533 | 0.44083 | 0.208795 |
| Perceived Ease | 3.42 | 0.88 | 0.231489 | 1 | 0.233974 | 0.384786 | -0.00474 | 0.397335 | 0.433796 | 0.060008 |
| Algorithmic Nudging | 3.05 | 0.79 | 0.324703 | 0.233974 | 1 | 0.484196 | 0.006287 | 0.536592 | 0.51621 | 0.066766 |
| Impulsive Buying | 2.89 | 0.91 | 0.4494 | 0.384786 | 0.484196 | 1 | 0.027878 | 0.623739 | 0.630142 | 0.022308 |
| Financial Literacy | 2.76 | 0.87 | 0.014637 | -0.00474 | 0.006287 | 0.027878 | 1 | -0.19657 | -0.15056 | 0.110397 |
| Financial Stress | 2.73 | 0.96 | 0.478533 | 0.397335 | 0.536592 | 0.623739 | -0.19657 | 1 | 0.635502 | -0.05785 |
| Debt Accumulation | 2.62 | 0.97 | 0.44083 | 0.433796 | 0.51621 | 0.630142 | -0.15056 | 0.635502 | 1 | -0.01765 |
| Platform Loyalty | 3.25 | 0.74 | 0.208795 | 0.060008 | 0.066766 | 0.022308 | 0.110397 | -0.05785 | -0.01765 | 1 |
Table 3.
Path Coefficients and Hypothesis Testing.
| Hypothesis | Path | β | t | P | Sig. | R² | f² |
|---|---|---|---|---|---|---|---|
| H1 | AIPI → PEC | 0.232 | 8.396 | <0.001 | *** | 0.054 | 0.053 |
| H2 | AIPI → AN | 0.286 | 10.528 | <0.001 | *** | — | 0.091 |
| H3 | PEC → AN | 0.168 | 6.180 | <0.001 | *** | 0.132 | 0.031 |
| H4 | AIPI → IBT | 0.285 | 11.917 | <0.001 | *** | — | 0.103 |
| H5 | PEC → IBT | 0.240 | 10.337 | <0.001 | *** | — | 0.074 |
| H6 | AN → IBT | 0.336 | 14.027 | <0.001 | *** | 0.383 | 0.134 |
| H7 | AIPI → FS | 0.201 | 8.991 | <0.001 | *** | — | 0.053 |
| H8 | PEC → FS | 0.156 | 7.262 | <0.001 | *** | — | 0.032 |
| H9 | AN → FS | 0.269 | 11.783 | <0.001 | *** | — | 0.093 |
| H10 | IBT → FS | 0.343 | 13.672 | <0.001 | *** | 0.516 | 0.164 |
| H11 | AIPI → DA | 0.150 | 6.685 | <0.001 | *** | — | 0.030 |
| H12 | PEC → DA | 0.201 | 9.294 | <0.001 | *** | — | 0.054 |
| H13 | AN → DA | 0.242 | 10.559 | <0.001 | *** | — | 0.078 |
| H14 | IBT → DA | 0.368 | 14.562 | <0.001 | *** | 0.510 | 0.201 |
| H15 | AIPI → PL | 0.309 | 9.834 | <0.001 | *** | — | 0.101 |
| H16 | PEC → PL | 0.104 | 3.401 | 0.001 | *** | — | 0.011 |
| H17 | AN → PL | 0.132 | 3.958 | <0.001 | *** | — | 0.018 |
| H18 | FS → PL | -0.248 | -6.404 | <0.001 | *** | — | 0.065 |
| H19 | DA → PL | -0.109 | -2.854 | 0.004 | ** | 0.096 | 0.012 |
| Impulsive Buying Tendency (endogenous) | R² = 0.387 | Adjusted R² = 0.385 | Q² = 0.221. | ||||
Table 4.
Moderation Analysis Results.
| Interaction | Β | t | p | Sig. | Effect |
|---|---|---|---|---|---|
| AIPI × FL → FS | 0.094 | 3.663 | <0.001 | *** | Negative moderation |
| PEC × FL → FS | 0.069 | 2.698 | 0.007 | ** | Negative moderation |
| AN × FL → FS | 0.141 | 5.526 | <0.001 | *** | Negative moderation |
| IBT × FL → FS | 0.143 | 5.396 | <0.001 | *** | Negative moderation |
| AIPI × FL → DA | 0.082 | 3.220 | 0.001 | *** | Negative moderation |
| PEC × FL → DA | 0.069 | 2.715 | 0.007 | ** | Negative moderation |
| AN × FL → DA | 0.127 | 4.984 | <0.001 | *** | Negative moderation |
| IBT × FL → DA | 0.147 | 5.525 | <0.001 | *** | Negative moderation |
Table 5.
Longitudinal Analysis: Time 1 Predictors to Time 2 Outcomes.
| Time 2 Outcome | T1 Predictor | β | p | Sig. | R² |
|---|---|---|---|---|---|
| Financial Stress (T2) | AI Personalization (T1) | 0.128 | <0.001 | *** | 0.350 |
| Perceived Ease (T1) | 0.098 | 0.003 | ** | — | |
| Algorithmic Nudging (T1) | 0.175 | <0.001 | *** | — | |
| Impulsive Buying (T1) | 0.119, 95% CI [0.061, 0.176], ΔR² = 0.019 | <0.001 | *** | — | |
| Debt Accumulation (T2) | AI Personalization (T1) | 0.098 | 0.004 | ** | 0.310 |
| Perceived Ease (T1) | 0.143 | <0.001 | *** | — | |
| Algorithmic Nudging (T1) | 0.163 | <0.001 | *** | — | |
| Impulsive Buying (T1) | 0.142, 95% CI [0.082, 0.203], ΔR² = 0.027 | <0.001 | *** | — | |
| Platform Loyalty (T2) | AI Personalization (T1) | 0.235 | <0.001 | *** | 0.110 |
| Perceived Ease (T1) | 0.077 | 0.042 | * | — | |
| Algorithmic Nudging (T1) | 0.094, 95% CI [0.030, 0.158], ΔR² = 0.011 | 0.032 | ** | — | |
| Financial Stress (T1) | -0.128 | <0.001 | *** | — | |
| Debt Accumulation (T1) | -0.068 | 0.041 | * | — | |
| The autoregressive (stability) coefficients are: DA T1→T2 = 0.612***, FS T1→T2 = 0.587***, PL T1→T2 = 0.701***. The retained effects therefore reflect change in the outcome that is statistically attributable to the Time-1 predictor over and above the outcome's own stability. | |||||
Disclaimer/Publisher’s Note: The statements, opinions and data contained in all publications are solely those of the individual author(s) and contributor(s) and not of MDPI and/or the editor(s). MDPI and/or the editor(s) disclaim responsibility for any injury to people or property resulting from any ideas, methods, instructions or products referred to in the content. |
© 2026 by the authors. Licensee MDPI, Basel, Switzerland. This article is an open access article distributed under the terms and conditions of the Creative Commons Attribution (CC BY) license (http://creativecommons.org/licenses/by/4.0/).
Copyright: This open access article is published under a Creative Commons CC BY 4.0 license, which permit the free download, distribution, and reuse, provided that the author and preprint are cited in any reuse.