

Submitted:
26 May 2026
Posted:
26 May 2026
You are already at the latest version
Abstract
To mitigate compression heat loss during the operation of compressed air energy storage(CAES) power stations, this study proposed a design that coupled a CAES system with a heat pump system for high-temperature steam production. Focusing on waste heat utilization in a 100 MW CAES system, a tiered compression heat utilization strategy was adopted: part of the compression heat serves as a reheating source for the energy storage system’s expansion stage, while the remainder acts as a low-grade heat source for the heat pump steam generation system. This approach effectively enhances the comprehensive energy utilization efficiency of the system.
Research findings demonstrated that the novel waste heat utilization system integrating a modified CAES system with a heat pump can convert 11.64 MW of secondary low-grade compressed heat into high-temperature steam. Under specific feedwater parameters(eg.,flow rate, pressure, and temperature), the system generated steam with matched operating conditions, while the heat pump subsystem achieves a Coefficient of Performance(COP) of 1.55. Analysis of variable operating conditions revealed that when the heat load of the flash-high/low-temperature regenerators remained constant, both the steam flow rate and flash rate increased with rising feedwater temperature and decreased with increasing feedwater flow rate. Furthermore, higher the feedwater flow rates combined with the lower feedwater temperature yield higher the steam temperature, peaking at 314.02 °C under optimal operating parameters; Environmental analysis indicated that the system produced substantial high-temperature steam during annual operation, achieving significant reductions in multiple pollutants emissions compared to coal-fired industrial boilers and thus providing a valuable technical reference for relevant fields.
Keywords:
non-combustion CAES
; high-temperature heat pump
; industrial steam production
; waste heat utilization
; thermodynamic analysis
1. Introduction
With the gradual depletion of traditional non-renewable energy sources, such as coal, the transformation of the global energy structure has becoming imperative, with the energy utilization paradigm shifting toward low-carbon and clean energy alternatives. As highlighted in the Global Energy Review 2025 by the International Energy Agency (IEA), global energy demand rose in 2024, with its growth rate significantly outpaced the 2013-2023 average[1,2]. Driven by the rapid development of diverse industries such as refrigeration, industrial power consumption, and artificial intelligence, the growth rate of electricity demand has doubled that of total energy demand, while the demand for renewable energy sources (eg., solar and wind power) continues to expand [3,4,5].
While renewable energy sources show promising growth trajectories and prospects, their intermittent characteristics poses a significant challenge to stable grid integration and energy utilization. Energy storage systems offer a solution by storing surplus energy during off-peak periods for peak-demand deployment[6,7,8,9,10]. CAES has garnered significant traction for its large capacity, excellent environmental benignity, versatile applications and high safety. The world's first commercialized combustion CAES power plant was the Huntorf Power Station in Germany, constructed in 1978. With technological advancements, non-combustion CAES power plants have also entered commercial operation [11,12,13,14,15].
However, waste heat is inevitably generated during the operation of CAES systems. Typically, the waste heat is discharged directly into the atmosphere through coolers leading to considerable energy wastage. Extensive in-depth research on the utilization of the waste heat has been carried out by domestic and international researchers. Chen et al. [16] harnessed the waste heat from combustion-based CAES and adopted an Organic Rankine cycle(ORC) for heat utilization. By comparing the efficiencies of series and parallel ORCs, they concluded that the optimally design could enhance the cycle efficiency of CAES by 4% relative to the scenario without waste heat recovery. Similarly, Ge et al. [17] adopted the ORC for CAES waste heat utilization and investigated the heat loss distribution characteristics in a dual-pressure evaporation ORC. The findings indicated that using a parallel dual-pressure evaporation ORC with R1234yf as the working fluid achieved the maximum waste heat conversion efficiency of 9.3%. Zhong et al. [18] integrated thermochemical energy storage with CAES, utilizing compression heat to decompose methanol into syngas, which converted thermal energy into chemical energy and realized the hybrid storage of physical and chemical energy simultaneously. During the discharge phase, both stored energy were converted into electrical energy. After optimization, the system achieved an overall efficiency of 65.89%. To address the waste of compression heat during the compression process and the requirement for additional heat in methanol cracking for hydrogen production, Zhang et al. [19] proposed a combined model integrating methanol cracking, CAES, and electrolytic hydrogen production which utilized compression heat to preheat methanol, while carbon monoxide generated from methanol cracking is adopted to supplement the energy release module of CAES system. The system efficiency can reach 80.94%. Xue et al. [20] proposed a novel design integrating CAES with a biomass integrated gasification combined cycle (BIGCC) system. By supplying compression heat to the BIGCC system, the integrated CAES system achieved an efficiency of 64.28%, with an overall system efficiency improvement of 0.35%.
Most existing studies focus on the power-side utilization of waste heat from compressed air energy storage (CAES), aiming to improve the electricity-to-electricity conversion efficiency of the system, while neglecting the substantial low-carbon demand for high-parameter steam in the industrial sector. Industrial coal-fired boilers are the primary sources of industrial carbon emissions and pollutant emissions in China. Upgrading the low-grade compression heat of CAES to industrial steam via high-temperature heat pumps not only addresses the problem of waste heat dissipation in CAES systems but also enables the low-carbon supply of industrial steam. However, systematic research in this direction is still insufficient at present.
This study focused on the waste heat utilization of non-combustion CAES. Its innovation lies in the cascaded utilization of compression heat during the CAES process, aiming to maximize energy utilization efficiency. Specifically, an integrated system combining the graded utilization of compression heat from non-supplementary fired CAES with high-temperature heat pumps for industrial steam production is proposed, which realizes the high-value utilization of 11.64 MW low-grade compression heat. A thermodynamic simulation model of the integrated system is established, the coupling influence laws of key feedwater parameters on the steam production performance are revealed, and the optimal operating conditions of the system are further obtained. Additionally, the annual environmental benefits of the system are quantified, providing theoretical support and technical reference for the engineering application of multi-energy combined supply based on CAES systems. The research primarily adopted system modeling and thermodynamic simulation methods for system analysis.
2. System Introduction and Design
2.1. System Introduction
The process flow of a traditional non-combustion CAES power station was illustrated in Figure 1. Compared with combustion-based CAES power stations, non-combustion CAES operates independently of fossil fuels and demonstrates superior compatibility with renewable energy sources, aligning with the goals of clean and environmentally friendly energy utilization. The system operates primarily in two stages: energy storage and the energy release. During the energy storage stage, surplus electricity from the grid drives compressors to produce high-pressure air for storage. Concurrently, the compression heat generated is recovered and stored. Conversely, the energy release stage occurs during peak electricity demand periods. The high-pressure air released from the storage tank are preheated by the previously stored compression heat. Subsequently, the heated gas enters an expansion turbine to undergo expansion and drive power generation, thereby completing the entire cycle [21,22,23].
During the energy storage stage, heat exchange processes are typically conducted in a staged manner. This approach not only ensures precise control over the temperature of the compressed gas during heat exchange but also mitigates corrosion caused by prolonged exposure to high temperatures. In the storage and heat exchange process, the heat exchange fluids are generally selected as follows:
Thermal oil/molten salt + deionized water (for temperatures above 300°C)
High-pressure deionized water + deionized water (for temperatures below 300°C).
The heat load stored in thermal oil or high-pressure deionized water is utilized to reheat the air during the energy release stage. In contrast, the heat load carried by deionized water is typically dissipated through cooling towers, with the heat released into the atmospheric environment [24,25].
A heat pump system upgrades low-grade heat sources into high-grade ones with minimal energy input. It operates through four primary processes: evaporation (heat absorption), compression (temperature and pressure rise), condensation (heat release), and expansion (pressure reduction). The steam generation process via a heat pump is illustrated in Figure 2. Specifically, high-pressure feedwater at ambient temperature first undergoes primary heating, then enters a flash tank to generate flash steam. Following secondary heat exchange, the steam is reheated to produce high-temperature steam. Currently, the working fluids used in heat pump systems typically include chlorofluorocarbons (CFCs), hydrofluorocarbons (HFCs), carbon dioxide (CO2), and others. Among these, CO2 has garnered significant attention from researchers owing to its favorable characteristics of low ozone depletion potential (ODP) and low global warming potential (GWP) [26,27,28].
In the energy storage stage of a CAES system, the waste heat released into the atmosphere through the secondary heat exchanger results in a significant thermal loss. To address this issue, this study proposes an integrated system which incorporates a heat pump to recover and reuse this waste heat. Specifically, the low-grade thermal energy from the secondary heat exchanger is utilized as the heat source for the heat pump system. The detailed process flow diagram of the proposed integrated system is presented in Figure 3.
2.2. Thermodynamic Modeling
Based on a 100 MW non-combustion CAES power station from an actual project, this study adopts an energy storage duration of 6 hours and an energy release duration of 4 hours. The key parameters of the CAES power station are presented in Table 1. The system adopts multi-stage compression and multi-stage expansion technologies, with demineralized water as the heat storage medium for the staged utilization of compression heat. Specifically, the primary heat storage is used as the reheating heat source for high-pressure air before entering the expander, while the secondary heat storage serves as the low-grade heat source for steam generation via the heat pump. Thermodynamic analysis indicates that the total thermal load of the secondary heat storage amounts to 11.64 MW.
In this study, the system is modeled using Aspen thermal simulation software. The working fluid of the heat pump system is CO₂, the REFPROP property equation is adopted, and the IAPWS-IF97 property equation is used for the part involving the simulation of water and water vapor. Based on the investigations and analysis of various power equipment manufacturers, under the flow rate level considered in this study, the polytropic efficiency and mechanical efficiency of the compressor are 0.785 and 0.98, respectively. The isentropic efficiency and mechanical efficiency of the expander are 0.8 and 0.98, respectively. The pressure drop of the heat exchanger is set to 0.2 bar, while the pressure drop in the pipelines is neglected.
In terms of steam generation, the specifications of the generated steam are at a temperature of 311.5 ℃ and a pressure of 4 bar, with the feedwater supplied at 20 ℃ and 60 bar. The technical parameters at each state are presented in Table 2.
The main power equipment involved includes compressors and expanders, with the relevant calculation formulas provided as follows.
For a unit mass of working fluid, the polytropic compression work of the compressor is expressed as follows:
When the mass flow rate is m, the total polytropic compression work is given by:
When accounting for polytropic efficiency, the shaft power is expressed as:
where n denotes the polytropic exponent, R represents the gas constant, T1 stands for the temperature of the working fluid at the compressor inlet with the unit of ℃; P1 and P2 indicate the absolute pressures at the inlet and outlet, respectively; m is the mass flow rate of the working fluid; and ηc signifies the polytropic efficiency.
For a unit mass of working fluid, the isentropic expansion work of the expander is expressed as:
When the mass flow rate is m, the total isentropic expansion work is given by:
When considering the isentropic efficiency of the expander, the shaft power is expressed as:
where K denotes the specific heat ratio of the working fluid, T1 represents the temperature of the working fluid at the expander inlet, and ηt signifies the isentropic efficiency of the expander.
The calculation related to the heat load of the heat exchanger is as follows:
where mh denotes the mass flow rate of the hot fluid, cp,h represents the specific heat capacity at constant pressure of the hot fluid, and Th,in and Th,out indicate the inlet and outlet temperatures of the hot fluid, respectively.
Coefficient of Performance (COP) is a key indicator for measuring energy conversion efficiency, and its calculation formula is as follows:
where Q denotes the heating power released by the heat pump to the high-temperature heat source, and W represents the net input work of the system.
The calculated results are summarized as follows:
- Equipment power
the shaft power of compressor and the expander are 23.33 MW and 2.99 MW, respectively.
- Heat exchanger loads
The regenerator exchangers heat load is 11.24 MW.
The flash-high temperature regenerator and flash-low temperature regenerator exhibit heat loads of 3.2 MW and 28.32 MW, respectively.
- Key system performance parameters
The total heating power is 31.52 MW.
The total input power of the system is 20.34 MW.
The corresponding COP is 1.55.
3. Thermodynamic Analysis
Based on the foregoing analysis, when the feedwater is supplied at 20℃ and 60 bar with the mass flow rate of 17 kg/s, thermodynamic calculations show that, to achieve a steam pressure of 4 bar, the resulting steam mass flow rate is 9.13 kg/s at a temperature of 311.5℃. The flash evaporation rate is 0.537, and yielding a liquid-water flow rate of 7.87 kg/s after flashing. To enable the liquid water after flash evaporation re-enter the flash evaporation system, the feedwater pump is required to deliver water at a pressure of 60 bar. According to the investigation of working fluid pump manufacturers, the efficiency of pumps of the same grade is 0.8, corresponding to a power consumption of 62.71 kW.
To investigate the impact of cooling water supply characteristics on steam generation, this study examines the influences of different feedwater temperatures and feedwater flow rates on steam quality without considering the capital costs of various equipment used in the flash-evaporation process.
3.1. The Influence of Feedwater Temperature on Steam Quality
This section investigates the influence of feedwater temperatures on steam quality. The specific parameters are set as follows: the feedwater mass flow rate is kept constant at 17 kg/s; the heat loads of the flash-high temperature regenerator and flash-low temperature regenerator are 3.2 MW and 28.32 MW, respectively; the feedwater pressure is 60 bar; and the steam outlet pressure is maintained at 4 bar. The variation in temperatures of the generated steam are presented in Figure 4.
As shown in Figure 4, the temperature of the generated steam is 314.02 ℃ at a feedwater temperature of 16 ℃, and decreases to 309.05 ℃ when the feedwater temperature rises to 24 ℃. This indicates a clear negative correlation between the temperature of the generated steam and the feedwater temperature.
Furthermore, variations in feedwater temperature also influence the vapor fraction after the first-stage heat exchange in the flash-low temperature regenerator. As illustrated in Figure 5, the vapor fraction rises from 0.529 to 0.545 as the feedwater inlet temperature increases from 16 ℃ to 24 ℃, indicating a continuous positive correlation between vapor fraction and feedwater temperature.
The variations of the generated steam flow rate, flash evaporation rate, and power consumption of the working fluid pump with temperature are presented in Figure 6. For example, at a feedwater temperature is of ℃, the final generated steam flow rate is 9 kg/s, the flash evaporation ratio is 0.529, and the flow rate of liquid water after flash evaporation is 8 kg/s, requiring a power consumption of 63.77 MW to maintain the feedwater pressure at 60 bar. As seen from Figure 6, both the final generated steam flow rate and the flash evaporation ratio increase with the rise of the feedwater temperature, which can be explained as following: as the feedwater temperature increases, the vapor fraction after passing through the flash-low temperature regenerator rises, which leads to an increase in the amount of steam generated by flash evaporation. Under a fixed heat exchange load, the temperature after passing through the flash-high temperature regenerator decreases. With the inlet feedwater flow rate remaining constant, the increase in steam flow rate is accompanied by a reduction in the flow rate of liquid water after flashing, ultimately lowing the power consumption of the working fluid pump.
3.2. The Influence of Feedwater Flow on Steam Quality
The feedwater flow rate also influences the quality of the steam produced. Under the constant conditions of a feedwater temperature at 20 °C, pressure at 60 bar, steam outlet pressure of 4 bar, and the thermal loads of both the flash-high-temperature reheater and the flash-low-temperature reheaters, the influence of various feedwater flow rates on the steam temperature is shown in Figure 7. Specifically, at a feedwater flow rate of 11 kg/s the steam temperature is 287.78 °C, whereas at 19 kg/s it increases to 321.19 °C. As can be seen, the steam temperature rises with an increase in feedwater flow rate.
The influence of the feedwater flow rate on the vapor phase fraction after passing through the flash-low-temperature regenerator is illustrated in Figure 8, where the vapor phase fraction exhibits a decreasing trend with an increase in the feedwater flow rate. Furthermore, variations in the feedwater flow rate also exert an impact on the steam flow rate, flash rate, and power consumption of the working fluid pump.
As shown in Figure 9, the steam production gradually decreases with an increase in feedwater flow rate. Simultaneously , the mass of liquid water rises, leading to an increase in the power consumption of the working fluid pump. This behavior occurs because, under the condition that the thermal load of the two heat exchangers remains constant, after the feedwater passes through the flash-low-temperature reheater, the vapor phase ratio decreases, resulting in a reduction in the mass of the working fluid entering the flash-high-temperature reheater, while the flow rate of liquid water increases accordingly, ultimately causing an increase in the power consumption of the working fluid pump.
3.3. The Combined Effect of Feedwater Flow Rate and Feedwater Temperature on Steam Quality
From Sections 3.1 and 3.2, it is clear that the individual effects of feedwater flow rate and feedwater temperature on steam quality can be observed. However, the influence of their simultaneous variation on steam quality remains undetermined.
Figure 10 and Figure 11 illustrate the combined effects of feedwater flow rate , temperature on the flash ratio and the temperature of the generated steam. As shown in the figures, a lower feedwater flow rate coupled with a lower feedwater temperature increases the flash ratio. Conversely, a higher feedwater flow rate together with a lower temperature increases the steam temperature. For instance, at a feedwater flow rate of 11 kg/s and a feedwater temperature of 16 °C, the flash rate reaches 0.956, and the steam temperature is 288.99 °C. In contrast, at the feedwater flow rate of 17 kg/s and the feedwater temperature of 16 °C, the flash ratio decreases to 0.529 while the steam temperature rises to 314.02 °C.
3.4. The Influence of Feedwater Pressure on Steam Quality
This section discusses the effect of feedwater pressure on steam quality under constant feedwater flow rate and feedwater temperature. The corresponding trends are shown in Figure 12.
At a feedwater flow rate of 17 kg/s, a feedwater temperature of 20℃, and a feedwater pressure of 56 bar, the vapor fraction before entering the flash tank is 0.353. As the pressure increases to 64 bar, the vapor fraction decreases to 0.337. This occurs because different pressure conditions correspond to different saturated steam temperatures.
In addition, the influence of feedwater pressure on steam quality was evaluated, and the results are presented in Figure 13. Calculations indicate that, under constant feedwater flow rate and feedwater temperature, varying the feedwater pressure has no effect on steam quality. This is because varying the feed water pressure does not change the pressure or the state of the flashed steam.
4. Environmental Analysis
The heat pump steam generation system investigated in this paper provides dual advantages: it prevents the waste of residual heat during compressed air energy storage and eliminates the environmental pollution associated with traditional coal-fired steam generation. In this section, the environmental performance of the waste heat - utilizing heat pump system is analyzed by comparing it with coal-fired industrial steam generation systems of equivalent output. The calculation is based on the pollutant emissions of coal-fired units with the same steam production capacity [29,30,31].
The heat required for steam to reach the target state from the feedwater is
The amount of coal consumed to produce steam through industrial coal-fired boilers is
Where m represents the mass of water vapor, h represents the enthalpy value at the state point, Qnet,ar represents the calorific value of coal, and ηB represents the boiler efficiency.
The calorific value of typical industrial coal ranges from 20,000 to 25,000 kJ/kg in practice. For this study, a value of 25,000 kJ/kg was adopted for calculations, with the boiler operating at an efficiency of 0.85, running 6 hours per day for 300 days per year. Under these conditions, the annual production of high-temperature steam reaches 59162.4 tons, corresponding to a standard coal consumption of 8370.2 tons. The emission factors of standard coal are presented in Table 3, while the annual pollutant emissions are depicted in Figure 14.
The results show that the use of the heat pump system based on compressed air energy storage waste heat to produce high-temperature steam can reduce pollution emissions by 80.35 tons, SO2 by 5608.03 tons, CO2 by 5608.03 tons, and NOX by 130.28 tons.
5. Conclusions
This study investigates the utilization of waste heat from a 100 MW CAES system. A staged utilization strategy is implemented for the compressed heat: part of it is used as a reheating heat source for the expansion stage of the energy storage system, while the other part is used as a low-grade heat source for the heat pump steam preparation system. This waste heat utilization approach can effectively improve the comprehensive energy efficiency of the system. Based on this, the following conclusions are drawn:
- This study proposes a novel waste heat utilization system capable of upgrading 11.64 MW of secondary low-grade compressed heat into high-temperature steam. Under the operating conditions of a feedwater flow rate of 17 kg/s, a temperature of 20 °C, and a pressure of 60 bar, the system generates steam at a flow rate of 9.13 kg/s, a pressure of 4 bar, and a temperature of 311.5 °C, while the heat-pump subsystem achieves a coefficient of performance (COP) of 1.55.
- Under constant heat load in the flash-high temperature and flash-low temperature reheater, both the steam flow rate and flash ratio increase with an increase in feedwater temperature, but decrease with an increase in feedwater flow rate.
- The higher feedwater flow rates combined with lower feedwater temperature yield higher steam temperature of the produced steam. When the feedwater flow rate is 17 kg/s and the feedwater temperature is 16 °C, the steam temperature can reach 314.02 °C.
- Based on the operational schedule of the CAES power plant-6 hours of gas storage per day for 300 days per year, the system can produce 39,441.6 tons of high-temperature steam annually.
In this paper, a scheme for the recovery and utilization of compression heat in CAES systems is comprehensively evaluated through steady-state simulation. The results can provide a reference for the optimal design of compressed air energy storage power plants, as well as offering design concepts for the low-carbon utilization of waste heat to generate industrial steam. However, this study does not consider the dynamic operating characteristics under off-design conditions, start-stop cycles, and load fluctuations during actual operation, which leads to a certain discrepancy with real engineering scenarios.
Data Availability Statement
The original contributions presented in this study are included in the article material. Further inquiries can be directed to the corresponding author(s).
Conflicts of Interest
Authors Tianlin Zou and Jiajian Tan were employed by the company Shengu Group Co., Ltd. Author Guohui Wang was employed by the company CRRC Tangshan Co., Ltd. The remaining authors declare that the research was conducted in the absence of any commercial or financial relationships that could be construed as a potential conflict of interest.
References
- Deletombe, T.; Yu, H.; Geoffron, P. The insurance value of renewable energies. Energy Econ. 2025, 148, 108671. [Google Scholar] [CrossRef]
- Schischke, A.; Rathgeber, A. The impact of renewables on spillover effects in electricity markets. Appl. Energy 2025, 399, 126489. [Google Scholar] [CrossRef]
- Guo, S.; Zhang, X.; Wu, X.; et al. Wide-angle solar absorber using only titanium nitride for efficient solar photothermal utilization. Case Stud. Therm. Eng. 2025, 72, 106398. [Google Scholar] [CrossRef]
- Abdallah, R.; Juaidi, A.; Almomani, F.; et al. Assessing solar energy utilization for green hydrogen production: A technoeconomic and environmental assessment. Int. J. Hydrog. Energy 2025, 144, 522–535. [Google Scholar] [CrossRef]
- Inac, S.; Midilli, A. On geothermal and wind energy integrated methanol production by using green hydrogen. Energy 2025, 318, 134712. [Google Scholar] [CrossRef]
- Yong, Q.; Tian, Y.; Qian, X.; et al. Retrofitting coal-fired power plants for grid energy storage by coupling with thermal energy storage. Appl. Therm. Eng. 2022, 215, 119048. [Google Scholar] [CrossRef]
- Fu, Z.; Feng, L.; Han, Y.; et al. The active thermal energy storage regulation of combined cooling, heating, and power systems based on energy storage/release performance. Appl. Therm. Eng. 2024, 255, 123963. [Google Scholar] [CrossRef]
- Li, C.; Wang, X.; Li, J.; et al. Multi-constrained optimal control of energy storage combined thermal power participating in frequency regulation based on life model of energy storage. J. Energy Storage 2023, 73, 109050. [Google Scholar] [CrossRef]
- Yang, W.; Xia, W.; Zhang, Y.; et al. Effects of operational control conditions on the seasonal energy storage performance of borehole thermal energy storage (BTES) system. Case Stud. Therm. Eng. 2025, 73, 106609. [Google Scholar] [CrossRef]
- Feng, P.; Zeng, P.; Tang, Z.; et al. A distributionally collaborated planning of energy storage, transmission and distribution systems considering long-and short-term energy storage characteristics. J. Energy Storage 2025, 120, 116396. [Google Scholar] [CrossRef]
- Gouda, E.; Benaouicha, M.; Neu, T.; et al. Flow and heat transfer characteristics of air compression in a liquid piston for compressed air energy storage. Energy 2022, 254, 124305. [Google Scholar] [CrossRef]
- Ko, J.; Kim, S.; et al. Performance of a compressed-air energy storage pile under various operation conditions. J. Energy Storage 2023, 57, 106194. [Google Scholar] [CrossRef]
- Bu, X.; Huang, S.; Liu, S.; et al. Efficient utilization of abandoned mines for isobaric compressed air energy storage. 2024, 311, 133392. [Google Scholar] [CrossRef]
- Cui, S.; Chen, L.; Chen, S.; et al. Dynamic modeling and analysis of compressed air energy storage for multi-scenario regulation requirements. J. Energy Storage 2024, 100, 113227. [Google Scholar] [CrossRef]
- Xue, X.; Li, Y.; Liu, S.; et al. Performance analysis of a new compressed air energy storage system coupled with the municipal solid waste power generation systems. Energy 2024, 304, 132025. [Google Scholar] [CrossRef]
- Chen, X.; Li, J.; Zhang, Y.; et al. Design of optimal waste heat recovery system for compressed air energy storage considering various system layouts and working fluid types. Case Stud. Therm. Eng. 2025, 73, 106549. [Google Scholar] [CrossRef]
- Ge, Z.; Zhai, Y.; Li, J.; et al. Optimal dual-pressure evaporation organic Rankine cycle for recovering waste heat from compressed air energy storage(CAES). Case Stud. Therm. Eng. 2024, 6, 105160. [Google Scholar] [CrossRef]
- Zhong, L.; Yao, E.; Hu, Y.; et al. Thermo-economic analysis of a novel system integrating compressed air and thermochemical energy storage with solid oxide fuel cell-gas turbine. Energy Convers. Manag. 2022, 252, 115114. [Google Scholar] [CrossRef]
- Zhang, Y.; Wang, H.; Li, R.; et al. An electro-hydrogen cogeneration system combining compressed air energy storage and methanol cracking reaction. J. Energy Storage 2023, 58, 106351. [Google Scholar] [CrossRef]
- Xue, X.; Li, J.; Liu, J.; et al. Performance evaluation of a conceptual compressed air energy storage system coupled with a biomass integrated gasification combined cycle. Energy 2022, 247, 123442. [Google Scholar] [CrossRef]
- Guo, C.; Xu, Y.; Zhang, X.; et al. Performance analysis of compressed air energy storage systems considering dynamic characteristics of compressed air storage. Energy 2017, 135, 876–888. [Google Scholar] [CrossRef]
- Zhang, L.; Xie, M.; Ye, K.; et al. Compressed air energy storage based on variable-volume air storage: A review. J. Energy Storage 2025, 110, 115361. [Google Scholar] [CrossRef]
- He, Q.; Li, G.; Lu, C.; et al. A Compressed air energy storage system with variable pressure ratio and its operation control. Energy 2019, 169, 881–894. [Google Scholar] [CrossRef]
- Zhou, Q.; Du, D.; Lu, C.; et al. A review of thermal energy storage in compressed air energy storage system. Energy 2019, 188, 115993. [Google Scholar] [CrossRef]
- Huang, J.; Xu, Y.; Guo, H.; et al. Accurate self-scheduling model of adiabatic compressed air energy storage. J. Energy Storage 2024, 85, 110747. [Google Scholar] [CrossRef]
- Guo, Y.; Li, Y.; Li, W. On-site fault experiment and diagnosis research of the carbon dioxide transcritical heat pump system for energy saving. Energy 2023, 274, 127405. [Google Scholar] [CrossRef]
- Poulidis, L.; Prousalis, T.; Seferlis, P.; et al. Vapor absorption, compression and cascade heat pumps for carbon capture plants: Multi-criteria analysis and techno-economic assessment with different working fluids. Energy 2024, 306, 132433. [Google Scholar] [CrossRef]
- Koundinya, S.; Seshadri, S.; Hafner, A. Numerical investigation of high temperature heat pump integrated hybrid cooling system. J. Build. Eng. 2024, 98, 111037. [Google Scholar] [CrossRef]
- Li, G.; Qi, X.; Chan, K.; et al. Deep Bidirectional Learning Machine for Predicting NOX Emissions and Boiler Efficiency from a Coal-Fired Boiler. Energy Fuels 2017, 31, 11471–11480. [Google Scholar] [CrossRef]
- Chen, T.; Chen, J.; Liu, Z.; et al. Characteristics of PM and PAHs emitted from a coal-fired boiler and the efficiencies of its air pollution control devices. J. Air Waste Manag. Assoc. 2022, 72, 85–97. [Google Scholar] [CrossRef] [PubMed]
- Chen, T.; Deng, L.; Li, Y.; et al. Removal of multiple pollutants in air pollution control devices of a coal-fired boiler installed with a flue gas condensation scrubbe. J. Clean. Prod. 2024, 434, 139971. [Google Scholar] [CrossRef]
Figure 1.
Schematic diagram of the process system for a non-combustion CAES.
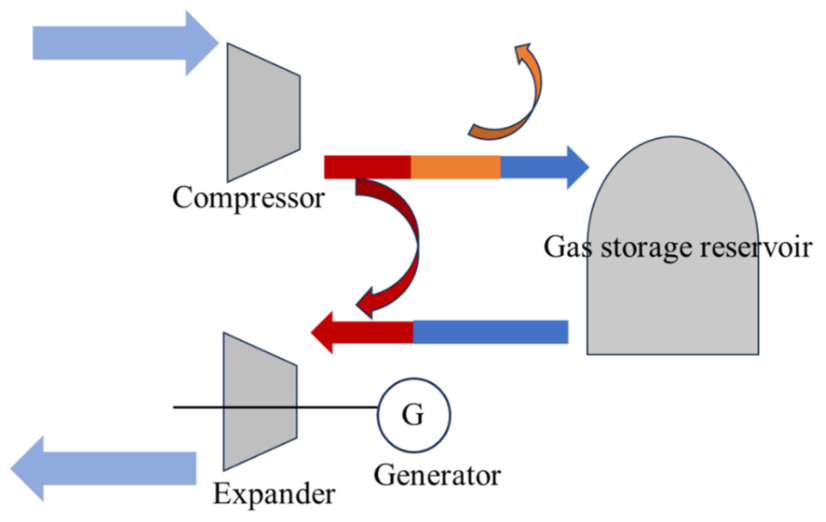
Figure 2.
Flowchart of High-Temperature Steam Generation Process via Heat Pump.
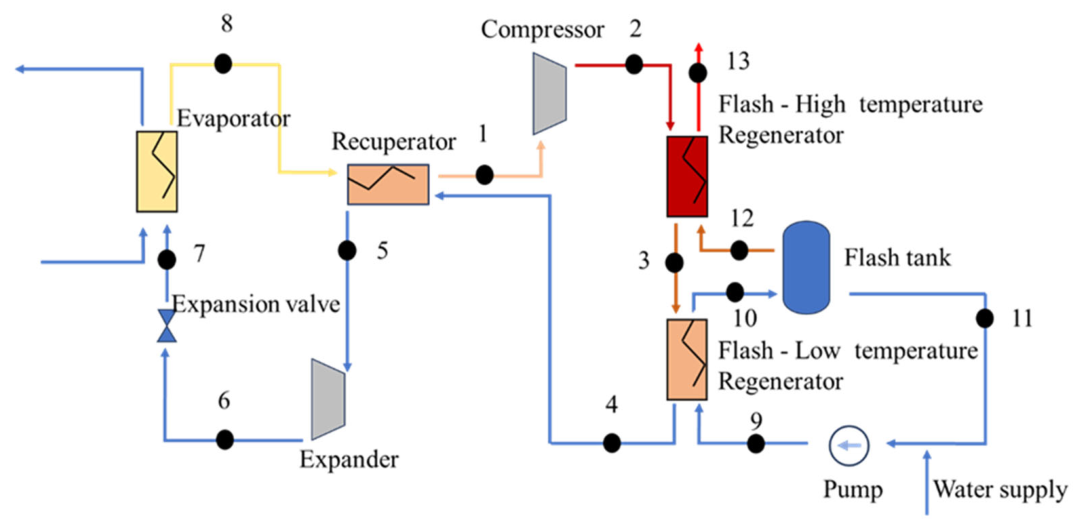
Figure 3.
Heat Pump Systems Based on Waste Heat Utilization in CAES.
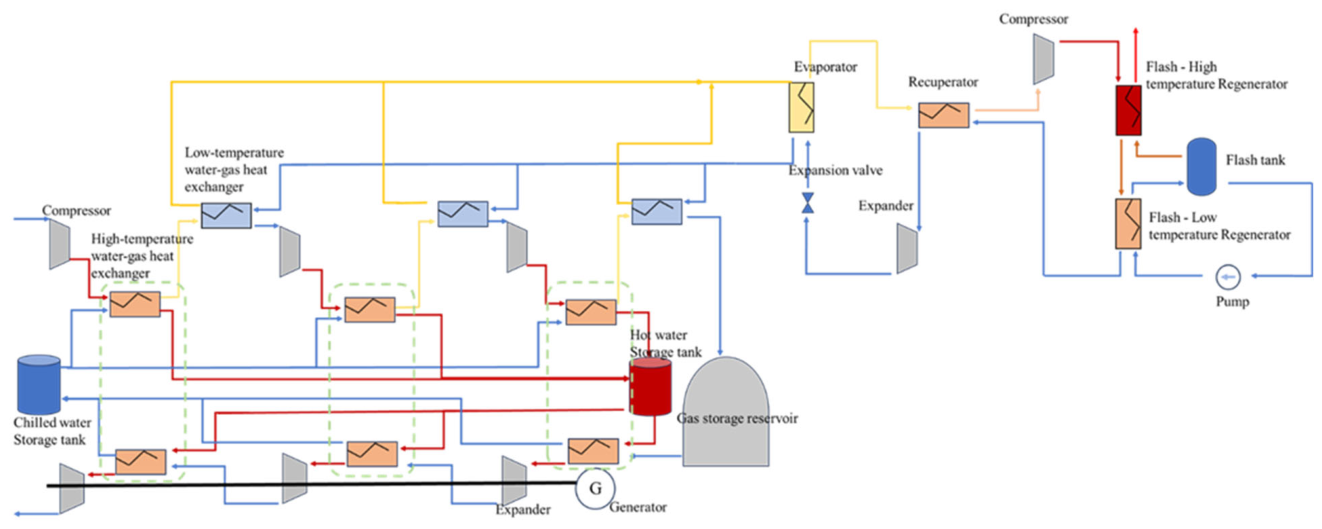
Figure 4.
The influence of feedwater temperature on steam temperature.
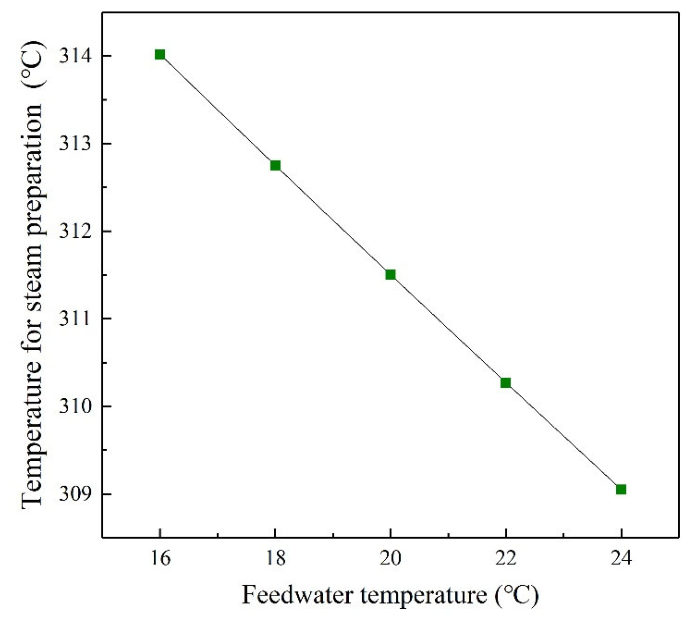
Figure 5.
The influence of feedwater temperature on vaporfraction.
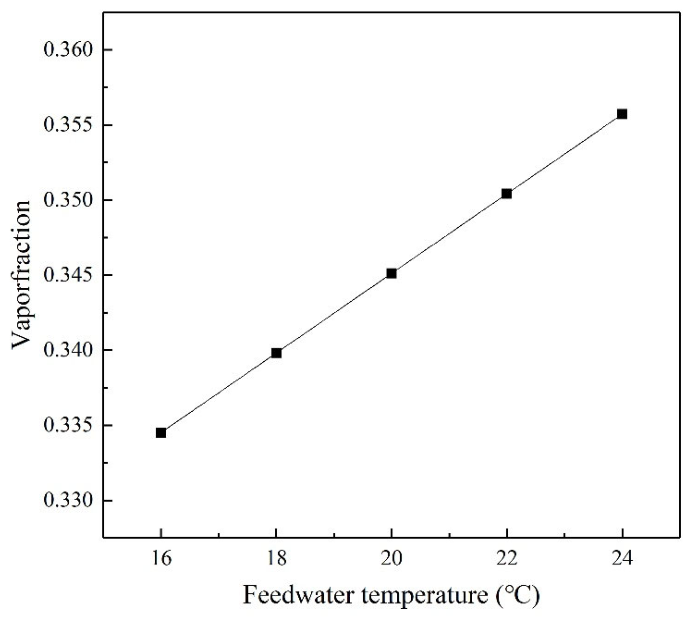
Figure 6.
The influence of feedwater temperature on steam flow rate and pump power consumption.
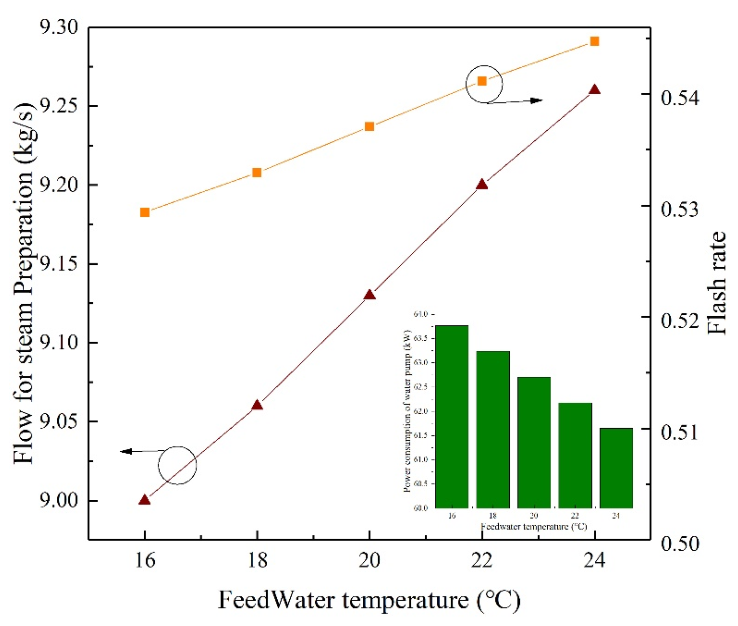
Figure 7.
The influence of feedwater flow on steam temperature.
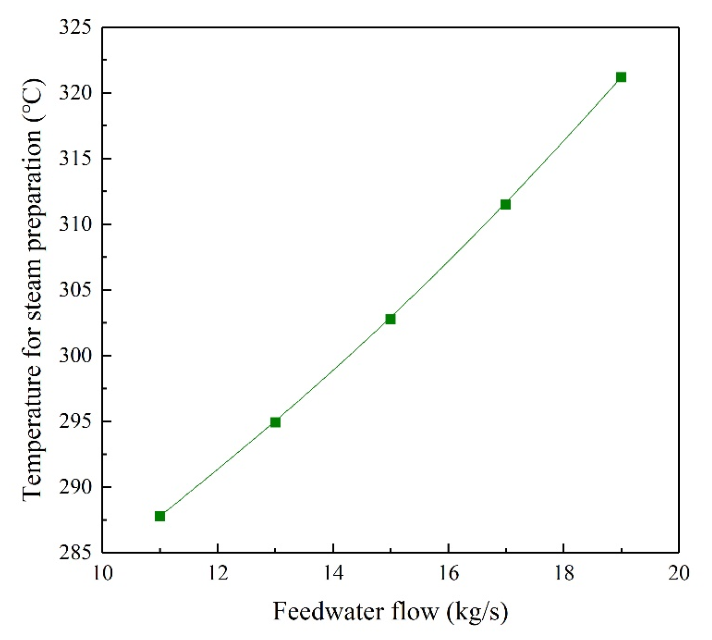
Figure 8.
The influence of feedwater flow on vaporfraction.
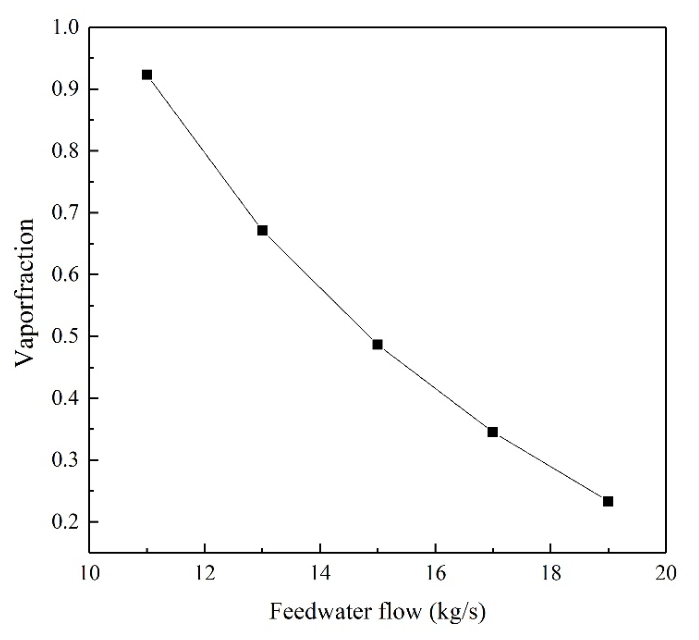
Figure 9.
The influence of feedwater flow on steam flow rate and pump power consumption.
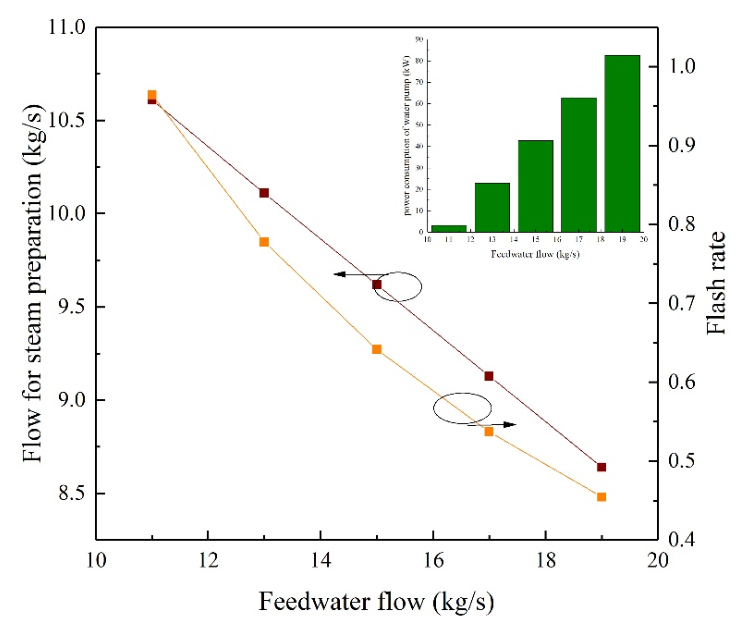
Figure 10.
The combined effect of feed water flow rate and feed water temperature on the vapor phase ratio.
Figure 10.
The combined effect of feed water flow rate and feed water temperature on the vapor phase ratio.
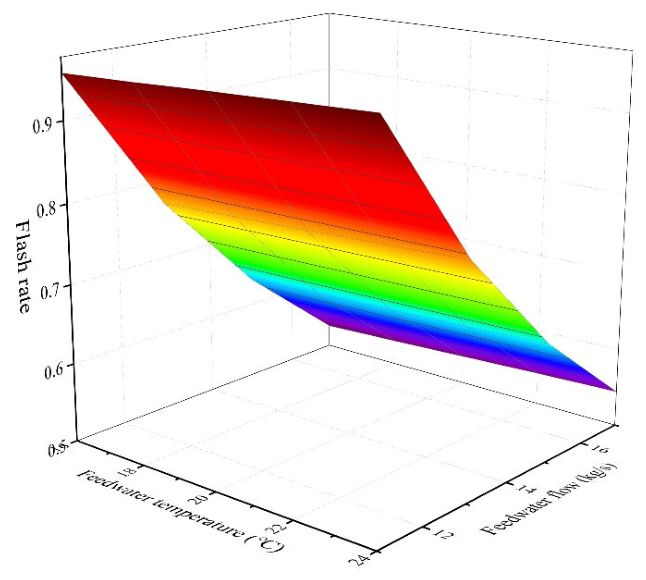
Figure 11.
The combined effect of feed water flow rate and feed water temperature on the temperature for steam preparation.
Figure 11.
The combined effect of feed water flow rate and feed water temperature on the temperature for steam preparation.
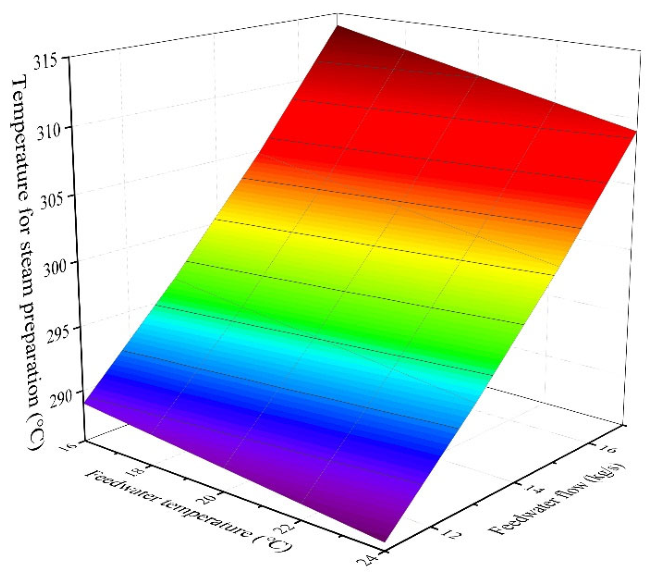
Figure 12.
Effect of Feedwater Pressure on Vaporfraction.
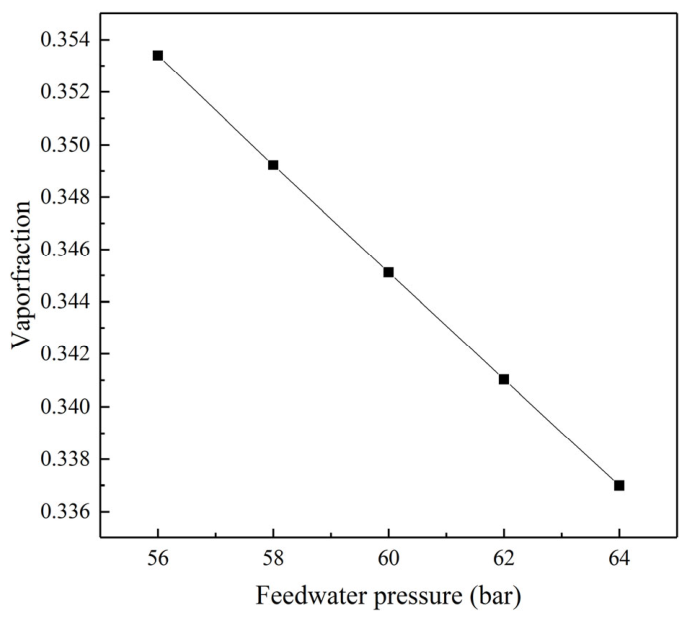
Figure 13.
Effect of Feedwater Pressure on steam quality.
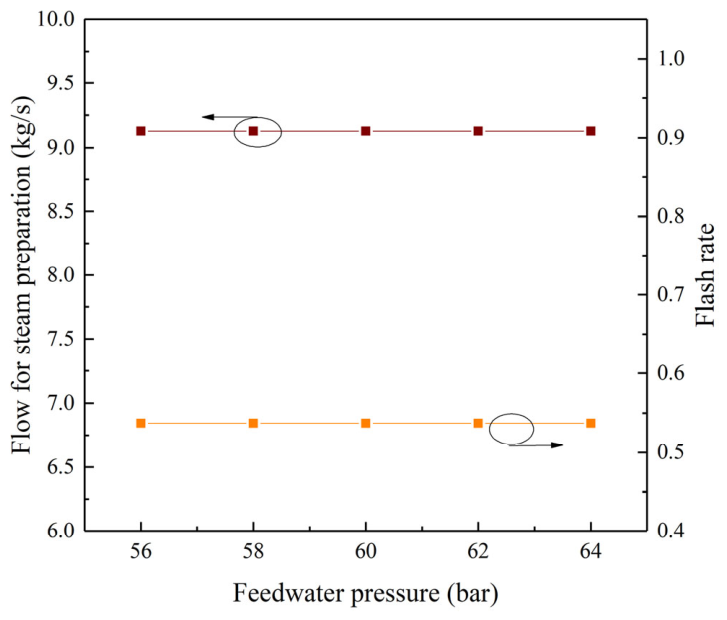
Figure 14.
The amount of pollutants.
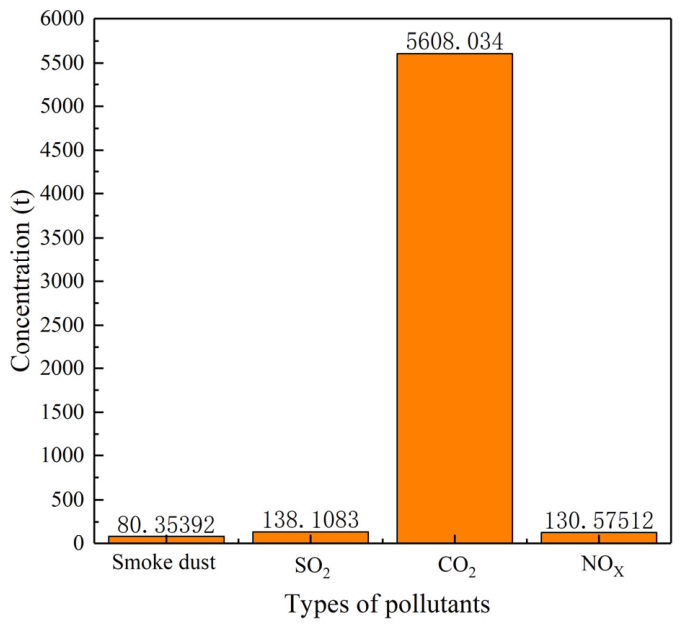

Table 1.
Basic parameters of the CAES.
| Items | Results |
|---|---|
| Storage temperature | 240 ℃ |
| Heat storage medium | Water |
| Gas storage pressure range | 7~10 MPa |
| Turbine inlet flow rate | 848.16 t/h |
| Compressor inlet flow rate | 568.44 t/h |
| Electricity-to-electricity conversion efficiency | 68.4% |
Table 2.
Technical specification data.
| Location | Flow (kg/s) | Temperature (℃) | Pressure (bar) |
|---|---|---|---|
| 1 | 124 | 125 | 34.85 |
| 2 | 124 | 325.16 | 180 |
| 3 | 124 | 304.02 | 179.8 |
| 4 | 124 | 135 | 179.6 |
| 5 | 124 | 91 | 179.4 |
| 6 | 124 | 25.44 | 65 |
| 7 | 124 | 0.43 | 35.25 |
| 8 | 124 | 40.57 | 35.05 |
| 9 | 17 | 20 | 60 |
| 10 | 17 | 275.37 | 59.8 |
| 11 | 7.87 | 145.38 | 4.2 |
| 12 | 9.13 | 145.38 | 4.2 |
| 13 | 9.13 | 311.5 | 4 |
Table 3.
Pollutant emission coefficient of standard coal.
| Pollutants | Emission factor (t/tec) |
|---|---|
| Smoke dust | 0.0096 |
| SO2 | 0.0165 |
| CO2 | 0.67 |
| NOX | 0.0156 |
Disclaimer/Publisher’s Note: The statements, opinions and data contained in all publications are solely those of the individual author(s) and contributor(s) and not of MDPI and/or the editor(s). MDPI and/or the editor(s) disclaim responsibility for any injury to people or property resulting from any ideas, methods, instructions or products referred to in the content. |
© 2026 by the authors. Licensee MDPI, Basel, Switzerland. This article is an open access article distributed under the terms and conditions of the Creative Commons Attribution (CC BY) license (http://creativecommons.org/licenses/by/4.0/).
Copyright: This open access article is published under a Creative Commons CC BY 4.0 license, which permit the free download, distribution, and reuse, provided that the author and preprint are cited in any reuse.


