

Submitted:
16 May 2026
Posted:
19 May 2026
You are already at the latest version
Abstract
Stroke, a leading cause of global disability and mortality, exhibits significant spatiotemporal associations with environmental pollutants. Predicting daily stroke admissions becomes increasingly important as the population ages. Current prediction research on stroke-related medical services mainly relies on point prediction, which lacks the ability to quantify uncertainty. In this study, we try to develop parametric probability prediction models of stroke admissions based on machine learning and deep learning algorithms. We collected stroke data and environmental data from February 11, 2019 to May 26, 2023 in Chengdu, and employed prediction models encompass negative binomial regression, natural gradient boosting (NGBoost), long short-term memory networks (LSTM), and transformer. For performance assessment, mean absolute error (MAE) is used to evaluate point prediction accuracy, while continuous ranked probability score (CRPS) is applied to assess the quality of distribution fitting.We find that models with the ability to capture and process time-series information demonstrate greater advantages in probabilistic prediction, and among the four evaluated models, the transformer model proves to be the one that delivering more reliable and precise outcomes in both point prediction of admission counts and distribution fitting performance. This probabilistic forecasting approach provides robust evidence-based decision support for healthcare administrators to optimize resource allocation and staffing arrangements, and ultimately helps elevate the quality of medical care for stroke patients.
Keywords:
stroke prediction
; probabilistic prediction
; machine learning
; deep learning
; environmental data
Introduction
Stroke, an acute cerebrovascular disease, is one of the leading causes of disability and death worldwide (Kulick et al. 2023). There are more than 15 million new stroke patients every year according to World Health Organization (WHO) (Verhoeven et al. 2021). The escalating incidence of stroke and high associated treatment costs have imposed enormous pressure on medical resources (Feigin et al. 2021). In this context, predicting of the demand for stroke medical services can effectively alleviate multi-stakeholder pressures and enhance the efficiency of medical response.
Environmental factors play a crucial role in the prevention and public health intervention of stroke. As the threat of climate change to ecosystems and human survival becomes increasingly severe (Carlson 2024), a growing number of studies have revealed a close link between environmental factors, particularly air pollutants, and the risk of stroke (Ranta et al. 2023). Short-term exposure to high concentrations of pollutants increases the incidence of cerebrovascular diseases, whereas long-term exposure may induce stroke by accelerating atherosclerosis, triggering systemic inflammation, and causing endothelial dysfunction (Brook et al. 2010; Shah et al. 2015; Rajagopalan et al. 2018). A Chinese study revealed that a 10μg/m3 increase in PM2.5 concentration is significantly associated with a 0.19%, 0.26%, and 0.26% increase in same-day hospital admissions for total cerebrovascular disease, ischemic stroke, and transient ischemic attack, respectively (Gu et al. 2020). Additionally, studies conducted in the United States have similarly confirmed that long-term exposure to PM2.5, NO2, and O3 may independently increase the risk of stroke among the US elderly, among which traffic-related air pollution plays a particularly crucial role (Ma et al. 2022b). Collectively, these findings highlight a strong correlation between environmental factors and stroke. However, current healthcare systems are inadequately prepared to manage fluctuations in demand associated with such environmental influences (Romanello et al. 2023). Thus, integrating environmental factors into predictive models assumes particular significance.
Numerous studies have been conducted on machine learning-based healthcare service demand forecasting (Monteiro Martins et al. 2025), with many leveraging air pollution and meteorological data to predict overall healthcare needs. Few of these machine learning-driven healthcare demand forecasting studies focus specifically on stroke hospital admission forecasting, and of the limited studies that have been done, most are restricted to point forecasting of future admissions (Santhanam et al. 2025; Yang et al. 2025), which only provides a single numerical value and fails to quantify the inherent uncertainty of future admissions—for example, it cannot reflect whether the actual admissions will be 8 or 16 due to sudden weather changes or population mobility, making it difficult for hospitals to prepare for both undercapacity and overcapacity risks. Conventional uncertainty quantification methods for point forecasts, such as 95% confidence intervals, are mostly built on normal distribution assumptions that are incompatible with the overdispersed count nature of hospital admission data, leading to biased risk estimation. Existing research has shown that parametric probabilistic forecasting, which uses machine learning models to predict the parameters of the target outcome distribution, can effectively overcome the above limitations and provide more reliable decision support for healthcare resource management (Salinas et al. 2020). This approach outputs the full probability distribution of possible admission outcomes, allowing administrators to quantify tail risks, guide targeted decisions, and avoid blind resource allocation. Furthermore, to our knowledge, this parametric distributional forecasting framework has not yet been applied to stroke demand forecasting.
Thus, we perform parametric probabilistic prediction modeling on stroke admission data collected from The Third People’s Hospital of Chengdu. We first analyze the distribution characteristics of the stroke admission data using the chi-square goodness-of-fit test, and the results confirm that the data follows a negative binomial distribution. Based on this distributional characteristic, we use a suite of machine learning and deep learning algorithms, including natural gradient boosting (NGBoost), long short-term memory (LSTM), and Transformer, to predict the two core parameters that define the daily negative binomial distribution of stroke admissions, with negative binomial regression employed as the baseline model. We find that models capable of capturing time-series information exhibit greater advantages in probabilistic prediction, and among these, the Transformer model excels in both point prediction and distribution fitting, emerging as the most comprehensive performer overall. These findings not only reveal the important role of environmental factors in stroke risk but also emphasize the unique value of quantifying distributional uncertainty in optimizing healthcare resource allocation amid climate change challenges.
Materials and Methods
Data Collection and Processing
Study Area
Chengdu is situated in the central region of Sichuan Province, southwestern China, and acts as a core key city within the Chengdu-Chongqing Economic Circle. It serves as a critical hub for regional economy, culture, transportation, and technological innovation in southwestern China. By the end of 2024, the permanent resident population of Chengdu had surpassed 21.2 million, while its regional GDP reached approximately 2.2 trillion yuan.
Notably, Chengdu is located in the Sichuan Basin, a topographic feature defined by high surrounding mountains and a low-lying central plain. This enclosed terrain restricts horizontal air flow and vertical atmospheric mixing, significantly impeding the diffusion of atmospheric pollutants. As a result, pollutants tend to accumulate in the urban area, especially under stable meteorological conditions, which has amplified local environmental concerns amid rapid urbanization and industrial development. This unique topographic constraint makes Chengdu a particularly representative site for exploring environmental and health-related research questions.
Data
Data sources for this study included:
(1) Daily stroke admissions records from The Third People’s Hospital of Chengdu between February 11, 2019, and May 26, 2023. While each patient’s medical record contains gender, age, primary diagnosis, and occupation, this study exclusively tallied the daily aggregate count of hospital admissions due to stroke episodes.
(2) Air pollution data are collected from AQISTUDY China (https://www.aqistudy.cn/), encompassing conventional air pollutants and fine particulate matter components. Key pollutants monitored include PM2.5, PM10, CO, NO2, SO2, O3, etc;
(3) Meteorological data are obtained from the U.S. National Centers for Environmental Information (https://www.ncei.noaa.gov/), covering meteorological variations in Chengdu during the study period. Parameters included daily maximum temperature, minimum temperature, mean temperature, wind speed, and other relevant climatic variables.
To address missing values within the data sequences, this study employed a forward-fill imputation method, which utilized observations from adjacent time points to preserve temporal continuity, thereby preserving data quality and enhancing model performance.
Descriptive Analysis
Figure 2 presents box plots of the variables in the dataset, which include air pollutants (e.g., PM2.5, PM10, CO, NO2), meteorological parameters (e.g., average temperature, minimum temperature, wind speed), and the number of stroke admissions. Virtually all variables display a substantial number of outliers distributed above the upper whisker of their respective box plots—a pattern that indicates the presence of extreme values in the upper range of these variables. Additionally, specific air pollutants such as PM2.5, PM10, and O3_8h exhibit marked variability: they not only have wide value ranges but also large variances, which reflect high dispersion in their measurements throughout the study period.
Figure 3 illustrates the temporal patterns of air pollutants, meteorological parameters, and the number of stroke admissions throughout the study period. Three distinct characteristics are observable in the temporal variations of the variables: First, several variables exhibit clear periodicity, such as O3, temperature, PM2.5, and PM10. This periodicity mainly manifests as seasonal fluctuations: O3 and temperature reach high levels in summer and low levels in winter, while PM2.5 and PM10 show the opposite pattern, with higher levels in winter and lower levels in summer; Furthermore, certain groups of variables show a degree of correlation: PM2.5 and PM10 display aligned temporal trends, as they share common emission sources (e.g., combustion and dust) and exhibit similar atmospheric diffusion behaviors; similarly, meteorological variables including average temperature, maximum temperature, and minimum temperature are closely linked to diurnal and seasonal solar radiation changes, thus exhibiting synchronized fluctuations; In contrast, the remaining pollutants (e.g., CO, NO2, and SO2) lack distinct temporal regularities, instead showing irregular fluctuations over the study period.
As for the temporal pattern of the number of stroke admissions, it exhibits distinct characteristics over the study period: a distinct peak is observed on March 1, 2019, after which the number declines and fluctuates below the median of 19. Subsequently, it enters a trough around February 2020, followed by a slow fluctuating upward trend. Overall, the number of stroke admissions remains below the median in the early stage of the study period and shifts to above the median in the later stage.
Figure 4(a) shows the distribution of stroke admissions, from which we hypothesize that the number of stroke admissions might follow a negative binomial distribution. To verify this assumption, we employ a χ2 goodness-of-fit test, which show that χ2 statistic is 20.05 and P-value is 0.0661 (>0.05), such that the null hypothesis that stroke data follows a negative binomial distribution could not be rejected.We further construct a Q-Q plot in Figure 4(b) to examine the fitting effect, which demonstrates that the scatter points align closely with the reference line (R2 = 0.9889), confirming that stroke data follows a negative binomial distribution.
Feature Processing
We perform dimensionality reduction on the collected variables by screening for predictors associated with stroke admissions. Given that environmental pollutants and meteorological factors exert an influence on stroke onset through non-linear relationships, we calculate spearman correlation coefficient (Wissler 1905; Myers and Sirois 2006; Ali Abd Al-Hameed 2022) to identify relevant variables. More specifically, we compute spearman correlation coefficients between daily stroke admissions and all candidate variables for each season defined by spring (1st March to 31st May), summer (1st June to 31st August), autumn (1st September to 30th November), and winter (1st December to 28th/29th February, accounting for leap years). Findings demonstrate that not all variables are correlated with daily stroke admissions, and even when such associations exist, their magnitude varies across seasons. Furthermore, we assess the interrelationships among these variables, remove redundant ones through this screening process, and ultimately, the remaining variables are as follows: CO, NO2, SO2, O3_8h, and MinT.
To account for lagged effects of environmental factors on stroke admissions, we determine optimal lags (within one week) for each predictor using the cross-correlation function (CCF), assigning these as lagged features. Furthermore, we observe that environmental factors exhibit seasonally distinct effects on stroke incidence by spearman correlation coefficients. We therefore construct interaction terms between lag terms and seasons. The final selected features are summarized in Table 1.
Goals and Metrics
Forecasting Task
Based on the previous χ2 goodness-of-fit test, this study posits that the daily number of stroke admissions in Chengdu follows a negative binomial distribution.There are two prediction tasks in this study: first, to characterize the probability distribution of daily stroke admissions via distribution fitting; second, to generate point predictions for future daily admissions. To accomplish the latter, the study employs the mathematical expectation of the distribution—derived from the estimated parameters—as the point prediction.
Evaluation Metrics
To align with the prediction objectives explicitly delineated in this study, an evaluation of two key dimensions is requisite: the performance of the model’s point predictions and the efficacy of its distribution fitting. With respect to point prediction assessment, commonly employed metrics include the mean absolute percentage error (MAPE), root mean square error (RMSE), and mean absolute error (MAE)(Monteiro Martins et al. 2025). This study employs MAE as the evaluation metric for its robustness to extreme values and intuitive interpretability in characterizing average prediction errors. MAE calculates the average of absolute differences between predicted and actual daily admission counts, defined by the formula:
where denotes the number of observations, represents the forecasted admission count for day , and is the actual observed value.
We employ continuous ranked probability score (CRPS) as the evaluation index for distribution fitting, which quantifies the integrated discrepancy between the forecasted distribution and observed values, considering both prediction accuracy and distribution shape (Bröcker 2012; Zamo and Naveau 2018). Its computational formula is defined as:
where denotes the cumulative distribution function (CDF) of forecasts, is the observed value, and represents the heaviside step function.
Models Used in the Study
All operations and models described were implemented using Python 3.11.10. The dataset is divided chronologically into three parts: 70% is allocated for model training, 15% serves as a validation set to check for overfitting, and the remaining 15% acts as a test set for evaluating the final model performance. To eliminate the interference of parameter randomness on experimental results, 30 repeated tests are conducted in this study, and the average performance across multiple tests is adopted as the basis for model comparison. During each test, the parameter estimates of the model are recorded, and after the experiment, the evaluation metrics of the model in the two tasks are further calculated and analyzed.
Negative Binomial Regression
Multiple linear regression is one of the most popular and classical predictive methods. It uses a set of explanatory (or predictor) variables to forecast a target variable of interest and is widely used for modeling linear relationships(Maulud and Abdulazeez 2020). The simplest linear regression equation is as follows:
Where is our target variable of interest, are the explanatory variables, are regression coefficients, and .
However, in many cases, particularly within medical contexts, the normality assumption often did not hold. Therefore, the linear regression model should be replaced with other, more appropriate models. Based on the characteristics of our data, we employed a negative binomial regression model (Ver Hoef and Boveng 2007) here, which was summarized in the following form:
Where is the conditional mean of the target variable Y, given the explanatory variables . This model establishes a linear relationship between the explanatory variables and the conditional mean via a log-link function. Simultaneously, the model introduced introduced a dispersion parameter to control the conditional variance . This combination enabled precise modeling of the distribution of admission counts.
Natural Gradient Boosting
Natural gradient boosting (Duan et al. 2020)is a probabilistic regression algorithm within the gradient boosting framework. Its core innovation lies in jointly optimizing multi-parametric conditional distributions. Unlike traditional regression limited to point estimates, NGBoost enables probabilistic predictions by parameterizing conditional distributions, thereby capturing distributional shapes and uncertainty measures.
NGBoost comprises three configurable components: (1) Base learner, which supports flexible regression models (defaulting to decision trees that partition feature spaces non-linearly); (2) Parametric distribution, defined by a parameter vector ; and (3) Scoring rule, which quantifies the match between predicted and observed distributions (e.g., Negative Log-Likelihood or CRPS). In this study, we select the negative binomial distribution as the parametric distribution, use default decision trees as the base learner, and adopt CRPS as the scoring rule, with processed features serving as model inputs.
Long Short-Term Memory
Long short-term memory networks (Graves 2012), a specialized recurrent neural network (RNN)(Pascanu et al. 2013), address the vanishing gradient problem in long sequences through gating mechanisms and memory cells. This enables learning of long-term dependencies. LSTM has been successfully applied to clinical time-series prediction (Soltani et al. 2022; Yu et al. 2019a), with core innovations including cell states with input, forget, and output gates.
We design a stacked LSTM model: Layer 1 dynamically learns local temporal patterns via gating mechanisms; Layer 2 compresses multi-dimensional sequences into context vectors to capture global dependencies. The output is fed into a fully-connected layer activated by ReLU, with L2 regularization constraining complexity. The final output layer contains two neurons activated by Softplus to generate target distribution parameters. To verify the performance of the two-layer architecture, we compare it with its single-layer counterpart.
Transformer
In contrast to recurrent neural networks, which process sequences in a sequential manner, transformer handles sequential data across parallel timesteps while dynamically modeling inter-timestep dependencies through multi-head attention. Its key advantages are twofold (Vaswani et al. 2017; Zhou et al. 2021): (1) Self-attention mechanisms automatically pinpoint salient elements within sequences, effectively mitigating the gradient degradation issue inherent to RNNs when capturing long-range dependencies; (2) Multi-head attention enables the modeling of complex multidimensional feature interactions via joint subspace learning.
In this study, we similarly design a stacked transformer model for comparison, aiming to analogize the concept of stacked LSTM and investigate whether stacked transformers can further enhance performance. This stacked architecture comprises two cascaded encoder layers: Layer 1 captures local temporal patterns; Layer 2 models long-range dependencies. During decoding, the encoder output at the final timestep is used as the global context vector. These features are then transformed via the Softplus activation function to generate target distribution parameters.
Results
The average performance of each model in the tasks of the prediction of stroke admissions and distribution fitting is summarized in Table 2. In terms of the accuracy of the prediction of stroke admissions, the transformer model performs the best, followed by the LSTM model and the NGBoost model, with all three models outperforming the baseline model. Notably, the performance ranking of each model in the distribution fitting task is highly consistent with that in the headcount prediction task, and this consistency may stem from the approach of using the mean value of the distribution as the point prediction result in the experiment. Therefore, in terms of overall performance, the transformer model is the best, followed by the LSTM model, and then the NGBoost model and the baseline model in sequence.
We find that stacked transformer model does not improve its performance, while stacked LSTM model outperforms the single-layer structure. This difference may be associated with the temporal processing capabilities of the two model types: For the target task investigated in this paper, a single-layer transformer can already capture global temporal dependencies in parallel via the multi-head attention mechanism, without the need for additional layers. In contrast, a single-layer LSTM is constrained by the local temporal memory characteristic of the gating mechanism and cannot fully capture the long-period headcount change patterns. By stacking feature extraction layers, stacked LSTM may be delve deeper into the deep temporal information in the sequence, thereby effectively compensating for the shortcomings of the single-layer model.
Discussion
Stroke exerts a substantial economic burden upon both patients and healthcare services (Li et al. 2024), accurate prediction of stroke admissions allows administrators to tackle resource constraints, staffing shortages, and budgetary challenges, and meanwhile, the quality of patient care can be enhanced(Teixeira et al. 2021; Gattringer et al. 2019). Using a single value as the predicted value for future stroke admissions is intuitive, yet it fails to quantify prediction risks. In this study, machine learning models are utilized to generate probabilistic demand forecasts with uncertainty quantification, and the aim is to provide useful reference information for Chengdu.
To address the shortcoming that point forecasting fails to quantify the inherent uncertainty associated with future admission numbers, probabilistic prediction of stroke is performed using machine learning in this study. The area of this study is Chengdu, and data from The Third People’s Hospital of Chengdu between February 11, 2019, and May 26, 2023 are adopted. Distribution fitting reveals that historical stroke admissions in the hospital follow a Negative Binomial distribution, which is characterized by overdispersion that increases prediction uncertainty.
Four models are employed for probabilistic prediction of admission counts, including negative binomial regression, NGBoost, LSTM, and transformer. The mean value of the distribution predicted by the model is used as the predicted value of stroke admissions. The results show that among the four models, the transformer model performs the best comprehensively, followed by LSTM and NGBoost, with all three models outperforming the baseline regression model. LSTM is a type of RNN, which is difficult to handle long time series (Yu et al. 2019b), and several studies(Wang et al. 2018; Ojo et al. 2019; Ma et al. 2022a)have achieved promising results by adopting stacked LSTM. In this study, through a comparison of different stacked LSTM architectures, we also find that the stacked LSTM model outperforms its single-layer counterpart. Furthermore, the performance of the transformer and LSTM models reveals a certain association between the ability of models to capture and process time-series information and the prediction accuracy of admission counts.
For the transformer model, which performs the best, its MAE is 12.096. Such deviation is within the acceptable range of hospitals but does not meet our target expectation, which may be related to the impact of the COVID-19 pandemic during the studied period (Drenck et al. 2022; Akhtar et al. 2022). Changes in the number of stroke admissions during the study period can be seen in the time-series graph (Figure 2). In the graph, the number of admissions in the early stage is generally below the median, while in the later stage, it is above the median. Prior research has shown that the COVID-19 pandemic may lead to fewer stroke admissions(Bres Bullrich et al. 2020; Padmanabhan et al. 2021), and the sequelae it causes could also raise the likelihood of stroke(Spence et al. 2020; Nannoni et al. 2021). Notably, the early phase of the study timeframe aligns with the COVID-19 pandemic period, while the higher admission numbers observed in the later phase could be linked to the sequelae of this pandemic. Such fluctuations caused by the pandemic introduce abnormal temporal patterns into the training data, deviate from the regular epidemiological trend of stroke admissions and make it hard for models to learn stable underlying patterns(Nogueira-Leite et al. 2021).
For the prediction models developed in this study, the foundational data sources are environmental pollution metrics and meteorological records, with no integration of detailed individual clinical information. It should be acknowledged that incorporating such clinical data could potentially enhance predictive accuracy; furthermore, as the data of the study are sourced exclusively from a single hospital (The Third People’s Hospital of Chengdu), the generalizability of its findings may be confined to specific regions within Chengdu rather than extrapolable to the entire city. Notably, the core objective of this work is to forecast stroke demand at the institutional or regional level, not to predict individual stroke risk, thus models built on environmental pollution and meteorological data still effectively capture broader trends in stroke incidence. Even with insights limited to the specific Chengdu region represented by the participating hospital, which enjoys a prominent standing and exerts considerable influence in Chengdu, the findings remain valuable in providing actionable information and references for healthcare stakeholders in Chengdu and the general public.
Conclusion
In this study, we conduct a comprehensive evaluation of four machine learning models for the probabilistic prediction of stroke admissions, with foundational data sourced from The Third People’s Hospital of Chengdu (spanning February 11, 2019, to May 26, 2023) and leveraging environmental pollution and meteorological records as input features. The results indicate that the transformer model delivers the most reliable and accurate probabilistic forecasts. We aim to provide evidence-based support for healthcare administrators in Chengdu, supporting their decisions on resource allocation and staffing adjustment, and in turn contributing to improved quality of care for stroke patients.
Future work could focus on incorporating detailed individual clinical data to supplement model inputs, collecting data from multiple healthcare institutions in Chengdu to build a joint dataset, and refining the prediction target to a specific type of stroke to enhance the specificity of analysis. This will help enhance practical value of the model in forecasting stroke admissions within healthcare system in Chengdu.
Ethical Standards
The research was implemented in strict compliance with the current laws of the country and the institutional ethical requirements of the hospital.
Ethics Statement and Informed Consent
All human-related studies were approved by the Medical Ethics Committee of The Third People’s Hospital of Chengdu (2024-S-190). The research was implemented in strict compliance with the Declaration of Helsinki, local legislative regulations, and the institutional ethical requirements of the hospital. Given that the data utilized were de-identified and aggregated, and no direct contact was established with individual participants, the ethics committee/institutional review board waived the necessity for obtaining written informed consent from the participants themselves or their legal guardians/next of kin, as no additional consent was deemed required for this study.
Data Availability
The stroke data supporting the findings of this study are available from The Third People’s Hospital of Chengdu; however, restrictions apply to their availability. These data were used under license for the current study and are therefore not publicly available, though they can be obtained from the corresponding author upon reasonable request. Environmental data used in this article were gathered from AQISTUDY China (https://www.aqistudy.cn/) and the U.S. National Centers for Environmental Information (https://www.ncei.noaa.gov/).
Competing Interests
All authors have no conflicts of interest to declare.
Funding
This work was supported by Technical Innovation and R&D Project of Chengdu Science and Technology Bureau [2024-YF05-00603-SN].
Acknowledgments
The authors would like to thank The Third People’s Hospital of Chengdu for its support in this study. We also acknowledge the financial support from the following funding bodies for this work: the National Natural Science Foundation of PR China, the Fundamental Research Funds for the Central Universities, and the Technical Innovation and R&D Project of Chengdu Science and Technology Bureau.
References
- Akhtar, N; Kamran, S; Al-Jerdi, S; et al. Trends in stroke admissions before, during and post-peak of the covid-19 pandemic: A one-year experience from the qatar stroke database. PLoS ONE 2022, 17(3), e0255185. [Google Scholar] [CrossRef]
- Ali Abd Al-Hameed, K. Spearman’s correlation coefficient in statistical analysis. International Journal of Nonlinear Analysis and Applications 2022, 13(1), 3249–3255. [Google Scholar] [CrossRef]
- Bres Bullrich, M; Fridman, S; Mandzia, JL; et al. Covid-19: Stroke admissions, emergency department visits, and prevention clinic referrals. Canadian Journal of Neurological Sciences/Journal Canadien des Sciences Neurologiques 2020, 47(5), 693–696. [Google Scholar] [CrossRef] [PubMed]
- Bröcker, J. Evaluating raw ensembles with the continuous ranked probability score. Quarterly Journal of the Royal Meteorological Society 2012, 138(667), 1611–1617. [Google Scholar] [CrossRef]
- Brook, RD; Rajagopalan, S; Pope, CA; et al. Particulate matter air pollution and cardiovascular disease: An update to the scientific statement from the american heart association. Circulation 2010, 121(21), 2331–2378. [Google Scholar] [CrossRef]
- Carlson, CJ. After millions of preventable deaths, climate change must be treated like a health emergency. Nature Medicine 2024, 30(3), 622. [Google Scholar] [CrossRef]
- Drenck, N; Grundtvig, J; Christensen, T; et al. Stroke admissions and revascularization treatments in denmark during covid-19. Acta Neurologica Scandinavica 2022, 145(2), 160–170. [Google Scholar] [CrossRef]
- Duan, T; Anand, A; Ding, DY; et al. Ngboost: Natural gradient boosting for probabilistic prediction. In Paper presented at the Proceedings of the 37th International Conference on Machine Learning, Proceedings of Machine Learning Research; 2020. [Google Scholar]
- Feigin, VL; Stark, BA; Johnson, CO; et al. Global, regional, and national burden of stroke and its risk factors, 1990–2019: A systematic analysis for the global burden of disease study 2019. The Lancet Neurology 2021, 20(10), 795–820. [Google Scholar] [CrossRef]
- Gattringer, T; Posekany, A; Niederkorn, K; et al. Predicting early mortality of acute ischemic stroke: Score-based approach. Stroke 2019, 50(2), 349–356. [Google Scholar] [CrossRef] [PubMed]
- Graves, A. Long short-term memory. In Supervised sequence labelling with recurrent neural networks; Graves, A, Ed.; Springer Berlin Heidelberg: Berlin, Heidelberg, 2012; pp. 37–45. [Google Scholar] [CrossRef]
- Gu, J; Shi, Y; Chen, N; et al. Ambient fine particulate matter and hospital admissions for ischemic and hemorrhagic strokes and transient ischemic attack in 248 chinese cities. Science of The Total Environment 2020, 715, 136896. [Google Scholar] [CrossRef] [PubMed]
- Kulick, ER; Kaufman, JD; Sack, C. Ambient air pollution and stroke: An updated review. Stroke 2023, 54(3), 882–893. [Google Scholar] [CrossRef]
- Li, X-y; Kong, X-m; Yang, C-h; et al. Global, regional, and national burden of ischemic stroke, 1990–2021: An analysis of data from the global burden of disease study 2021. eClinicalMedicine 2024, 75. [Google Scholar] [CrossRef] [PubMed]
- Ma, M; Liu, C; Wei, R; et al. Predicting machine’s performance record using the stacked long short-term memory (lstm) neural networks. Journal of Applied Clinical Medical Physics 2022a, 23(3), e13558. [Google Scholar] [CrossRef]
- Ma, T; Yazdi, MD; Schwartz, J; et al. Long-term air pollution exposure and incident stroke in american older adults: A national cohort study. Global Epidemiology 2022b, 4, 100073. [Google Scholar] [CrossRef]
- Maulud, D; Abdulazeez, AM. A review on linear regression comprehensive in machine learning. Journal of Applied Science and Technology Trends 2020, 1(2), 140–147. [Google Scholar] [CrossRef]
- Monteiro Martins, L; Coz, E; Maucort-Boulch, D; et al. Machine learning with environmental predictors to forecast hospital visits and admissions: A systematic review. Environmental Systems Research 2025, 14(1), 12. [Google Scholar] [CrossRef]
- Myers, L; Sirois, MJ. Spearman correlation coefficients, differences between. In Encyclopedia of statistical sciences; 2006. [Google Scholar] [CrossRef]
- Nannoni, S; de Groot, R; Bell, S; et al. Stroke in covid-19: A systematic review and meta-analysis. International Journal of Stroke 2021, 16(2), 137–149. [Google Scholar] [CrossRef]
- Nogueira-Leite, D; Alves, JM; Marques-Cruz, M; et al. A cautionary tale on using covid-19 data for machine learning. In Artificial Intelligence in Medicine, Cham, 2021//; Tucker, A, Henriques Abreu, P, Cardoso, J, Pereira Rodrigues, P, Riaño, D, Eds.; Springer International Publishing, 2021; pp. 265–275. [Google Scholar]
- Ojo, SO; Owolawi, PA; Mphahlele, M; et al. Stock market behaviour prediction using stacked lstm networks. 2019 International Multidisciplinary Information Technology and Engineering Conference (IMITEC); 2019; pp. 1–5. [Google Scholar] [CrossRef]
- Padmanabhan, N; Natarajan, I; Gunston, R; et al. Impact of covid-19 on stroke admissions, treatments, and outcomes at a comprehensive stroke centre in the united kingdom. Neurological Sciences 2021, 42(1), 15–20. [Google Scholar] [CrossRef] [PubMed]
- Pascanu, R; Mikolov, T; Bengio, Y. On the difficulty of training recurrent neural networks. In Paper presented at the Proceedings of the 30th International Conference on Machine Learning, Proceedings of Machine Learning Research; 2013. [Google Scholar]
- Rajagopalan, S; Al-Kindi Sadeer, G; Brook Robert, D. Air pollution and cardiovascular disease: Jacc state-of-the-art review. JACC 2018, 72(17), 2054–2070. [Google Scholar] [CrossRef]
- Ranta, A; Ozturk, S; Wasay, M; et al. Environmental factors and stroke: Risk and prevention. Journal of the Neurological Sciences 2023, 454, 120860. [Google Scholar] [CrossRef] [PubMed]
- Romanello, M; Napoli, Cd; Green, C; et al. The 2023 report of the lancet countdown on health and climate change: The imperative for a health-centred response in a world facing irreversible harms. The Lancet 2023, 402(10419), 2346–2394. [Google Scholar] [CrossRef]
- Salinas, D; Flunkert, V; Gasthaus, J; et al. DeepAR: Probabilistic forecasting with autoregressive recurrent networks. International Journal of Forecasting 2020, 36(3), 1181–1191. [Google Scholar] [CrossRef]
- Santhanam, N; Kim, HE; Rügamer, D; et al. Machine learning-based forecasting of daily acute ischemic stroke admissions using weather data. npj Digital Medicine 2025, 8(1), 225. [Google Scholar] [CrossRef] [PubMed]
- Shah, ASV; Lee, KK; McAllister, DA; et al. Short term exposure to air pollution and stroke: Systematic review and meta-analysis. BMJ 2015, 350, h1295. [Google Scholar] [CrossRef]
- Soltani, M; Farahmand, M; Pourghaderi, AR. Machine learning-based demand forecasting in cancer palliative care home hospitalization. Journal of Biomedical Informatics 2022, 130, 104075. [Google Scholar] [CrossRef] [PubMed]
- Spence, JD; de Freitas, GR; Pettigrew, LC; et al. Mechanisms of stroke in covid-19. Cerebrovascular Diseases 2020, 49(4), 451–458. [Google Scholar] [CrossRef]
- Teixeira, C; Kern, M; Rosa, RG. Quais desfechos devem ser avaliados nos pacientes graves? Revista Brasileira de Terapia Intensiva 2021, 33. [Google Scholar]
- Vaswani, A; Shazeer, N; Parmar, N; et al. Attention is all you need. 2017. [Google Scholar] [CrossRef]
- Ver Hoef, JM; Boveng, PL. Quasi-poisson vs. Negative binomial regression: How should we model overdispersed count data? Ecology 2007, 88(11), 2766–2772. [Google Scholar] [CrossRef]
- Verhoeven, JI; Allach, Y; Vaartjes, ICH; et al. Ambient air pollution and the risk of ischaemic and haemorrhagic stroke. The Lancet Planetary Health 2021, 5(8), e542–e552. [Google Scholar] [CrossRef]
- Wang, J; Peng, B; Zhang, X. Using a stacked residual lstm model for sentiment intensity prediction. Neurocomputing 2018, 322, 93–101. [Google Scholar] [CrossRef]
- Wissler, C. The spearman correlation formula. Science 1905, 22(558), 309–311. [Google Scholar] [CrossRef]
- Yang, Y; Zhang, M; Zhang, J; et al. Medical meteorological forecast for ischemic stroke: Random forest regression vs long short-term memory model. International Journal of Biometeorology 2025, 69(2), 397–402. [Google Scholar] [CrossRef]
- Yu, Y; Parsi, B; Speier, W; et al. Lstm network for prediction of hemorrhagic transformation in acute stroke. In Medical Image Computing and Computer Assisted Intervention – MICCAI 2019, Cham; Shen, D, Liu, T, Peters, TM, et al., Eds.; Springer International Publishing, 2019a; pp. 177–185. [Google Scholar]
- Yu, Y; Si, X; Hu, C; et al. A review of recurrent neural networks: Lstm cells and network architectures. Neural Computation 2019b, 31(7), 1235–1270. [Google Scholar] [CrossRef]
- Zamo, M; Naveau, P. Estimation of the continuous ranked probability score with limited information and applications to ensemble weather forecasts. Mathematical Geosciences 2018, 50(2), 209–234. [Google Scholar] [CrossRef]
- Zhou, H; Zhang, S; Peng, J; et al. Informer: Beyond efficient transformer for long sequence time-series forecasting. Proceedings of the AAAI Conference on Artificial Intelligence 2021, 35(12), 11106–11115. [Google Scholar] [CrossRef]
Figure 2.
Box plots of various variables in the dataset. AQI: air quality index; PM2_5: particulate matter ≤2.5μm (ug/m3); PM10: particulate matter ≤10μm (ug/m3); CO: carbon monoxide (mg/m3); NO2: nitrogen doxide (ug/m3); SO2: sulfur dioxide (ug/m3); O3_8h: 8-hour average ozone (ug/m3); AT: average temperature; MaxT: maximum temperature; MinT: minimum temperature; Wind speed: Average Wind Speed (m/s); Number: the daily total inpatients with stroke.
Figure 2.
Box plots of various variables in the dataset. AQI: air quality index; PM2_5: particulate matter ≤2.5μm (ug/m3); PM10: particulate matter ≤10μm (ug/m3); CO: carbon monoxide (mg/m3); NO2: nitrogen doxide (ug/m3); SO2: sulfur dioxide (ug/m3); O3_8h: 8-hour average ozone (ug/m3); AT: average temperature; MaxT: maximum temperature; MinT: minimum temperature; Wind speed: Average Wind Speed (m/s); Number: the daily total inpatients with stroke.
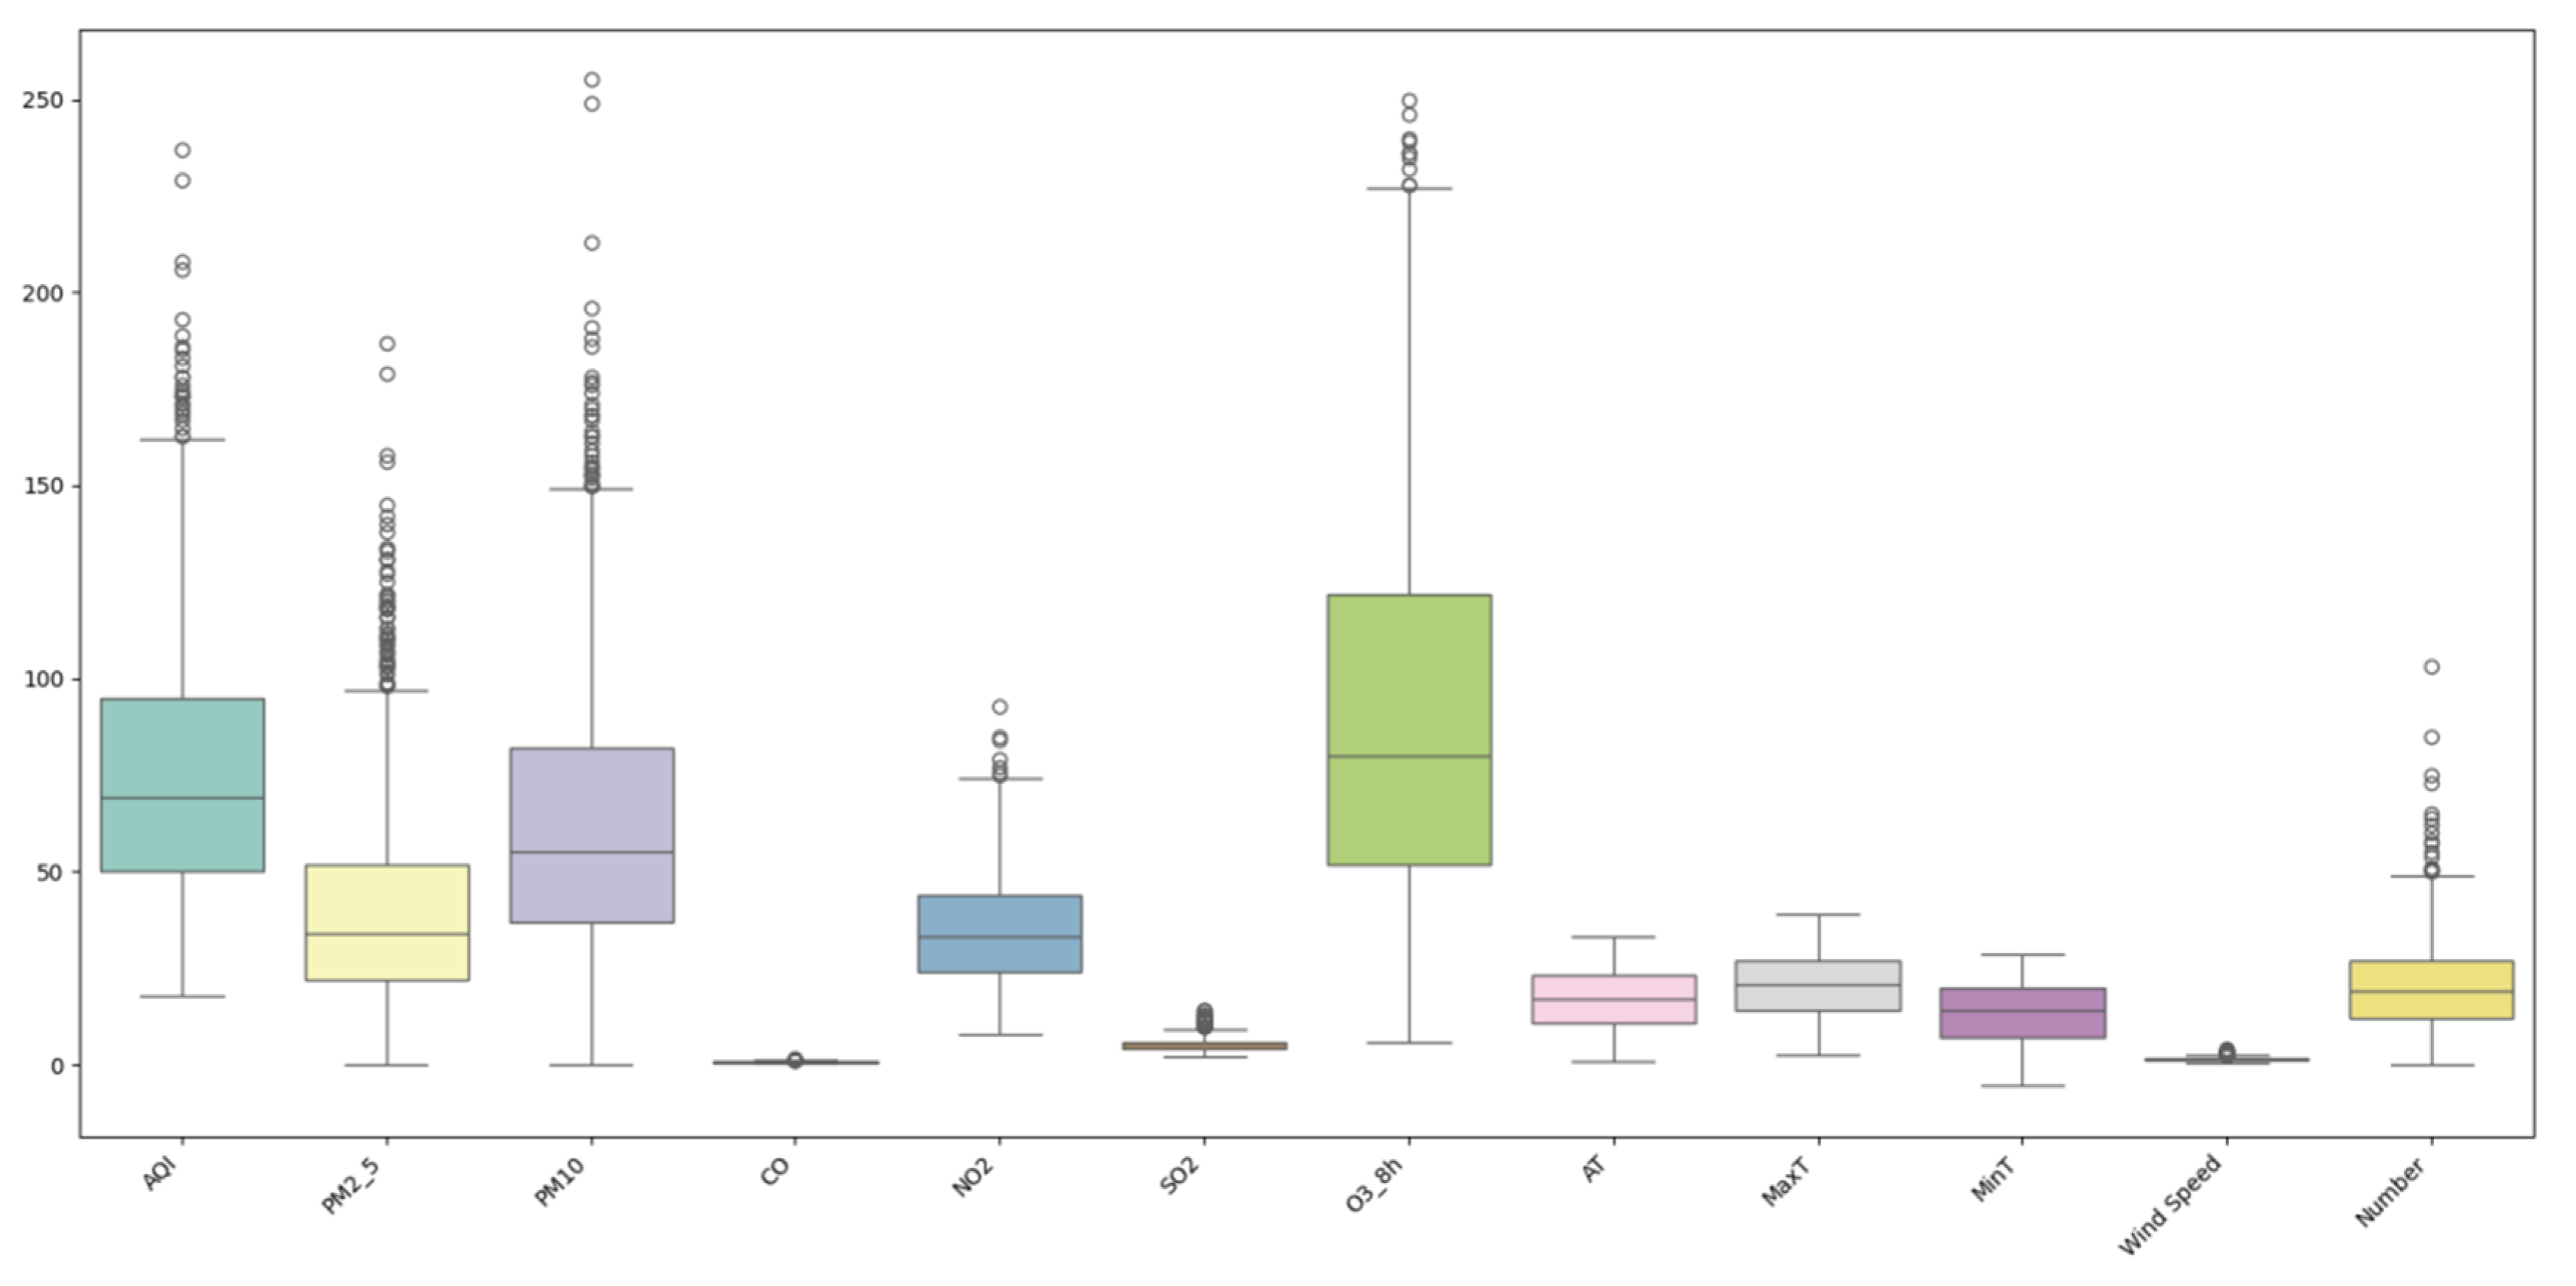
Figure 3.
Patterns of air pollution, meteorological data, and stroke admissions at The Third People’s Hospital of Chengdu, spanning from February 11, 2019, to May 26, 2023.
Figure 3.
Patterns of air pollution, meteorological data, and stroke admissions at The Third People’s Hospital of Chengdu, spanning from February 11, 2019, to May 26, 2023.
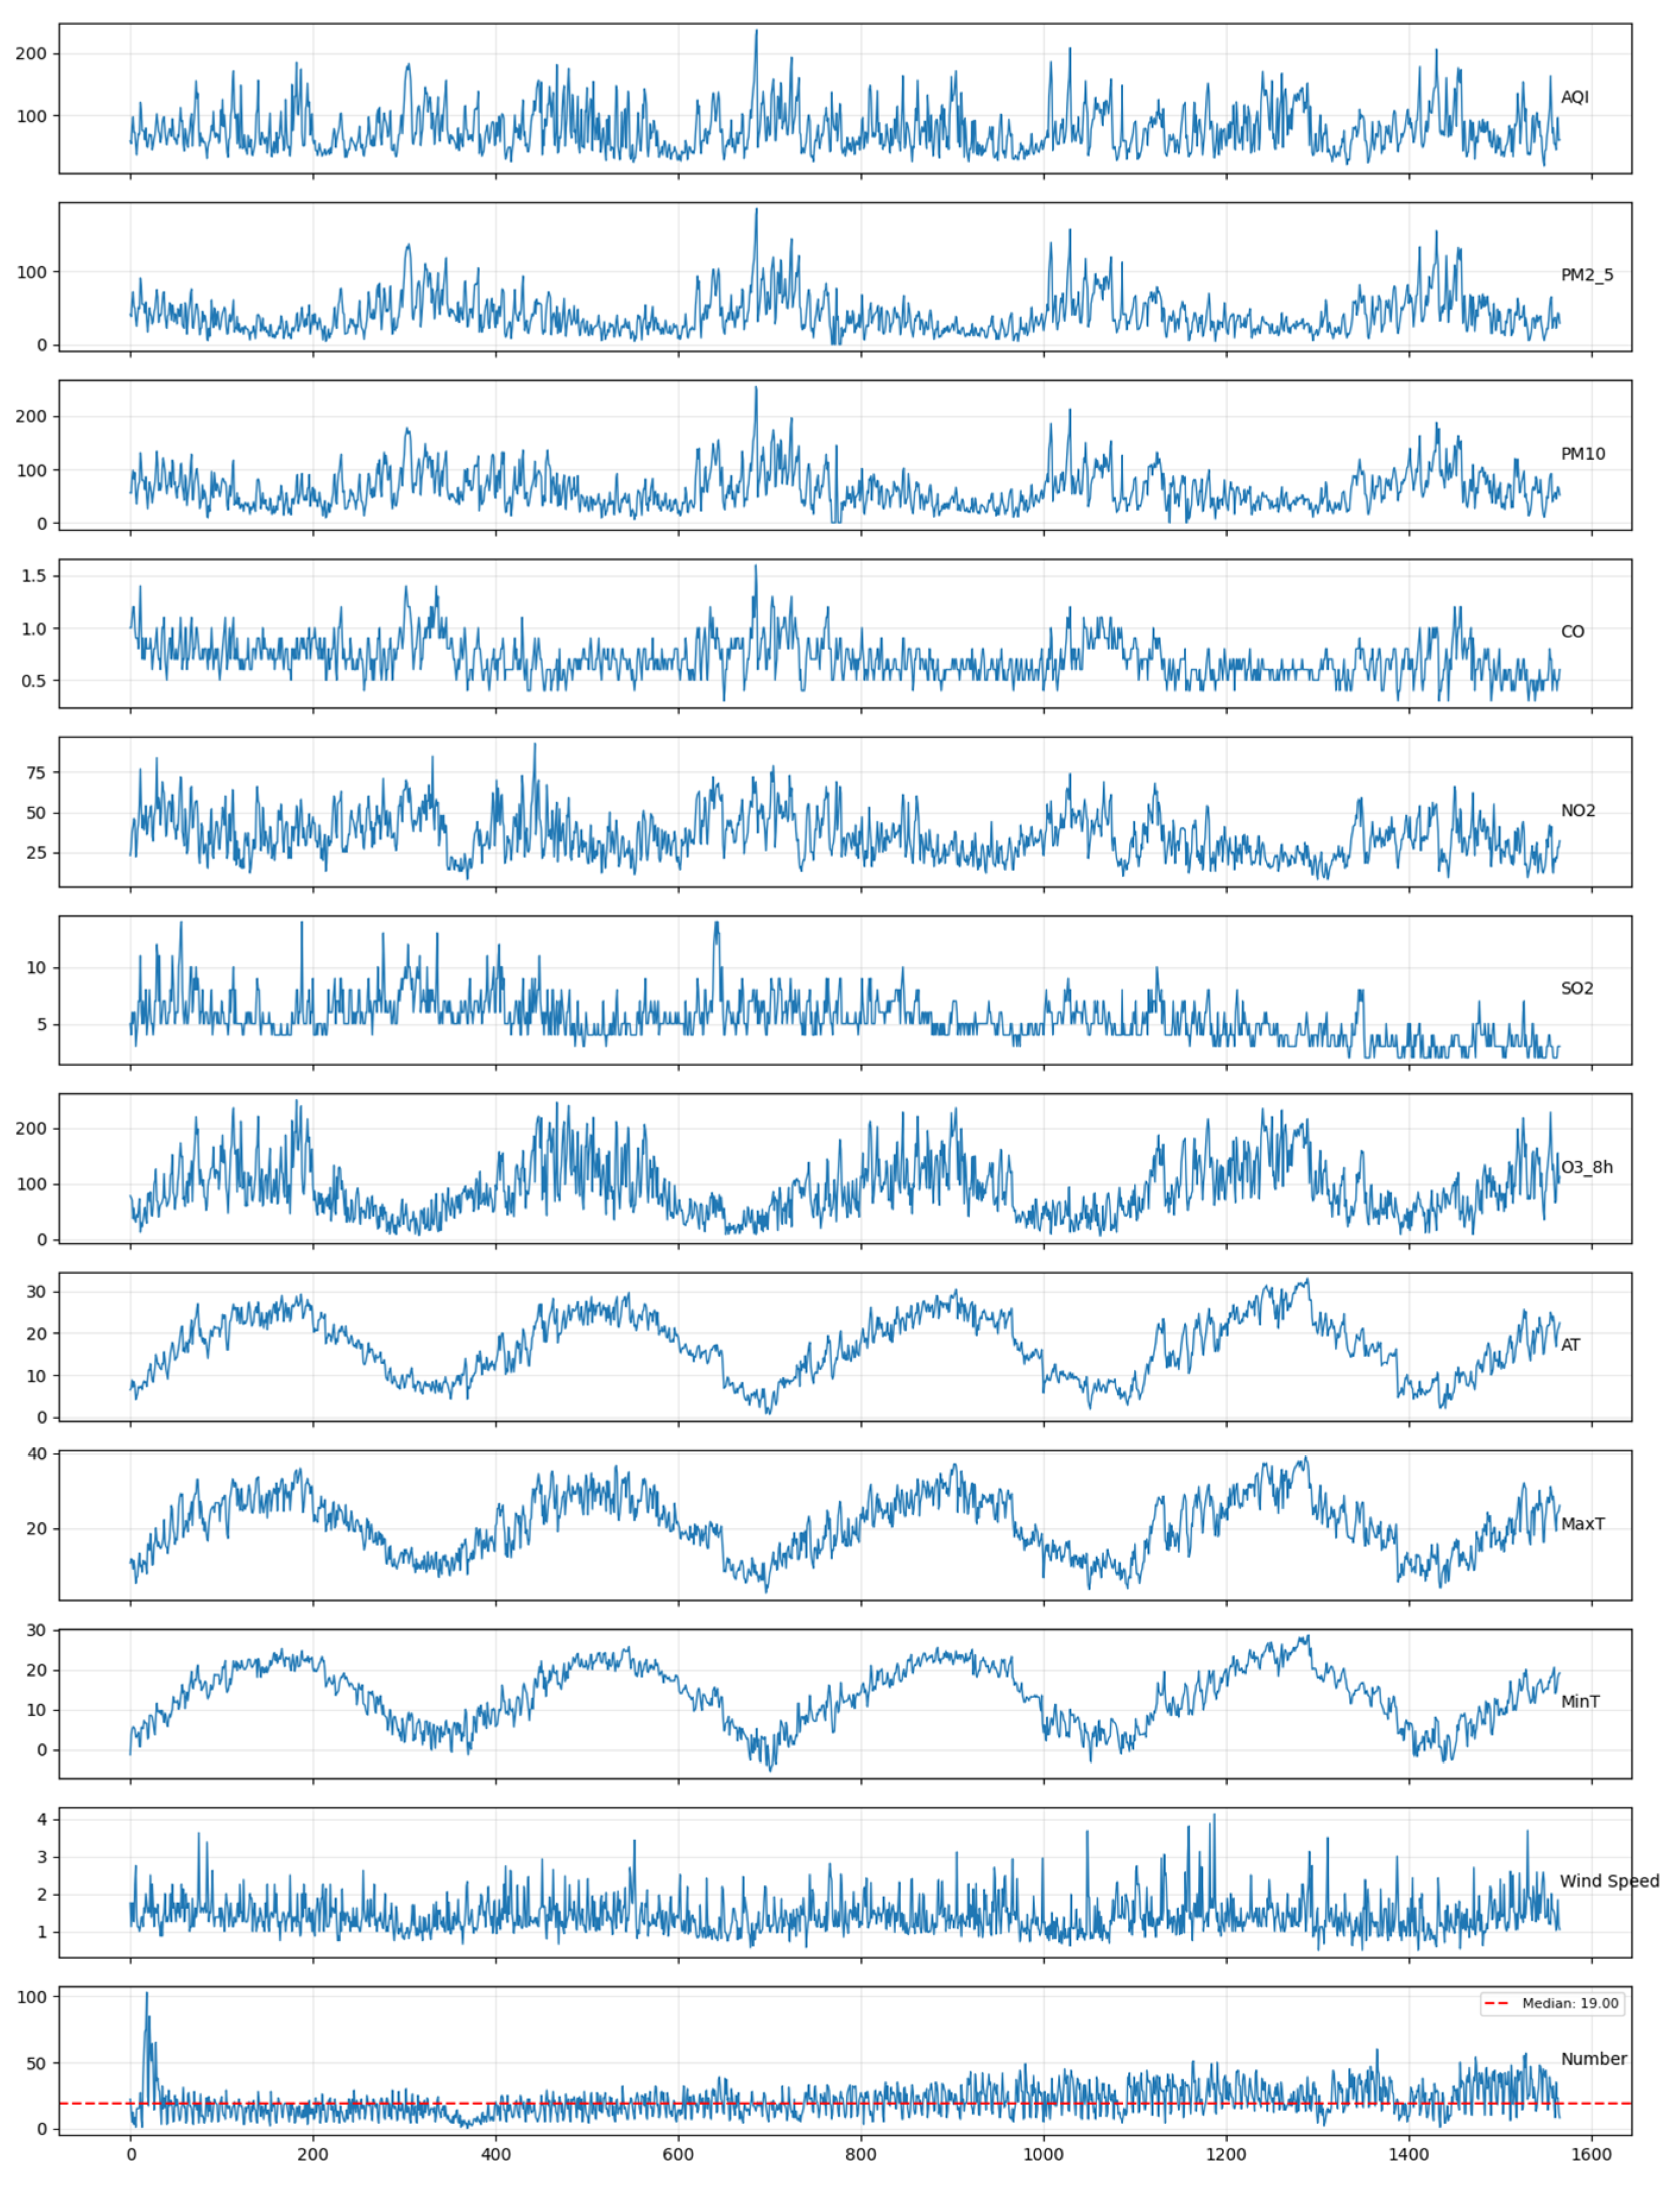
Figure 4.
(a) Distribution fitting plot for stroke admissions and (b) the Q-Q plot (R2=0.9889).
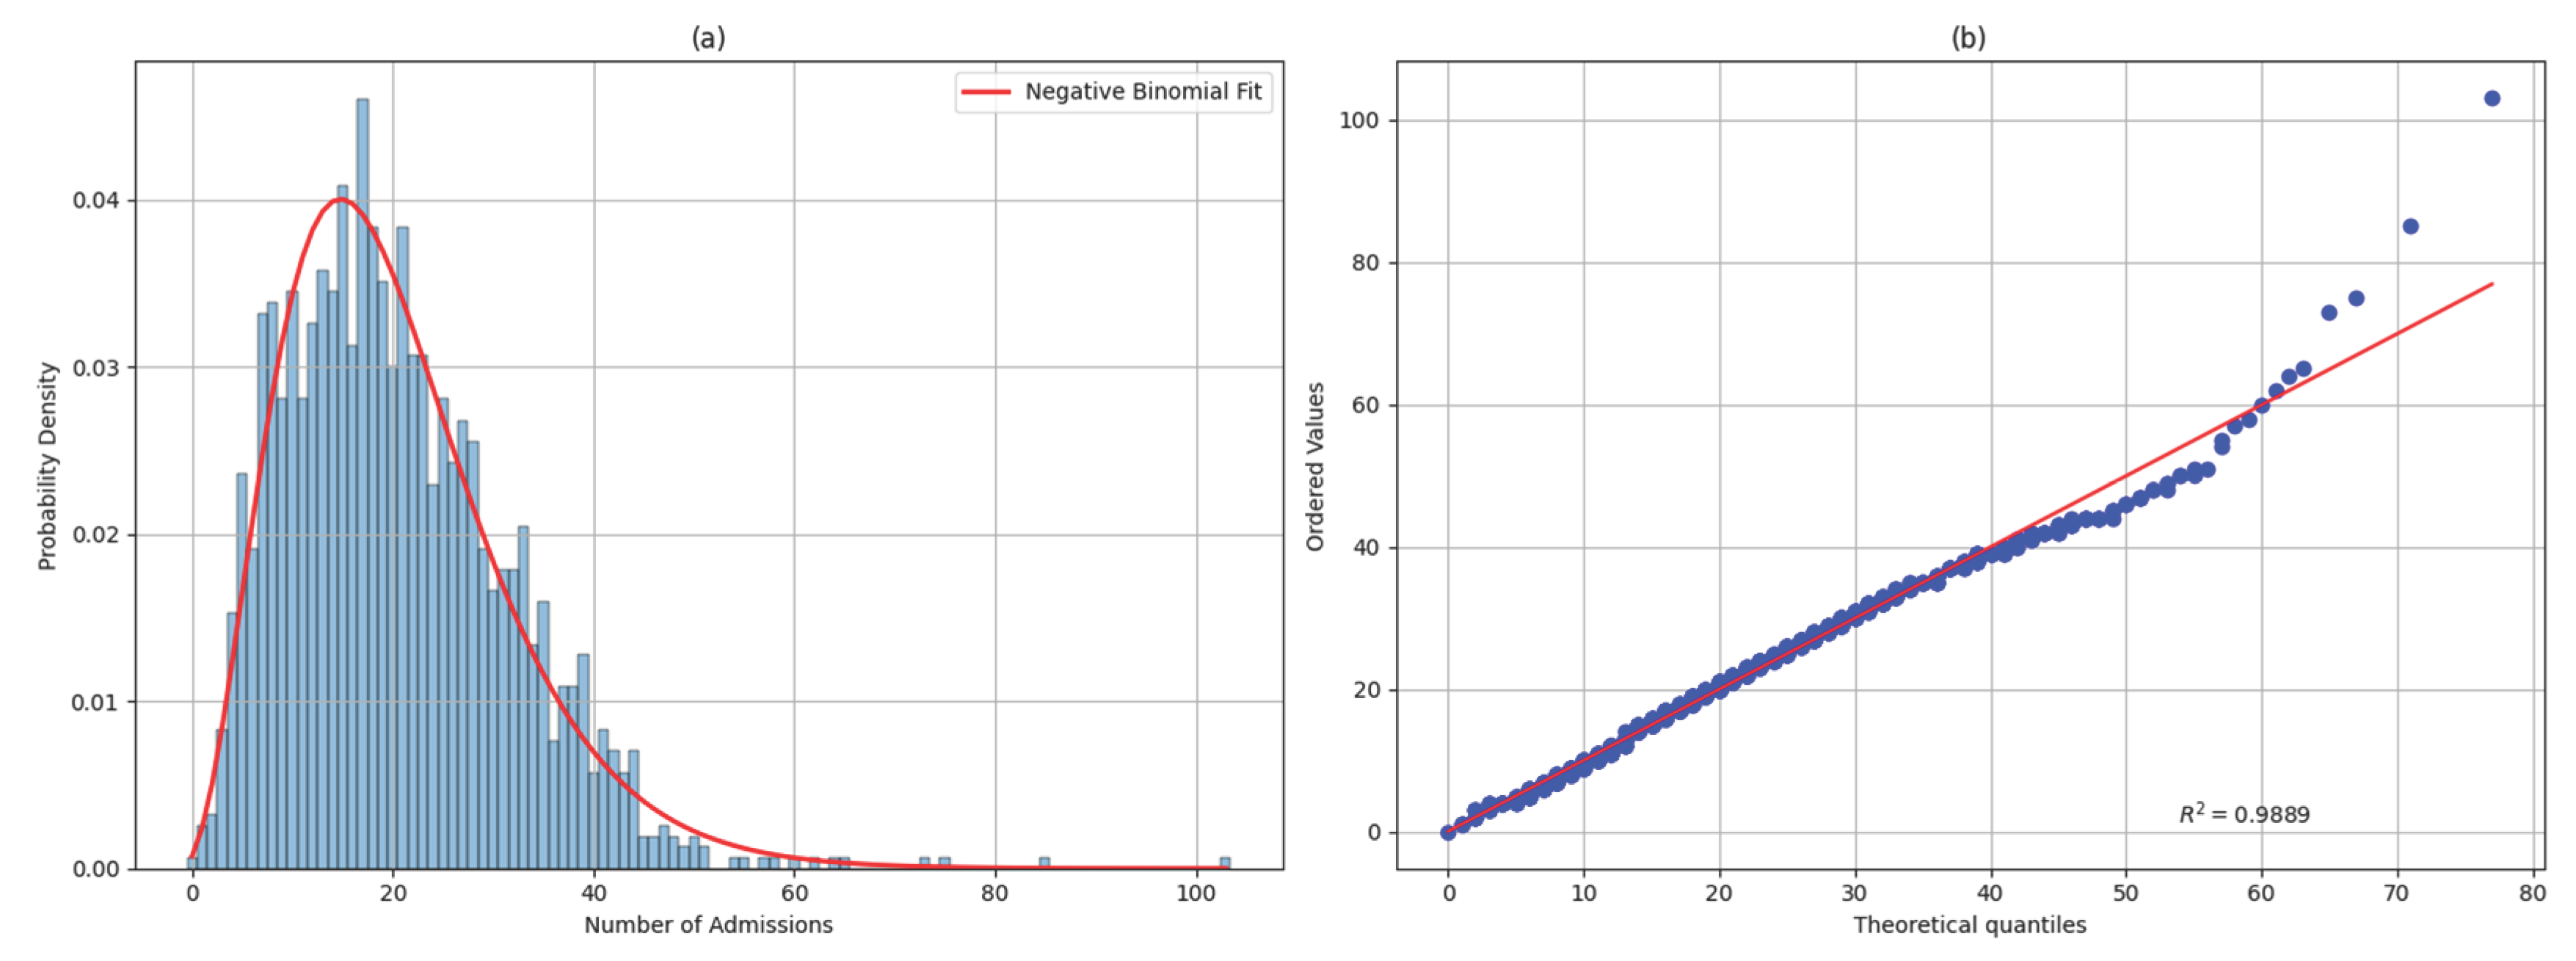

Table 1.
The finally selected variable features. A total of twenty-five variables, including environmental lagged features and seasonal interaction features, were used as input variables for the model.
Table 1.
The finally selected variable features. A total of twenty-five variables, including environmental lagged features and seasonal interaction features, were used as input variables for the model.
| Feature category | Feature variable | Note |
| Environmental lagged features | CO_lag3 | The lag term was selected by identifying the maximum CCF value over a 7-day window. |
| NO2_lag0 | ||
| SO2_lag0 | ||
| O3_8h_lag5 | ||
| MinT_lag1 | ||
| Seasonal interaction features | CO_lag3×season | Each combines a lagged air pollutant or meteorological parameter with a seasonal categorical variable. |
| NO2_lag0×season | ||
| SO2_lag0×season | ||
| O3_8h_lag5×season | ||
| MinT_lag1×season |
Table 2.
Comparative results of prediction performance metrics MAE and CRPS across different models.
Table 2.
Comparative results of prediction performance metrics MAE and CRPS across different models.
| Metrics | ||
| Model | MAE | CRPS |
| Negative Binomial Regression | 17.675 | 14.198 |
| NGBoost | 12.651 | 9.617 |
| LSTM(1-layer) | 13.177 | 10.059 |
| LSTM(2-layer) | 12.600 | 9.473 |
| Transformer(1-layer) | 12.096 | 9.040 |
| Transformer(2-layer) | 12.153 | 9.103 |
Disclaimer/Publisher’s Note: The statements, opinions and data contained in all publications are solely those of the individual author(s) and contributor(s) and not of MDPI and/or the editor(s). MDPI and/or the editor(s) disclaim responsibility for any injury to people or property resulting from any ideas, methods, instructions or products referred to in the content. |
© 2026 by the authors. Licensee MDPI, Basel, Switzerland. This article is an open access article distributed under the terms and conditions of the Creative Commons Attribution (CC BY) license.
Copyright: This open access article is published under a Creative Commons CC BY 4.0 license, which permit the free download, distribution, and reuse, provided that the author and preprint are cited in any reuse.