

Submitted:
16 May 2026
Posted:
18 May 2026
You are already at the latest version
Abstract
Chronic Mycobacterium tuberculosis (M.tb) infection reflects failure of sterilizing immunity and persistent pulmonary bacterial burden. While CD4+ T cells and IFN-γ are central to protection, the role of CD8+ T cells in chronic disease remains unclear. This study examined whether CD8+ T cells contribute to immune dysregulation during chronic tuberculosis through IL-10 production. Susceptible CBA/J and resistant C57BL/6 mice were infected with a low-dose aerosol of M.tb Erdman and followed for 150 days. Lung bacterial burden, cytokine responses, and T-cell populations were assessed using high-purity CD8+ T-cell isolation (>97%), ELISA, ELISPOT, and in vivo CD8+ depletion. In susceptible CBA/J mice, chronic infection was associated with progressive pulmonary accumulation of CD8+ T cells, reduced CD4:CD8+ ratios, increased IL-10 levels, and impaired bacterial control. Antigen-experienced CD8+ T cells were a major source of IL-10, which correlated with reduced IFN-γ responses and higher bacterial burden. CD8+ depletion during chronic infection was associated with reduced bacterial burden and increased IFN-γ responses. Resistant C57BL/6 mice showed limited expansion of IL-10-associated CD8+ responses and better bacterial control. These findings support a model in which chronic M.tb infection is associated with expansion of IL-10-producing CD8+ T cells in susceptible hosts and altered immune control. CD8+ T-cell modulation during chronic disease is associated with changes in bacterial burden, suggesting a contributory role in disease outcome. These results highlight CD8+ T-cell functional polarization as a factor to consider in tuberculosis pathogenesis and vaccine design.
Keywords:
Mycobacterium tuberculosis (M.tb)
; chronic infection
; CD8+ T cells
; IL-10 (interleukin-10)
; immune dysregulation
; pulmonary bacterial burden
; IFN-γ (interferon-gamma)
; susceptible mice (CBA/J)
; CD8+ depletion
; pathogenesis
1. Introduction
Tuberculosis (TB) remains a major global health challenge and a leading cause of mortality from a single infectious agent [1]. The disease is caused by the intracellular pathogen Mycobacterium tuberculosis (M.tb), first isolated in 1882 by Robert Koch [2]. A seminal study by Cyktor et al. examined CD8+ T cell dysfunction during chronic M.tb infection in the same CBA/J susceptible mouse model used in the present work [3]. That study identified accumulation of IL-10-producing CD8+ T cells with a dysfunctional phenotype (PD-1+, Tim-3+, CD122+) and showed these cells expressed a restricted T cell receptor (TCR) repertoire dominated by Vβ8 and Vβ14 chains [3]. Critically, in vivo CD8+ T cell depletion conducted during days 90-120 of infection did not significantly alter pulmonary bacterial burden in that work, leading the authors to conclude that the significance of IL-10-producing CD8+ T cells in tuberculosis pathogenesis remained unclear [3]. In the present study, we re-examined this question by conducting CD8+ T cell depletion beginning at day 100 and extending through day 150 of chronic infection, hypothesizing that the pathogenic role of IL-10-producing CD8+ T cells may become more pronounced during the late chronic phase of infection when these regulatory populations are fully established. While primarily a pulmonary pathogen, M.tb can disseminate through the bloodstream to involve extrapulmonary organs, including the spleen, liver, and lymph nodes [4]. Tuberculosis remains one of the leading infectious causes of death worldwide, accounting for approximately 10 million new cases annually [5]. Consequently, the World Health Organization (WHO) has prioritized a 90% reduction in TB-related deaths by 2030, a goal that necessitates a deeper understanding of the molecular and immunological mechanisms governing infection, latency, and reactivation [6]. Host control of M.tb depends on coordinated innate and adaptive immune responses, particularly cytokine-driven macrophage activation [7]. For decades, the protective Th1 response defined by the production of IL-12 and IFN-γ has been the central focus of research. IL-12 initiates cell-mediated immunity, while IFN-γ enhances the microbicidal capacity of macrophages, stimulating the production of antimicrobial effector molecules [8]. While initially attributed to CD4 T cells, it is now established that Natural Killer (NK) and CD8+ T cells also contribute significantly to the IFN-γ pool [9,10]. However, the complexity of the host-pathogen relationship and the ability of M.tb to subvert these defenses remain primary obstacles to eradication [11]. Accumulating evidence suggests that persistent antigen exposure during chronic infection can functional reprogramming of T cell populations, leading to the acquisition of regulatory phenotypes [12]. A key player in this immunosuppression is Interleukin-10 (IL-10), which antagonizes pro-inflammatory cytokines in the lungs [13]. IL-10 directly inhibits macrophage effector functions, including the production of reactive intermediates, major histocompatibility complex class II (MHCII) expression, and antigen presentation, thereby promoting bacterial persistence [14]. Although IL-10-producing CD8+ T cells were previously identified during chronic M.tb infection, their direct contribution to bacterial persistence and immune suppression remained unresolved [15]. While previous studies identified IL-10-secreting CD8+ T cells during chronic M.tb infection, the direct contribution of these cells to bacterial persistence and suppression of protective immunity remained unresolved. In this study, we investigated the dynamics and functional properties of CD8+ T cells during chronic M.tb infection using susceptible CBA/J and resistant C57BL/6 murine models [16]. We hypothesized that chronic infection promotes the accumulation of IL-10–producing CD8+ T cells that suppress protective immunity. By combining bacterial burden analysis, cytokine profiling, ELISPOT assays, and targeted cell depletion, we suggest that CD8+ T cells adopt an immunoregulatory phenotype during chronic tuberculosis. These findings suggest that vaccine strategies aimed at broadly enhancing CD8+ T cell responses may require careful consideration, as chronic stimulation could promote immunoregulatory phenotypes that facilitate M.tb persistence [17].
2. Materials and Methods
2.1. Mice
Female CBA/J and C57BL/6 mice strains, two widely used murine models for tuberculosis research, were purchased from the Jackson Laboratory, acclimated and maintained in biosafety level 3 facilities at The Ohio State University (OSU) [18]. The mice were 6-8 weeks old and specifically pathogen-free [19]. All animal procedures were approved by The Ohio State University Institutional Animal Care and Use Committee (IACUC) and performed in accordance with institutional biosafety and animal welfare guidelines [20]. Mice were assigned to experimental groups according to strain and treatment condition. Formal randomization procedures were not used.
2.2. Bacterial Strain and Infection Procedure
M.tb str. Erdman (ATCC# 35801) was purchased from American Type Culture Collection (Manassas, VA) and grown in liquid medium containing 0.05% Tween 80 to the mid-log phase [21]. Bacterial suspensions were aliquoted and stored at -80 °C for future use [22]. CBA/J and C57BL/6 mice were exposed using an inhalation system (Glas-Col-Figure 1). The nebulizer compartment of an airborne infection device (Middlebrook, Terre Haute, Ind.) was filled with a suspension M.tb str. Erdman and calibrated to deliver 50 to 100 CFU viable bacteria per mouse lung during 30 min of exposure [23]. Lung bacterial tallies were calculated by culturing serial dilutions of whole-organ homogenates onto Middlebrook 7H11 agar (Life Technologies, Gaithersburg, Md.) [24], and colonies were counted 21 days post incubation at 37 °C. Data are shown as the log10 value of the mean number of bacteria recovered per organ (n = 4).
2.3. Infected Lung Cells Isolation
Mice were euthanized using CO2, and the thoracic cavity was opened for lung tissue collection. Ten (10) ml of saline buffer containing heparin (50 U/ml; Sigma, St Louis, Mo.) was introduced into the pulmonary artery to perfuse the lungs of erythrocytes and blood. The perfused lungs were carefully removed and placed in cold Dulbecco’s modified Eagle medium (DMEM) (Life Technologies, Gibco-BRL, Grand Island, N.Y.). The lungs were disrupted using sterile razor blades following the removal of the connective tissue and trachea and incubated for 30 min at 37 °C in a final volume of 2 ml of DMEM containing collagenase XI (0.7 mg/ml; Sigma) and type IV bovine pancreatic DNase (30 μg/ml; Sigma). In addition, 10 ml of DMEM was added to stop enzymatic reactions. Digested lungs were filtered and centrifuged at 300 × g. The remaining red blood cells were lysed using ACK lysis buffer (0.15 M NH4Cl, 1.0 mM KHCO3). Cells were resuspended in DMEM plus 10% heat-inactivated fetal calf serum (Gibco-BRL), 1% 1 M HEPES buffer (Sigma), 1% L-glutamine (200 nM; Sigma), and 2% modified Eagle medium-nonessential amino acids (100×; Sigma). Cells were counted using a hemocytometer, and the absolute number per lung was calculated.
2.4. Cells Purification and Culture
CD8+ and CD4+ T-cells were purified from a pool of lung cells overlaid onto HISTOPAQUE 1083 (Sigma) and centrifuged at 400 × g for 30 min without brake to obtain live mononuclear cells. Adherent cells were removed by incubation at 37 °C with 5% CO2 for 1 h. CD8+ cells were isolated using CD8+ a MicroBeads (Miltenyi Biotec, Auburn, CA) according to the manufacturer’s instructions. Cells were passed over two columns to increase the purity of CD8+ cells, which was more than 97% for all samples. Viable cells were determined by trypan blue exclusion, counted, and resuspended at 2 × 10⁶/ml. Lung cells (2.5 × 10⁵) were cultured in duplicate with 10 μg/ml of OVA (Sigma-Aldrich), M.tb culture filtrate protein (National Institutes of Health, National Institute of Allergy and Infectious Diseases), or Concanavalin A (Con A) (Sigma-Aldrich) for 72 h at 37 °C. Supernatants were stored at −80 °C until analysis.
2.5. In Vivo CD8+ T Cell Depletion
To evaluate the contribution of CD8+ T cells during established chronic M.tb infection, in vivo CD8+ T-cell depletion was initiated during the late chronic phase of disease (day 100 post-infection) and maintained through day 150. Anti-CD8+ monoclonal antibody (clone 53-6.72; BioXCell) or isotype-matched rat IgG2a control antibody (clone 2A3; BioXCell) were diluted to 2.5 mg/mL in sterile PBS and stored at −80 °C until use. At day 100 post-infection, mice received 0.5 mg antibody via intraperitoneal injection, followed by additional 0.5 mg injections every 5 days through day 150 (days 105, 110, 115, 120, 125, 130, 135, 140, 145, and 150). This regimen was designed to maintain sustained CD8+ T-cell depletion throughout the late chronic phase of infection [25]. At the initiation of depletion, CBA/J mice exhibited established pulmonary infection characterized by approximately 6–7 log10 CFU in the lungs. At day 150 post-infection, lungs were harvested for bacterial burden analysis and flow cytometric confirmation of CD8+ T-cell depletion efficiency.
2.6. Enzyme-Linked Immunospot (ELISPOT) Assay for IFN-γ and IL-10 Producing CD8+ T Cells
The frequency of antigen-specific IFN-γ and IL-10 producing CD8+ T cells in infected mouse lungs was quantified using ELISPOT assays (Millipore, Billerica, MA), following the manufacturer’s instructions with minor modifications. Briefly, 96-well Immobilon-P membrane plates were coated overnight at 4 °C with purified anti-mouse IFN-γ or anti-mouse IL-10 capture antibodies (eBioscience) diluted in sterile phosphate-buffered saline (PBS) [26]. Plates were washed three times with PBS and blocked for 2 hours at room temperature with complete DMEM supplemented with 10% fetal bovine serum.
Purified lung CD8+ T cells were resuspended in complete medium and seeded at 2 × 10⁵ cells per well in triplicate [27]. Cells were co-cultured with fixed dendritic cells at a 1:1 ratio in the presence of M.tb culture filtrate protein (CFP, 10 µg/ml) [28]. Wells containing unstimulated cells served as negative controls, while Concanavalin A (5 µg/ml) stimulated wells served as positive controls.
Plates were incubated for 72 hours at 37 °C in a humidified 5% CO2 incubator. Following incubation, cells were removed by washing with PBS containing 0.05% Tween-20. Biotinylated detection antibodies specific for IFN-γ or IL-10 were added and incubated for 2 hours at room temperature. After washing, streptavidin-alkaline phosphatase conjugate was applied for 1 hour.
Spots were developed using BCIP/NBT substrate solution until distinct spot formation was observed and the reaction was stopped by rinsing with distilled water. Plates were air-dried and analyzed using an automated ELISPOT reader system (Cellular Technology Limited). Results were expressed as spot-forming units (SFU) per 2 × 10⁵ CD8+ T cells after subtraction of background counts from unstimulated wells.
2.7. Statistical Analysis
Statistical analyses were performed using GraphPad Prism (GraphPad Software, San Diego, CA, USA). Data are presented as mean ± standard error of the mean (SEM). Differences between groups were analyzed using Student’s t-test, one-way ANOVA, or two-way ANOVA followed by Tukey’s multiple-comparison test, as appropriate. A p value < 0.05 was considered statistically significant. Study design and data handling. Experimental group sizes were selected based on prior experience and published studies using chronic M.tb infection models. Data distribution was assumed to be approximately normal based on established characteristics of these experimental datasets; formal normality testing was not performed. No animals or data points were excluded from the analyses. Investigators were not blinded during allocation, experimentation, outcome assessment, or data analysis.
3. Results
3.1. Differential Bacterial Kinetics and Lung Pathology in Susceptible and Resistant Models
To characterize the progression of chronic tuberculosis, we compared the bacterial burden in susceptible CBA/J and resistant C57BL/6 mice following a low-dose aerosol infection (50-100 CFU) [29]. In C57BL/6 mice, the pulmonary bacterial load stabilized at approximately 105 CFU by day 21 and remained constant throughout the 150-day observation period. In contrast, CBA/J mice failed to achieve bacterial stasis; pulmonary CFU counts increased progressively, reaching significantly higher levels than C57BL/6 mice by day 60 (p < 0.01) and continuing to rise through day 150 (Figure 1) [30]. This uncontrolled bacterial proliferation in CBA/J mice was associated with extensive lung consolidation and progressive granulomatous pathology [31].
3.2. T Cell Recruitment and Altered CD4:CD8+ Ratios During Chronic Infection
The absolute numbers of T cell subsets recruited to the lungs were quantified to assess the host response. Both strains exhibited a robust influx of CD4+ and CD8+ T cells during the acute phase (day 21) [32]. However, during the chronic phase (days 60–150), the T cell dynamics diverged significantly [33]. While C57BL/6 mice maintained a stable and dominant CD4+ T cell population, CBA/J mice showed a disproportionate accumulation of CD8+ T cells (Figure 2) [34]. Consequently, the CD4:CD8+ ratio in the lungs of CBA/J mice declined significantly over time, dropping below 1.0 by day 120, whereas C57BL/6 mice maintained a ratio consistently above 2.0.
3.3. Elevated IL-10 Production in Susceptible CBA/J Lungs
Given the progressive disease in CBA/J mice despite high T cell numbers, we analyzed the cytokine profile of lung homogenates using ELISA to identify potential suppressive factors. While IFN-γ levels were initially comparable, we observed a dramatic and sustained increase in IL-10 concentrations in the lungs of CBA/J mice starting at day 60 (Figure 3). In contrast, C57BL/6 mice exhibited minimal IL-10 production throughout the infection. The onset of significantly elevated IL-10 in CBA/J mice correlated temporally with the loss of bacterial control and the declining CD4:CD8+ ratio [35].
3.4. Accumulation of IL-10-Secreting CD8+ T Cells in Susceptible Mice
To determine the cellular source of IL-10, we performed ELISPOT assays on highly purified (>97%) CD8+ T cells isolated from the lungs during the chronic phase. CD8+ T cells from CBA/J mice exhibited a significantly higher frequency of IL-10-producing spot-forming units (SFU) compared to those from C57BL/6 mice when stimulated with M.tb culture filtrate protein (CFP) (Figure 4). Parallel assays for IFN-γ revealed that while CD8+ T cells in resistant mice remained predominantly IFN-γ producers, a substantial fraction of CD8+ T cells in susceptible mice exhibited an immunoregulatory cytokine profile characterized by elevated IL-10 production [36].
3.5. CD8+ T Cell Depletion Restores Bacterial Control in CBA/J Mice
To evaluate whether these IL-10-producing CD8+ T cells were actively contributing to disease susceptibility, we performed in vivo cell depletion during the chronic phase (starting at day 100) [37]. The depletion of CD8+ T cells in CBA/J mice resulted in a statistically significant reduction in pulmonary bacterial burden by day 150 compared to isotype-treated controls (Figure 5). Furthermore, this reduction in bacterial load was accompanied by a restoration of IFN-γ levels in the lung tissue. These findings support the conclusion that during chronic infection in susceptible hosts, CD8+ T cells adopt a pathogenic, immunoregulatory role that associated with impaired Th1-associated immune responses [38].
4. Discussion
4.1. Comparison with Previous Work and Resolution of Apparent Contradictions
Our findings represent a significant advance over previous investigations of CD8+ T cell function during chronic Mtb infection, particularly with respect to work by Cyktor et al. (2013) that examined the same biological system in the same susceptible CBA/J mouse model [3]. While Cyktor et al. demonstrated that IL-10-producing CD8+ T cells accumulate during chronic infection and display dysfunctional phenotypes (PD-1+, Tim-3+, CD122+), they found that in vivo CD8+ T cell depletion during days 90-120 post-infection did not significantly alter bacterial burden, leading them to conclude that the pathogenic significance of these cells remained uncertain [3]. In contrast, our data support that CD8+ T cell depletion beginning at day 100 and continuing through day 150 post-infection produces a statistically significant reduction in pulmonary CFU and restoration of protective IFN-γ responses [3]. These findings may reflect a temporal dependence in CD8+ T cell-mediated immune suppression during chronic TB [39].
4.2. Temporal Evolution of CD8+ T Cell Pathogenic Function: A Model of Progressive Functional Subversion
We propose that the differing outcomes between our depletion study and that of Cyktor et al. reflect the progressive functional reprogramming of CD8+ T cells as chronic infection advances [3]. Our mechanistic model posits that during the early-to-mid chronic phase (days 60-120), IL-10-producing CD8+ T cells exist in a transitional state characterized by mixed IL-10/IFN-γ secretion or contain a heterogeneous population of cells with variable regulatory capacity [40,41]. During this period, documented by Cyktor et al., the IL-10-suppressive function of CD8+ T cells may be counterbalanced by their residual or concurrent IFN-γ production, explaining why their depletion did not yield a net benefit to bacterial control [3]. Importantly, Cyktor et al. observed that Vβ8+ CD8+ T cells exhibited dual IL-10/IFN-γ secretion profiles, suggesting that individual cells or subpopulations within the expanded CD8+ pool maintained protective capacity even in the presence of robust IL-10 production [3].
In contrast, during the late chronic phase (days 100-150 that we examined), prolonged antigenic exposure and progressive inflammatory stimulation drive further functional commitment of CD8+ T cells toward an IL-10-dominant regulatory phenotype [38]. By this later timepoint, we propose that the CD8+ T cell population has undergone more pronounced immunoregulatory polarization, with IL-10 production becoming the dominant function while protective IFN-γ production is substantially suppressed [42]. This model may explain why late-phase depletion (our work) produces significant bacterial control while early-phase depletion (Cyktor et al.) did not. The extended duration of our depletion regimen (50 days, from day 100-150) versus Cyktor’s protocol (30 days, from day 90-120) also provides a longer window to detect and allow detection of restored protective immunity that emerges after CD8+ removal [43]. This temporal evolution hypothesis is supported by our finding that IFN-γ levels are restored following CD8+ T cell depletion (Figure 5C) [44]. Restoration of protective IFN-γ indicates that CD4+ T cells retain the capacity to produce this critical cytokine but are suppressed by the concurrent presence of IL-10-producing CD8+ T cells [45]. This suppression becomes more profound in the late chronic phase, explaining the benefit of depletion at this timepoint [45]. Early in infection (Cyktor’s timeframe), the suppression by mixed IL-10/IFN-γ CD8+ T cells may be more balanced, such that their removal eliminates both suppressive and protective functions simultaneously, yielding no net benefit [46].
4.3. Methodological Considerations in Comparing Depletion Studies
Several methodological factors likely contribute to the different outcomes between our CD8+ depletion study and that of Cyktor et al., all of which are consistent with the temporal evolution model: (1) Depletion Timing and Duration. Our depletion protocol initiated at day 100 (late chronic phase, established dysfunctional CD8+ population) and continued through day 150. Cyktor et al. depleted from days 90-120 (early-to-mid chronic phase, during initial CD8+ accumulation and transition) [3]. The timing difference is critical: by day 100, bacterial burden in susceptible CBA/J mice has reached plateau levels or is actively progressing with established CD8+ dysregulation; by days 90-120, the CD8+ population is still accumulating and transitioning to a regulatory phenotype [47]. (2) Depletion Intensity and Consistency. Both studies used anti-CD8+ antibody for in vivo depletion, but protocols differed [3]. Cyktor et al. administered 0.5 mg doses at weekly intervals beginning at day 90 through day 120 (approximately 4 injections) [3]. Our study administered 0.5 mg doses at 5-day intervals beginning at day 100 through day 150 (11 injections total), providing more frequent and sustained depletion coverage during the late chronic phase [48]. This more intensive regimen may be required to maintain adequate depletion when CD8+ T cells are maximally activated and proliferating [48]. (3) Endpoint Assessment. Cyktor et al. analyzed bacterial burden at day 125 post-infection (5 days after final antibody) [3]. We analyzed at day 150 (50 days into depletion, at the final injection timepoint) [48]. The longer interval post-final-depletion in their study may have allowed CD8+ T cell repopulation, obscuring the benefit of depletion [48]. Our analysis immediately at the end of sustained depletion may better capture the effect of complete CD8+ suppression [49]. (4) Bacterial Burden Baseline. At the initiation of depletion, bacterial loads differ between studies. In our hands, day 100 CBA/J mice harbor 6-7 log10 CFU; Cyktor et al.’s day 90 mice had lower burden, reflecting differences in inoculum preparation, animal age/sex, or housing conditions that can significantly impact mycobacterial growth kinetics [3]. The higher baseline burden in our depletion cohort may sensitize the system to reveal the suppressive role of CD8+ T cells more clearly. These methodological differences are not contradictions but rather variations that, when interpreted within the temporal evolution framework, become complementary rather than conflicting.
4.4. The Proposed Immunoregulatory Model and Functional Subversion
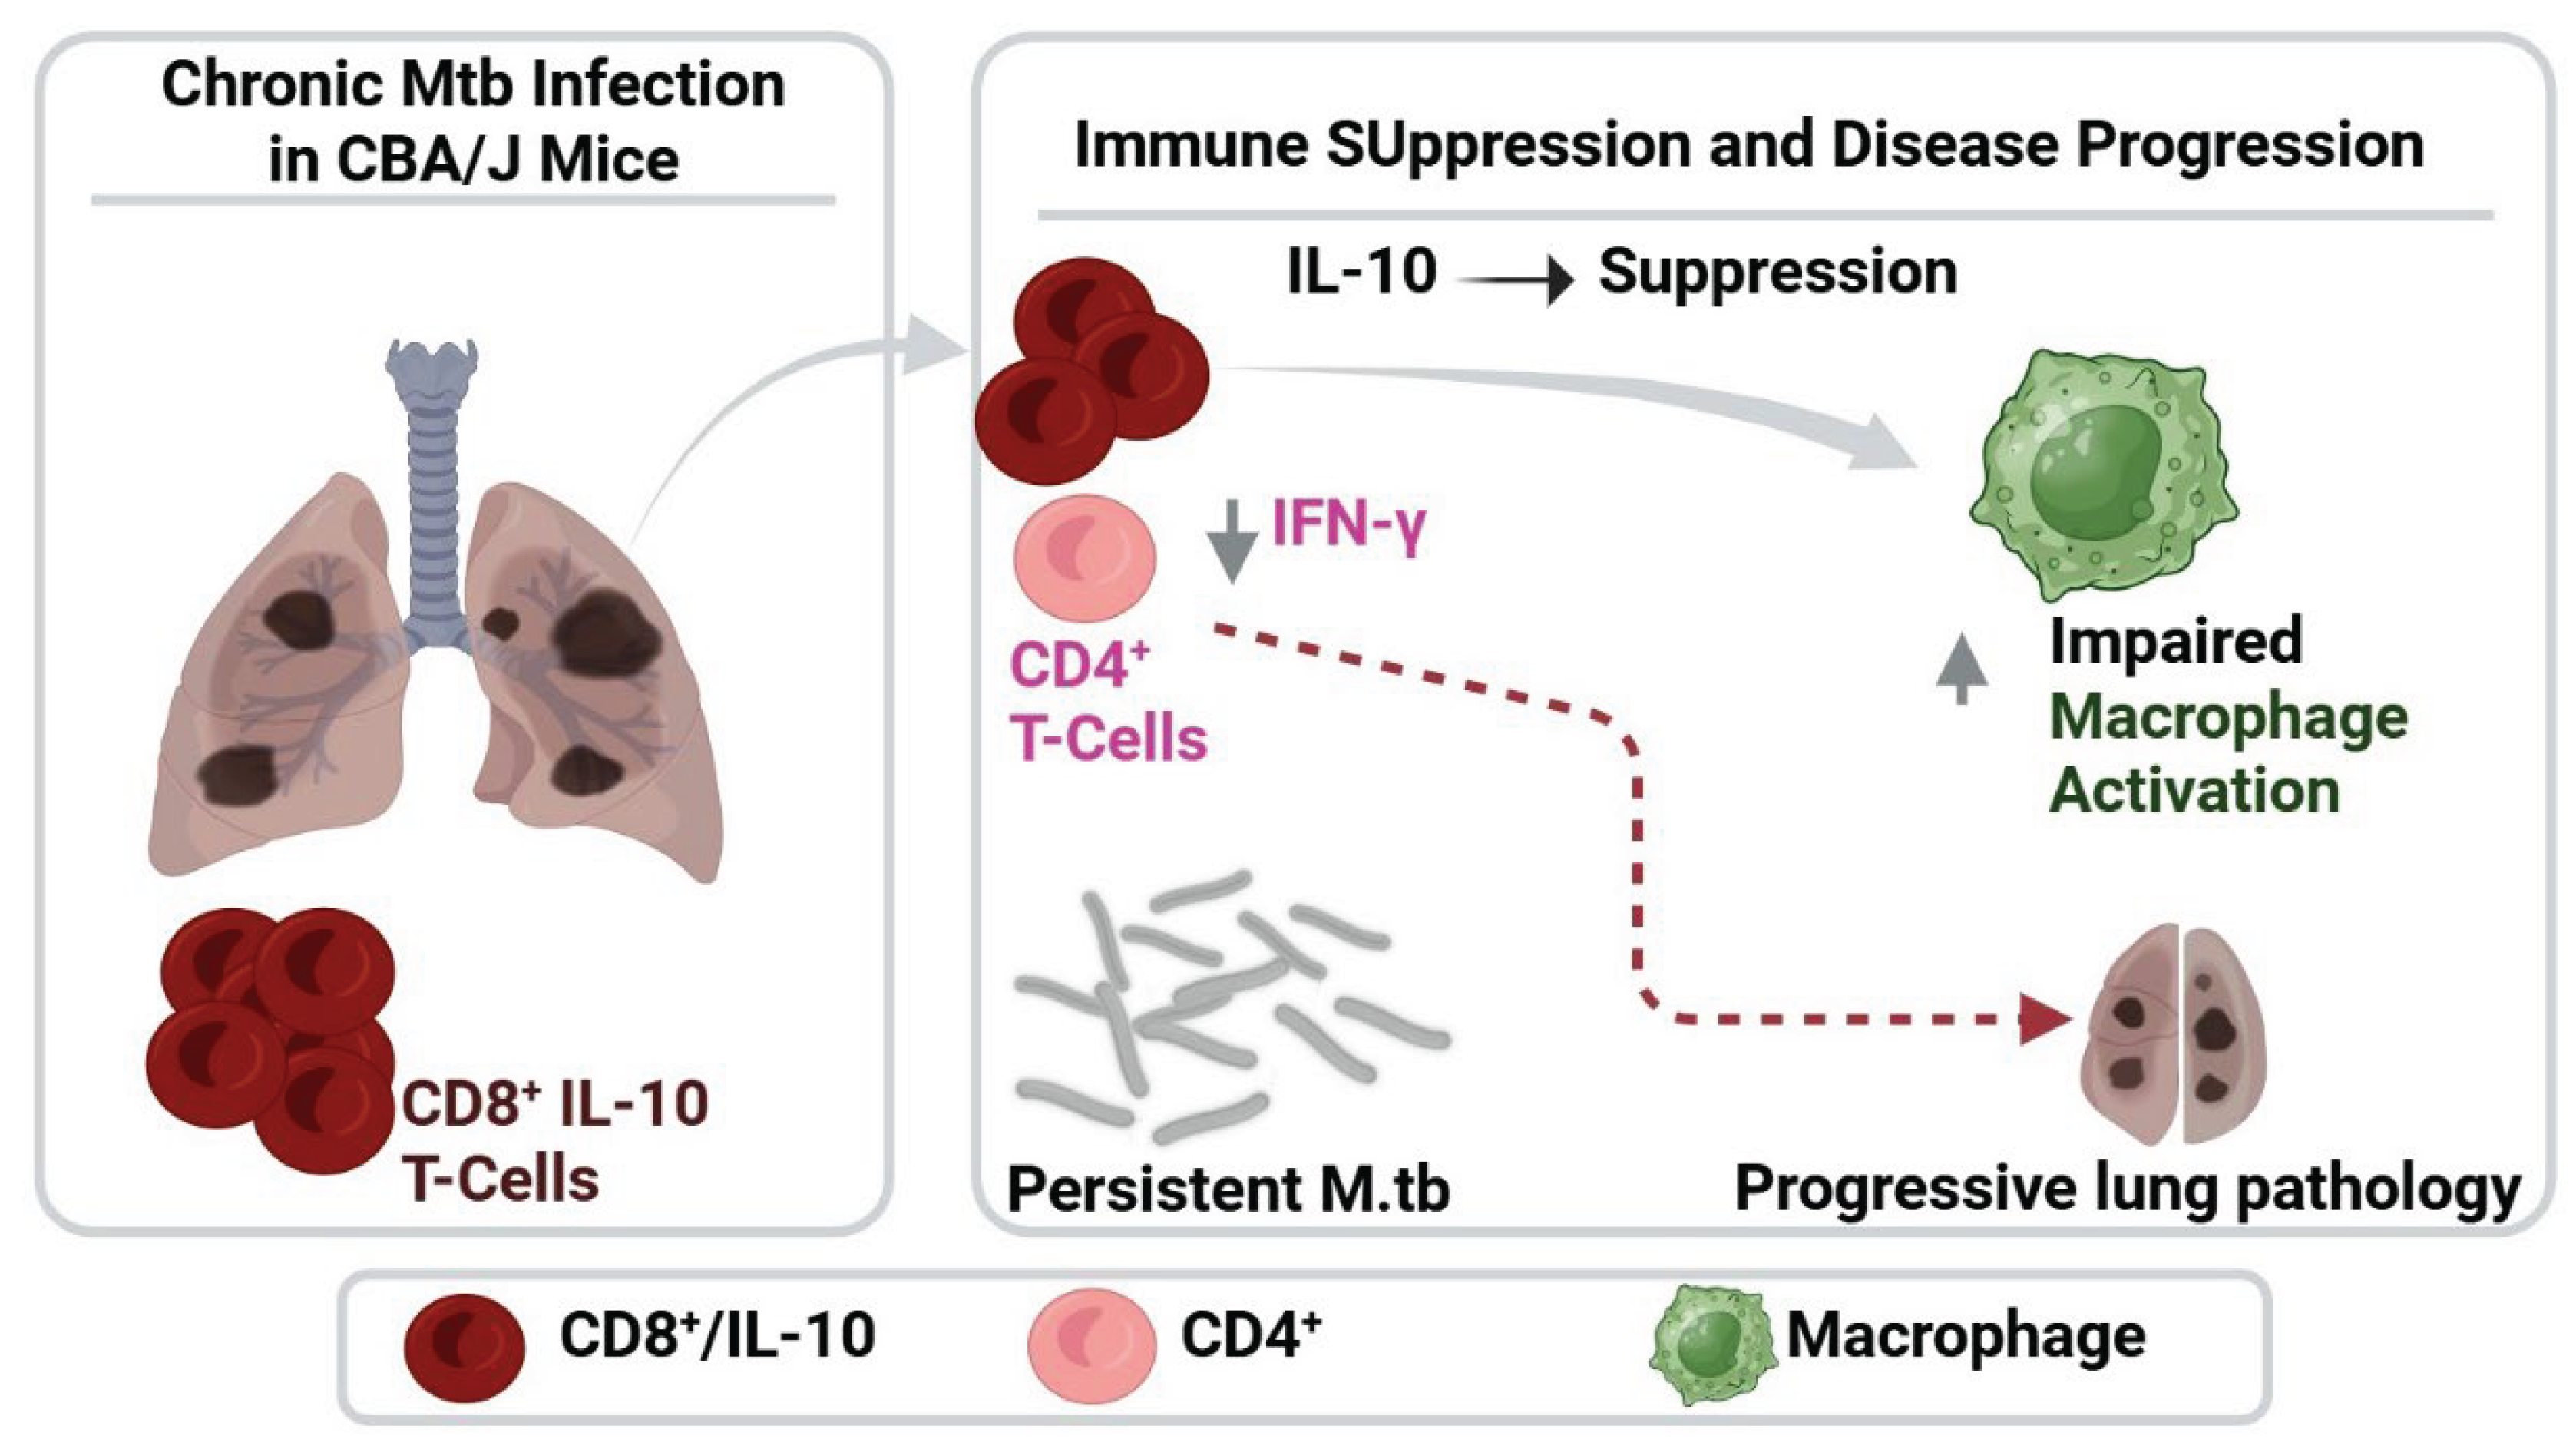
Based on our findings and synthesis with prior work, we propose an updated model of CD8+ T cell function during chronic TB infection (Figure 6) [50]. We distinguish between two phases: Early-to-Mid Chronic Phase (Days 60-120): CD8+ T Cell Transition [51]. During this period, CD8+ T cells accumulate in the lung and begin acquiring regulatory markers (PD-1, Tim-3, CD122) as documented by Cyktor et al. [3]. Critically, many of these cells maintain dual IL-10/IFN-γ secretion capacity (observed by Cyktor in Vβ8+ populations) [3]. The regulatory function of IL-10-producing CD8+ T cells is present but incompletely predominant [40]. Depletion during this phase removes both suppressive and protective CD8+ populations, yielding no net benefit to bacterial control (Cyktor et al. result) [3].
Late Chronic Phase (Days 120-150): CD8+ T Cell Commitment to Regulation [52]. Prolonged antigenic exposure and chronic inflammation drive progressive functional subversion of CD8+ T cells toward a committed IL-10-dominant regulatory phenotype [53]. IL-10 production may become the predominant function, and the population shifts from mixed cytokine secretion toward predominantly regulatory cells [53]. This complete commitment explains why depletion at this stage produces significant improvement in bacterial control and restoration of protective IFN-γ, the CD8+ population has become primarily suppressive with minimal residual protective capacity [54,55]. This model generates testable predictions regarding CD8+ T cell biology across the infection course: (1) IL-10/IFN-γ co-secreting cells should decrease proportionally from early to late chronic phase, with shift toward an IL-10-dominant phenotype increasing; (2) Exhaustion marker expression (PD-1, Tim-3) should increase with infection duration, reflecting progressive differentiation toward regulatory function; (3) TCR repertoire restriction (as documented by Cyktor et al. for Vβ8 and Vβ14) should remain consistent, indicating the same clonal populations expand but undergo functional evolution rather than clonal replacement [56,57,58].
4.5. CD4:CD8+ Imbalance and Disease Progression
The observed reduction in the CD4:CD8+ ratio in susceptible CBA/J mice during chronic infection (Figure 2C) further supports the pathogenic role of CD8+ T cells [59]. While superficially this appears to reflect impaired CD4+ T cell responses, our data indicates a more nuanced interpretation: the CD4+ T cell compartment retains the capacity to produce IFN-γ (Figure 5C baseline), but this response is actively suppressed by concurrent IL-10-producing CD8+ T cells [53]. CD8+ cell depletion reveals this suppressed CD4+ T cell potential, leading to restored IFN-γ [60]. Thus, the CD4:CD8+ imbalance reflects not primarily CD4+ dysfunction but rather overwhelming suppression of CD4+ responses by an expanded, IL-10-producing CD8+ population [60].
4.6. Implications for Tuberculosis Vaccine Design
Our findings have important implications for TB vaccine development [61]. Current vaccine strategies frequently emphasize induction of broad CD8+ T cell responses, under the assumption that more CD8+ T cells equals better protection [62]. Our work, combined with that of Cyktor et al., demonstrates that this assumption is overly simplistic [3]. The quality, functional commitment, and temporal regulation of CD8+ responses matter as much as their magnitude [39]. These findings suggest that vaccine-induced CD8+ T cell responses may require careful functional regulation during chronic antigen exposure [63]. However, if vaccination fails to rapidly clear infection and instead results in chronic antigenic exposure, the same vaccine-induced CD8+ T cells may progressively reprogram toward an IL-10-dominant suppressive phenotype, eventually contributing to disease rather than protection [64]. Vaccine strategies must therefore either: (1) be designed to clear infection rapidly before CD8+ reprogramming occurs, or (2) be combined with immunomodulatory approaches that prevent IL-10-driven suppression during the chronic phase [63,65].
5. Conclusions
In conclusion, our proposed model highlights the dualistic nature of CD8+ T-cell immunity during TB. In susceptible hosts, prolonged infection drives progressive functional reprogramming of CD8+ T cells from protective effectors toward IL-10-producing regulatory populations that favor bacterial persistence. The temporal dependence of this reprogramming-progressing from mixed IL-10/IFN-γ secretion in early chronic infection toward committed IL-10-dominant regulation in late chronic infection, explains how previous investigations (Cyktor et al., 2013) and the present work can reach apparently contradictory conclusions about CD8+ T cell depletion, when in fact they reveal a dynamic, time-dependent process of immune subversion. Although murine TB models may not fully recapitulate human disease, the identification of this time-dependent functional reprogramming provides a new framework for understanding immune failure during chronic tuberculosis [66]. Future investigations should test specific predictions of the temporal evolution model through multi-timepoint depletion experiments (days 60, 90, 120, 150) combined with single-cell analysis of IL-10/IFN-γ co-expression patterns and TCR clonal identity. Direct blockade of IL-10 receptor signaling during late chronic infection would establish whether the improved bacterial control we observe is IL-10-dependent. Finally, examination of CD8+ T cell function and IL-10 production in clinical TB patients with recurrent or severe disease may reveal whether similar regulatory reprogramming contributes to human TB pathogenesis and susceptibility to reactivation.
Supplementary Materials
None.
Author Contributions
I.V.: Formal Analysis, Writing-Review & Editing. K.S.M.: Writing-Review & Editing. B.D.A.: Conceptualization, Investigation, Methodology, Project Administration, Supervision, Data Curation, writing-Original Draft, Writing-Review & Editing. All authors have read and agreed to the published version of the manuscript.
Funding
This research was partially supported by the National Institutes of Health (NIH) R01 (AI-064522 J.T.).
Institutional Review Board Statement
The animal study protocol was approved by the Institutional Animal Care and Use Committee (IACUC) of The Ohio State University (protocol code 2006A0106, approved 5/18/2006 – 4/30/2009).
Informed Consent Statement
Not applicable.
Data Availability Statement
The experiments and data collection for this study were conducted approximately 18-19 years ago at a previous institution. Due to the elapsed time and historical data-retention policies of that institution, the original raw datasets are no longer available. All processed data, figures, and study contributions generated or analyzed during this study are fully included in this published article and its supplementary materials.
Acknowledgments
We gratefully acknowledge our colleagues at The Ohio State University for their valuable guidance and insightful comments on the earlier design of this project. We also thank our current colleagues in the Department of Biology and Health Sciences for their technical assistance, as well as the laboratory staff and the Office of Research Services (ORS) team at Kwantlen Polytechnic University for creating and maintaining a supportive research environment. Finally, we extend our appreciation to Cathy Parlier for her constant assistance with administrative paperwork, which allowed us to focus on our studies.
Conflicts of Interest
The authors declare no conflicts of interest.
References
- Global Tuberculosis Report 2020 : Executive Summary. World Health Organization, 2020.
- “Essentials of Tuberculosis in Children - Rakesh Lodha, SK Kabra, Vimlesh Seth - Google Books.” Accessed: May 12, 2026. [Online]. Available: https://books.google.ca/books?hl=en&lr=&id=016vEAAAQBAJ&oi=fnd&pg=PA31&dq=The+disease+is+caused+by+the+intracellular+pathogen+Mycobacterium+tuberculosis+(M.tb),+first+isolated+in+1882+by+Robert+Koch&ots=zoe1uXnRWt&sig=_uFOTXgkwAZFwJdzxCwavllyc_8&redir_esc=y#v=onepage&q&f=false.
- J. C. Cyktor, B. Carruthers, G. L. Beamer, and J. Turner, “Clonal Expansions of CD8+ T Cells with IL-10 Secreting Capacity Occur during Chronic Mycobacterium tuberculosis Infection,” PLoS One, vol. 8, no. 3, p. e58612, Mar. 2013. [CrossRef]
- M. H. Arsyad, I. Syafina, H. Hapsah, and H. Hervina, “Knowing and Understanding the Tuberculosis (Tb) Disease of the Lung (Literature Review),” International Journal of Natural Science Studies and Development (IJOSS), vol. 1, no. 2, pp. 56–85, Dec. 2024. [CrossRef]
- P. Glaziou, K. Floyd, and M. Raviglione, “Global Epidemiology of Tuberculosis,” Semin. Respir. Crit. Care Med., vol. 39, no. 03, pp. 271–285, Jun. 2018. [CrossRef]
- “SDG Target 3.3 Communicable diseases.” Accessed: May 12, 2026. [Online]. Available: https://www.who.int/data/gho/data/themes/topics/sdg-target-3_3-communicable-diseases.
- S. E. Barry, A. Sawka, A. Maldari, J. Inauen, S. LaBroome, and J. B. Geake, “Macrophage Dysfunction in Tuberculosis–Diabetes Mellitus Comorbidity: A Scoping Review of Immune Dysregulation and Disease Progression,” Diabetology, vol. 6, no. 5, p. 35, May 2025. [CrossRef]
- H. Wang, G. Ruan, Y. Li, and X. Liu, “The Role and Potential Application of IL-12 in the Immune Regulation of Tuberculosis,” Int. J. Mol. Sci., vol. 26, no. 7, p. 3106, Mar. 2025. [CrossRef]
- V. O’Reilly et al., “Distinct and Overlapping Effector Functions of Expanded Human CD4+, CD8α+ and CD4-CD8α- Invariant Natural Killer T Cells,” PLoS One, vol. 6, no. 12, p. e28648, Dec. 2011. [CrossRef]
- A. M. Green, R. DiFazio, and J. L. Flynn, “IFN-γ from CD4 T Cells Is Essential for Host Survival and Enhances CD8 T Cell Function during Mycobacterium tuberculosis Infection,” The Journal of Immunology, vol. 190, no. 1, pp. 270–277, Jan. 2013. [CrossRef]
- A. Ghoshal, A. Verma, A. Bhaskar, and V. P. Dwivedi, “The uncharted territory of host-pathogen interaction in tuberculosis,” Front. Immunol., vol. 15, Jan. 2024. [CrossRef]
- P. Klenerman and A. Hill, “T cells and viral persistence: lessons from diverse infections,” Nat. Immunol., vol. 6, no. 9, pp. 873–879, Sep. 2005. [CrossRef]
- Z. Guo, Q. He, Y. Zhang, Y. Li, and Z. Zhang, “Mechanisms of Interleukin-10-Mediated Immunosuppression in Viral Infections,” Pathogens, vol. 14, no. 10, p. 989, Oct. 2025. [CrossRef]
- K. N. Couper, D. G. Blount, and E. M. Riley, “IL-10: The Master Regulator of Immunity to Infection,” The Journal of Immunology, vol. 180, no. 9, pp. 5771–5777, May 2008. [CrossRef]
- L. A. Morici, Mycobacterium tuberculosis infection: Determinants of disease outcome. Berkeley ProQuest Dissertations & Theses, 2003.
- S. Major, J. Turner, and G. Beamer, “Tuberculosis in CBA/J Mice,” Vet. Pathol., vol. 50, no. 6, pp. 1016–1021, Nov. 2013. [CrossRef]
- L. Jayashankar and R. Hafner, “Adjunct Strategies for Tuberculosis Vaccines: Modulating Key Immune Cell Regulatory Mechanisms to Potentiate Vaccination,” Front. Immunol., vol. 7, Dec. 2016. [CrossRef]
- “000656 - CBA Strain Details.” Accessed: May 12, 2026. [Online]. Available: https://www.jax.org/strain/000656#.
- R. A. Doty Dvm, “OPPORTUNISTIC ORGANISMS MONITORED (SHIPPING NOT STOPPED).”.
- “Animal Care and Use | Enterprise for Research, Innovation and Knowledge at Ohio State.” Accessed: May 12, 2026. [Online]. Available: https://research.osu.edu/research-responsibilities-and-compliance/animal-care-and-use.
- “Mycobacterium tuberculosis (Zopf) Lehmann and Neumann - 35801 | ATCC.” Accessed: May 12, 2026. [Online]. Available: https://www.atcc.org/products/35801.
- T. H. Jang et al., “Cryopreservation and its clinical applications,” Integr. Med. Res., vol. 6, no. 1, pp. 12–18, Mar. 2017. [CrossRef]
- J.-M. Rolain, S. Hraiech, L. Papazian, and F. Bregeon, “Animal models of polymicrobial pneumonia,” Drug Des. Devel. Ther., p. 3279, Jun. 2015. [CrossRef]
- “Middlebrook 7H11 Agar - for cultivation of Mycobacterium tuberculosis.”.
- Q. Sun and C. Dong, “Regulators of CD8+ T cell exhaustion,” Nat. Rev. Immunol., vol. 26, no. 2, pp. 129–151, Feb. 2026. [CrossRef]
- C. I. Champion et al., “A Vault Nanoparticle Vaccine Induces Protective Mucosal Immunity,” PLoS One, vol. 4, no. 4, p. e5409, Apr. 2009. [CrossRef]
- X. Zhang et al., “CD8 T cell response and its released cytokine IFN-γ are necessary for lung alveolar epithelial repair during bacterial pneumonia,” Front. Immunol., vol. 14, Oct. 2023. [CrossRef]
- N. Salam et al., “Protective Immunity to Mycobacterium tuberculosis Infection by Chemokine and Cytokine Conditioned CFP-10 Differentiated Dendritic Cells,” PLoS One, vol. 3, no. 8, p. e2869, Aug. 2008. [CrossRef]
- P.-J. Cardona et al., “Widespread Bronchogenic Dissemination Makes DBA/2 Mice More Susceptible than C57BL/6 Mice to Experimental Aerosol Infection with Mycobacterium tuberculosis,” Infect. Immun., vol. 71, no. 10, pp. 5845–5854, Oct. 2003. [CrossRef]
- J. Turner et al., “Immunological Basis for Reactivation of Tuberculosis in Mice,” Infect. Immun., vol. 69, no. 5, pp. 3264–3270, May 2001. [CrossRef]
- Y. Chen et al., “B cells promote granulomatous inflammation during chronic Mycobacterium tuberculosis infection in mice,” PLoS Pathog., vol. 19, no. 3, p. e1011187, Mar. 2023. [CrossRef]
- J. D. Yang et al., “Mycobacterium tuberculosis-specific CD4+ and CD8+ T cells differ in their capacity to recognize infected macrophages,” PLoS Pathog., vol. 14, no. 5, p. e1007060, May 2018. [CrossRef]
- M. J. B. van Stipdonk et al., “Dynamic programming of CD8+ T lymphocyte responses,” Nat. Immunol., vol. 4, no. 4, pp. 361–365, Apr. 2003. [CrossRef]
- “The Role of Multifunctional T Cells in IL-10 deficient CBA/J Mice Infected with Mycobacterium tuberculosis,” 2012.
- G. L. Beamer et al., “Interleukin-10 Promotes Mycobacterium tuberculosis Disease Progression in CBA/J Mice,” The Journal of Immunology, vol. 181, no. 8, pp. 5545–5550, Oct. 2008. [CrossRef]
- L. F. K. Uhl et al., “Interferon-γ couples CD8+ T cell avidity and differentiation during infection,” Nat. Commun., vol. 14, no. 1, p. 6727, Oct. 2023. [CrossRef]
- M. Senior and R. Grieshaber-Bouyer, “B cell depletion in autoimmune disease: in vivo CAR-T or T cell engagers?,” Nat. Biotechnol., vol. 44, no. 4, pp. 503–509, Apr. 2026. [CrossRef]
- H. Luxenburger, R. Thimme, and M. Hofmann, “T cell adaptation in chronic infections and tumors,” Cell. Mol. Immunol., vol. 23, no. 5, pp. 440–456, Mar. 2026. [CrossRef]
- L. Pace, “Temporal and Epigenetic Control of Plasticity and Fate Decision during CD8 + T-Cell Memory Differentiation,” Cold Spring Harb. Perspect. Biol., vol. 13, no. 12, p. a037754, Dec. 2021. [CrossRef]
- Y. Pei, X. Cui, and Y. Wang, “Regulation of IL-10 expression and function by JAK-STAT in CD8+ T cells,” Int. Immunopharmacol., vol. 128, p. 111563, Feb. 2024. [CrossRef]
- L. K. Smith et al., “Interleukin-10 Directly Inhibits CD8+ T Cell Function by Enhancing N-Glycan Branching to Decrease Antigen Sensitivity,” Immunity, vol. 48, no. 2, pp. 299-312.e5, Feb. 2018. [CrossRef]
- B. Mishra et al., “IL-10 targets IRF transcription factors to suppress IFN and inflammatory response genes by epigenetic mechanisms,” Nature Immunology 2025 26:5, vol. 26, no. 5, pp. 748–759, Apr. 2025. [CrossRef]
- L. Rodrigues Junior et al., “Keeping it local: how CD8 TRMs regulate viral and cancer immunity,” Front. Immunol., vol. 16, Dec. 2025. [CrossRef]
- K. Tewari, Y. Nakayama, and M. Suresh, “Role of Direct Effects of IFN-γ on T Cells in the Regulation of CD8 T Cell Homeostasis,” The Journal of Immunology, vol. 179, no. 4, pp. 2115–2125, Aug. 2007. [CrossRef]
- G. Trinchieri, “Regulatory Role of T Cells Producing both Interferon γ and Interleukin 10 in Persistent Infection,” J. Exp. Med., vol. 194, no. 10, pp. F53–F57, Nov. 2001. [CrossRef]
- T. Bedke, F. Muscate, S. Soukou, N. Gagliani, and S. Huber, “IL-10-producing T cells and their dual functions,” Semin. Immunol., vol. 44, p. 101335, Aug. 2019. [CrossRef]
- C. Tabilas, N. L. Smith, and B. D. Rudd, “Shaping immunity for life: Layered development of CD8 + T cells,” Immunol. Rev., vol. 315, no. 1, pp. 108–125, May 2023. [CrossRef]
- E. W. Cross, T. J. Blain, D. Mathew, and R. M. Kedl, “Anti-CD8 monoclonal antibody-mediated depletion alters the phenotype and behavior of surviving CD8+ T cells,” PLoS One, vol. 14, no. 2, p. e0211446, Feb. 2019. [CrossRef]
- A. Yang, M. Zhou, Y. Gao, and Y. Zhang, “Mechanisms of CD8+ T cell exhaustion and its clinical significance in prognosis of anti-tumor therapies: A review,” Int. Immunopharmacol., vol. 159, p. 114843, Jun. 2025. [CrossRef]
- I. Kudryavtsev et al., “A Key Role of CD8+ T Cells in Controlling of Tuberculosis Infection,” Diagnostics, vol. 13, no. 18, p. 2961, Sep. 2023. [CrossRef]
- R. Zander and W. Cui, “Exhausted CD8+ T cells face a developmental fork in the road,” Trends Immunol., vol. 44, no. 4, pp. 276–286, Apr. 2023. [CrossRef]
- X. Tang and V. Kumar, “Advances in the Study of CD8+ Regulatory T Cells,” Crit. Rev. Immunol., vol. 39, no. 6, p. 409, 2019. [CrossRef]
- L. Jiang, S. Yao, S. Huang, J. Wright, T. J. Braciale, and J. Sun, “Type I IFN signaling facilitates the development of IL-10-producing effector CD8 + T cells during murine influenza virus infection,” Eur. J. Immunol., vol. 46, no. 12, pp. 2778–2788, Dec. 2016. [CrossRef]
- R. Bhadra, J. P. Gigley, L. M. Weiss, and I. A. Khan, “Control of Toxoplasma reactivation by rescue of dysfunctional CD8 + T-cell response via PD-1-PDL-1 blockade,” Proc. Natl. Acad. Sci. U. S. A., vol. 108, no. 22, pp. 9196–9201, May 2011. [CrossRef]
- R. Dudani, K. Murali-Krishna, L. Krishnan, and S. Sad, “IFN-γ Induces the Erosion of Preexisting CD8 T Cell Memory during Infection with a Heterologous Intracellular Bacterium,” The Journal of Immunology, vol. 181, no. 3, pp. 1700–1709, Aug. 2008. [CrossRef]
- A. Cope, G. Le Friec, J. Cardone, and C. Kemper, “The Th1 life cycle: Molecular control of IFN-γ to IL-10 switching,” Trends Immunol., vol. 32, no. 6, pp. 278–286, Jun. 2011. [CrossRef]
- N. Rallón et al., “Expression of PD-1 and Tim-3 markers of T-cell exhaustion is associated with CD4 dynamics during the course of untreated and treated HIV infection,” PLoS One, vol. 13, no. 3, p. e0193829, Mar. 2018. [CrossRef]
- N. Weng, “Numbers and odds: TCR repertoire size and its age changes impacting on T cell functions,” Semin. Immunol., vol. 69, p. 101810, Sep. 2023. [CrossRef]
- C. Cochain and A. Zernecke, “Protective and pathogenic roles of CD8+ T cells in atherosclerosis,” Basic Res. Cardiol., vol. 111, no. 6, p. 71, Nov. 2016. [CrossRef]
- X. Long et al., “Memory CD4+ T cells are suppressed by CD8+ regulatory T cells in vitro and in vivo,” Am. J. Transl. Res., vol. 9, no. 1, p. 63, 2017, Accessed: May 12, 2026. [Online]. Available: https://pmc.ncbi.nlm.nih.gov/articles/PMC5250704/.
- “Tuberculosis – Technical work.” Accessed: May 12, 2026. [Online]. Available: https://www.who.int/teams/global-programme-on-tuberculosis-and-lung-health/research-innovation/vaccines.
- E. Antoun, Y. Peng, and T. Dong, “Vaccine-induced CD8+ T cells are key to protection from SARS-CoV-2,” Nat. Immunol., vol. 24, no. 10, pp. 1594–1596, Oct. 2023. [CrossRef]
- V. Appay, T. Yamamoto, and A. Sáez-Cirión, “Renaissance of antiviral CD8+ T cell immunity in vaccination and disease,” Nat. Rev. Immunol., Mar. 2026. [CrossRef]
- J. Emmerich et al., “IL-10 Directly Activates and Expands Tumor-Resident CD8+ T Cells without De Novo Infiltration from Secondary Lymphoid Organs,” Cancer Res., vol. 72, no. 14, pp. 3570–3581, Jul. 2012. [CrossRef]
- J. Chen et al., “Trained immunity modulators: A new frontier in immunoregulation and disease intervention,” J. Adv. Res., Sep. 2025. [CrossRef]
- A. N. Bucsan, S. Mehra, S. A. Khader, and D. Kaushal, “The current state of animal models and genomic approaches towards identifying and validating molecular determinants of Mycobacterium tuberculosis infection and tuberculosis disease,” Pathog. Dis., vol. 77, no. 4, Jun. 2019. [CrossRef]
Figure 1.
M.TB infection in susceptible CBA/J and resistant C57BL/6 mice. These mice strains were infected with about 100 CFU of M.TB strain Erdman by aerosol using a Glas-col inhalation device (A). On days 1, 21, 60, 120, and 150 post-infection, mice were euthanized, and lungs were collected and homogenized to assess M.tb CFU in the lungs. (B) Both mice initially had active bacterial growth followed by a control period. Increases in the lungs CFU in the CBA/J mice correlate with disease progression.
Figure 1.
M.TB infection in susceptible CBA/J and resistant C57BL/6 mice. These mice strains were infected with about 100 CFU of M.TB strain Erdman by aerosol using a Glas-col inhalation device (A). On days 1, 21, 60, 120, and 150 post-infection, mice were euthanized, and lungs were collected and homogenized to assess M.tb CFU in the lungs. (B) Both mice initially had active bacterial growth followed by a control period. Increases in the lungs CFU in the CBA/J mice correlate with disease progression.
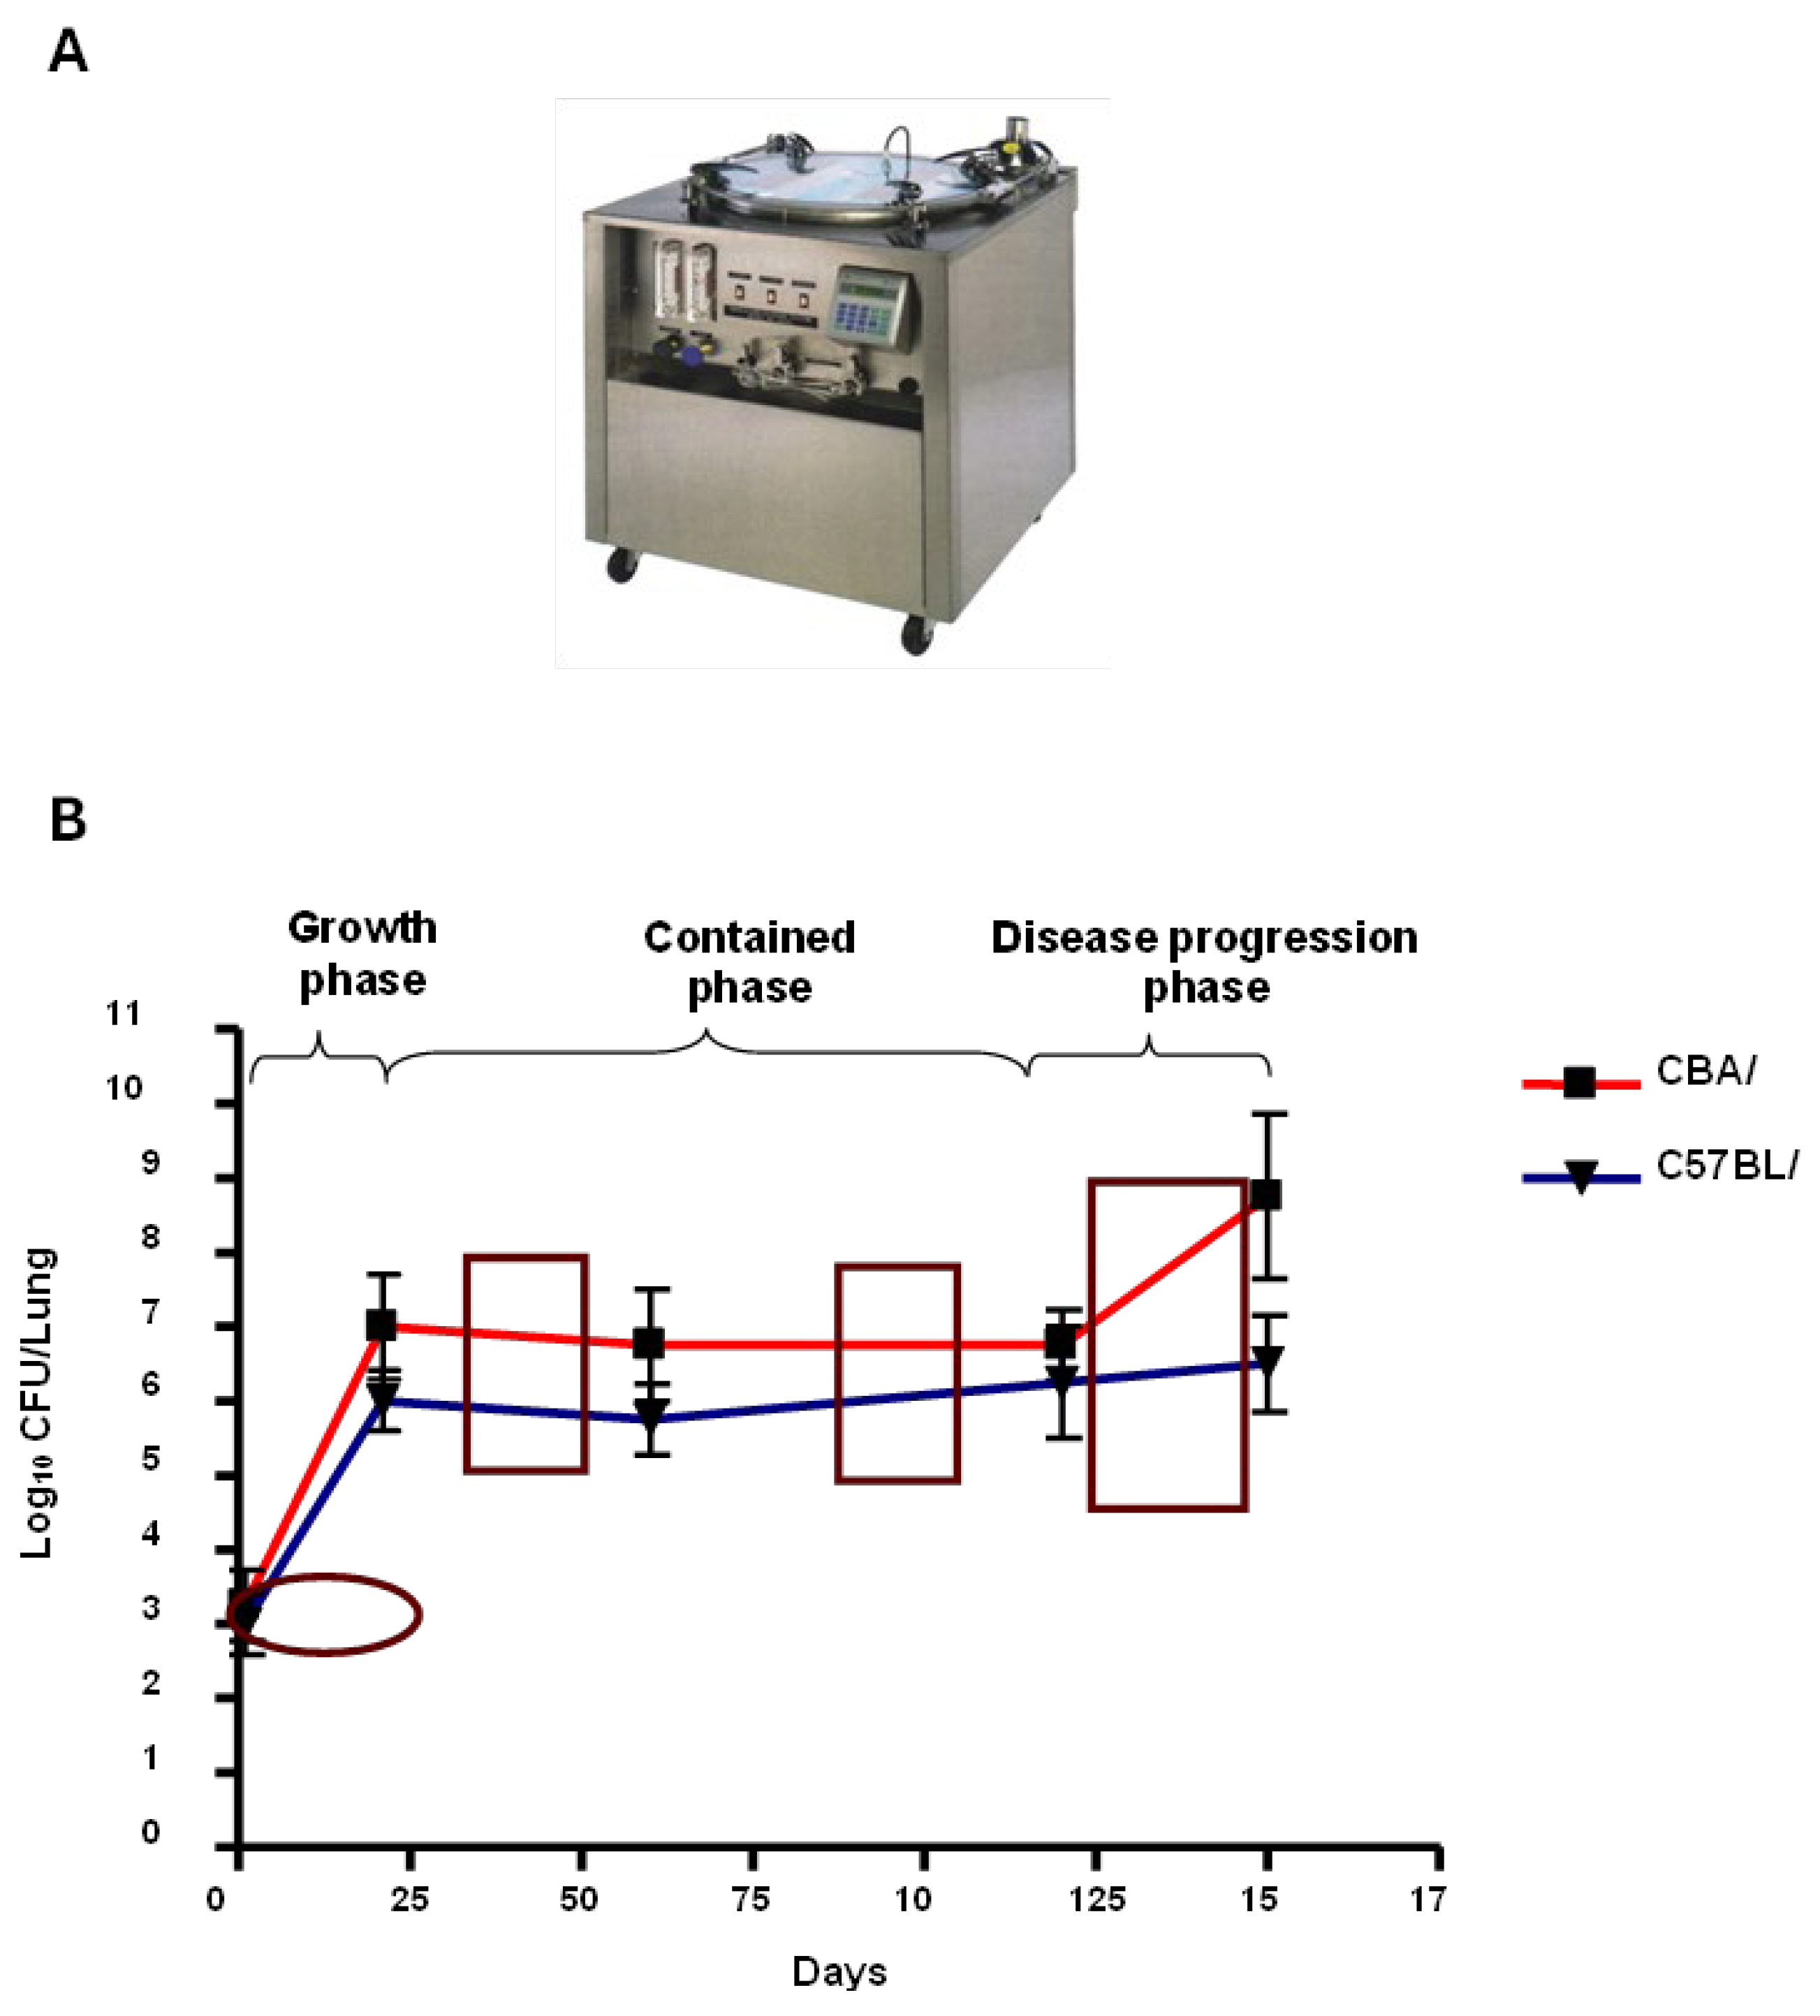
Figure 2.
Lung CD4 and CD8+ T cell numbers in CBA/J and C57BL/J mice infected with M.tb. C57BL/6 (open symbol) and CBA/J (filled symbol) mice were infected with low-dose M.TB Erdman by aerosol. Cells were isolated from the lungs and incubated with fluorescent-labelled antibodies specific for CD3, CD4 (A) CD8+ (B) and analyzed by flow cytometry. The CD4:CD8+ ratio was determined (C). Data represent the mean +/- SE for 4 mice at each time point. The student’s t-test determined the statistical significance p<0.05, p<0.005.
Figure 2.
Lung CD4 and CD8+ T cell numbers in CBA/J and C57BL/J mice infected with M.tb. C57BL/6 (open symbol) and CBA/J (filled symbol) mice were infected with low-dose M.TB Erdman by aerosol. Cells were isolated from the lungs and incubated with fluorescent-labelled antibodies specific for CD3, CD4 (A) CD8+ (B) and analyzed by flow cytometry. The CD4:CD8+ ratio was determined (C). Data represent the mean +/- SE for 4 mice at each time point. The student’s t-test determined the statistical significance p<0.05, p<0.005.
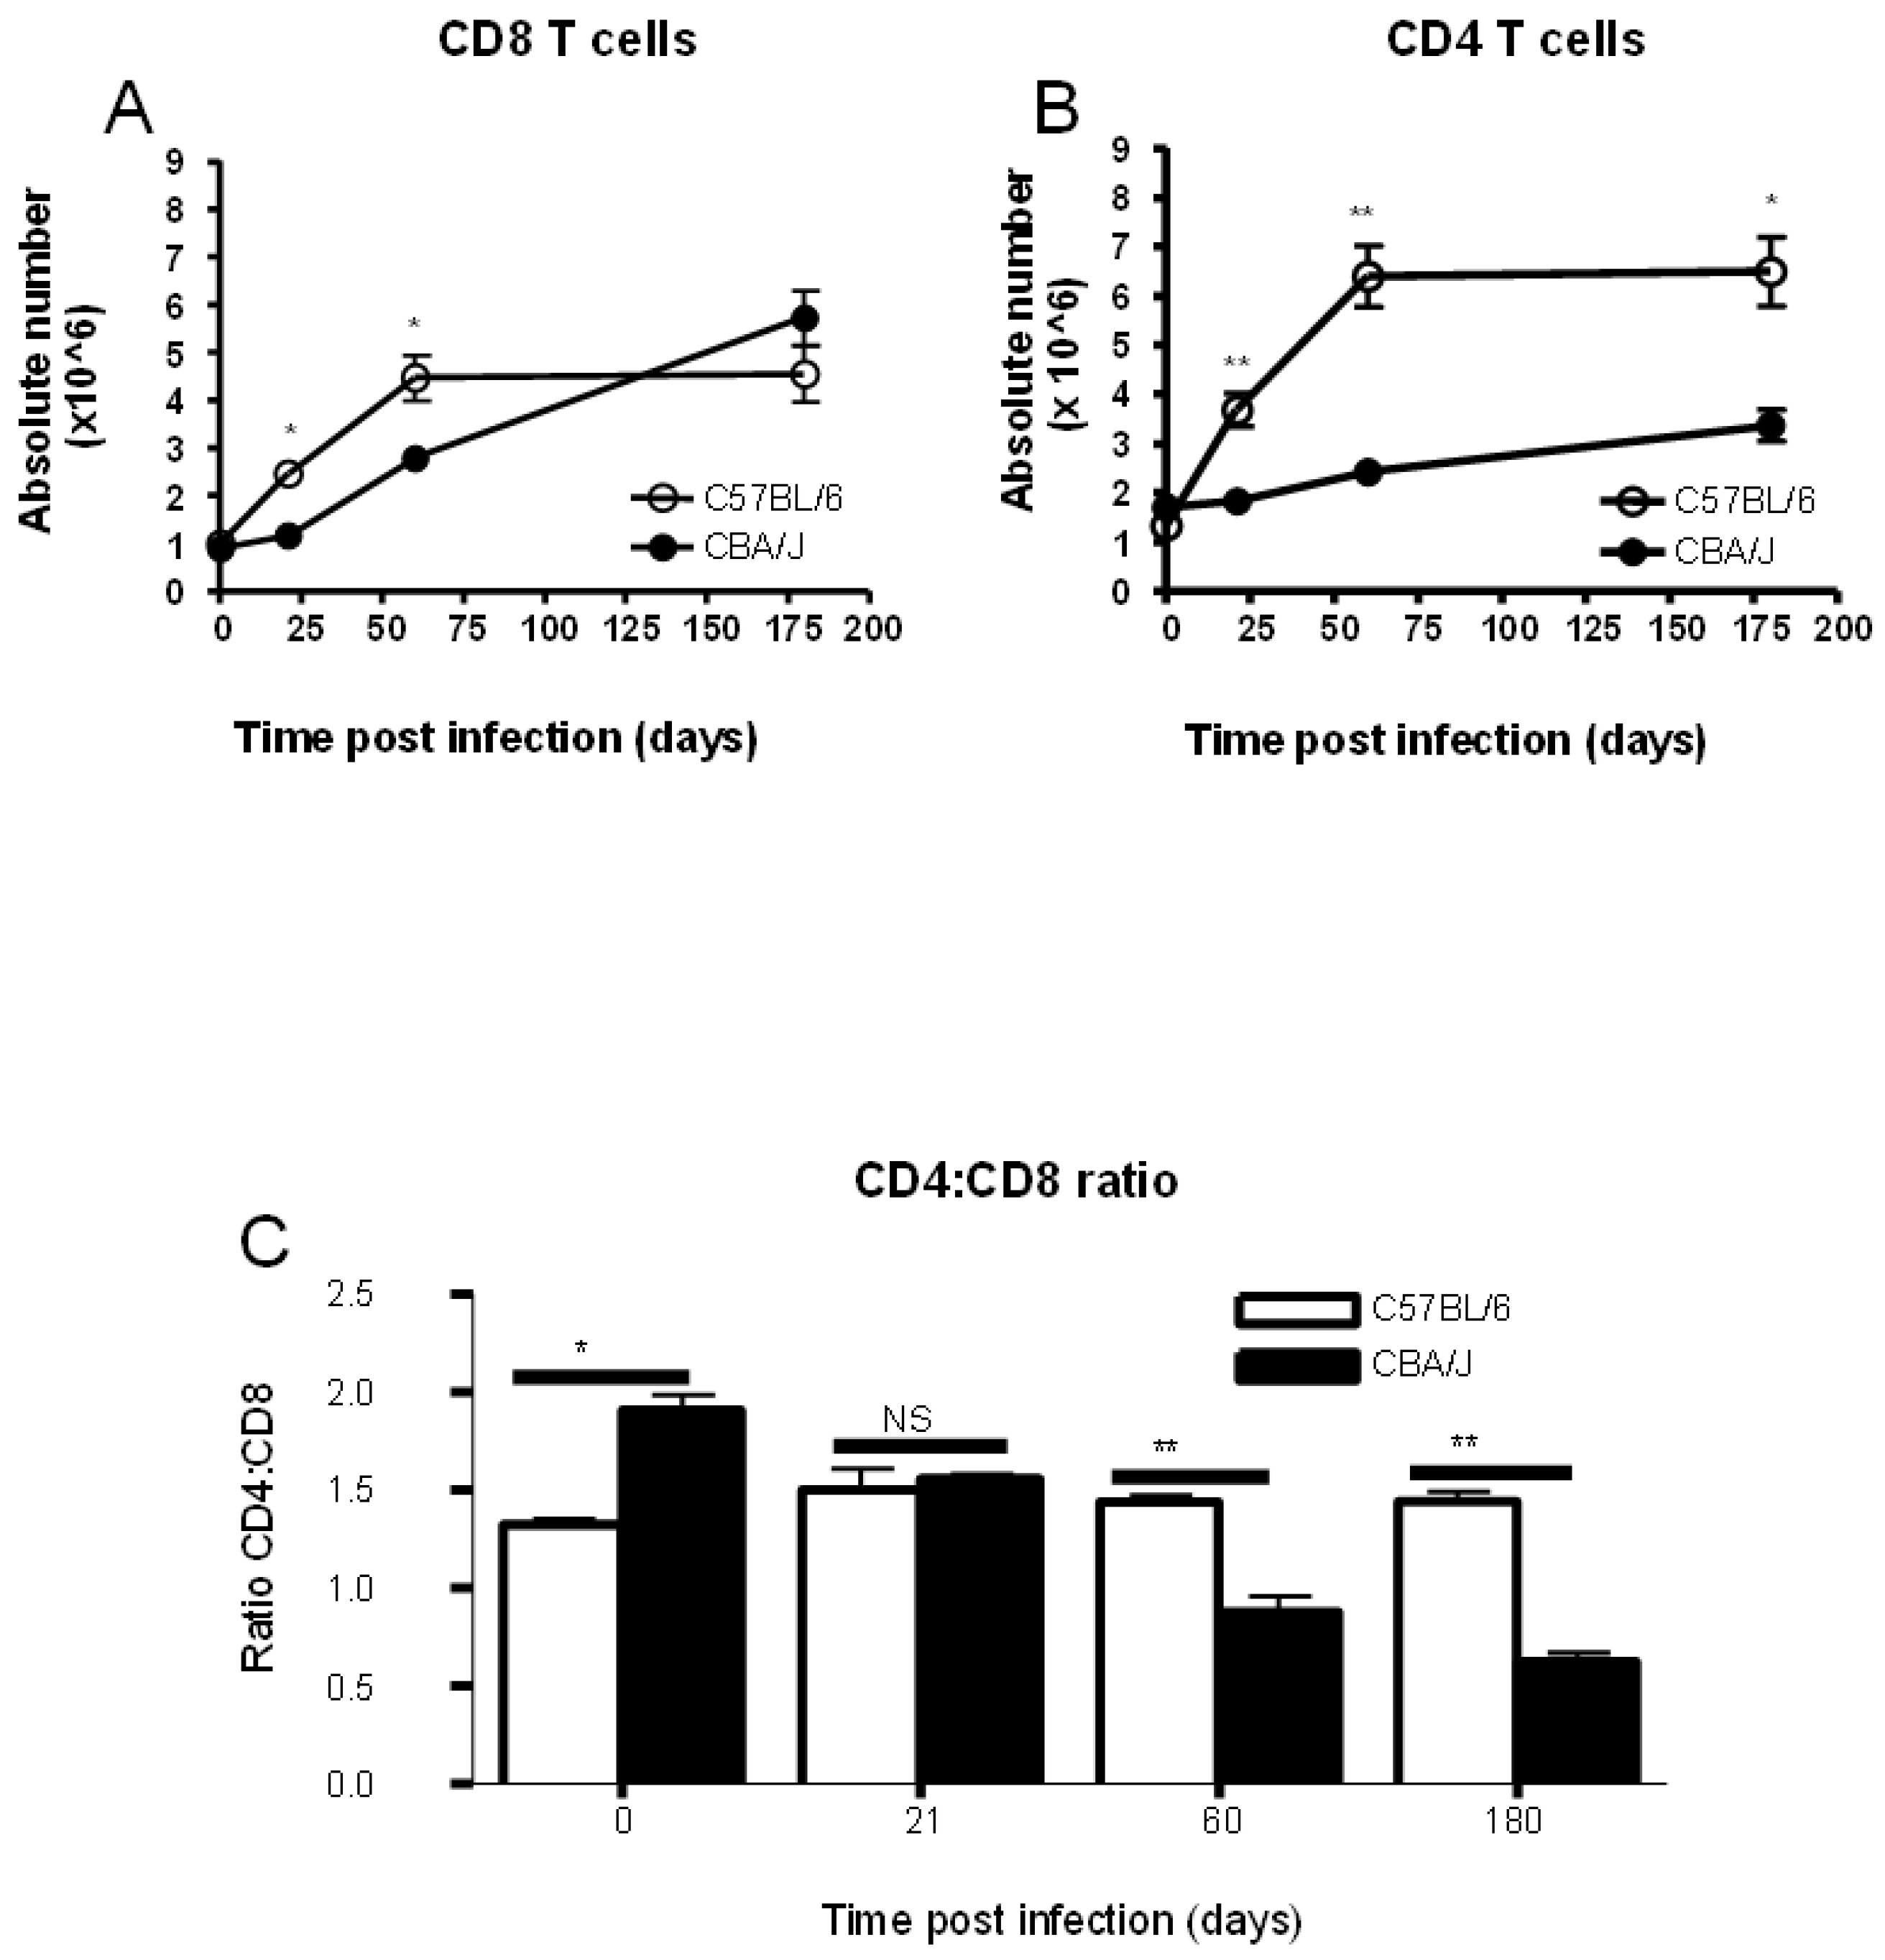
Figure 3.
Whole-lung homogenates were collected from infected CBA/J (n= 4) and C57BL/6 (n= 4) at 21, 60, 120, and 150 days post-infection. A part of the lung homogenates was plated on 7H11 to determine colony-forming units (CFU), while the other part was frozen at -80 °C until use. Samples were thawed from -80 °C and centrifuged for 7 minutes at 1200 rpm to remove tissue debris. The levels of IL-10 were determined using an enzyme-linked immunosorbent assay (ELISA) as instructed by the manufacturer (BD Biosciences). Data are representative of 4 mice at each time point. p<0.001, p<0.01, student’s t-test.
Figure 3.
Whole-lung homogenates were collected from infected CBA/J (n= 4) and C57BL/6 (n= 4) at 21, 60, 120, and 150 days post-infection. A part of the lung homogenates was plated on 7H11 to determine colony-forming units (CFU), while the other part was frozen at -80 °C until use. Samples were thawed from -80 °C and centrifuged for 7 minutes at 1200 rpm to remove tissue debris. The levels of IL-10 were determined using an enzyme-linked immunosorbent assay (ELISA) as instructed by the manufacturer (BD Biosciences). Data are representative of 4 mice at each time point. p<0.001, p<0.01, student’s t-test.
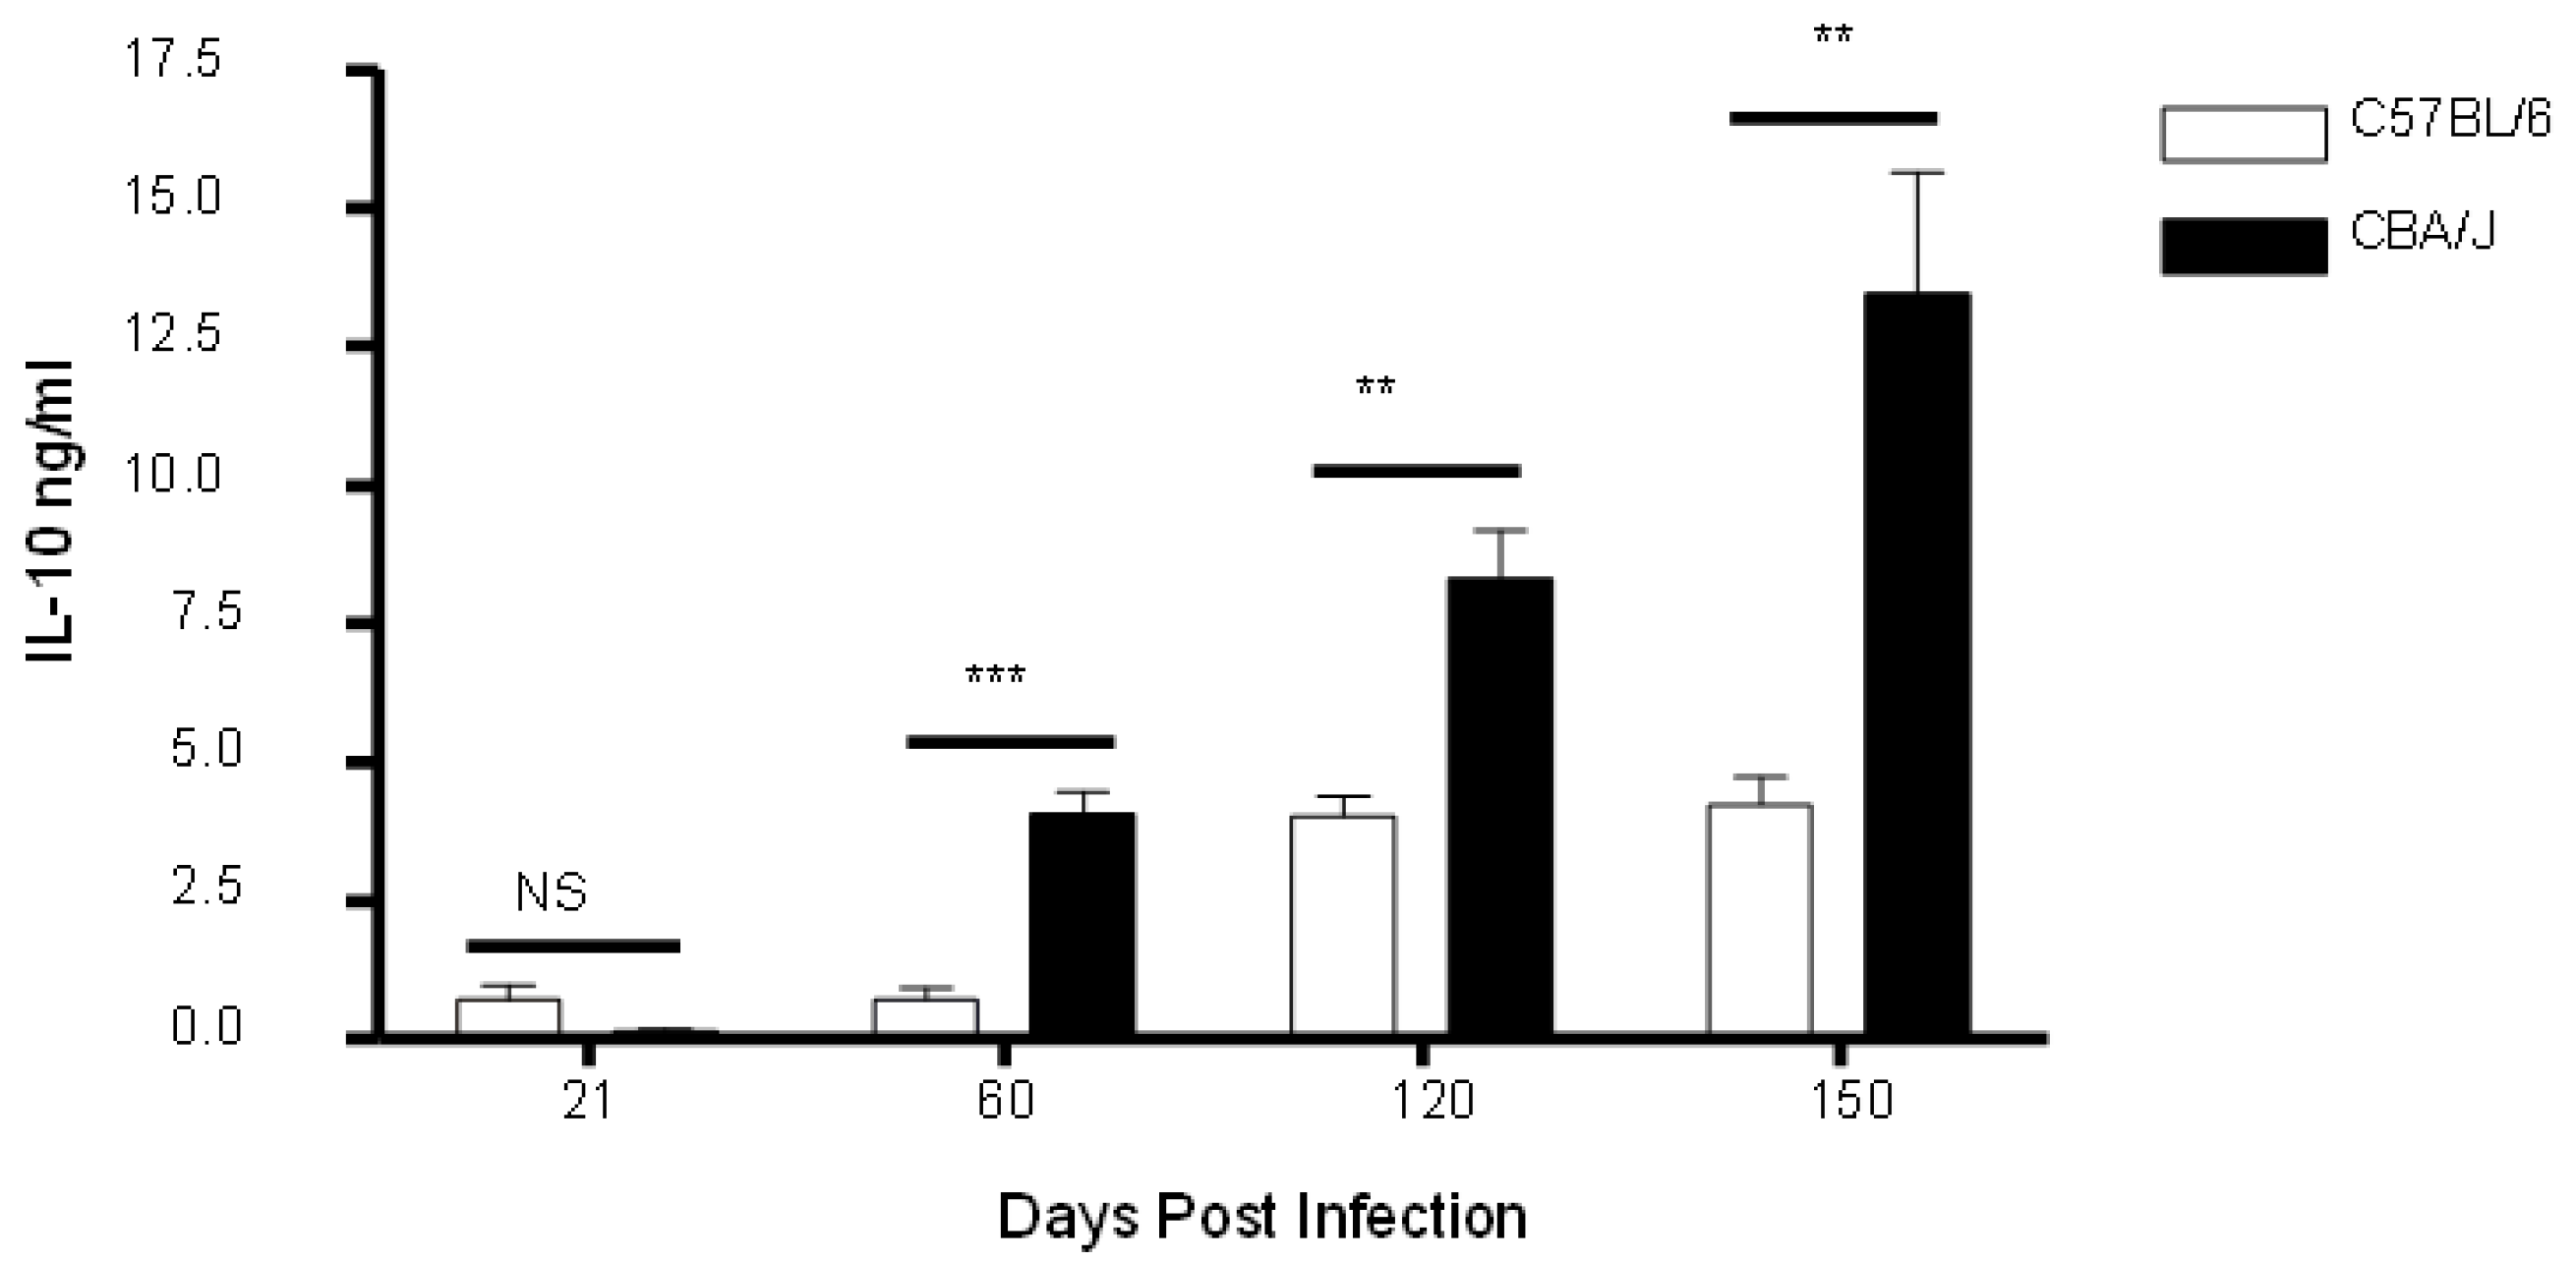
Figure 4.
CD8+ T cells produce IL-10 in an antigen-specific manner. Ninety-six-well high protein binding Immobilon-P membrane plates (Millipore, Billerica, MA) were coated with anti-IFN-γ or anti-IL-10 (eBioscience) overnight at 4 °C. The plates were washed and blocked with cell culture media for 2 hours at room temperature. Lung cells from CBA/J and C57BL/6 were isolated, and CD8+ T cells were purified using magnet CD8+ T cell purification. The purified cells were transferred to the immuno-P plates and co-culture with fixed DC in the presence or absence of M.TB 1:1 at 37 °C in a humidified incubator with 5% CO2 for 72 hours. ELISPOT assay was conducted as recommended by the manufacturer. Each graph represents four mice’s spot-forming unit (SFU) from CBA/J or C57BL/6. p<0.001, p<0.005 and p<0.05, Student’s t-test. (A) IFN-γ and (B) IL-10.
Figure 4.
CD8+ T cells produce IL-10 in an antigen-specific manner. Ninety-six-well high protein binding Immobilon-P membrane plates (Millipore, Billerica, MA) were coated with anti-IFN-γ or anti-IL-10 (eBioscience) overnight at 4 °C. The plates were washed and blocked with cell culture media for 2 hours at room temperature. Lung cells from CBA/J and C57BL/6 were isolated, and CD8+ T cells were purified using magnet CD8+ T cell purification. The purified cells were transferred to the immuno-P plates and co-culture with fixed DC in the presence or absence of M.TB 1:1 at 37 °C in a humidified incubator with 5% CO2 for 72 hours. ELISPOT assay was conducted as recommended by the manufacturer. Each graph represents four mice’s spot-forming unit (SFU) from CBA/J or C57BL/6. p<0.001, p<0.005 and p<0.05, Student’s t-test. (A) IFN-γ and (B) IL-10.
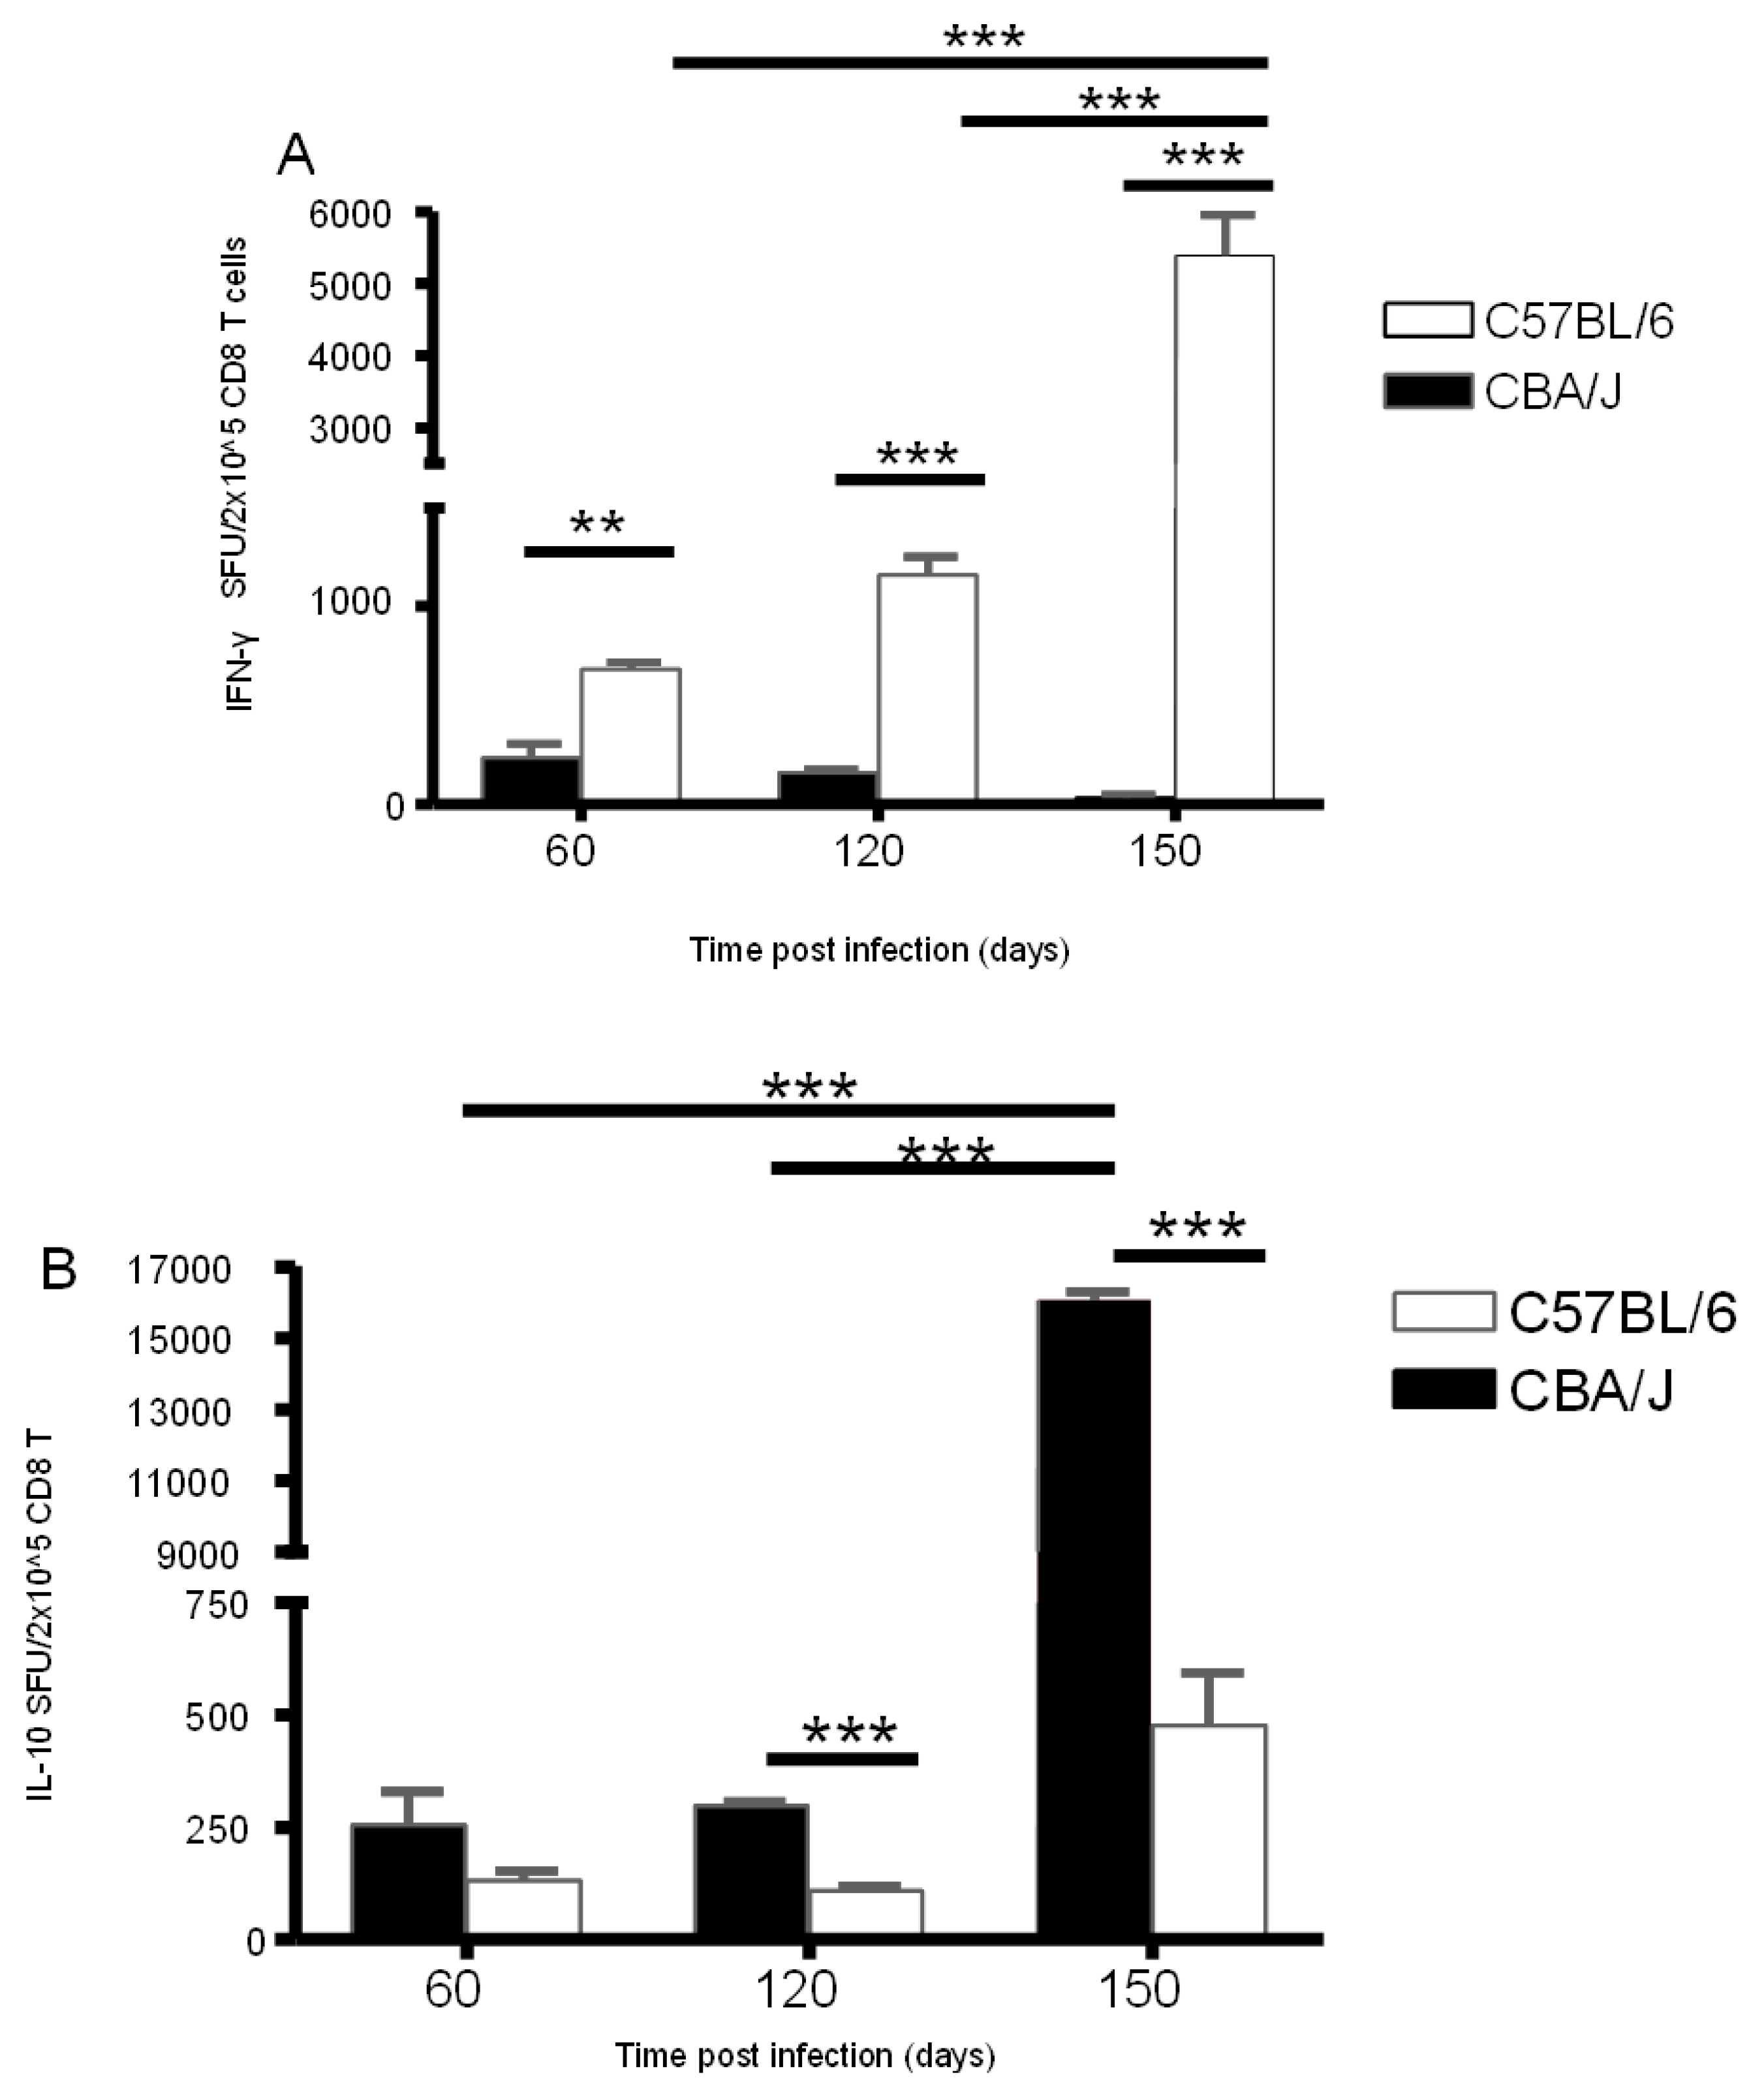
Figure 5.
CD8+ T cell depletion. CBA/J mice were infected with M.tb Erdman for 90 days and then treated at 5-day intervals with anti-CD8+ or control IgG2a antibody. At 35 days post-treatment, mice were euthanized, and lungs were collected to determine the bacteria burden (A), the absolute number of T cell subsets (B), and the absolute number of CD4 T cells producing IFN-γ (C).
Figure 5.
CD8+ T cell depletion. CBA/J mice were infected with M.tb Erdman for 90 days and then treated at 5-day intervals with anti-CD8+ or control IgG2a antibody. At 35 days post-treatment, mice were euthanized, and lungs were collected to determine the bacteria burden (A), the absolute number of T cell subsets (B), and the absolute number of CD4 T cells producing IFN-γ (C).
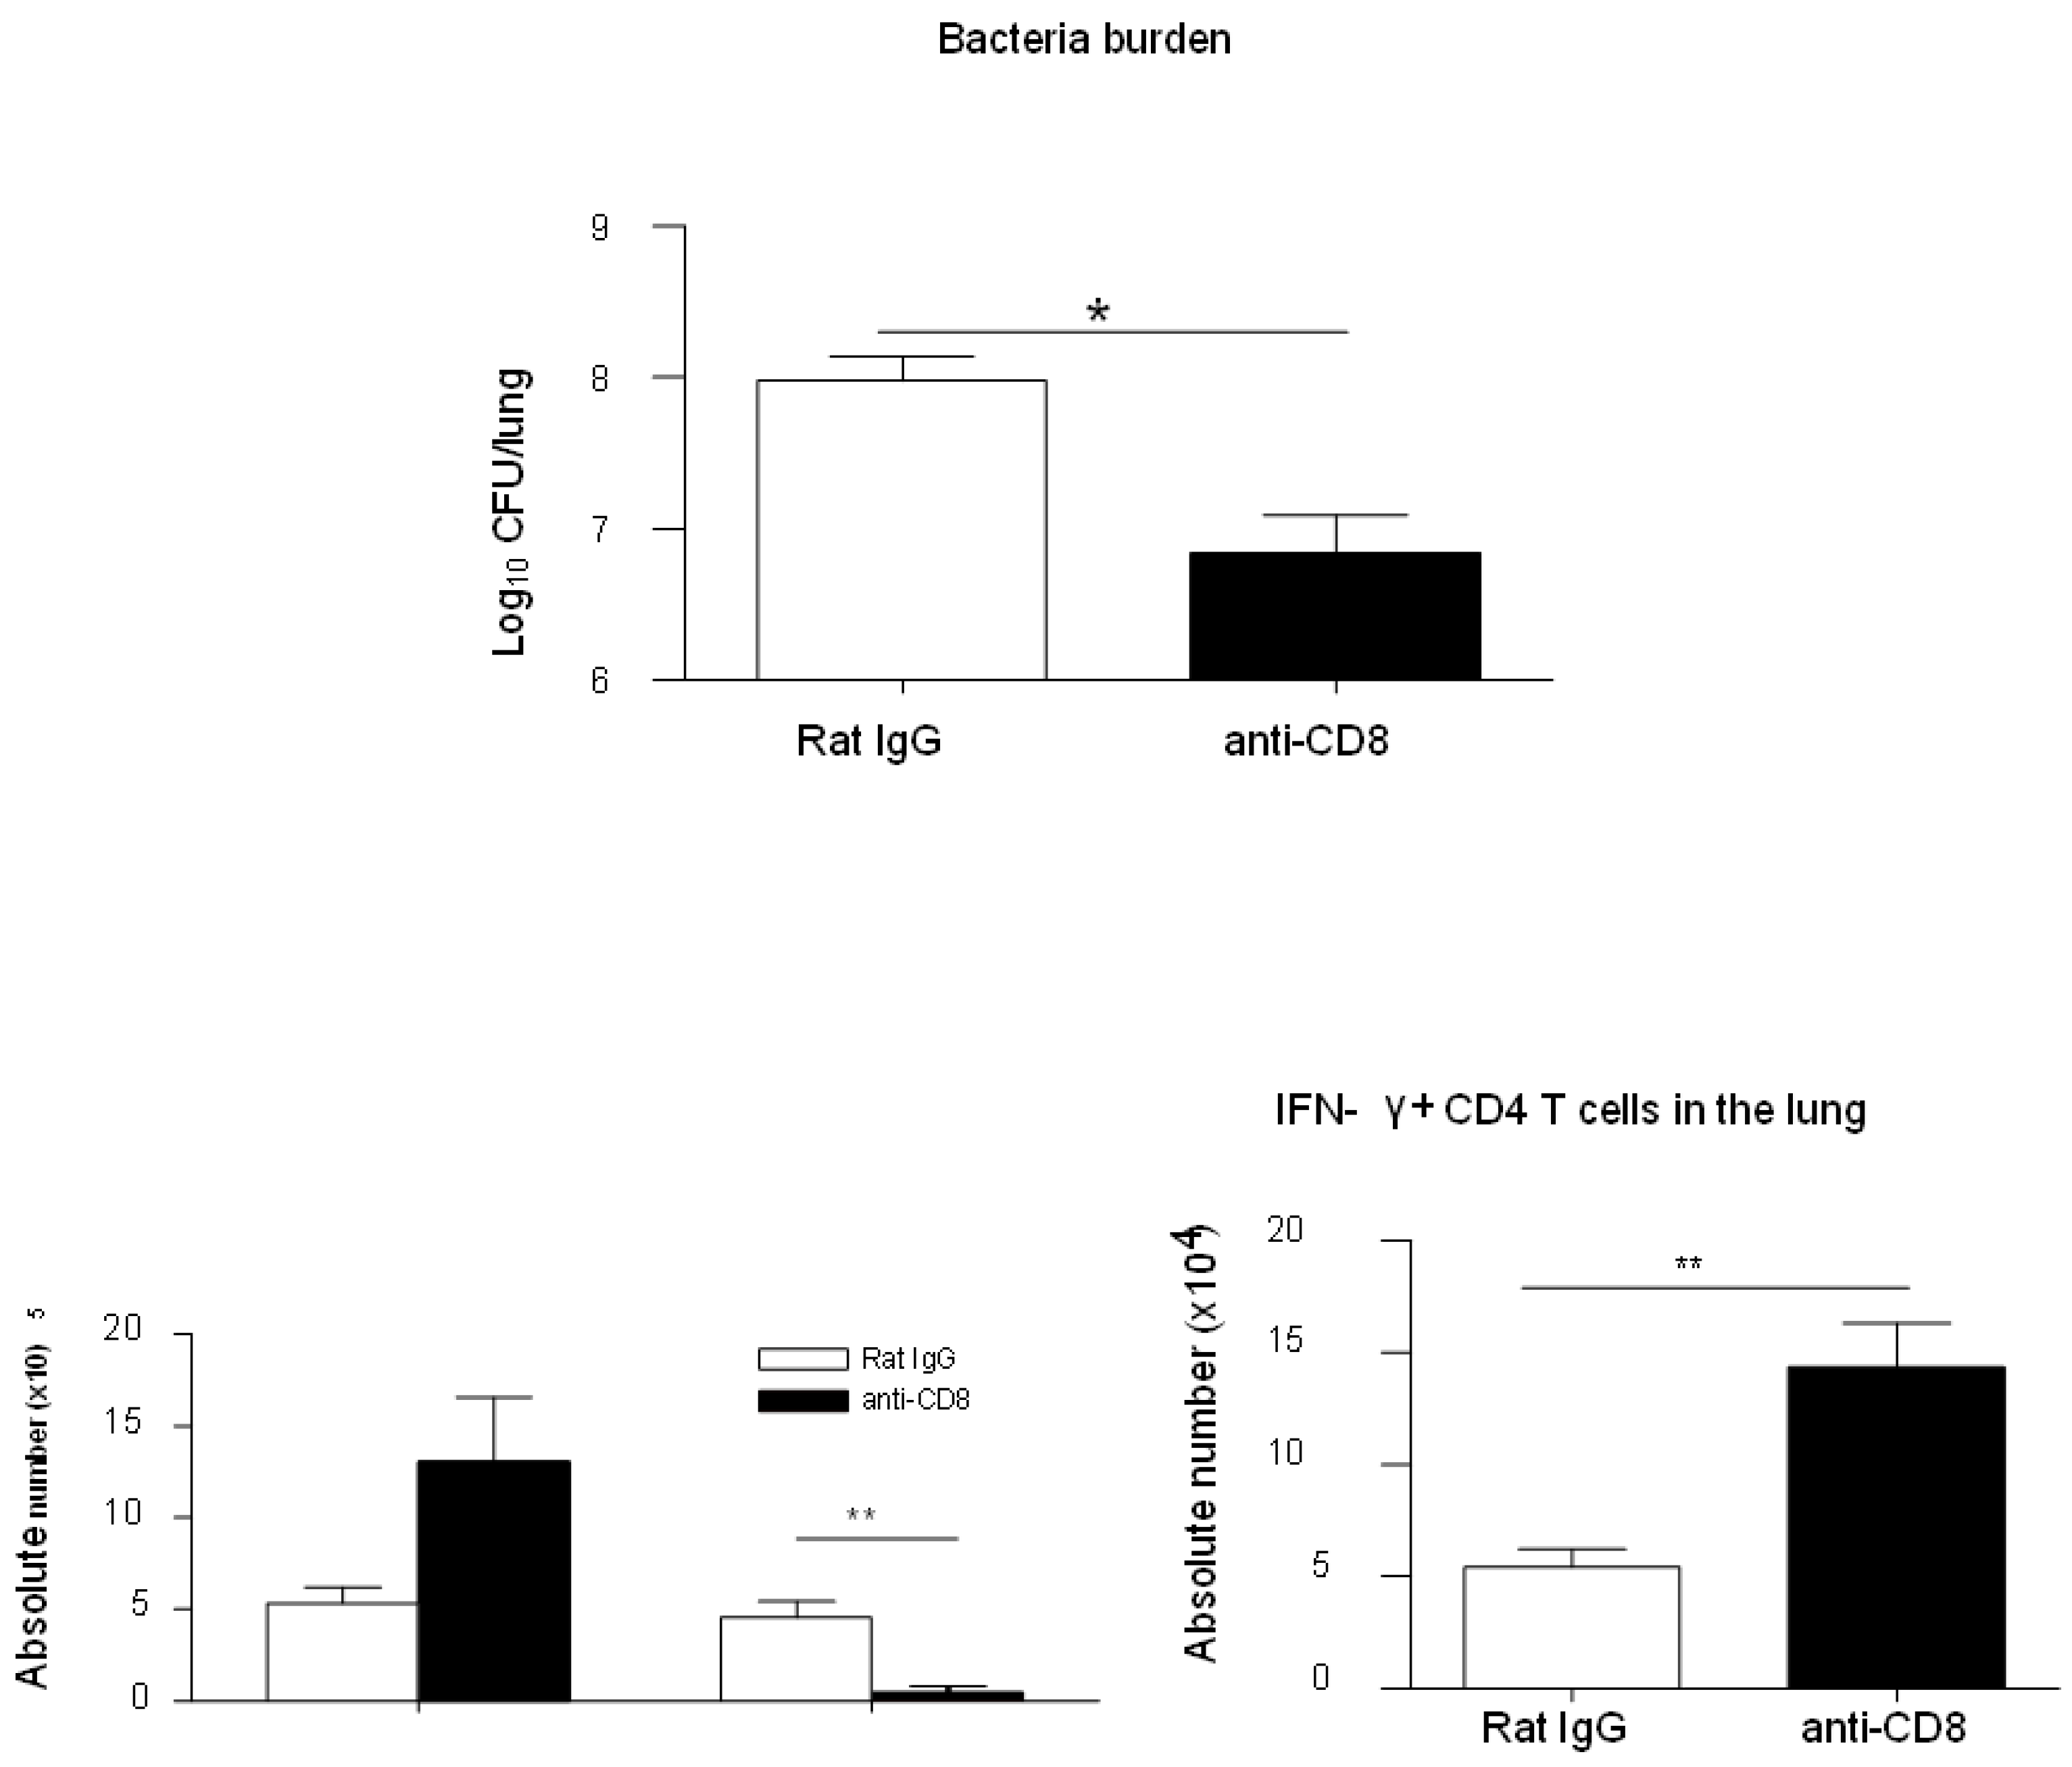
Figure 6.
Model of CD8+ IL-10 T cell-mediated immune regulation during chronic M.tb infection in CBA/J mice. Chronic infection drives the accumulation of CD8+ T cells that produce high levels of IL-10 (red cells). IL-10 suppresses protective immune mechanisms, CD4+ T cell-derived IFN-γ production (blue cells) and macrophage activation (green cells), resulting in impaired bacterial clearance, persistent M.tb infection (black bacilli), and progressive lung pathology. Arrows indicate cytokine-mediated interactions.
Figure 6.
Model of CD8+ IL-10 T cell-mediated immune regulation during chronic M.tb infection in CBA/J mice. Chronic infection drives the accumulation of CD8+ T cells that produce high levels of IL-10 (red cells). IL-10 suppresses protective immune mechanisms, CD4+ T cell-derived IFN-γ production (blue cells) and macrophage activation (green cells), resulting in impaired bacterial clearance, persistent M.tb infection (black bacilli), and progressive lung pathology. Arrows indicate cytokine-mediated interactions.
Disclaimer/Publisher’s Note: The statements, opinions and data contained in all publications are solely those of the individual author(s) and contributor(s) and not of MDPI and/or the editor(s). MDPI and/or the editor(s) disclaim responsibility for any injury to people or property resulting from any ideas, methods, instructions or products referred to in the content. |
© 2026 by the authors. Licensee MDPI, Basel, Switzerland. This article is an open access article distributed under the terms and conditions of the Creative Commons Attribution (CC BY) license (http://creativecommons.org/licenses/by/4.0/).
Copyright: This open access article is published under a Creative Commons CC BY 4.0 license, which permit the free download, distribution, and reuse, provided that the author and preprint are cited in any reuse.