

Submitted:
11 May 2026
Posted:
13 May 2026
You are already at the latest version
Abstract
Corridor management—such as reliance on manual warning zone delineation and inconsistent boundaries—this paper proposes 3DSim-WZD, an automatic ground-level warning zone detection method based on 3D simulation data augmentation. Guided by "interpretable geometric priors combined with deep learning regression," the framework integrates four modules: parametric simulation generation, simulation-to-real transfer, boundary vertex regression, and voltage-level-based expansion. Specifically, parametric virtual scenes are constructed in Unity3D to automatically derive accurate vertex labels. The open-source Stable Diffusion framework, combined with ControlNet and LoRA, is employed for sim-to-real style transfer to reduce domain gaps. Furthermore, directional detection convolutional kernels are incorporated into the YOLO12m backbone to enhance sensitivity to transmission structures. Finally, safety clearance distances are mapped according to voltage levels for regulatory-compliant warning zones. Evaluated on a dataset of 5,000 simulated and 300 real samples, the method achieves a mIoU of 91.2% and an inference speed of 46.8 FPS, demonstrating significant potential for large-scale deployment.
Keywords:
transmission line
; warning zone detection
; 3D simulation
1. Introduction
With the continuous expansion of China’s UHV and inter-regional transmission networks, online perception systems for transmission lines have become critical for ensuring power supply continuity and disaster prevention. Current research in this field predominantly focuses on component/line defect detection (e.g., insulator damage, hardware corrosion) [1,2,3,4,5,6,7,8,9] or corridor risk identification (e.g., construction vehicles, tree obstacles) [10,11,12,13,14,15], while studies on automated warning zone detection remain scarce. However, in practical applications, foreign object detection models are not independent decision-making modules; an alarm is operationally valid only when the spatial relationship between a detected object and the warning zone satisfies the triggering conditions. Therefore, the quality of warning zone boundaries directly determines the effectiveness of the entire alarm system. Figure 1 illustrates the decision logic of warning zone determination.
The main factor hindering the implementation of automated warning zone detection is the scarcity of accurately annotated samples of transmission line projections on the ground. Annotation of training samples for transmission corridors depends on the vertical projection of overhead conductors onto the ground. This projection carries strict physical meaning and is generally not visibly correlated with ground texture; conventional visual segmentation algorithms cannot accurately segment the projection area based on texture alone [16,17]. Consequently, if annotations rely solely on the subjective judgement of operators, the results exhibit not only large inter-individual variability but also significant deviations from the true ground-truth projection. An automated model trained on such samples yields predicted zones that differ greatly from the actual warning zones, offering little practical value.
The current mainstream approach adopted by the industry involves on-site annotation for each camera. Through manual field measurement, the actual width of the power line in each camera view is recorded, and the safety clearance is then expanded outward according to the voltage level. This yields precisely annotated transmission corridors for each camera view (Figure 2). However, the annotation cost of this method is extremely high. Moreover, once the camera pose (e.g., pan, tilt, zoom) is adjusted, the previously annotated zones become invalid. This severely hampers the automation of fault warning for transmission lines.
In contrast, 3D simulation provides a more stable data supply paradigm. As long as conductors, transmission towers, and camera parameters are accurately modeled in a virtual scene, ground projection labels with strict geometric consistency can be automatically generated. Subsequently, Stable Diffusion [18] techniques are used to enhance image realism, reducing the domain gap between simulation and reality. This approach constructs a training sample system characterized by “low cost, high consistency, and scalability”, which aligns with the established conclusion in computer vision that supervised data can be built upon imaging geometry and image style transfer [19,20,21,22].
Based on this insight, this paper proposes a novel method for transmission corridor detection. First, precise virtual samples together with accurate ground projections of the transmission lines are obtained through accurately controllable 3D modeling and camera parameters. Then, image style transfer is applied to make the training samples visually approximate real photographs. Next, a modified YOLO12m [23] regression model is used to predict the key points of the ground projection, and the warning zone is expanded outward based on a voltage-level safety clearance coefficient. Finally, a transmission line warning zone detection algorithm is obtained that achieves high accuracy and meets practical operational requirements.
We present 3DSim-WZD – an automatic detection method for ground-level warning zones in power transmission corridors based on 3D simulation data augmentation. Its main contributions are summarized as follows: 1. A parametric 3D simulation data generation process for transmission corridor warning-zone modeling, which automatically exports four-vertex labels that are consistent with business definitions. 2. A fine-tuned Stable Diffusion model for sample style transfer, significantly reducing the difference between simulated and real samples. 3. Accurate regression of the four vertices of the transmission corridor based on an improved YOLOv12m architecture. 4. Explicit embedding of voltage-level safety clearances into the post-processing stage, ensuring that the model output is not only visually reasonable but also meets power safety specifications [24,25].
The remainder of this paper is structured as follows: Chapter 1 presents the research background, problem definition, and innovations. Chapter 2 details the parametric simulation sample generation, simulation-to-real enhancement, four-vertex detection network, and voltage-level safety expansion method. Chapter 3 verifies the effectiveness of the proposed method from four dimensions: dataset construction, evaluation metrics, comparative experiments, and practical application performance. Chapter 4 summarizes the entire work. Through this organization, this paper aims to provide a set of automatic detection schemes for transmission warning zones that are both academically comprehensive and directly applicable to engineering deployment.
2. Methods
The overall process of the proposed method can be summarized into four stages: offline simulation modeling, sample realism enhancement, online zone prediction, and business rule expansion. First, a 3D scene of the transmission corridor is constructed in Unity3D, and simulated samples with precise labels are automatically generated by randomly sampling tower types, line spans, camera poses, and weather conditions; then, diffusion models are used to realistic the simulated images, which are combined with limited real samples to form the training set; in the model training stage, a four-vertex polygon is used as a unified representation to learn the end-to-end mapping from monitoring images to warning zone boundaries; in the online inference stage, the basic zone is safely expanded according to the voltage level to obtain the final operationally available zone. This process realizes a hierarchical modeling idea of "geometric generation providing controllable priors, deep learning completing complex mapping, and standardized post-processing ensuring engineering legality".
As shown in Figure 3, this paper organizes data generation, model training, and rule expansion into a unified closed-loop process to ensure that the algorithm output can be directly used for zone configuration and alarm judgment in power operation and maintenance systems.
2.1. 3D Simulation Sample Generation
The overall simulation process consists of four key links: parameter sampling, scene materialization, wire vertical projection calculation, and image and label export.
Parameter sampling aims to statistically collect practical parameters (e.g., wire crossbar height, wire width, camera resolution, installation height, lens focal length, tilt angle, and yaw angle relative to the observed tower) to ensure the Unity3D scene conforms to real-world conditions, with data from on-site measurements and front-line staff’s daily statistics.
Terrain modeling relies on online terrain acquisition (including open-source high-quality datasets like Shenzhen University’s UrbanScene3D [26] and Texas A&M University’s RELLIS-3D [27], U3D open-source resources, and purchased data) and local detail processing. The terrain is reprocessed for realism, with predefined placement ranges for wires and towers to enable dynamic random parameter setting.
Component modeling involves wires, towers, hangers, and other structural components. Twenty transmission tower types are created, covering various heights, widths, bracket shapes, wire pair counts, and steel bracket densities; the wire arc is set as an active parameter, calibrated with actual data to maximize consistency with on-site objects.
Environmental parameter setup mainly includes virtual camera internal/external parameters, virtual object texture materials, and ambient light. The active range of camera parameters is set based on front-line statistics to ensure sample diversity.
The random parameter selection strategy for the above process is summarized in the following table.
After the above conditions are determined, we solve the projection of the conductor on the ground plane through the projection equation, and the formed shadow is the transmission corridor label we want to obtain. Its solution process can be briefly described by the following equations:
where is the 3D point set of the conductor, is the ground plane used to constrain the projection; denotes the geometric projection operator, denotes the camera perspective projection, which projects the 3D coordinate points of the model onto the 2D image; K is the camera internal parameter; T is the camera external parameter; denotes the projection area in the world coordinate system; denotes the final wire projection in the image coordinate system. To obtain the vertical projection of the wire on , we constrain to vertically project the wire onto the ground plane, which is then mapped to the imaging screen through perspective projection.

Table 1.
Parametric Simulation and Automatic Annotation Process of Images.
| Terrain Parameters | Object Modeling | Camera Parameters | Light Field | |||
|---|---|---|---|---|---|---|
|
Sampling points – randomly arranged within the pre-calibrated areas. Tower spacing – set to 300–450 m. Conductor sag – set to 5°–15°. Background area – evenly sampled from farmland, woodland, roads etc. |
Pole, conductor, and insulator models – established based on measured dimensions, totaling about 20 types. Appearance materials – cover five states: new, old, dry, wet, and lightly polluted. |
Focal length –8–16 mm. Tilt angle – set to -30° to -5°. Horizontal yaw angle – set to -10° to 10°. Camera height – set to 10–25 m. Image resolution – mainly 1920×1080. |
Weather types – sunny, cloudy, overcast, light rain. Illuminance range – 10000–80000 lx. Disturbances – add mild motion blur and noise |
At this time, the 2D projection points obtained on the screen are only projections of a pile of 3D points. We establish two plane line equations:
The least squares method is used to fit the two groups of 2D projection points respectively to obtain the equations of the two lines:
After obtaining the two-line equations, substitute , ,,and into the corresponding equations respectively to obtain the corresponding , , , , thus obtaining the vertex labels on the screen. Record them in the order of top-left, top-right, bottom-right, and bottom-left to obtain the accurate label of the transmission corridor. Compared with manual frame-by-frame annotation, this method can ensure the consistency of sample labels in geometric definition and avoid systematic deviations caused by subjective judgment; its idea is consistent with the method of automatically generating supervision signals based on imaging geometry and virtual environments. This process is shown in Figure 4.
2.2. Sample Realism Enhancement Module
Although simulated samples excel in diversity, automatic labeling, and accuracy, their realism still lags behind real surveillance photos, mainly due to: (1) limited weather diversity, (2) lack of camera noise and optical distortion, and (3) insufficient complex details (e.g., backlight, shadows, fog/rain). To bridge this gap, we introduce Stable Diffusion fine-tuned on real samples to re-render simulated images. Stable Diffusion is a conditional diffusion model that gradually adds/removes Gaussian noise in latent space under semantic guidance to generate specific images.
The forward diffusion process gradually adds noise to the original sample x_0 according to the following formula:
where , and is the noise scheduling coefficient. The reverse denoising process trains an improved ,to learn to predict the original noise ,from the noisy version .
where c(τ)is a conditional encoder (such as the text encoder CLIP [28]) that maps the text prompt τ to a conditional vector, and its general structure is shown in Figure 5.
From the perspective of usability and generation quality, this paper selects the excellent and ecologically mature SDXL [29] model as the basic generation backbone, combines ControlNet to realize image realistic retouching under structural constraints, and completes lightweight fine-tuning of the transmission scenario through LoRA [30]. The overall transfer strategy follows the principle of structural preservation priority, that is, improving realism without destroying the boundaries and topological structure of the target.
SDXL first compresses the input image into the latent space, completes multi-step diffusion and conditional denoising in the low-dimensional feature space, which can stably restore local textures, light levels, and inherent imaging noise of surveillance cameras while maintaining high-resolution generation quality. However, when relying only on text prompts, the diffusion model may still have unreasonable "fictional completion" in conductor contours, tower edges, and ground projection areas. To this end, this paper introduces ControlNet as a structural constraint branch, and synchronously exports the Canny edge map and depth map of the simulated image as control signals, which are injected into the U-Net denoising backbone of SDXL layer by layer through zero-initialized convolution, so that the generation process is strictly constrained by the original geometric structure.
To further improve the ability of SDXL to convert U3D scene images into real-style images, we introduce the idea of LoRA low-rank incremental parameterization. On the premise of freezing the backbone of SDXL and the main weight of ControlNet [31], we only introduce learnable low-rank incremental matrices in the U-Net cross-attention layer and some feature projection layers. We distinguish 6 categories: morning/evening, daytime, nighttime, rainy day, cloudy day, and sunny day, each containing about 200 samples. LoRA fine-tuning is used to improve the real-style generation ability of SDXL. Some training samples are shown in Figure 6, which are representative in weather, light, and texture. Since only monitoring style domain adaptation is performed, rather than complex scene semantic learning, a small number of real samples can make LoRA converge effectively.
The style conversion ability of the finally trained SDXL model for U3D samples is as follows:
Figure 7.
Style Transfer Effect of SDXL on U3D Samples.

2.3. Polygon Detection Network
After initially having a large number of accurately labeled samples, our goal is to train a stable network model to predict the ground projection position of transmission lines. This paper selects the widely used YOLO12m model in industry as the backbone model, and realizes the judgment of the transmission corridor by detecting the end of the vertical projection of the wire on the ground.
To achieve the above goal, we define the learning target of the network. Let the input image be and the warning zone prediction set and the real annotation set are defined as follows:
The vertices are all encoded in the order of top-left, top-right, bottom-right, and bottom-left, and normalized to the range of image width and height. The model goal is to learn the mapping function while satisfying the regional geometric shape and business safety boundary constraints, so that the predicted warning zone is accurate. Since the warning zone is usually approximately a quadrilateral under perspective transformation, the four-vertex parameterized expression can significantly reduce the redundant calculation caused by pixel-level segmentation, and also facilitate subsequent rule expansion and alarm judgment.
In this way, the task is defined as a regression task, and the regression target is the end of the vertical projection of the transmission line on the ground and its intersection with the image edge, totaling 8 offsets, as shown in Figure 2.
Through tests, we found that the accuracy of judging the ground projection vertices is closely related to the extension direction of the wires in the sky. If the wires in the sky are clearly visible, the prediction of ground key points is relatively accurate. Due to the small size of the wires and their small proportion in the image, the original version of YOLO12m is difficult to detect accurately. To this end, this paper optimizes the structure of YOLO12m for the ability of wire detection.
YOLO12m still follows the three-stage architecture of "Backbone-Neck-Head": the backbone network is responsible for multi-scale feature extraction, the neck network performs cross-layer fusion, and the detection head outputs target confidence and geometric parameters. The relationship between cross-layer fusion and task output is shown in the following formula. This paper retains this main structure to inherit the advantage of real-time detection, and then performs task-oriented transformation for the difficulty of thin-line target recognition. In detection theory, the YOLO12m backbone network can be regarded as a sequence of nonlinear mappings that extract local textures and global semantics layer by layer; the Neck module is responsible for the reorganization of features with different receptive fields; the Head module projects the fused features into the task output space [32,33,34,35].
To improve its ability to detect small wires, we redesign the new backbone, integrating 8 fixed linear kernels into the backbone of YOLO12 as a bypass. These 8 linear kernels are called Solid-Conv, with fixed parameters that cannot be trained. The sum of the values of each kernel is 0 to ensure that the linear kernel does not generate features on images without texture. A Relu activation layer and a trainable Conv layer are connected after Solid-Conv, and then the features are merged into the original backbone through Concat to participate in training, as shown in Figure 8.
Solid-Conv inherently has a very sensitive line segment detection ability. Through this structure, the features of wires in the image are better explored, providing stable and effective features for the detection of ground transmission corridors.
The final detection target of YOLO12m is to regress 8 normalized variables, representing the vertical projection of the outermost wires on the ground. The definition of key points is obtained according to the method in 2.1.
2.4. Voltage-Level Warning Zone Expansion
The ultimate goal of warning zone detection is not only to restore the projection of the outermost transmission lines on the ground but also to output the business zone that meets the power safety regulations. To this end, this paper introduces a voltage-level-driven post-processing expansion mechanism: according to the standard mapping relationship, 35 kV, 110 kV, 220 kV, 500 kV, and 1000 kV are mapped to safety distances of 5 m, 5 m, 8.5 m, 8.5 m, and 13 m respectively. Considering that the width of transmission lines with the same voltage level roughly follows the same law, we convert the expansion ratio into a linear ratio of the width of the middle line segment. The ratio is shown in the following table.
The specific expansion method: first, solve the center line of the transmission corridor from the detected key points; then, draw a parallel line segment on the center line according to the extension direction of the line connecting the predicted key points 2 and 3; the outward extension ratio of the line segment is preset according to the voltage level; finally, connect the endpoints of the line segment, and the formed zone is the warning zone corresponding to the voltage level, as shown in Figure 9.
Table 2.
Voltage Level and Zone Expansion Ratio.
| Voltage Level | 35kV | 110kV | 220kV | 500kV | 800kV |
|---|---|---|---|---|---|
| Extension Ratio | 1.5 | 1.5 | 2.5 | 2.5 | 3.5 |
Through the above algorithm, the scope of the warning zone on the image can be accurately calculated, and the result is not affected by changes in camera posture.
3. Experiments and Results
This paper focuses on two main lines: "experimental method design" and "experimental result verification", focusing on evaluating the impact of collaborative training of parametric simulated data, style-transferred data, and a small number of real samples on the performance of target detection in transmission scenarios. The experimental part first presents data construction, model training, and evaluation protocols, and then verifies the effectiveness and engineering availability of each link through group comparison.
3.1. Experimental Methods
The training server is configured with an AMD Ryzen 9 7950X CPU, 128G DDR5 memory, dual NVIDIA RTX 4090 graphics cards, 4TB NVMe SSD, and CUDA and cuDNN environments. The training environments for YOLO12m and SDXL are PyTorch and kohya_ss, respectively.
The training data of the YOLO12m prediction network consists of parametric simulated samples and manually verified real samples. Specifically, 5,000 parametric simulated samples and 300 real samples are used in the training phase, and the training set is expanded to 10,600 samples through flip augmentation; 300 simulated samples and 300 real samples are retained in the test phase for independent evaluation. The sample scenarios cover typical transmission corridor environments such as urban areas, roads, farmland, and construction areas to improve the representativeness of experimental conclusions for real working conditions.
In the process of real sample construction, priority is given to selecting sites with manual historical delineation records. Annotators with operation and maintenance experience review them combined with conductor projection relationships and regulatory requirements to ensure the consistency of labels in engineering semantics. To avoid overly ideal test results, a certain proportion of difficult samples are retained in the data, including slight camera shake, large-area ground shadows, and construction equipment occlusion, so that the model evaluation is closer to the actual deployment scenario.
The input resolution of the detection network is set to 1200×800, the batch size is 24, and the number of training epochs is 300. Data augmentation strategies include motion blur, Gaussian blur, brightness/contrast disturbance, noise injection, and compression degradation simulation to simulate common imaging degradation in real monitoring links. Considering that the warning zone has clear geometric constraints, rotation augmentation is disabled in the experiment to avoid introducing sample deformation that does not conform to the real topological relationship, thereby reducing training deviation caused by the destruction of geometric priors.
The training samples of SDXL are divided into 6 categories according to nighttime, evening, daytime, cloudy day, rainy day, and sunny day, with 200 corresponding feature images stored in each category. Some images have multiple of the 6 features, so they can exist in multiple categories at the same time. The prompts used for training are input through a pre-designed prompt template. In the model training phase, LoRA fine-tuning is performed based on the SDXL base, only updating the low-rank adaptation parameters of the U-Net attention layer and freezing the backbone weights. The optimizer adopts AdamW with a learning rate of 1e-4, a batch size of 4, 20 training epochs, a LoRA rank of 8, and a weight decay of 1e-2. In the inference phase, the ControlNet conditional weight is set to 0.7, CFG scale to 7.0, and sampling steps to 30 to balance structural preservation and style transfer intensity. The keywords "cartoon, illustration, anime, fantasy style, oversaturated colors, unrealistic glow, geometric distortion, duplicated poles, extra objects, text watermark, heavy artifacts" are added as negative prompts.
3.2. Evaluation Metrics
The evaluation link adopts a combined scheme of "visualization analysis + quantitative indicators + group comparison".
Visualization level: Display the coverage ability of U3D parametric simulated samples in scale, background, and illumination, and compare the changes in texture realism and illumination consistency of images before and after SDXL transfer.
Quantitative level: mIoU and AVPE are used to evaluate the accuracy of key point regression and geometric localization. Among them, mIoU is defined as:
AVPE is defined as:
where N is the number of samples, K is the number of key points, and represent the predicted and real key point coordinates, respectively, and the image size is uniformly normalized to 1280×800 for calculation.
Comparison level: Three training strategies are set for unified evaluation, namely training with only real samples, joint training with real samples + U3D simulated samples, and joint training with real samples + U3D simulated samples + SDXL transferred samples. By comparing the differences in prediction accuracy and robustness of the three groups of models, the contribution of parametric simulation and style transfer to the overall system performance is evaluated. Finally, independent evaluation is conducted on real scene data to verify the transferability and engineering effectiveness of the model in actual transmission environments, providing a basis for subsequent deployment.
3.3. U3D Sample Simulation
This automatic data generation method shows good engineering availability and research value. First, based on the U3D parameter randomization mechanism, the system can continuously generate diverse samples in dimensions such as camera pose, focal length, illumination, background disturbance, and the combination relationship between wires and towers, significantly improving the appearance coverage of the training set. Compared with the traditional fixed scene or small-scale manual sampling method, the sample distribution is more balanced, which can more fully cover the common and long-tail working conditions in actual transmission corridors.
Figure 10.
U3D Samples Generated with Different Parameters. Variable parameters include terrain, coordinates, tower shape, number of wires, wire slack, camera internal parameters, camera external parameters, etc.
Figure 10.
U3D Samples Generated with Different Parameters. Variable parameters include terrain, coordinates, tower shape, number of wires, wire slack, camera internal parameters, camera external parameters, etc.
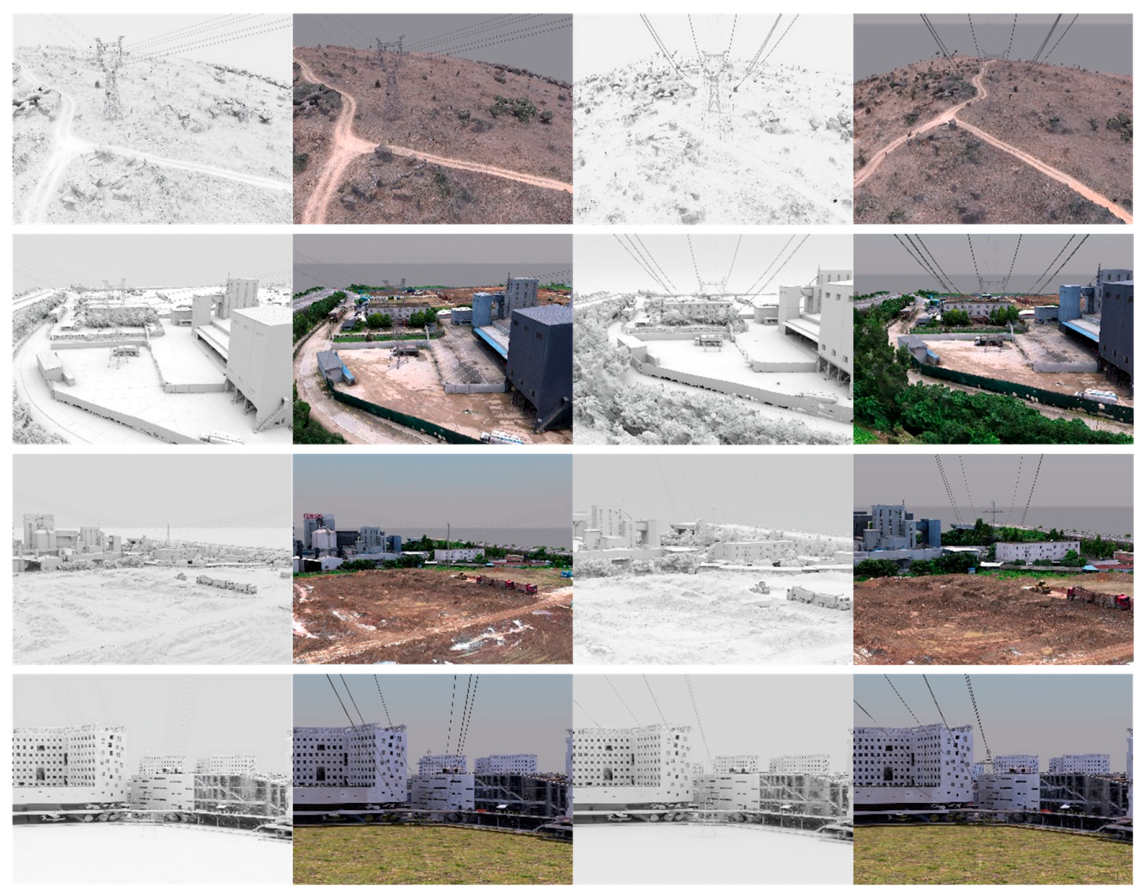
Second, the labels are directly calculated by the projection formula, avoiding the common boundary drift, inconsistent annotation scale, and subjective judgment deviation in manual framing, making the annotations more consistent in spatial position and geometric constraints. These highly consistent labels can effectively reduce the instability caused by noisy supervision during the training phase, making the model convergence process smoother, the fluctuation between repeated experiments smaller, and the results more reproducible.
Third, in model verification, after training with data generated by this method, the model's adaptability to perspective changes, scale changes, and occlusion disturbances is significantly enhanced; in cross-scene tests, false detection and missed detection are suppressed to a certain extent, and stable detection performance can still be maintained especially in complex backgrounds and unconventional shooting angles. This indicates that the data mechanism composed of "high-precision geometric annotations + high-diversity appearance disturbances" can effectively improve the generalization ability and robustness of the model.
In addition, this process also shows significant advantages in experimental organization: data construction, annotation, and quality inspection can be automatically completed in a unified pipeline, greatly reducing manual participation and iteration costs, shortening the data preparation cycle, and providing efficient data support for subsequent algorithm comparison experiments, ablation experiments, and parameter sensitivity analysis. Overall, this method not only improves data quality but also enhances the stability, scalability, and repeatability of the experimental phase. Some effects are shown in the following figure.
3.4. SDXL Realistic Style Transfer
In the experimental phase, the fine-tuned SDXL model shows strong style domain transfer and realistic generation capabilities. Based on the preset prompt system, the model can stably generate multiple types of visual style samples, and achieve high quality in terms of texture details, illumination distribution, and environmental semantic consistency. Specifically, for key visual phenomena in transmission corridor scenarios, such as ground water reflection, local overexposure under high illuminance, shadow boundary changes, and material light-dark response, the model can provide natural and physically intuitive results. This ability significantly improves the authenticity and complexity of U3D simulated samples at the appearance level, thereby enhancing the coverage ability of training data to real scene distribution. Some visualization results are shown in the figure.
In addition, the random initialization mechanism of SDXL enables the generation of multiple groups of candidate images with differences under the same prompt condition, introducing diverse changes in style, color tone, local details, and noise form while maintaining semantic consistency. This sample augmentation method of "same semantics, multiple appearances" helps alleviate the problem of data homogenization, improve the model's robustness to disturbances in complex illumination, weather, and shooting conditions, and reduce the risk of overfitting to a certain extent.
Furthermore, experiments show that the model is not only suitable for the generation task of "from simulation to realism" but also can be used for cross-style conversion between real images. For example, it can map sunny scenes to cloudy conditions and convert nighttime scenes to daytime illumination, while maintaining the relative position topology of original scene elements such as towers, wires, and ground targets. It is worth noting that there is no obvious drift in ground projection coordinates and key geometric object positions during the conversion process, indicating that this method achieves a good balance between style transfer and geometric consistency. This feature is particularly critical for detection and localization tasks that rely on spatial annotation accuracy, and can further expand the training sample domain without damaging the validity of annotations. Related effects are shown in Figure 11.
Overall, the combination of fine-tuned SDXL and U3D automatic pipeline forms a data construction framework characterized by "geometric controllability, semantic stability, and appearance diversity": the former is responsible for improving image realism and style coverage, and the latter ensures structural and label accuracy. The collaboration between the two not only improves sample quality but also enhances the distribution breadth of the dataset across weather, time periods, and lighting conditions, providing a more supportive data foundation for the subsequent improvement of model generalization performance.
3.5. YOLO12m Key Point Regression
In terms of ground transmission corridor key point prediction, we focus on comparisons from three aspects: data, model size, and model structure. The data dimension is divided into: original precisely labeled data, original precisely labeled data + U3D data, original precisely labeled data + U3D_SDXL stylized data, original precisely labeled data_SDXL stylized data + U3D_SDXL stylized data, and original roughly labeled samples for comparison, among which original precisely labeled data is the baseline; the model size is compared with three different sizes of models: YOLO12s, YOLO12m, and YOLO12l; the model structure is compared with YOLO12m and YOLO12m with the Solid-Conv structure added.
The test sample set consists of 300 manually precisely labeled samples and 300 U3D_SDXL generated samples. However, considering that U3D_SDXL data comes from simulation and cannot represent algorithm performance evaluation, it is only used to assist in evaluating whether the performance of U3D_SDXL on the test set is consistent with that of the original precisely labeled test set, thereby evaluating the practical value of the generated images. All algorithm and model comparisons are still conducted on the original precisely labeled test set.
Table 3.
Performance Comparison of Different Training Datasets.
| PL (Precisely Labeled) |
PL+U3D | PL+ U3D_SDXL |
PL_SDXL+U3D_SDXL | CL (Coarsely Labeled) |
|
|---|---|---|---|---|---|
| Sample No. | 300 | 5300 | 10300 | 16000 | 5000 |
| Real sample (mIoU) | 62.5% | 74.7% | 89.3% | 91.2% | 63.6% |
| AVPE | 49.1 | 35.2 | 15.5 | 13.9 | 48.92 |
|
U3D_SDXL sample (mIoU) |
60.2% | 78.3% | 89.6% | 92.1% | 60.8% |
The following conclusions can be drawn from the test results. First, for the task of transmission line detection, which has slender targets, multi-interference backgrounds, and complex imaging conditions, using only 300 manually precisely labeled samples for training is obviously insufficient in data scale, making it difficult to fully cover target shape changes and scene disturbances. Therefore, the model test accuracy is limited and cannot reach the ideal level. This indicates that in complex visual tasks, the number of training samples is still one of the basic factors affecting generalization ability.
Second, although the manual rough labeling scheme expands the sample scale from 300 to 5000, due to large annotation errors and weak boundary consistency, the new data cannot be effectively converted into supervision gain, and the overall accuracy improvement is not significant. This result further indicates that data quality plays a decisive role in target detection tasks: low-quality annotations may introduce systematic noise, weaken the model's ability to learn key features, and even offset the potential benefits brought by the increase in sample quantity. In other words, "more but inaccurate" annotations cannot replace "fewer but high-quality" annotations.
Third, after joint training of precisely labeled data and U3D simulated data, the model performance is significantly improved. The reason is that on the one hand, simulated data effectively improves the diversity of the training set in perspective, illumination, background, and scene layout; on the other hand, the ground projection labels generated based on the geometric projection mechanism can better maintain definition consistency, thereby expanding samples while maintaining the structural stability of supervision signals. This combination strategy achieves a good balance between "data diversity" and "label consistency", thus bringing considerable accuracy improvement.
On this basis, the performance is further improved after introducing U3D_SDXL data. Compared with pure simulated appearance, the samples enhanced by SDXL are closer to the real distribution in terms of texture details, illumination style, and imaging texture, significantly reducing the appearance gap between the training domain and the test domain. In other words, SDXL not only improves the richness of sample appearance but also enhances the model's adaptability to real scene features, thereby promoting the continuous improvement of overall accuracy.
Furthermore, the model achieves the highest accuracy after adopting the joint scheme of "precisely labeled_SDXL + U3D_SDXL", indicating that this configuration can maximize data utilization efficiency: the former provides high-quality supervision samples with real style transfer, and the latter provides large-scale, controllable, and widely covered simulated enhanced samples, which complement each other and ultimately achieve optimal performance.
It should be noted that compared with the results of the real precisely labeled test set, there is still a performance degradation of about 2%~3% in U3D_SDXL under the settings of the precisely labeled training set and the roughly labeled training set. This phenomenon indicates that although simulated enhanced data has significantly improved model performance, there is still an unavoidable distribution difference between the simulated domain and the real domain, and the two cannot be completely equivalent. In general, simulated data cannot completely replace real high-quality annotations, but it has a clear and significant promoting effect in improving model accuracy, expanding sample coverage, and reducing data construction costs, and has high engineering application value and research significance.
We employed an RTX 3060 GPU to emulate a real-world deployment scenario and compared the performance of different frameworks on transmission line corridor prediction. In comparative experiments across various YOLO frameworks, the YOLO12m model incorporating Solid-Conv convolution kernels demonstrated superior overall performance in the transmission line corridor detection task. The experimental results indicate that the detection performance of this model is essentially on par with that of YOLO12l, with mIoU being only 0.3% lower, yet it achieves a significant reduction in GFLOPs, reflecting a higher degree of lightweight efficiency. Compared with the original YOLO12m model, the proposed model improves mIoU by approximately 1.3%, with almost negligible decline in FPS. This demonstrates that the proposed Solid-Conv can effectively enhance the model’s ability to characterize linear structural features such as transmission lines, thereby improving the accuracy of ground projection.
Table 4.
Comparison of different nets.
| mIoU | Parameters | GFLOPs | FPS | |
|---|---|---|---|---|
| CenterNet [36] | 85.3% | 20.2M | 151 | 15.8 |
| Yolov8m | 88.5% | 25.9M | 195 | 36.3 |
| Yolo12m | 89.9% | 20.1M | 161 | 47.1 |
| Yolo12l | 91.5% | 26.5M | 289 | 21.5 |
| Yolo12m_Solid | 91.2% | 20.2M | 162 | 46.8 |
3.6. Validation Results
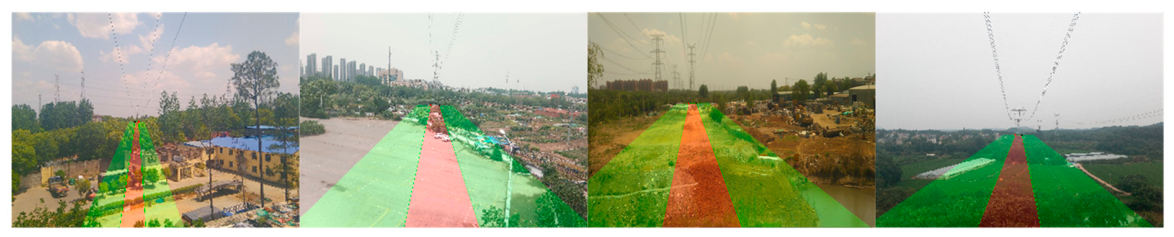
To verify the engineering effectiveness of the voltage-level-based warning zone expansion strategy, this paper conducts field verification on the warning zones output by the model in combination with the field calibration results of transmission lines at different voltage levels. The verification scenarios cover typical lines of 35 kV, 110 kV, 220 kV, 500 kV and 800 kV, focusing on the consistency between the expanded areas and on-site safety clearance requirements, as well as the stability under different viewing angles and complex backgrounds. The comparison of different voltage levels is shown in Figure 12.
The results show that the proposed method can generate reasonable warning zones in scenarios with different voltage levels. For 35 kV and 110 kV lines, the expanded areas are generally compact and can well fit the basic corridor range; for lines of 220 kV and above, with the increase of safety clearance, the lateral expansion of the areas is more obvious, but the overall boundaries remain continuous and regular without obvious distortion. This indicates that the "basic projection prediction + rule-based expansion" strategy adopted in this paper can well balance geometric positioning accuracy and business specification requirements.
Meanwhile, under the conditions of camera focal length changes, slight pan-tilt rotation and partial occlusion, the model can still automatically generate warning zones matching the current viewing angle based on the frame, avoiding the problem of frequent redrawing in the traditional manual delineation method. Overall, the proposed method can realize stable generation of warning zones at different voltage levels, and has good engineering practicability and promotion value.
4. Conclusions
Focusing on the key task of automatic detection of ground-level warning zones in transmission corridors, this paper proposes the 3DSim-WZD method and completes the end-to-end research from data construction, model design, training optimization to standardized output. Through parametric simulation sample supply, diffusion model-based realism enhancement, key point regression detection head modification and voltage-level-based safety expansion strategy, the method achieves comprehensive performance of 91.2% mIoU, 13.9 px AVPE and 46.8 FPS on the mixed test set, realizing a slight lead over mainstream methods while maintaining high real-time performance. Experimental and ablation results demonstrate that the proposed framework has more stable boundary representation capability under complex backgrounds, viewing angle changes and cross-domain scenarios, and can significantly reduce manual delineation and maintenance costs.
The significance of this work lies not only in improving a single offline accuracy index, but also in providing a regional perception design paradigm oriented to real business closed loops. This paradigm solves the sample supply problem with simulation data, the cross-domain generalization problem with domain transfer, the regional representation problem with four-vertex modeling, and the engineering compliance problem with rule-based expansion. The four links support each other and are indispensable. Through this complete pipeline, the traditional warning zone configuration process relying on expert experience maintenance has been transformed into a trainable, iterative and auditable intelligent algorithm process, providing a new technical path for the long-term stable operation of transmission monitoring systems.
Future research will focus on three aspects: first, expanding the coverage of extreme weather, nighttime and multimodal samples to further improve the robustness under harsh working conditions; second, fusing video temporal information and multi-view constraints to reduce instantaneous drift in single-frame prediction; third, constructing a cross-region rapid transfer and online continuous learning mechanism to realize multi-site, low-cost and large-scale deployment. With the continuous development of power digitalization and edge intelligence capabilities, automatic warning zone detection is expected to become an important basic module of the new generation of intelligent transmission alarm systems.
With the continuous accumulation of measured data from more sites, long-term trial operation statistics and multi-period samples, the framework proposed in this paper is expected to further complete cross-region verification and support a wider range of engineering promotion and application. Overall, 3DSim-WZD provides a technical route for automatic detection of warning zones in transmission corridors that balances geometric interpretability, cross-domain generalization capability and deployment feasibility.
Author Contributions
Conceptualization, Z.L. and C.H.; methodology, Z.L.; software, Z.L.; validation, Z.W.; formal analysis, Z.L.; investigation, Z.L. and Q.W.; resources, Z.L. and Y.L.; data curation, Z.L.; writing—original draft preparation, Z.L.; writing—review and editing, Z.L. and C.H.; visualization, Z.L. and Q.W.; supervision, C.H.; project administration, Z.L., Z.W., Q.W., C.H. and Y.L.; funding acquisition, Z.L. All authors have read and agreed to the published version of the manuscript.
Funding
This research is supported by State Grid Jiangsu Electric Power Co., LTD. Science and Technology Project, grant number J2024120.
Institutional Review Board Statement
Not applicable.
Informed Consent Statement
Not applicable.
Data Availability Statement
The data that support this study were obtained from the State Grid Jiangsu Electric Power Co., LTD. under license. Data are available from the corresponding author upon reasonable request and with permission from the State Grid Jiangsu Electric Power Co., LTD.
Conflicts of Interest
The Authors received funding from State Grid Jiangsu Electric Power Co., LTD. The funder had no role in the study design, data collection, analysis, or manuscript preparation.
Abbreviations
The following abbreviations are used in this manuscript:
| mIoU | mean Intersection over Union |
| UHV | ultra-high-voltage |
| AVPE | Average Vertex Position Error |
References
- Wang, D.; Song, R.; Liu, M.; Wang, X.; Zhang, C.; Wang, Z.; Zhao, D. DCDW-YOLOv11: An Intelligent Defect-Detection Method for Key Transmission-Line Equipment. Sens. 2026, vol. 26(no. 3), 1029. [Google Scholar] [CrossRef]
- Wang, T.; Sun, G.; Ma, M.; Hu, Z.; Li, Y.; Zhang, C. Transmission Line Defect Detection Algorithm Based on Improved YOLOv12. Electronics vol. 14(no. 12), 2432, 2025.
- Tan, X.; Hou, S.; Yang, F.; Li, Z. Transmission Lines Insulator State Detection Method Based on Deep Learning. Appl. Sci. vol. 15(no. 2), 526, 2025. [CrossRef]
- Wang, B.; Li, B.; Liu, Y.; et al. A Multi-Sensor Fusion Approach for Comprehensive Transmission Line Condition Monitoring. Appl. Sci. vol. 15(no. 14), 7965, 2025.
- Zhu, W.; Hu, F.; He, X.; Dong, L.; Yu, H.; Tian, H. A Study on the Detection Method for Split Pin Defects in Power Transmission Lines Based on Two-Stage Detection and Mamba-YOLO-SPDC. Appl. Sci. vol. 15(no. 19), 10625, 2025.
- Zhang, Q.; Wang, J.; Li, W. Insulator State Detection of Convolutional Neural Networks Based on Feedback Mechanism. Trans. China Electrotech. Soc. 2019, vol. 34(no. 16), 1–11. [Google Scholar]
- Dai, Y.; Yao, J.; Li, Y.; et al. Power Defect Recognition Method Based on Fixed-point Adaptive Selection Convolution Neural Network. High Volt. Eng. 2021, vol. 47(no. 11), 1–9. [Google Scholar]
- Huang, Y.; Chen, Z.; Chen, Q.; et al. Real-Time Detection Method for Transmission Line Faults Applying Edge Computing and Improved YOLOv5s Algorithm. Electr. Power Constr. 2023, vol. 44(no. 1), 1–9. [Google Scholar]
- Xiang, X.; Lv, N.; Guo, X.; Wang, S.; El Saddik, A. Engineering Vehicles Detection Based on Modified Faster R-CNN for Power Grid Surveillance. Sens. 2018, vol. 18(no. 7), 2258. [Google Scholar] [CrossRef] [PubMed]
- Marques, J.A.; Hermes, H.M.; Rabelo, R.A.; Anderson, A.R.; Del Ser, J. An Approach Based on Machine Learning and Mel-Frequency Cepstral Coefficients for Locating Faults in Transmission Lines. Energy Systems, 2025. [Google Scholar]
- Nardinocchi, C.; Balsi, M.; Esposito, S. Fully automatic point cloud analysis for powerline corridor mapping. IEEE Trans. Geosci. Remote Sens. 2020, vol. 58(no. 11), 7861–7872. [Google Scholar] [CrossRef]
- Shao, N.; Dai, T. Detection Technology of Intrusion Objects in Power Transmission Corridors Based on Convolutional Neural Networks. J. Phys. Conf. Ser. 2019, vol. 1314, 012032. [Google Scholar] [CrossRef]
- Zhao, Y.; Lv, W.; Xu, S.; et al. DETRs Beat YOLOs on Real-time Object Detection. arXiv 2023. [Google Scholar]
- Zhu, W.; Hu, F.; He, X.; Dong, L.; Yu, H.; Tian, H. Detection method of external damage hazards in transmission line corridors based on YOLO-LSDW. Energies 2024, vol. 17(no. 17), 4483. [Google Scholar]
- Chen, Y.; Lin, J.; Liao, X.; et al. Early Detection of Tree Encroachment in High Voltage Powerline Corridor Using Growth Model and UAV-borne LiDAR. Int. J. Appl. Earth Obs. Geoinf. 2022, vol. 108. [Google Scholar]
- He, K.; Gkioxari, G.; Dollar, P.; Girshick, R. Mask R-CNN. In Proceedings of the IEEE International Conference on Computer Vision (ICCV), 2017; pp. 2961–2969. [Google Scholar]
- Wang, X.; Kong, T.; Shen, C.; Jiang, Y.; Li, L. SOLO: Segmenting Objects by Locations. In Proceedings of the European Conference on Computer Vision (ECCV), 2020; pp. 649–665. [Google Scholar]
- Rombach, R.; Blattmann, A.; Lorenz, D.; Esser, P.; Ommer, B. High-Resolution Image Synthesis with Latent Diffusion Models. In Proceedings of the IEEE/CVF Conference on Computer Vision and Pattern Recognition (CVPR), 2022; pp. 10684–10695. [Google Scholar]
- Tobin, J.; Fong, R.; Ray, A.; et al. Domain Randomization for Transferring Deep Neural Networks from Simulation to the Real World. In Proceedings of the IEEE/RSJ International Conference on Intelligent Robots and Systems (IROS), 2017; pp. 23–30. [Google Scholar]
- Tremblay, J.; Prakash, A.; Acuna, D.; et al. Training Deep Networks with Synthetic Data: Bridging the Reality Gap by Domain Randomization. In Proceedings of the IEEE/CVF Conference on Computer Vision and Pattern Recognition Workshops (CVPR Workshops), 2018; pp. 969–977. [Google Scholar]
- Peng, X.B.; Andrychowicz, M.; Zaremba, W.; et al. Sim-to-Real Transfer of Robotic Control with Dynamics Randomization. In Proceedings of the IEEE International Conference on Robotics and Automation (ICRA), 2018; pp. 3803–3810. [Google Scholar]
- Shorten, C.; Khoshgoftaar, T.M. A Survey on Image Data Augmentation for Deep Learning. J. Big Data 2019, vol. 6(no. 60), 1–48. [Google Scholar] [CrossRef]
- Tian, Y.; Ye, Q.; Doermann, D. YOLOv12: Attention-Centric Real-Time Object Detectors. Neural Information Processing Systems (NeurIPS), San Diego, USA, 2025. [Google Scholar]
- GB 26859-2011; Safety Code of Electric Power Industry — Part of Electric Lines. Issued by General Administration of Quality Supervision, Inspection and Quarantine (AQSIQ) and Standardization Administration of China (SAC): Beijing, China, 2011.
- DL/T 741-2019; Operating Code for Overhead Transmission Line. Issued by National Energy Administration of China: Beijing, China, 2019.
- Lin, L.; Liu, Y.; Hu, Y.; et al. Capturing, Reconstructing, and Simulating: The UrbanScene3D Dataset. European Conference on Computer Vision (ECCV), 2022; pp. 93–109. [Google Scholar]
- Jiang, P.; Osteen, P.; Wigness, M.; et al. RELLIS-3D Dataset: Data, Benchmarks and Analysis. IEEE International Conference on Robotics and Automation (ICRA), 2021; pp. 1110–1116. [Google Scholar]
- Radford, A.; Kim, J.W.; Hallacy, C.; Ramesh, A.; Goh, G.; Agarwal, S.; Sastry, G.; Askell, A.; Mishkin, P.; Clark, J.; Krueger, G.; Sutskever, I. Learning Transferable Visual Models From Natural Language Supervision. Proc. 38th Int. Conf. Mach. Learn. (ICML) 2021, vol. 139, 8748–8763. [Google Scholar]
- Podell, D.; English, Z.; Lacey, K.; Blattmann, A.; Dockhorn, T.; Müller, J.; Penna, J.; Rombach, R. SDXL: Improving Latent Diffusion Models for High-Resolution Image Synthesis. arXiv 2023. [Google Scholar] [CrossRef]
- Hu, E.J.; Shen, Y.; Wallis, P.; Allen-Zhu, Z.; Li, Y.; Wang, S.; Wang, L.; Chen, W. LoRA: Low-Rank Adaptation of Large Language Models. International Conference on Learning Representations (ICLR), 2022. [Google Scholar]
- Zhang, L.; Rao, A.; Agrawala, M. Adding Conditional Control to Text-to-Image Diffusion Models. In Proceedings of the IEEE/CVF International Conference on Computer Vision (ICCV), 2023; pp. 3836–3847. [Google Scholar]
- Li, C.; Li, L.; Jiang, H.; Weng, K.; Geng, Y.; Li, L.; Ke, Z.; Li, Q.; Cheng, M.; Nie, W.; Li, Y.; Zhang, B.; Liang, Y.; Zhou, L.; Xu, X.; Chu, X.; Wei, X.; Wei, X. YOLOv6: A Single-Stage Object Detection Framework for Industrial Applications. arXiv 2022. [Google Scholar] [CrossRef]
- Wang, C.-Y.; Bochkovskiy, A.; Liao, H.-Y.M. YOLOv7: Trainable Bag-of-Freebies Sets New State-of-the-Art for Real-Time Object Detectors. arXiv 2022. [Google Scholar]
- Ge, Z.; Liu, S.; Wang, F.; Li, Z.; Sun, J. YOLOX: Exceeding YOLO Series in 2021. arXiv 2021. [Google Scholar] [CrossRef]
- Chen, K.; Liu, S.; Wang, H.; Huang, G.; Ouyang, W.; Lin, D.; Zhang, Z. YOLOv13: A Comprehensive Study of YOLO's Evolution and Beyond. arXiv 2025. [Google Scholar]
- Zhou, X.; Wang, D.; Krähenbühl, P. Objects as Points. IEEE/CVF Conference on Computer Vision and Pattern Recognition (CVPR), 2019. [Google Scholar]
Figure 1.
Definition and Function of Early Warning Areas for Transmission Lines.
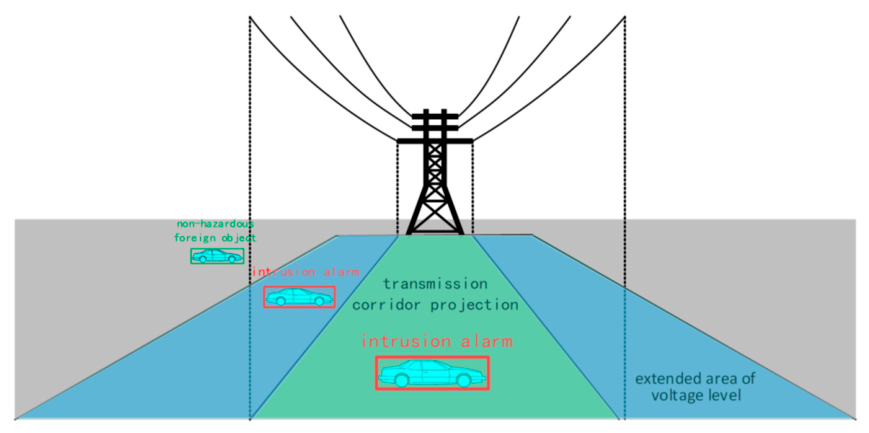
Figure 2.
Labeling of transmission corridors in real scenarios via manual precise calibration: extremely high annotation cost and significant scene presentation differences.
Figure 2.
Labeling of transmission corridors in real scenarios via manual precise calibration: extremely high annotation cost and significant scene presentation differences.
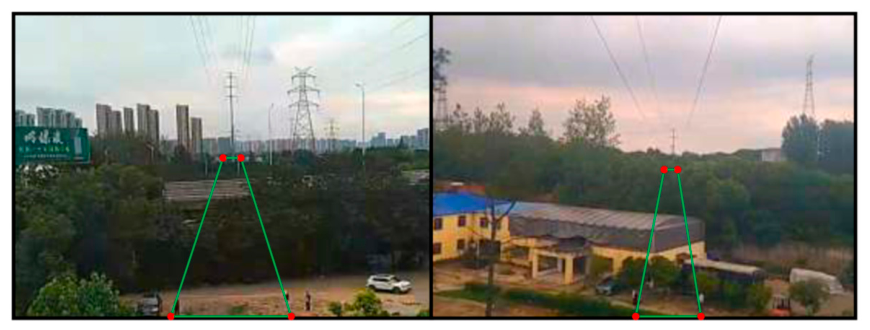
Figure 3.
Overall Process of the Proposed Method: 3D Simulation, Sample Enhancement, Transmission Line Prediction, and Expansion Algorithm.
Figure 3.
Overall Process of the Proposed Method: 3D Simulation, Sample Enhancement, Transmission Line Prediction, and Expansion Algorithm.
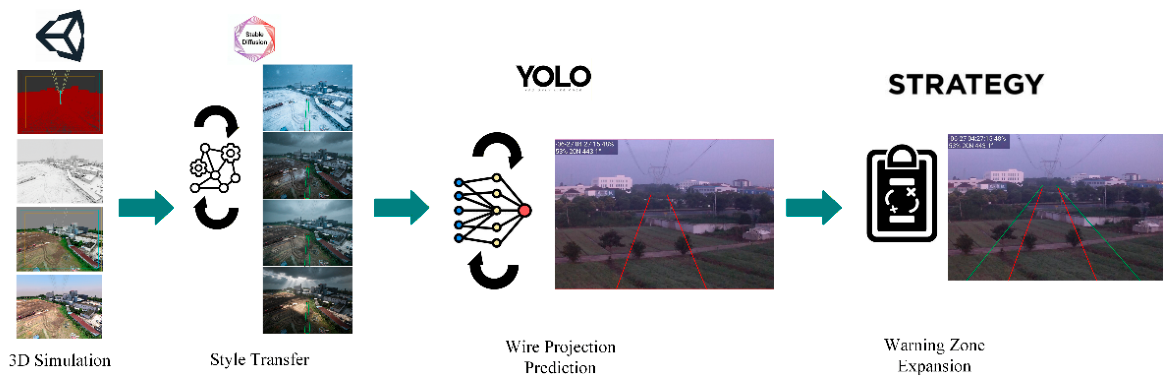
Figure 4.
3D Simulation Sample Generation Process: a. Place towers and wires in the scene with constrained random parameters, b. Perform modeling, c. Perform texture rendering, d. Perform wire projection calculation.
Figure 4.
3D Simulation Sample Generation Process: a. Place towers and wires in the scene with constrained random parameters, b. Perform modeling, c. Perform texture rendering, d. Perform wire projection calculation.

Figure 5.
Stable Diffusion Model Architecture: Essentially converting information-carrying latent layer encoding into relevant images.
Figure 5.
Stable Diffusion Model Architecture: Essentially converting information-carrying latent layer encoding into relevant images.
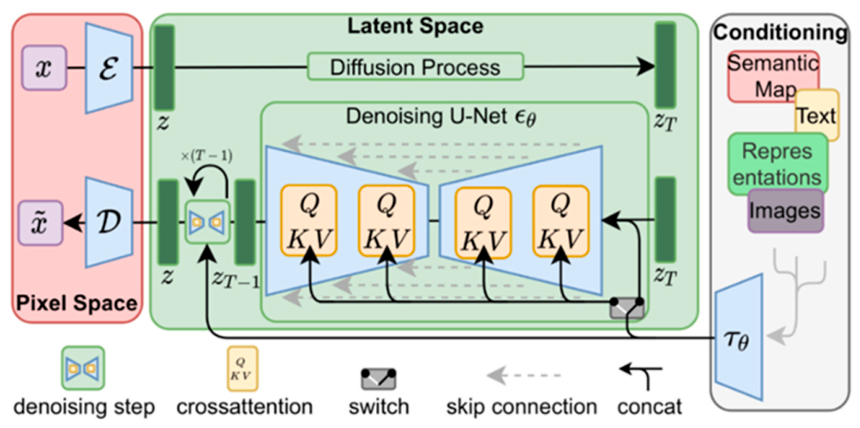
Figure 6.
Partial Samples of LoRA Fine-Tuning Database.

Figure 8.
Implanting Solid-Conv into the backbone network of YOLO12m to improve the ability of line segment detection.
Figure 8.
Implanting Solid-Conv into the backbone network of YOLO12m to improve the ability of line segment detection.
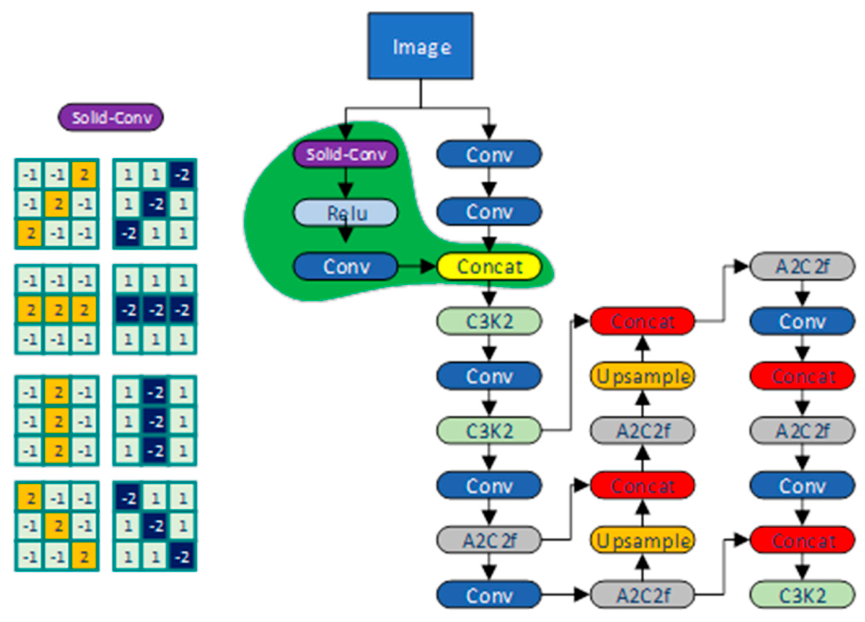
Figure 9.
Calculation Method of Expanded Warning Zone.
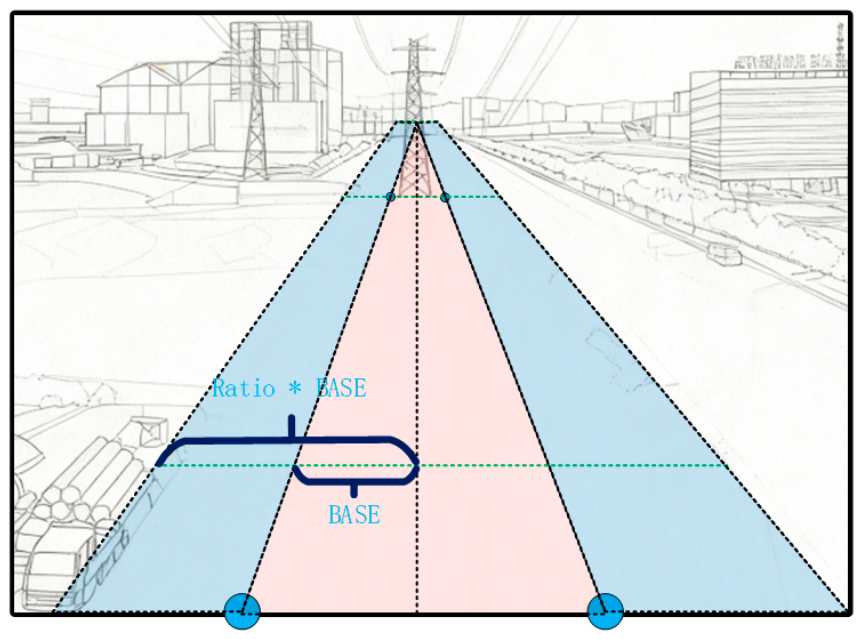
Figure 11.
Top 4 rows: Style Transfer Effect on U3D Generated Images. Bottom 4 rows: Style Transfer Effect on Real Samples.
Figure 11.
Top 4 rows: Style Transfer Effect on U3D Generated Images. Bottom 4 rows: Style Transfer Effect on Real Samples.
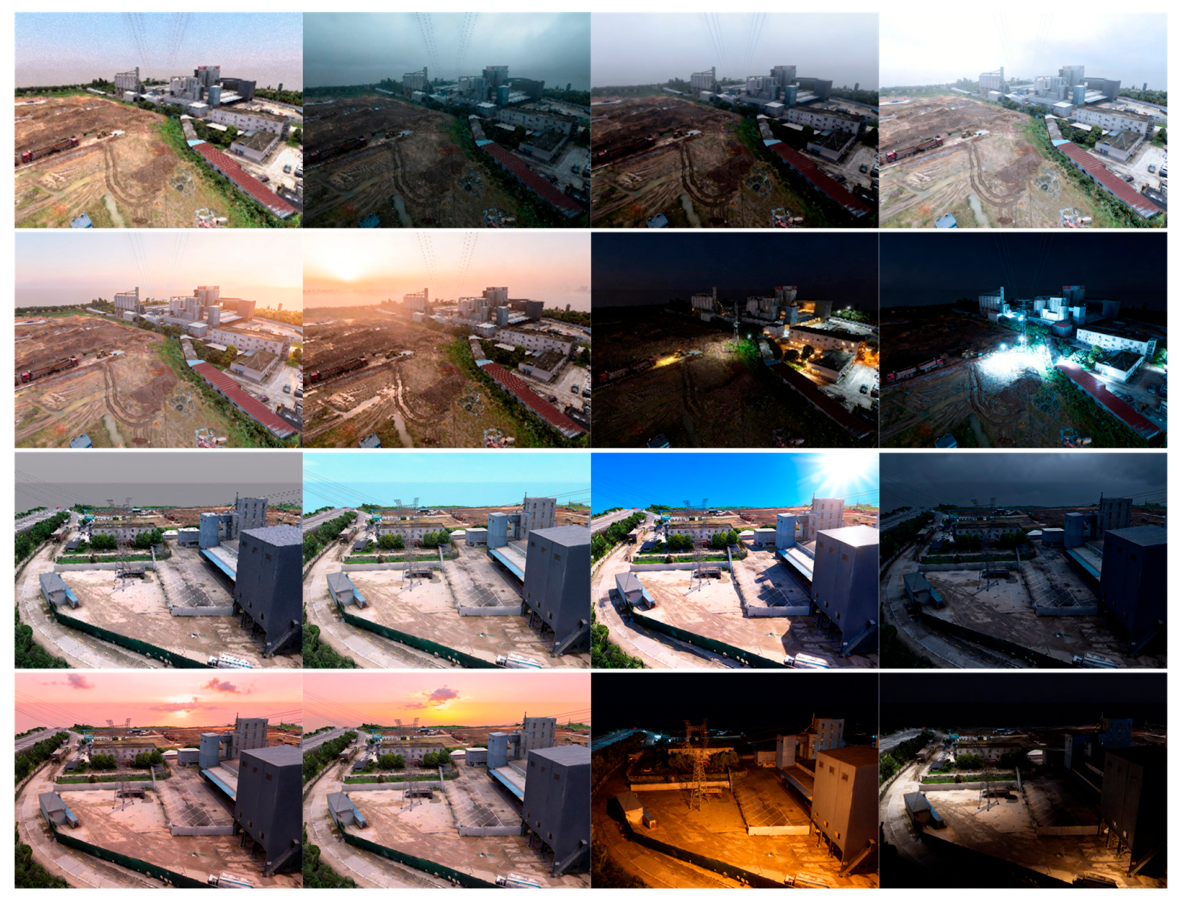
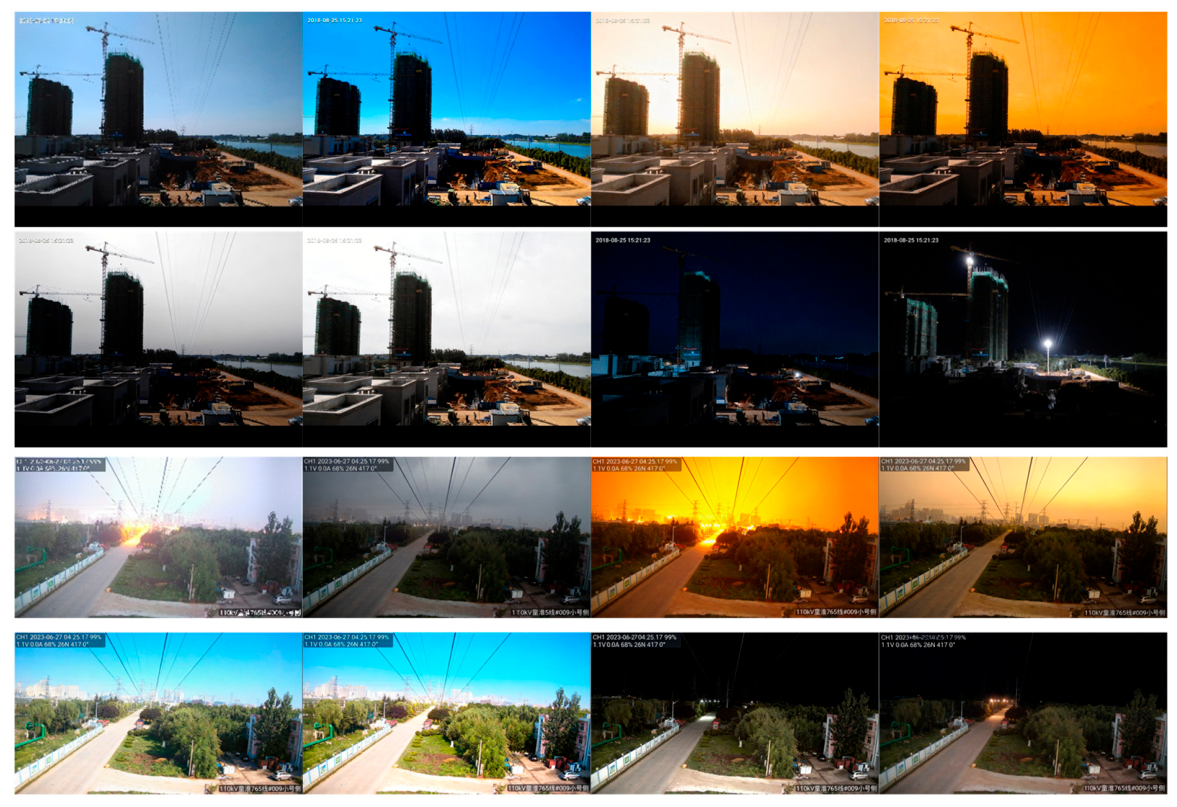
Figure 12.
Field effect comparison of warning zone expansion under different voltage levels.
Disclaimer/Publisher’s Note: The statements, opinions and data contained in all publications are solely those of the individual author(s) and contributor(s) and not of MDPI and/or the editor(s). MDPI and/or the editor(s) disclaim responsibility for any injury to people or property resulting from any ideas, methods, instructions or products referred to in the content. |
© 2026 by the authors. Licensee MDPI, Basel, Switzerland. This article is an open access article distributed under the terms and conditions of the Creative Commons Attribution (CC BY) license (http://creativecommons.org/licenses/by/4.0/).
Copyright: This open access article is published under a Creative Commons CC BY 4.0 license, which permit the free download, distribution, and reuse, provided that the author and preprint are cited in any reuse.