

Submitted:
05 May 2026
Posted:
13 May 2026
You are already at the latest version
Abstract
This study aimed to compare the levels of sialic acid (SA) in saliva during pregnancy between groups of women with preeclampsia (PE) without severity criteria and with severity criteria. 60 pregnant women diagnosed with PE were studied in total. The patients were divided into two groups: 30 women with PE without severity criteria (PEOS) and 30 women with PE diagnosis with severity criteria (PEWS). Salivary SA levels were determined using surface-enhanced Raman spectroscopy (SERS), and citrate-covered silver nanoparticles as an amplifying substrate. The mean SA concentrations of PEOS and PEWS patients were 34 ± 15.6 vs 75 ± 22 mg/dL, respectively. Participants with severity criteria had more than twice the median SA levels as those without severity criteria, as determined by the SERS-calibrated technique. Our results indicate that SA determination from saliva using SERS may become a very effective, rapid, and cost-effective diagnostic tool for PE severity.
Keywords:
preeclampsia
; PE with severity criteria
; sialic acid
; Ag nanoparticles
; Raman spectroscopy
; SERS
1. Introduction
Preeclampsia (PE) is a serious hypertensive disease of pregnancy (HDP). PE presents two basic symptoms, hypertension (blood pressure >140/90 mmHg) and, on many occasions, proteinuria [1], associated with edema and, on occasion, end-organ damage. Both manifestations define PE disease. Untreated PE may develop into the life-threatening condition of eclampsia [2]. PE is relieved only by delivery [1]. HDP is classified into chronic hypertension, gestational hypertension, PE without severity criteria, PE with severity criteria, eclampsia, and HELLP syndrome, which stands for hypertension associated with red blood cell breakdown (hemolysis), elevated liver function, and low platelet counts [3].
Eclampsia is the occurrence of seizures in preeclamptic women [2]. Causing significant rates of morbidity and mortality to both the mother and the perinatal baby. PE often begins after the twentieth week of pregnancy. PE can appear as early-onset (before 34 weeks) or late-onset (beyond 34 weeks) conditions [4].
HDP occurs in up to 10-15% of pregnancies in Mexico and is also one of the leading causes of maternal and fetal morbidity and mortality. Predictive tests allow for the identification of patients at risk of developing PE and the implementation of prevention strategies. Currently, biochemical and ultrasound markers are available to determine the risk of developing PE. The search continues for other tools that allow for the prediction of development and the prediction of the severity of presentation.
Risk factors include obesity and overweight, which in countries like Mexico have a high degree of prevalence, in addition to family or personal history of hypertension or hypertensive diseases of pregnancy, maternal age at the extremes of reproductive life, women under 20 years or over 35, multiple pregnancy and the existence of previous diseases such as diabetes, kidney diseases or autoimmune diseases, increasing the risk of developing HDP in its various degrees of severity [1,2]. Other risk factors include previous pregnancies with PE, numerous pregnancies, nulliparity, obesity, a body mass index BMI >30, a family history of PE (mother, sister), age >35, low sociodemographic level, and a long interpregnancy period >10 years [1,2,3,4].
Eclampsia, developed from poorly attended PE, is one of the main causes of maternal and newborn mortality [5,6]. PE/Eclampsia ranks among the 3 main causes of maternal death worldwide [7]. Eclampsia develops in roughly 0.8% of HDP-affected women [7]. Globally, the rate of maternal death due to PE/E varies greatly, and it has been correlated with the level of economic development in nations or regions [6,7]. PE/Eclampsia reaches up to 15 percent in low-income countries [6].
It is well established that PE reduces placental perfusion [3]. In the human placenta, fetal trophoblast cells of the fetus line the vascular gaps where the mother's blood flows [8]. These trophoblasts are permanently in proximity to maternal blood. As the embryo cells are half identical to those of the mother and half alien, the fetal trophoblasts are consequently exposed to possible immunological assault at the fetal-maternal interface [8] by the mother's biological immunity arsenal.
Numerous immune-protective mechanisms have developed alongside human evolution to prevent this immunological onslaught, creating a delicate biological balance that allows the coexistence of the trophoblasts in close contact with the mother immune system. Physical closeness is prone to imbalances of damaging consequences for both mother and fetus. Recently, Markus Abeln et al. [8] demonstrated that sialic acid (SA) is essential for the fetal-maternal human immunological protection during pregnancy, among other physiological substances. Thence, SA contributes to shielding the human placenta from an attack by the maternal immune system.
Sialic acids are a family of nine-carbon acidic monosaccharides that occur at the end of oligosaccharide chains of mucins, glycoproteins and glycolipids attached to the surfaces of cells and soluble proteins [9]. The main form of SA and almost the only type that can be found in human bodily fluids and tissues is N-acetylneuraminic acid (Neu5AC) [10]. Sialic acid can suppress the immune system, according to several research studies [11].
The presence of SA in PE patient serum has been studied and compared between PE and healthy non-pregnant women of reproductive age [12]. Similarly, a study comparing the concentration levels between women who are normally pregnant and those who have PE has been recently published by our group [13]. In this last study, saliva was used for detection rather than serum when determining SA levels. Saliva frequently shows favorable correlations between various parameters of both serum and saliva [12.14]. In that study, it was found that there is a positive link between the SA concentration in saliva and PE [13,14], corroborating the previous studies that established this correlation of SA concentration in serum and PE by Gül Ö et al [12].
As a result of the three studies mentioned above, sialic acid in either serum or saliva has emerged as a potential marker for early determination of PE-prone patients, adding to the other predictive tests in existence. Saliva is a very convenient subject for PE follow-up tests because it has the advantage of being easily accessible, and most patients have few reservations, if any, to offer their samples.
Considering these studies, we conducted a follow-up study comparing the SA levels in saliva samples taken from 30 pregnant women PE patients without severity criteria, and 30 with PE who fulfill the severity criteria, 60 in total, to determine whether there are any differences in the SA levels between these two groups of patients. We used silver-citrate functionalized nanoparticles and surface enhanced Raman spectroscopy (SERS) to assess the SA levels in female patients as applied successfully in [9,13,15].
2. Materials and Methods
2.1. Study Population
A total of 60 patients with a diagnosis of preeclampsia, 30 PEOS, and 30 PEWS diagnosed who attended the maternity emergency, hospitalization, or outpatient departments of the Hospital Central "Dr. Ignacio Morones Prieto" (HC) in San Luis Potosí City, San Luis Potosí, Mexico. The Declaration of Helsinki's ethical guidelines were followed while conducting this study. All subjects gave their written informed consent. The HC Ethics and Research Committee also gave its approval to the study.
Inclusion criteria: Pregnancy of 20 or more weeks of gestation with PE diagnosis, preeclampsia according to the CENETEC 2017 clinical practice guideline criteria [16].
Exclusion criteria:
- Patients under 18 years of age.
- Patients diagnosed with an active infectious process, pregestational diabetes, or autoimmune diseases.
The relevant data of the subjects are included in Table 1.
2.2. Data Collection and Measurements
Participants were asked to complete a questionnaire collecting relevant information about their systemic health and oral conditions, following the methodology described in references [9,13,15]. Subsequently, they underwent a two-step oral hygiene procedure, which included tooth brushing followed by rinsing with an alcohol-free mouthwash. Each participant was then provided with a sterile plastic vial and instructed to deposit 1–1.5 mL of saliva. The collected samples were stored at 4 °C until analysis. For the study, the supernatants obtained from centrifuged saliva samples (3,580 g, 6,000 rpm, 15 minutes) were used to quantify SA levels.
2.3. Materials and SERS Measurements of Sialic Acid Levels
Analytical reagent-grade salicylic acid (SA) was obtained from Sigma-Aldrich and used to calibrate the SA concentration curve during each measurement session. Calibration was based on the relative intensities of three Raman bands corresponding to controlled increases in dissolved SA concentrations, as described in reference [9]. A detailed protocol for the synthesis of silver citrate-functionalized nanoparticles is also provided in [9].
2.3.1. Ag Nanoparticles (NP) for SERS Measurements
One of the most widely employed silver colloids is prepared by reducing silver nitrate with trisodium citrate, extending the Turkevich Method from gold to silver NPs [9]. The chemical preparation process results in Ag-NP with a surface covered by a layer of negatively charged citrate ions to compensate for the positive charge of the NP surface. Citrate-reduced Ag-NP have been demonstrated to be effective in SERS detection of not only positively charged analytes [17,18], but also some negatively charged molecules, including SA [19,20,21].
This study aimed to examine the extension of SERS Raman spectroscopy to measure SA levels in human saliva using a colloidal suspension of citrate-reduced Ag-NP as a SERS substrate, applying it to compare the levels of sialic acid (SA) in saliva during pregnancy between groups of women diagnosed with preeclampsia (PE) without severity criteria, and with severity criteria.
2.3.2. Ag SERS Measurements
Raman measurements were performed using a Horiba XploRA ONE Raman spectrometer coupled to an Olympus BX41 microscope. A 20-mW green laser with an excitation wavelength of 532 nm was directed onto the sample. The laser beam was focused to a spot approximately 2–3 μm in diameter using a 10× microscope objective.
To acquire the SERS spectra, 50 μL of 2.5 × 10⁻³ M citrate-reduced silver nanoparticles (Ag-NPs) were mixed with 25 μL of centrifuged saliva or, for calibration purposes, a reference SA solution. The mixture was placed in an aluminum container. A flowchart of the procedure and additional details on data processing can be found in references [9,15]. SERS spectra were recorded over a spectral range of 400–1800 cm⁻¹. After fluorescence subtraction, the intensities of three characteristic Raman shift peaks (1002, 1237, and 1391 cm⁻¹) from each saliva sample were compared to the SA calibration curve obtained at the beginning of the session. The final SA concentration was determined by averaging the interpolated values from these three peaks.
2.4. Statistical Analysis
For statistical analysis, the R Commander 2.9-5 package, R software version 4.3.2, was used with a 95% confidence interval. A descriptive analysis of the variables was performed, with continuous variables expressed as mean ± standard deviation. Inferential analysis was performed based on the normality of the variables, determined using the Shapiro-Wilk test, to inquire if the measured SA levels followed a normal distribution. A significance level P<0.05 indicated that the SA data are not normally distributed for the PEOS. Thence, all subsequent analyses on the SA expression PE subjects were performed using non-parametric statistics. We evaluated the median plus/minus the interquartile range on the SA. Parameters such as age and body mass index BMI are normally distributed. For these, the mean and the standard deviation are reported, in Table 1, as well as their statistical significance levels (p-values). For continuous variables, as applicable, the Student t test or Mann-Whitney U test (for the SA, being non-parametrically distributed) was used. For categorical variables, the chi-square test or Fisher's exact test was used, according to the reported frequency.
The differences in the levels of SA between the median values observed in patients diagnosed with PEOS and PEWS were assessed using the Mann–Whitney U test (Table 1). A P≤0.05 value was considered statistically significant. The Mann–Whitney U test supported the hypothesis that the median levels of SA in the saliva of PEOS and PEWS subjects were significantly different, as can be seen in Table 1.
Figure 1 shows the frequency plots of SA concentrations with an interval width of 10 mg/dl in both PEOS (green bars) and POWS diagnosed patients (red bars). The Figure shows how the SA concentrations of the PEOS pregnant women are mostly clustered between SA values of 10 to 50 mg/dL, with a mean (or median) above 20 mg/dL. In contrast, in the case of PEWS patients, there exists a broad spread in SA concentrations ranging from 20 to 110 mg/dL. The median value of the SA concentration in saliva of PEOS and PEWS is 31.6 and 78.2 mg/dL, respectively, i.e. they differ by more than two and a half times as seen from Table 1. The mean values for SA are 34 and 75 mg/dL, respectively, again almost exactly two times more expression of SA in the saliva of PEWS women. These values for SA in the two types of PE affected women should be compared with the mean value 6.7 ± 7.3 mg/dL, in the general female population, as established in [15].
Figure 2 shows the boxplot of sialic acid concentration in both PEOS/PEWS groups. The very different median and mean (black squares, at the center of the boxes) SA concentrations are immediately evident in this Figure. An inset with a scatter plot of the overall data is also visible in this Figure.
3. Discussion
The results showed a significant increase in the median levels of SA in participants with PEWS, at least two times higher on average than those found in cases of PEOS. The subject of SA concentration increases in pregnant and/or PE-affected women has been treated in the literature, and our findings in this work are in line with several studies that looked at the levels of SA in PE patients' serum. As compared to healthy non-pregnant women, Gül Ö et al. [12], PE patients had higher serum total SA levels (p< 0.00001), and the SIAE gene variant enhanced PE risk by 10.4 times. In another study, Sydow et al. [22] found that only during the last trimester of pregnancy—exactly when PE typically manifests—serum SA levels did increase. A considerable increase (~27%) in the serum SA concentration during pregnancy was noted by Alvi and Armer [23] in another study that looked at the SA levels in pregnant women. Similar findings were made by Goni et al. [24], who discovered that the serum SA level gradually increased during pregnancy as the number of gestation weeks elapsed. A recent study by D’souza et. al. [25] found a significant enhancement in total serum and saliva SA (TSA) in PE patients compared to a control group of healthy pregnant women; this increase correlated with the severity of the disease. All these earlier reports corroborate that there is strong evidence that SA levels rise during pregnancy compared to women in healthy conditions, together with our previous work [13], and that in PE patients this rise is enhanced to even higher degrees, a result corroborated by the findings in either serum or saliva.
4. Conclusions
Using a SERS-calibrated approach, we found that pregnant women with PE meeting severity criteria had higher levels of SA in their saliva (median: 78.2 mg/dL) compared to participants with PE without severity criteria (median: 31.6 mg/dL). The mean SA values were 75 mg/dL and 34 mg/dL, respectively, indicating nearly a twofold increase in salivary SA expression among women with severe PE. These findings are consistent with previous reports in the literature, which measured SA using traditional HPLC absorbance techniques in serum and, more recently, in saliva when comparing PE patients with healthy pregnant women. The SERS method may therefore serve as a useful tool for determining salivary SA concentrations to evaluate the effectiveness of prenatal care monitoring in patients with PE symptoms, as well as in assessing recurrence.
Acknowledgments
We would like to acknowledge access to the Laboratorio Nacional de Análisis Físicos, Químicos y Biológicos-UASLP, which is benefiting from support through Project Proyecto LN-C-97, in particular for allowing the use of the Raman system and for providing facilities for the preparation of the silver NP’s. We gratefully acknowledge the help received from the Hospital Central of SLP staff who facilitated conducting patient interviews for this study.
Declarations Section: Compliance with ethical standards.
Research Involving Human Participants: All procedures performed in studies involving human participants were in accordance with the ethical standards of the institutional and/or national research committee and with the 1964 Helsinki declaration and its amendments or comparable ethical standards.
Informed Consent: Written informed consent was provided by all subjects before they participated in the study.
Availability of Data and Material: The Database containing the patient’s data is accessible and may be publicly accessed at https://docs.google.com/spreadsheets/d/e/2PACX-1vRi3wZvw0RM8ZFnokB07SgSEEsWUqqnJb3mfgX_5pOAKxZjfKRVoIWqrbGXVS_QwQ/pub?output=xlsx.
Declaration of Generative AI and AI-Assisted Technologies in the Manuscript Preparation Process: During the preparation of this work, the author(s) used Grammarly and, in some cases, Microsoft Copilot to correct the English of several sections of the text. After using this tool/service, the author(s) reviewed and edited the content as needed and take(s) full responsibility for the content of the published article.
References
- Bounds, Kelsey R.; Newell-Rogers, M. Karen; Mitchell, Brett M. Four pathways involving innate immunity in the pathogenesis of preeclampsia. Front. Cardiovasc. Med. 2015, 2, 1–9, Article 20. [Google Scholar] [CrossRef]
- Roberts, James M.; Gammill, Hilary S. Preeclampsia recent insights. 1243 Hypertens. 2005, 46, 1243–1249. [Google Scholar] [CrossRef]
- Available online: https://americanpregnancy.org/healthy-pregnancy/pregnancy-complications/hellp-syndrome/ Consulted in line July the 10th, 2025.
- Raymond, D.; Peterson, E. A critical review of early-onset and late-onset preeclampsia. Obstet. Gynecol. Surv. 2011, 66(8), 497–506. [Google Scholar] [CrossRef] [PubMed]
- Ghulmiyyah, Labib; Sibai, Baha. Maternal mortality from preeclampsia/eclampsia. Semin. Perinatol. 2012, 36(1), 56–59. [Google Scholar] [CrossRef]
- Al-Jameil, N.; Aziz Khan, F.; Fareed Khan, M.; Tabassum, H. A brief overview of preeclampsia. J. Clin. Med. Res. 2014, 6(1), 1–7. [Google Scholar] [CrossRef]
- Bartal, Michal Fishel; Sibai, Baha M. Eclampsia in the 21st century. Am. J. Obstet. Gynecol. 2022, 226(2S), S1237–S1253. [Google Scholar] [CrossRef] [PubMed]
- Abeln, Markus; Münster-Kühnel, Anja; Weinhold, Birgit. Sialic acid is a critical fetal defense against maternal complement attack. J. Clin. Investig. 2019, 129(1), 422–436. [Google Scholar] [CrossRef] [PubMed]
- Hernández-Arteaga; Zermeño Nava, J. J.; Kolosovas-Machuca, E. S.; Velázquez-Salazar, J.J.; Vinogradova, E.; José-Yacamán, M.; Navarro-Contreras, H. R. Diagnosis of Breast Cancer Using Surface-Enhanced Raman Spectroscopy to detect Sialic Acid Concentrations in Human Saliva. Nano Res. 2017, 10(11), 3662–3670. [Google Scholar] [CrossRef]
- Schauer, R.; Kelm, S.; Reuter, G.; Roggentin, P.; Shaw, L. Biochemistry and Role of Sialic Acids. In Biology of the Sialic Acids; Rosenberg, A., Ed.; Springer: Boston, MA, 1995. [Google Scholar] [CrossRef]
- Crocker, P.R.; Paulson, J.C.; Varki, A. Siglecs and their roles in the immune system. Nat. Rev. Immunol. 2007, 7(4), 255–266. [Google Scholar] [CrossRef]
- Gül, Ö.; Öztürk, E.; Uğur, M.G.; Cebesoy, F.B.; Kurtul, N.; Pençe, S.; Pehlivan, S.; Balat, Ö. Serum total sialic acid levels and sialic acid acetyl esterase gene variation in patients with preeclampsia. Turk. J. Obstet. Gynecololy 2012, 9, 99–105. [Google Scholar] [CrossRef]
- Hernández-Arteaga, A. C.; Saucedo-Gómez, A. C.; Godínez-Hernández, L.; Hernández-Cedillo, A.; Mendoza-Huerta, M.; José-Yacamán, M.; Navarro-Contreras, H.R. Comparative Study of Sialic Acid content in Saliva between Preeclampsia and Normal Gestation Patients. PLACENTA 2022, 130, Pages 12–16. [Google Scholar] [CrossRef]
- Salvolini, E.; Di Giorgio, R.; Curatola, A.; Mazzanti, L.; Fratto, G. Biochemical modifications of human whole saliva induced by pregnancy. BJOG An. Int. J. Obstet. Gynaecol. 1998, 105(6), 656–660. [Google Scholar] [CrossRef] [PubMed]
- Hernández-Arteaga, A. C.; Zermeño-Nava, J.J.; Martínez-Martínez, M.U.; Hernández-Cedillo, A.; Ojeda-Galván, H.J.; José-Yacamán, M.; Navarro-Contreras, H.R. Salivary Sialic Acid determination by Nanotechnology: An Useful Biomarker to Screen for Breast Cancer. Arch. Med. Res. 2019, 50 105–110. [Google Scholar] [CrossRef]
- CENETEC. Clinical practice guideline criteria for “Detection, Diagnosis and Treatment of Diseases, Hypertensive Pregnancy”, http://www.cenetec-difusion.com/CMGPC/IMSS-058-08/RR.pdf, as well as “Prevention, diagnosis and treatment of Preeclampsia, in second and third level of care”. National Center for Technological Excellence in Health. Available online: http://www.cenetec-difusion.com/CMGPC/S-020-08/ER.pdf.
- Meyer, M. W.; Smith, E. A. Optimization of silver nanoparticles for surface enhanced Raman spectroscopy of structurally diverse analytes using visible and near-infrared excitation. Analyst 2011, 136(17), 3542–3549. [Google Scholar] [CrossRef]
- Cavalu, S.; Cîntă-Pînzaru, S.; Leopold, N.; Kiefer, W. Raman and surface enhanced Raman spectroscopy of 2,2,5,5-tetramethyl-3-pyrrolin-1-yloxy-3-carboxamide labeled proteins: Bovine serum albumin and cytochrome c. Biopolymers (Biospectroscopy) 2001, 62(6), 341–348. [Google Scholar] [CrossRef]
- Munro, C. H.; Smith, W. E.; Garner, M.; Clarkson, J.; White, P. C. Characterization of the Surface of a Citrate-Reduced, Colloid Optimized for Use as a Substrate for Surface-Enhanced Resonance Raman Scattering. Langmuir 1995, 11(10), 3712–3720. [Google Scholar] [CrossRef]
- Bell, S. E. J.; Sirimuthu, N. M. S. Surface-Enhanced Raman Spectroscopy as a Probe of Competitive Binding by Anions to Citrate-Reduced Silver Colloids. J. Phys. Chem. A 2005, 109(33), 7405–7410. [Google Scholar] [CrossRef]
- Vinogradova, E.; Tlahuice-Flores, A.; Velázquez-Salazar, J. J.; Larios-Rodríguez, E.; José-Yacaman, M. Surface-enhanced Raman scattering of Nacetylneuraminic acid on silver nanoparticle surface. J. Raman Spectrosc. 2014, 45(9), 730–735. [Google Scholar] [CrossRef]
- Sydow, G.; Morack, G.; Jung, U.; Semmler, K.; Christ, S. Serum sialic acid levels in cancer, pregnancy and upper respiratory infections. Arch. Geschwulstforsch. 1986, 56(6), 413–417. [Google Scholar] [PubMed]
- Alvi, M.H.; Amer, N.A.; Sumerin, I. Serum 5-nucleotidase and serum sialic acid in pregnancy. Obstet. Gynecol. 1988, 72(2), 171–174. [Google Scholar] [PubMed]
- Goni, M.; Sayeed, M.; Shah, G.M.; Hussain, T. Serum sialic acid levels in normal pregnant and non-pregnant women. Indian J. Physiol. Pharmacol. 1981, 25(4), 356–360. [Google Scholar] [PubMed]
- D’souza, J.M.P.; Pai, V.R.; Harish, S.; Shriyan, C. Relation of serum and salivary total sialic acid and total sialic acid/total protein ratio with clinical parameters of disease progression in preeclampsia. Indian J. Clin. Biochem. 2022, 37, 113–118. [Google Scholar] [CrossRef] [PubMed]
Figure 1.
Frequency of sialic acid concentrations in saliva, for patients with preeclampsia without sever criteria PEOS (green bars), and preeclampsia sever criteria PEWS patients (red bars).
Figure 1.
Frequency of sialic acid concentrations in saliva, for patients with preeclampsia without sever criteria PEOS (green bars), and preeclampsia sever criteria PEWS patients (red bars).
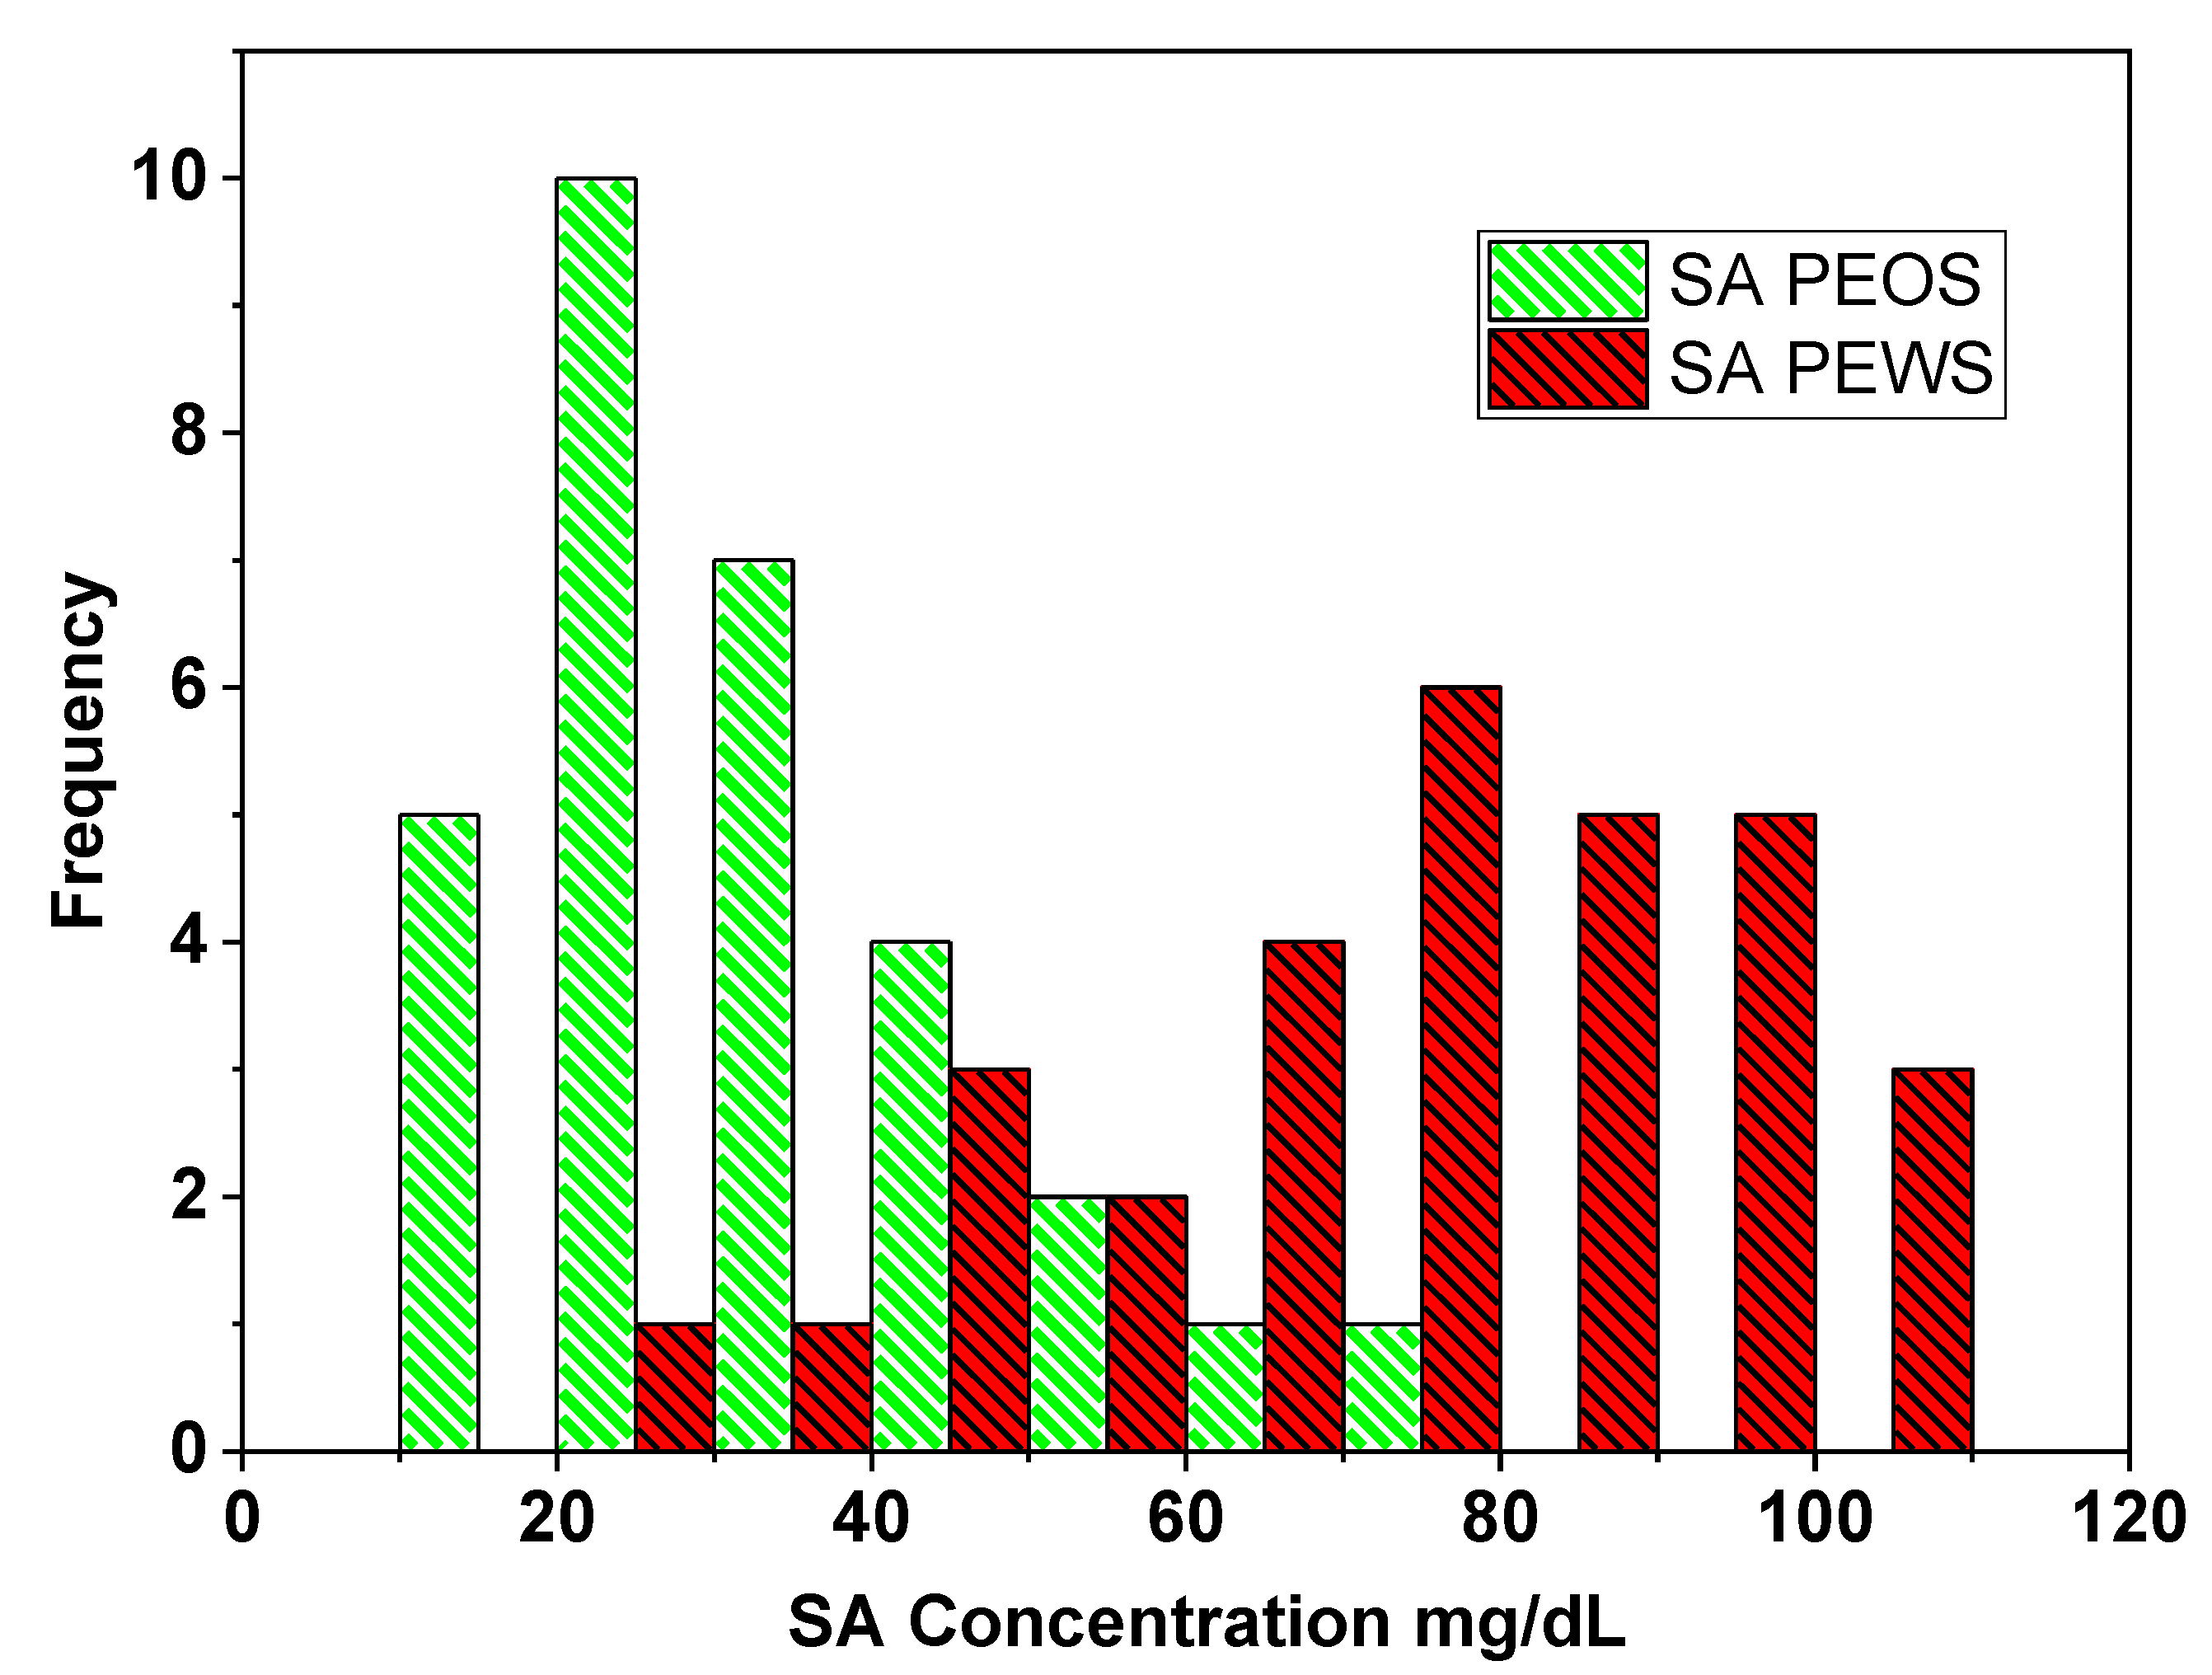
Figure 2.
Boxplot of sialic acid concentration in pregnant women with preeclampsia without severe PEOS (green box) and with severe PEWS symptoms (red box). Inset: SA concentrations scatter plot. The small diamond stands for a statistical outlier in the PEOS data.
Figure 2.
Boxplot of sialic acid concentration in pregnant women with preeclampsia without severe PEOS (green box) and with severe PEWS symptoms (red box). Inset: SA concentrations scatter plot. The small diamond stands for a statistical outlier in the PEOS data.
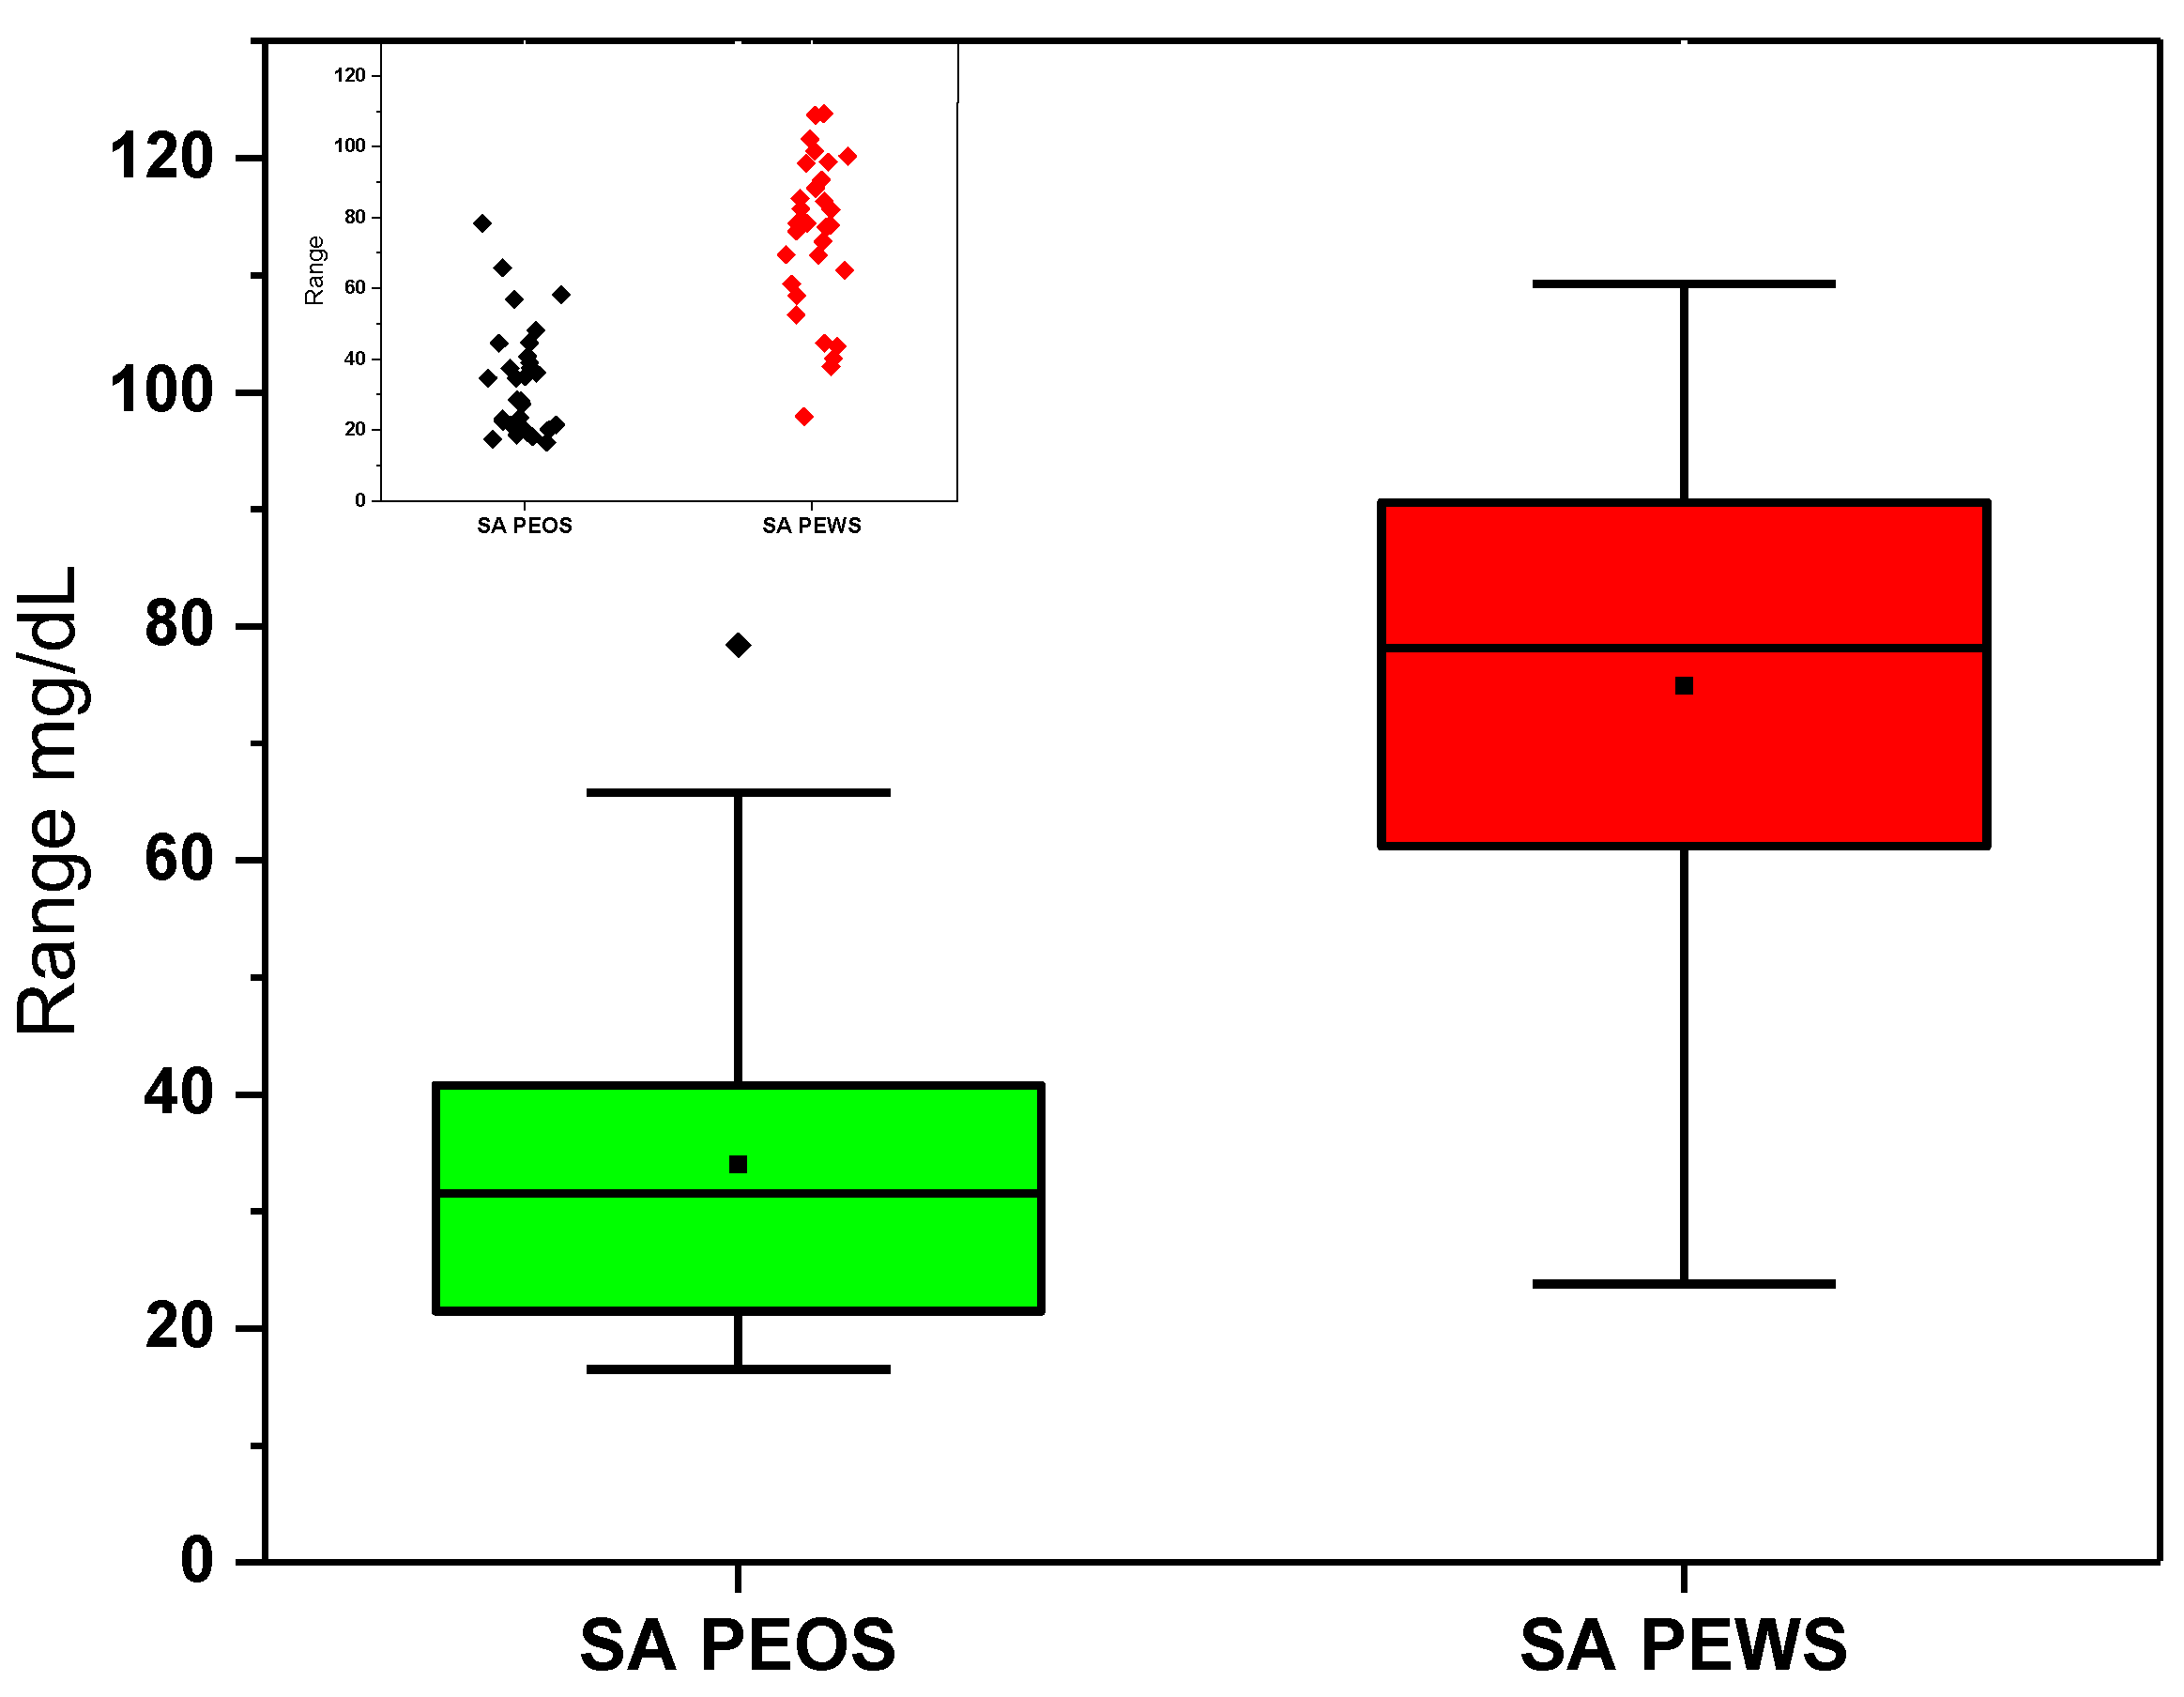

Table 1.
Study subject’s clinical parameters, and P values.
| Patient | Preeclampsia without severity criteria (PEOS) | Preeclampsia with severity criteria (PEWS) | t-Student/Mann-Whitney | Comparison between PE and NP distributions | |
| (n=30) | (n=30) | (P value) | Statistical Significance | ||
| Parameters | Units | Mean±SD/ Median (DQR1,DQR3) | Mean±SD/ Median (DQR1,DQR3) | ||
| Age | (years) | 27.2 ± 7.4 | 28 ± 7.1 | 0.683& | No difference |
| Pregnancy | (weeks) | 37.6 ± 2.7 | 36.1 ± 2.9 | 0.03^ | Significantly different |
| Gravida | # | 2.4 ± 1.4 | 2.2 ± 1.4 | 0.612& | No difference |
| Natural Deliveries | # | 1.1 ± (0,2) | 1.0 ±(0,2) | 0.681& | No difference |
| Cesarean-sections | # | 1 ± 0.9 | 1.1 ± 1.0 | 0.678& | No difference |
| Abortions | # | 0.2 ± 0.5 | 0.2 ± 0.5 | 0.681& | No difference |
| BMI | (kg\m2) | 30.1 ± 4.5 | 30.7 ± 5.7 | 0.642& | No difference |
| Weight | Kg | 73.0 ± 19.5 | 74.2 ± 15 | 0.863& | No difference |
| Systolic | (mmHg) | 141.5 ± 7.1 | 158.9 ± 15.3 | <0.001^ | Significantly different |
| Diastolic | (mmHg) | 89.6 ± 4.9 | 98.7 ± 10.3 | <0.001^ | Significantly different |
| Proteinuria | frequency | 30 | 19 | <0.001^ | Significantly different |
| Sialic Acid SA | mg/dL | 34 ± 15.6 | 75 ± 22 | <0.0001^ | The PEOS&PEWS SA distributions are significantly different |
| Median SA | 31.6 ± (21.6,40.4) | 78.2 ± (62.2,90.0) |
& T de Student test; ^ U Mann-Whitney test.
Disclaimer/Publisher’s Note: The statements, opinions and data contained in all publications are solely those of the individual author(s) and contributor(s) and not of MDPI and/or the editor(s). MDPI and/or the editor(s) disclaim responsibility for any injury to people or property resulting from any ideas, methods, instructions or products referred to in the content. |
© 2026 by the authors. Licensee MDPI, Basel, Switzerland. This article is an open access article distributed under the terms and conditions of the Creative Commons Attribution (CC BY) license (http://creativecommons.org/licenses/by/4.0/).
Copyright: This open access article is published under a Creative Commons CC BY 4.0 license, which permit the free download, distribution, and reuse, provided that the author and preprint are cited in any reuse.