

Submitted:
12 May 2026
Posted:
13 May 2026
You are already at the latest version
Abstract
Geochemical anomaly detection plays a critical role in mineral exploration, yet conven-tional methods are often limited by compositional effects, sensitivity to outliers, and in-sufficient consideration of spatial relationships. To address these issues, this study pro-poses an integrated analytical framework that combines compositional data analysis and spatial statistics for robust geochemical anomaly identification. The framework incor-porates isometric log-ratio (ILR) transformation to eliminate the closure effect, robust principal component analysis (RPCA) to extract stable geochemical patterns, local indi-cators of spatial association (LISA) to characterize spatial clustering, and compositional balance analysis (CoBA) to enhance anomaly signals. The method is applied to the Barkol Lake area in the Eastern Tianshan, a key metallogenic belt within the Central Asian Orogenic Belt. The results reveal significant geochemical anomalies characterized by Cu-associated element assemblages (e.g., Cu–Ni–Cr), which are spatially correlated with major fault zones and volcanic–intrusive complexes. The identified anomalies show strong consistency with known mineral occurrences and delineate several prospective targets for copper polymetallic mineralization. Compared with conventional approaches, the proposed framework demonstrates improved robustness to outliers, enhanced sensi-tivity to weak anomalies, and better integration of compositional and spatial constraints. These advantages highlight its effectiveness for geochemical anomaly detection and mineral prospectivity mapping in complex geological settings.
Keywords:
compositional balance analysis
; geochemical anomaly identification
; mineralization prediction
; Barlikun Lake
; Cu polymetallic deposits
1. Introduction
Geochemical anomaly detection is a fundamental step in mineral exploration and plays a crucial role in identifying potential mineralization targets. With the increasing availability of large-scale geochemical datasets, a variety of statistical and machine learning methods have been developed to improve anomaly recognition. However, conventional approaches often suffer from several inherent limitations, including sensitivity to outliers, neglect of compositional constraints, and insufficient integration of spatial information [1,2,3].
Geochemical data are intrinsically compositional in nature, meaning that they are subject to constant-sum constraints that can lead to spurious correlations and biased statistical interpretations [4]. To address this issue, compositional data analysis (CoDA) has been widely applied in geochemical studies, particularly through log-ratio transformations such as the isometric log-ratio (ILR) [5,6,7], which effectively eliminate closure effects and enable meaningful statistical analysis [8,9,10,11].
Within the CoDA framework, the variation matrix provides a fundamental tool for quantifying pairwise log-ratio variances between components, thereby capturing the intrinsic relationships and relative variability among geochemical elements [12,13,14]. Although the variation matrix effectively characterizes internal compositional structure, it does not explicitly account for noise, outliers, or spatial heterogeneity in geochemical data [15,16,17].
To overcome these limitations, robust principal component analysis (RPCA) is employed to extract stable geochemical patterns while minimizing the influence of extreme values [18,19,20]. In addition, spatial statistical approaches, such as local indicators of spatial association (LISA), are introduced to identify spatial clustering of anomalies and distinguish between meaningful geochemical signals and random variations [21,22]. Despite these advances, most existing studies treat compositional structure, statistical robustness, and spatial relationships independently, lacking an integrated analytical framework that links these components . Therefore, this study proposes an integrated approach that combines compositional, statistical, and spatial constraints for geochemical anomaly detection. The proposed framework incorporates ILR transformation to address compositional effects, RPCA to enhance robustness, LISA to characterize spatial structures, and compositional balance analysis (CoBA) to further refine anomaly signals. The methodology is applied to the Barlikun Lake area in the Eastern Tianshan, which is part of the Central Asian Orogenic Belt (CAOB)—one of the most important metallogenic belts globally, hosting numerous copper and polymetallic deposits.
The objectives of this study are to:
(1) develop a multi-constraint analytical framework for geochemical anomaly detection;
(2) identify geochemical anomalies associated with copper polymetallic mineralization; and
(3) evaluate the effectiveness of the proposed method for mineral prospectivity mapping in complex geological settings.
2. Materials and Methods
2.1. Study Area and Sample
The study area is located in the Barlikun Lake region of eastern Xinjiang, northwestern China, within the western part of Barlikun Autonomous County (Figure 1). Geographically, the area lies approximately between 92°00′–93°00′E and 43°20′–44°00′N and belongs to the eastern segment of the Tianshan Mountains [23,24,25]. Tectonically, the region is situated within the Eastern Tianshan orogenic belt, which forms an important segment of the southern margin of the Central Asian Orogenic Belt (CAOB) [26,27,28]. The CAOB represents one of the largest accretionary orogenic belts in the world and experienced a complex tectonic evolution during the Paleozoic, involving oceanic subduction, accretion, continental collision, and post-collisional extension. These tectonic processes led to extensive magmatism, strong structural deformation, and widespread metallogenic activity in the Eastern Tianshan region. The Eastern Tianshan is one of the most important metallogenic belts in the Central Asian Orogenic Belt, hosting numerous Cu, Ni, Au, and polymetallic deposits [29,30].
The stratigraphic framework of the study area is dominated by Paleozoic strata, including Devonian (Figure 2), Carboniferous, and Permian formations, whereas Mesozoic–Cenozoic deposits mainly occur in intermontane basins and lowlands. The Devonian strata are mainly composed of marine sedimentary rocks, including sandstones, siltstones, and mudstones, locally interbedded with volcanic clastic rocks. The Carboniferous strata are the most widely distributed lithological units in the region and consist mainly of volcanic–sedimentary assemblages such as tuff, volcanic breccia, and andesitic volcanic rocks, reflecting intense volcanic activity during this period. The Permian strata are dominated by continental clastic deposits, including sandstones, conglomerates, and mudstones, which commonly overlie the Carboniferous formations with unconformable contacts. Mesozoic and Cenozoic sediments, including Jurassic and Quaternary deposits, are mainly distributed within the Barlikun basin and surrounding intermontane depressions.
Magmatic rocks are widely distributed in the study area and mainly include intermediate–felsic intrusive rocks and mafic to intermediate volcanic rocks. Major lithologies include granite, granodiorite, diorite, and andesite. Most magmatic activities occurred during the Carboniferous to Permian, corresponding to the late stages of the Paleozoic tectonic evolution of the Eastern Tianshan orogenic belt. These magmatic events are closely associated with regional tectonic processes and played an important role in the metallogenic evolution of the region.
The structural framework of the study area is dominated by fault systems and fold structures. Regional structures generally exhibit an east–west orientation, consistent with the overall structural trend of the Tianshan orogenic belt and forming a complex fault network. These faults are considered to play a significant role in controlling the emplacement of magmatic rocks and the distribution of mineralization. In addition, Paleozoic strata in the area have undergone multiple phases of tectonic deformation, resulting in the development of folds whose axial trends are generally parallel to the regional east–west structural direction.
The Barlikun Lake region hosts a variety of mineral resources and is characterized by well-developed copper and polymetallic mineralization. Ore bodies commonly occur as veins or lenticular bodies within volcanic and sedimentary rocks and are frequently associated with fault zones. The main ore minerals include chalcopyrite, bornite, and malachite, accompanied by hydrothermal alteration such as silicification, chloritization, and carbonation. These geological features suggest that mineralization in the study area is closely related to hydrothermal processes controlled by regional fault systems and magmatic activity, forming favorable conditions for copper polymetallic mineralization.
A total of 560 stream sediment samples were collected in this study, with a sampling density of approximately one sample per 4 km² (Figure 3). Sample collection and processing strictly followed the relevant geochemical exploration specifications. A total of 39 elements were analyzed, of which 11 elements closely related to mineralization (Cu, Cr, Ni, Co, V, Ti, As, Sb, Pb, Hg, and Au) were selected for further analysis. These elements represent mineralization indicator elements, associated elements, and indicators of hydrothermal activity, and can effectively reflect regional metallogenic processes.
2.2. overall Framework of the Method
Geochemical anomaly identification involves multiple sources of complexity, including the closure effect of compositional data, the interference of extreme values in statistical analyses, and the spatial heterogeneity of mineralization-related information. To address the above issues, this study establishes a hybrid-driven analytical framework that integrates compositional constraints, statistical robustness, and spatial structural information.
This framework is grounded in the theory of compositional data analysis. The closure effect is first eliminated using the isometric log-ratio (ILR) transformation. On this basis, the variation matrix and robust principal component analysis (RPCA) are integrated to identify stable elemental association patterns, while the local indicators of spatial association (LISA) are employed to introduce spatial constraints. Finally, compositional balances are constructed through sequential binary partitioning (SBP), enabling the quantitative representation and identification of geochemical anomalies.
The overall technical workflow is illustrated in Figure 4 and can be summarized into four key steps: data preprocessing, identification of elemental associations, spatial structural constraint, and balance construction with anomaly detection.
2.3. Component Constraint Processing: ILR Transformation
Geochemical data represent typical compositional data, in which individual components are constrained by a constant sum, giving rise to the “closure effect,” which can easily lead to spurious correlations among variables. To eliminate this issue, the isometric log-ratio (ILR) transformation was applied to map the original data from the simplex space to the Euclidean space [5].
The ILR transformation constructs an orthonormal basis to convert the original compositional variables into a set of mutually independent balance variables, thereby satisfying the requirement of variable independence in multivariate statistical analysis. At the same time, this transformation can effectively improve the skewness of the data distribution, thereby providing a reliable data foundation for subsequent analyses [5].
2.4. Element Combination Identification
Understanding elemental associations is crucial for identifying geochemical processes related to mineralization. The variation matrix proposed by Aitchison is used to quantify the variability of log-ratios between element pairs; lower variation values indicate stronger associations between elements [20,31]. The variation matrix helps reveal potential mineralization-related associations among groups of elements exhibiting similar geochemical behavior. These associations provide a geochemical basis for constructing compositional balances.
Geochemical data often contain outliers resulting from mineralization processes or analytical noise. Traditional principal component analysis (PCA) is highly sensitive to such outliers, which may distort the intrinsic structure of the data. To overcome this limitation, robust principal component analysis (RPCA) [32,33] was employed. This method decomposes the dataset into two components: a low-rank structure and sparse noise.
This approach enhances the stability of principal components and enables the identification of key geochemical patterns associated with mineralization processes. The principal components derived from RPCA are subsequently used to identify major geochemical associations and to guide the construction of the balance dendrogram.
2.5. spatial Structure Constraints: Lisa Analysis
Geochemical anomalies are not only manifested through elemental association patterns but also exhibit significant spatial distribution characteristics. To incorporate spatial information constraints, the local indicators of spatial association (LISA) were employed to analyze the spatial autocorrelation of the major elements [22,34]. The Moran’s I index of local spatial association can be expressed as follows [34]:
In this expression, xi denotes the value of attribute i, represents the mean of the corresponding attribute, and wi,j denotes the spatial weight matrix between features i and j. Si2 can be expressed as follows [34]:
LISA can identify local spatial clustering patterns, including high–high (HH) clusters, low–low (LL) clusters, and spatial outliers (HL and LH) [35,36,37]. Among these, high–high clusters are typically closely associated with mineralization processes.
Through LISA analysis of key elements (such as Cu, Cr, and Ni), the spatial distribution consistency and structural control characteristics can be evaluated, thereby providing spatial constraints for subsequent balance construction.
2.6. balance Building and Anomaly Identification: SBP and CoBA
Under the combined influence of elemental associations and spatial constraints, a compositional balance system was constructed using sequential binary partitioning (SBP) [38]. Sequential binary partitioning (SBP) converts a multielement system into a set of balance variables with clear geological significance by progressively dividing the elements into binary groups. By quantitatively analyzing the relationships among components within the two groups [39], a specific balance dendrogram is constructed to investigate the compositional relationships among variables and their spatial distribution patterns. Through visualized data processing, intuitive geological interpretation can be achieved. The mathematical expression is given as follows:
x+ represents mineralization-enriched elements, whereas x- represents background elements.
Based on the constructed balance variables, geochemical anomaly identification was carried out using the compositional balance analysis (CoBA) method [40,41,42]. Compared with traditional approaches based on single elements or simple element combinations, balance variables can comprehensively reflect the relative relationships among multiple elements, thereby enhancing the stability of anomaly identification and the capability for geological interpretation.
Finally, by comparing the proposed approach with conventional methods (such as RPCA and element overlay), its advantages in anomaly identification performance and spatial consistency were evaluated. The CoDA biplot was visualized using the open-source R package robCompositions [16]. The CoDaPack software was an important tool used in this study for compositional balance analysis, including the construction of sequential binary partitions (SBP) and the visualization of balance dendrograms [43].
Compared with traditional approaches, this framework integrates compositional constraints, statistical constraints, and spatial constraints into a unified system, thereby simultaneously enhancing both robustness and interpretability.
3. Results
3.1. Element Combination Feature Recognition
To identify key elemental associations related to mineralization, the variation matrix (Table 1) was first calculated based on the ILR-transformed data. The results indicate that Cu, Cr, and Ni exhibit relatively high variation values with respect to other elements, suggesting that their geochemical behavior is relatively independent and may reflect specific mineralization processes.
Further analysis of element loading characteristics using RPCA (Figure 5) shows that Cu, Cr, and Ni exhibit consistent positive loadings in the principal component space and contribute significantly to the same principal component, indicating a stable co-variation relationship among the three elements in a statistical sense. This consistency suggests that they may originate from the same or similar geological processes [41].
At the spatial scale, the LISA analysis results (Figure 6) indicate that Cu, Cr, and Ni all exhibit significant high–high (HH) clustering characteristics, with highly consistent spatial distributions that are mainly aligned along the N–S trending structural belt. These results indicate that the three elements are not only statistically correlated but also exhibit coordinated enrichment in spatial distribution, and are controlled by regional tectonic structures.
By integrating the results of the variation matrix, RPCA, and LISA analyses, Cu–Cr–Ni can be identified as the principal mineralization-related elemental association in the study area.
3.2. Composition Balance Characteristics and Data Structure Optimization
Based on the identified elemental association, a compositional balance system was constructed using sequential binary partitioning (SBP) (Table 2). Among these, balance b2 (Cu–Cr–Ni) was selected as the key variable representing mineralization processes [37,45].
Statistical analysis results (Figure 7) indicate that, compared with the original elemental combinations, the data distribution of balance b2 is significantly improved. Specifically, the skewness and kurtosis are significantly reduced, and the data distribution shifts from a strongly skewed pattern to an approximately symmetric distribution, indicating that the influence of extreme values on the data structure has been effectively suppressed.
In addition, the balance variable exhibits greater stability at the overall scale, with a more concentrated value range, which helps to highlight anomalous signals and reduce background noise interference. This indicates that the CoBA method can optimize the geochemical data structure through balance construction, thereby improving the reliability of subsequent anomaly identification.
3.3. Geochemical Anomaly Identification Results
Spatial interpolation and anomaly extraction based on balance b2 were performed to obtain the geochemical anomaly distribution pattern in the study area. The geochemical anomaly maps of the above balances were visualized using ArcGIS Pro™ 3.1, and spatial interpolation was carried out using the inverse distance weighting (IDW) method. The results (Figure 8) show that the anomalous zones are mainly distributed in a belt-like pattern, extending overall in an east–west direction, and forming high-intensity anomaly centers in localized areas. Compared with the original element overlay method (Figure 8a), the anomalies identified based on balance b2 (Figure 8b) exhibit the following significant characteristics:
(1) The anomaly distribution is more continuous, with a clearer spatial structure;
(2) Background noise is significantly reduced, and anomaly boundaries are more distinct;
(3) The distribution of anomaly intensity is more balanced, avoiding results dominated by local extreme values.
Further comparison with the RPCA principal component results (Figure 8c) shows that the anomalous zones identified by the CoBA method are more spatially concentrated and exhibit a higher degree of correspondence with regional structures and known mineralization locations. This indicates that balance variables integrating compositional constraints and spatial information can more accurately reflect mineralization-related geochemical processes.
3.4. Division and Verification of Metallogenic Prospect Areas
Based on the distribution characteristics of geochemical anomalies and in combination with the regional geological background, five mineral prospecting target areas were delineated in the study area (Figure 9), including two Class I targets, two Class II targets, and one Class III target. Field verification results indicate (Table 3):
The Cu content in Zone I-1 ranges from 0.5% to 1.3%, with an average of approximately 0.85%.
The Cu content in Zone I-2 ranges from 0.5% to 1.0%, with an average of approximately 0.75%.
Both meet or exceed the industrial grade for sulfide ores (0.4%–0.5%).
The ore bodies are predominantly hydrothermal vein-type, with mineral assemblages including chalcopyrite, bornite, and malachite. Well-developed wall-rock alteration is observed, indicating favorable mineralization conditions in the area. Among them, the Class I targets (I-1 and I-2) exhibit the strongest anomaly responses and show a high degree of correspondence with fault structures and known mineralization sites. Although the Class II and Class III target areas exhibit relatively weaker anomaly intensities, they still display distinct Cu–Cr–Ni association characteristics and thus possess potential for further exploration.
4. Discussion
The variation matrix and RPCA results indicate that Cu, Cr, and Ni exhibit strong associations, suggesting a common geochemical origin [31,41,42]. These elements are commonly associated with mafic and ultramafic rocks, which are widely distributed in the eastern Tianshan region. Their enrichment may reflect magmatic differentiation processes or hydrothermal fluid activity associated with mineralization. The spatial clusters identified by LISA further corroborate the geological significance of these elemental associations, as the high–high clusters coincide with the locations of known mineralization belts [22,34]. In addition, this elemental association is spatially concentrated along the N–S trending structural belt, indicating that tectonic activity played a key role in controlling the migration and enrichment of ore-forming materials.
The multi-method analytical framework integrating RPCA, LISA, and CoBA constructed in this study achieves a complete workflow from “Element identification” + “Spatial verification” + “Anomaly extraction”. Compared with traditional approaches, this framework presents the following innovations: First, RPCA identifies elemental associations in the ILR-transformed geochemical data, thereby avoiding the interference of outliers on the results. Second, LISA analysis verifies the rationality of these elemental associations from a spatial perspective, enabling the results to possess geological spatial significance. Finally, the CoBA method extracts anomalies through compositional balances, achieving a unified representation of statistical and spatial information. This triple-constraint mechanism integrating “Statistical” + “Spatial” + “Compositional” information ensures that anomaly identification no longer relies on a single method but is instead based on multidimensional consistency, thereby significantly improving the reliability of the results.
Compared with original element overlay or principal component analysis methods, the approach proposed in this study demonstrates clear advantages in geochemical anomaly identification. Specifically, traditional methods often suffer from dispersed anomalies, indistinct boundaries, and results dominated by local extreme values. In contrast, the methodological framework developed in this study can: (1) improve the continuity and integrity of anomalous zones; and (2) integrate multielement information through balance variables, thereby enhancing the expression of mineralization signals, reducing background noise interference, and clarifying anomaly boundaries.
The mineral prospecting target areas delineated based on the method proposed in this study show a high degree of spatial correspondence with known mineralization sites. Field verification results further indicate that the Class I targets have reached industrial-grade levels, demonstrating that this method has strong practical applicability in mineral exploration.
5. Conclusion
Based on compositional data analysis theory and spatial statistical methods, this study established a multi-method coupled framework integrating” RPCA” + “LISA” + “CoBA” to systematically analyze geochemical data from the eastern Tianshan region of Xinjiang, leading to the following main conclusions:
(1) The multi-method coupled framework proposed in this study achieves an integrated combination of statistical analysis, spatial analysis, and compositional constraints, establishing a complete technical workflow of “Elemental association identification” + “Spatial consistency verification” + “Compositional balance representation” + “Anomaly extraction”.
(2) The mineral prospecting target areas delineated using this method show a high degree of correspondence with known mineralization sites. Field verification indicates that the Class I targets have reached industrial-grade levels, demonstrating that this approach has strong applicability and reliability in practical mineral exploration and prospecting prediction.
Author Contributions
Conceptualization, T.L., J.W., K.Z., Q.Q., S.Z. ; methodology, T.L., C.L.; validation, T.L.; formal analysis, T.L.; investigation, T.L., J.B. and Q.Z.; resources, J.W. and K.Z.; data curation, T.L., W.W. and Z.C., Y.B., X.M.,G.J.,; writing—original draft preparation, T.L.; writ-ing—review and editing, J.W.; supervision, J.W., J.B. and K.Z.; project administration, J.W.; funding acquisition, J.W., W.W. and J.B. All authors have read and agreed to the published version of the manuscript.
Funding
This research received no external funding.
Data Availability Statement
The original contributions presented in the study are included in the article, further inquiries can be directed to the corresponding author.
Conflicts of Interest
The authors declare no conflict of interest.
References
- Pawlowsky-Glahn, V.; Egozcue, J.J.; Tolosana-Delgado, R. Modeling and Analysis of Compositional Data; John Wiley & Sons: Hoboken, NJ, USA, 2015. [Google Scholar] [CrossRef]
- Filzmoser, P.; Hron, K.; Reimann, C. Interpretation of multivariate outliers for compositional data. Comput. Geosci. 2012, 39, 77–85. [Google Scholar] [CrossRef]
- Grunsky, E. Practical Aspects of Compositional Data Analysis Using Regional Geochemical Survey Data; Geological Survey of Canada: Ottawa, ON, Canada, 2015. [Google Scholar] [CrossRef]
- Bacon-Shone, J. Compositional Data Analysis: Theory and Applications; John Wiley & Sons: Chichester, UK, 2011; ISBN 978-0-470-70672-5. [Google Scholar]
- Egozcue, J.J.; Pawlowsky-Glahn, V.; Mateu-Figueras, G.; Barcelo-Vidal, C. Isometric logratio transformations for compositional data analysis. Math. Geol. 2003, 35, 279–300. [Google Scholar] [CrossRef]
- Reimann, C.; Filzmoser, P.; Hron, K.; Garrett, R.G. A new method for correlation analysis of compositional (environmental) data—A worked example. Sci. Total Environ. 2017, 607–608, 965–971. [Google Scholar] [CrossRef]
- Egozcue, J.J.; Pawlowsky-Glahn, V. Groups of parts and their balances in compositional data analysis. Math. Geol. 2005, 37, 795–828. [Google Scholar] [CrossRef]
- Thió-Henestrosa, S.; Egozcue, J.J.; Pawlowsky-Glahn, V.; Kovács, L.Ó.; Kovács, G.P. Balance-dendrogram: A new routine of CoDaPack. Comput. Geosci. 2008, 34, 1682–1696. [Google Scholar] [CrossRef]
- Mou, N.; Wang, G.; Sun, X. Identification of geochemical anomalies related to mineralization: A case study from porphyry copper deposits in the Qulong–Jiama mining district of Tibet, China. J. Geochem. Explor. 2022, 217, 106594. [Google Scholar] [CrossRef]
- Liu, Y. How to determine the optimal balance for geochemical pattern recognition and anomaly mapping based on compositional balance analysis. Geochem. Explor. Environ. Anal. 2022, 22, 259–271. [Google Scholar] [CrossRef]
- Liu, Y.; Xia, Q.; Cheng, Q. Aeromagnetic and geochemical signatures in the Chinese Western Tianshan: Implications for tectonic setting and mineral exploration. Nat. Resour. Res. 2021, 30, 3165–3195. [Google Scholar] [CrossRef]
- Zheng, W.; Liu, B.; McKinley, J.M.; Zhao, Z.; Zhou, J.; Li, J. Geology and geochemistry-based metallogenic exploration model for the eastern Tethys Himalayan metallogenic belt, Tibet. J. Geochem. Explor. 2021, 224, 106743. [Google Scholar] [CrossRef]
- Wang, L.; Liu, B.; McKinley, J.M.; Zhao, Z.; Zhou, J. Compositional data analysis of regional geochemical data in the Lhasa area of Tibet, China. Appl. Geochem. 2021, 132, 105108. [Google Scholar] [CrossRef]
- Reimann, C.; Filzmoser, P.; Garrett, R.G. Statistical Data Analysis Explained; Wiley: Chichester, UK, 2008. [Google Scholar] [CrossRef]
- Zuo, R.; Carranza, E.J.M.; Wang, J. Spatial analysis and visualization of exploration geochemical data. Earth-Sci. Rev. 2016, 158, 9–18. [Google Scholar] [CrossRef]
- Li, C.; Zhou, K.; Gao, W.; Zhang, S.; Wang, Y. Geochemical prospectivity mapping using compositional balance analysis and multifractal modeling: A case study in the Jinshuikou area, Qinghai, China. J. Geochem. Explor. 2024, 257, 107361. [Google Scholar] [CrossRef]
- Puchhammer, P.; Kalubowila, C.; Braus, L. A performance study of local outlier detection methods for mineral exploration with geochemical compositional data. J. Geochem. Explor. 2024, 258, 107392. [Google Scholar] [CrossRef]
- Candès, E.J.; Li, X.; Ma, Y.; Wright, J. Robust principal component analysis? J. ACM 2011, 58, 1–37. [Google Scholar] [CrossRef]
- Vidal, R.; Ma, Y.; Sastry, S.S. Robust Principal Component Analysis; Springer: New York, NY, USA, 2016; ISBN 978-1-4939-3414-0. [Google Scholar]
- Filzmoser, P. Robust principal component and factor analysis in the geostatistical treatment of environmental data. Environmetrics 1999, 10, 363–375. [Google Scholar] [CrossRef]
- Anselin, L. Local indicators of spatial association—LISA. Geogr. Anal. 1995, 27, 93–115. [Google Scholar] [CrossRef]
- Symanzik, J. Exploratory Spatial Data Analysis. In Handbook of Regional Science; Fischer, M.M., Nijkamp, P., Eds.; Springer: Berlin/Heidelberg, Germany, 2019; pp. 1–17. [Google Scholar] [CrossRef]
- Xiao, W.J.; Qin, K.Z.; Sun, S.; Li, J.L. Paleozoic accretionary and collisional tectonics of the Eastern Tianshan (China): Implications for the continental growth of Central Asia. Am. J. Sci. 2004, 304, 370–395. [Google Scholar] [CrossRef]
- Hu, J.; Yu, X.; Zeng, Y.; Xiao, W.; Zhang, Z.; Wang, Y. Structural evolution of the Kanggur tectonic belt: Implications for the latest Carboniferous to Permian orogeny in the Eastern Tianshan, NW China. Int. Geol. Rev. 2021, 63, 2001–2019. [Google Scholar] [CrossRef]
- Jiang, C.; Wu, W.; Li, L.; Mu, Y.; Bai, K.; Zhao, X. Tectonic Evolution of the Eastern Southern Tianshan Mountain; Geological Publishing House: Beijing, China, 2001; p. 96. ISBN 978-7-116-02560-8. [Google Scholar]
- Bureau of Geology and Mineral Resources of Xinjiang Uygur Autonomous Region. Regional Geology of Xinjiang Autonomous Region. In Geological Memoirs; Geological Publishing House: Beijing, China, 1993; Volume Ser. 1, No. 32, p. 841. ISBN 978-7-116-01323-0. [Google Scholar]
- Jiang, C.; Mu, Y.; Zhao, X.; Bai, K.; Zhang, H. Petrology and geochemistry of the intrusion belt along the northern active margin of the Tarim plate. Reg. Geol. China 2001, 20, 158–163. [Google Scholar]
- Guo, Q.Q.; Chung, S.L.; Xiao, W.J.; Li, X.H.; Yuan, C.; He, Z.J. Petrogenesis and tectonic implications of Late Devonian arc volcanic rocks in Southern Beishan Orogen, NW China. Lithos 2017, 278–281, 84–96. [Google Scholar] [CrossRef]
- Şengör, A.M.C.; Natal’in, B.A.; Burtman, V.S. Evolution of the Altaid tectonic collage and Paleozoic crustal growth in Eurasia. Nature 1993, 364, 299–307. [Google Scholar] [CrossRef]
- Windley, B.F.; Alexeiev, D.; Xiao, W.J.; Kroner, A.; Badarch, G. Tectonic models for accretion of the Central Asian Orogenic Belt. J. Geol. Soc. 2007, 164, 31–47. [Google Scholar] [CrossRef]
- Liu, Y.; Zhou, K.; Carranza, E.J.M. Compositional balance analysis for geochemical pattern recognition and anomaly mapping in the western Junggar region, China. Geochem. Explor. Environ. Anal. 2018, 18, 263–276. [Google Scholar] [CrossRef]
- Zuo, R. Identification of geochemical anomalies associated with mineralization in the Fanshan district, Fujian, China. J. Geochem. Explor. 2014, 139, 170–176. [Google Scholar] [CrossRef]
- Zuo, R.; Xia, Q.; Wang, H. Compositional data analysis in the study of integrated geochemical anomalies associated with mineralization. Appl. Geochem. 2013, 28, 202–211. [Google Scholar] [CrossRef]
- Anselin, L. Interactive Techniques and Exploratory Spatial Data Analysis. In Geographical Information Systems: Principles, Techniques, Management and Applications, 2nd ed.; Longley, P., Goodchild, M., Maguire, D., Rhind, D., Eds.; Wiley: New York, NY, USA, 1999; pp. 253–266. [Google Scholar]
- Zuo, R.; Xiong, Y. Geodata Science and Geochemical Mapping; Science Press: Beijing, China, 2019; ISBN 978-7-03-061536-9. [Google Scholar]
- Wang, J.; Zuo, R. Identification of geochemical anomalies through combined sequential Gaussian simulation and grid-based local singularity analysis. Comput. Geosci. 2018, 118, 52–64. [Google Scholar] [CrossRef]
- Pawlowsky-Glahn, V.; Egozcue, J.J.; Tolosana-Delgado, R. Principal balances. In Proceedings of the 4th International Workshop on Compositional Data Analysis, Santander, Spain, 6–11 June 2011; pp. 1–10. [Google Scholar]
- Yin, B.; Zuo, R.; Xiong, Y.; Li, Y.; Yang, W. Knowledge discovery of geochemical patterns from a data-driven perspective. J. Geochem. Explor. 2021, 231, 106872. [Google Scholar] [CrossRef]
- Pawlowsky-Glahn, V.; Egozcue, J.J. Exploring compositional data with the CoDa-dendrogram. Aust. J. Stat. 2011, 40, 103–113. [Google Scholar] [CrossRef]
- Filzmoser, P.; Hron, K.; Reimann, C. Principal component analysis for compositional data with outliers. Environmetrics 2009, 20, 621–632. [Google Scholar] [CrossRef]
- Aitchison, J.; Greenacre, M. Biplots of compositional data. J. R. Stat. Soc. Ser. C Appl. Stat. 2002, 51, 375–392. [Google Scholar] [CrossRef]
- Graffelman, J.; Pawlowsky-Glahn, V.; Egozcue, J.J.; Buccianti, A. Exploration of geochemical data with compositional canonical biplots. J. Geochem. Explor. 2018, 194, 120–133. [Google Scholar] [CrossRef] [PubMed]
- Comas-Cufí, M.; Thió-Henestrosa, S. CoDaPack 2.0; Universitat de Girona: Girona, Spain, 2011. [Google Scholar]
- Liu, Y.; Carranza, E.J.M.; Zhou, K.; Xia, Q. Compositional balance analysis: An elegant method of geochemical pattern recognition and anomaly mapping for mineral exploration. Nat. Resour. Res. 2019, 28, 1269–1283. [Google Scholar] [CrossRef]
- Zuo, R. Data-driven modeling of mineral prospectivity. In Handbook of Exploration and Environmental Geochemistry; Holland, H.D., Turekian, K.K., Eds.; Elsevier: Amsterdam, The Netherlands, 2009; Volume 11, pp. 249–310. [Google Scholar] [CrossRef]
Figure 1.
Geological map of the Eastern China.
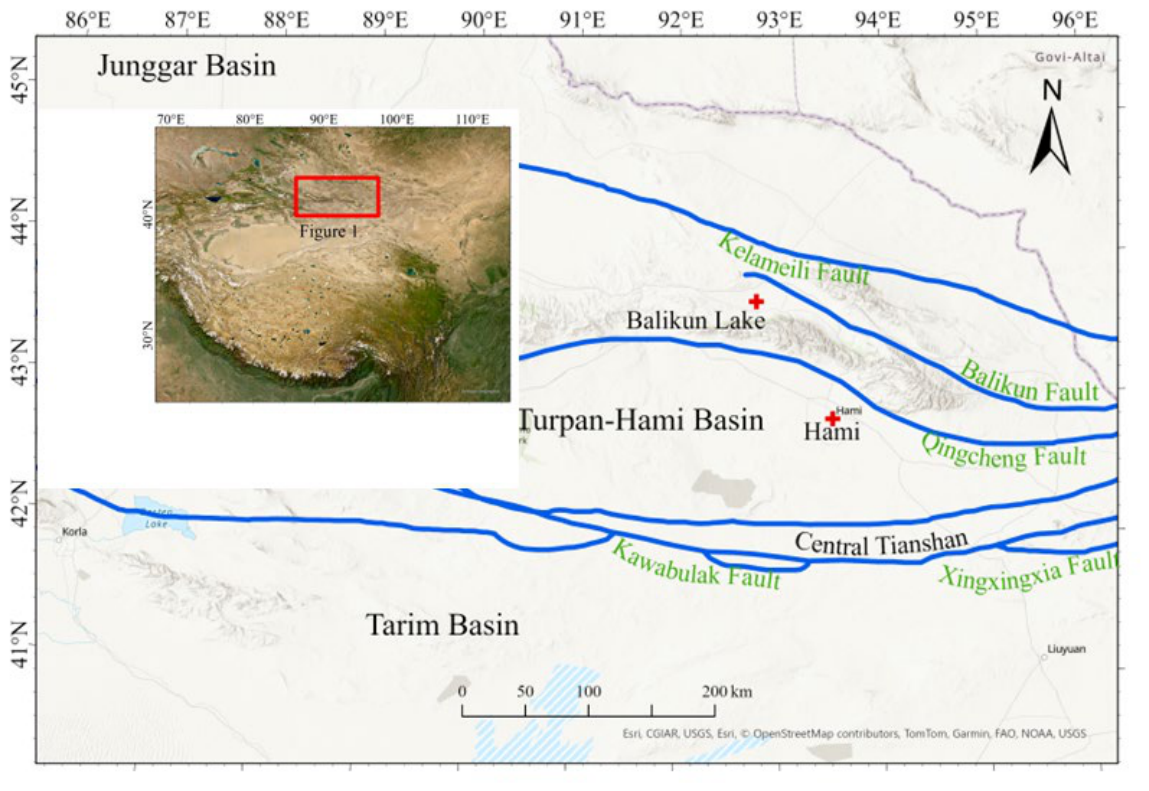
Figure 2.
Geological map of the study area.
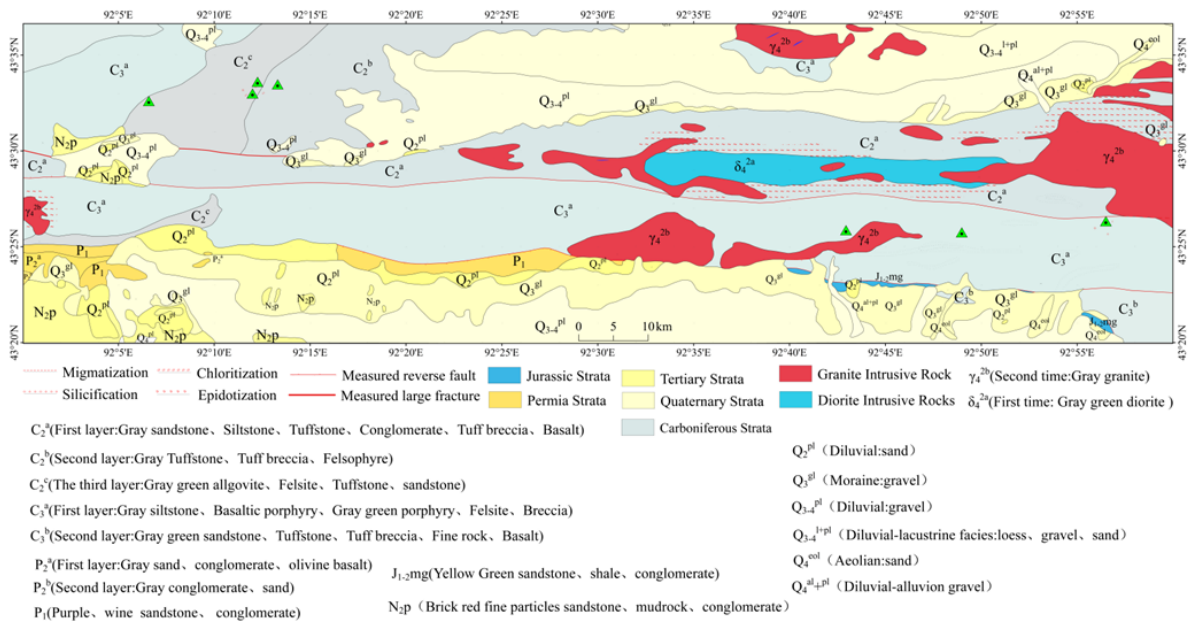
Figure 3.
Map of soil geochemical sediment sampling sites in Balikun Lake.
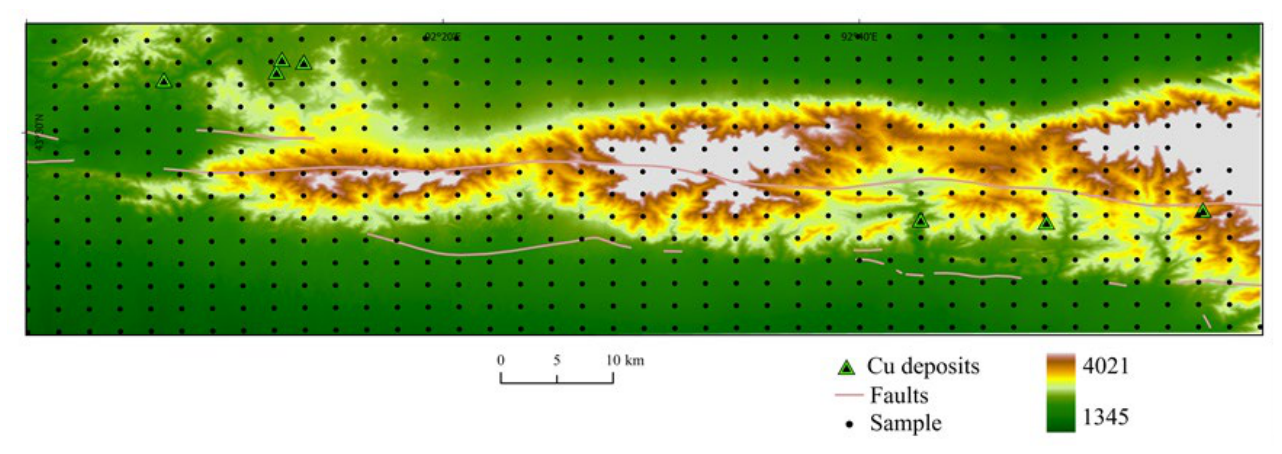
Figure 4.
Workflow of CoBA for geochemical pattern recognition and anomaly mapping to support mineral exploration.
Figure 4.
Workflow of CoBA for geochemical pattern recognition and anomaly mapping to support mineral exploration.
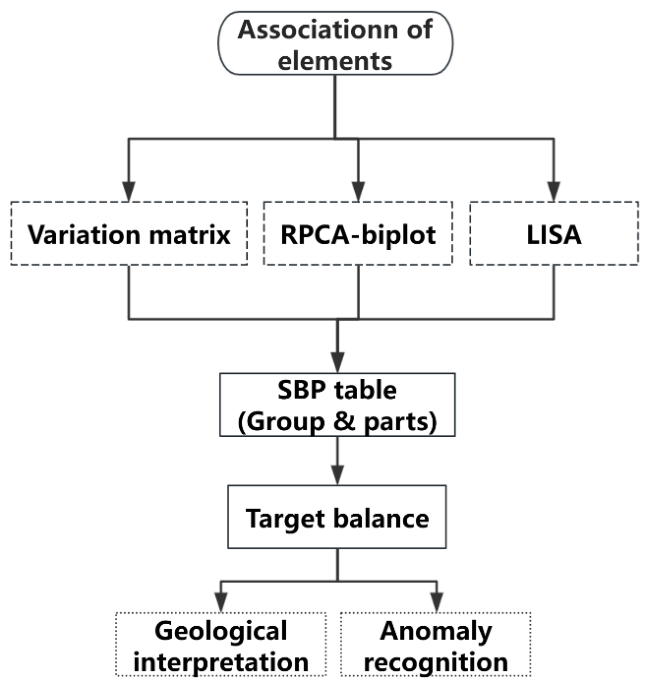
Figure 5.
PCA (PC1&PC2) Biplot of soil geochemistry data of ILR-transformation types for 11elements in the study area.
Figure 5.
PCA (PC1&PC2) Biplot of soil geochemistry data of ILR-transformation types for 11elements in the study area.
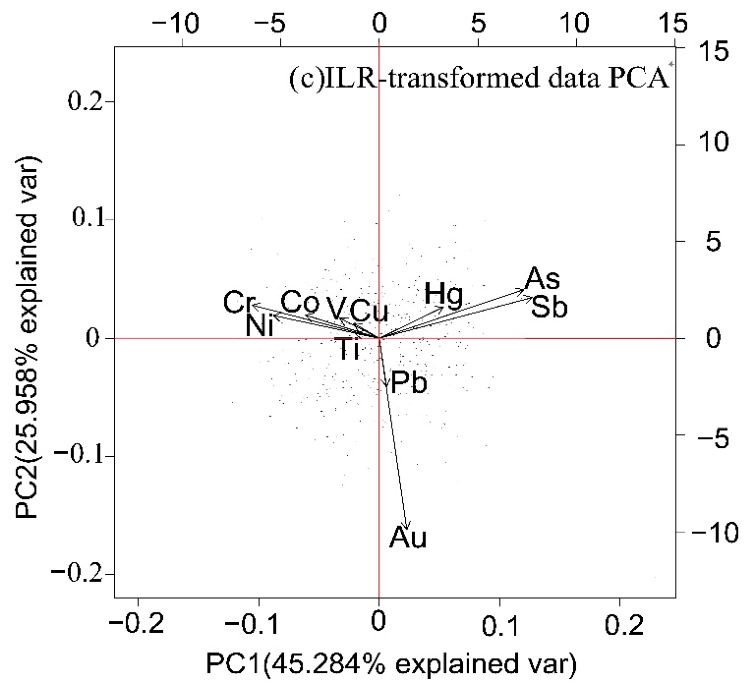
Figure 7.
Balance tree diagram for the Sequential Binary Partition model in Table2.
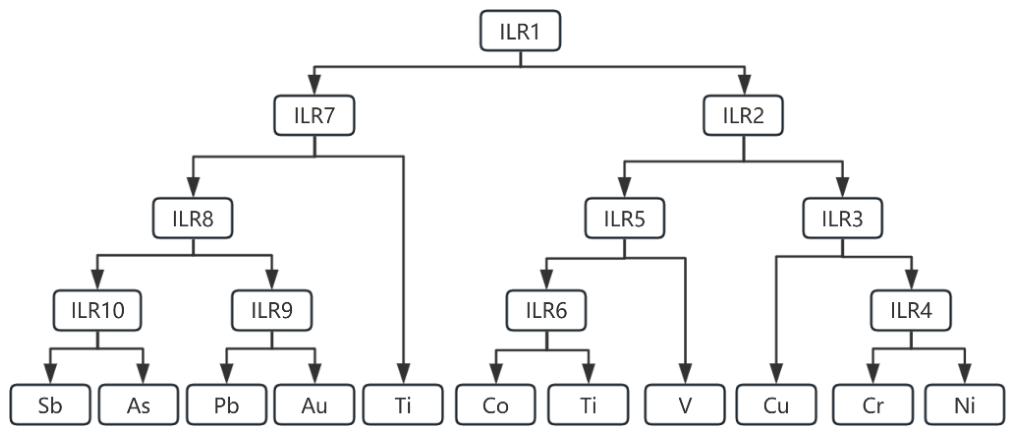
Figure 8.
Geochemical anomalies identified (a)Cu-Cr-Ni, (b)b2 , (c)PC2.
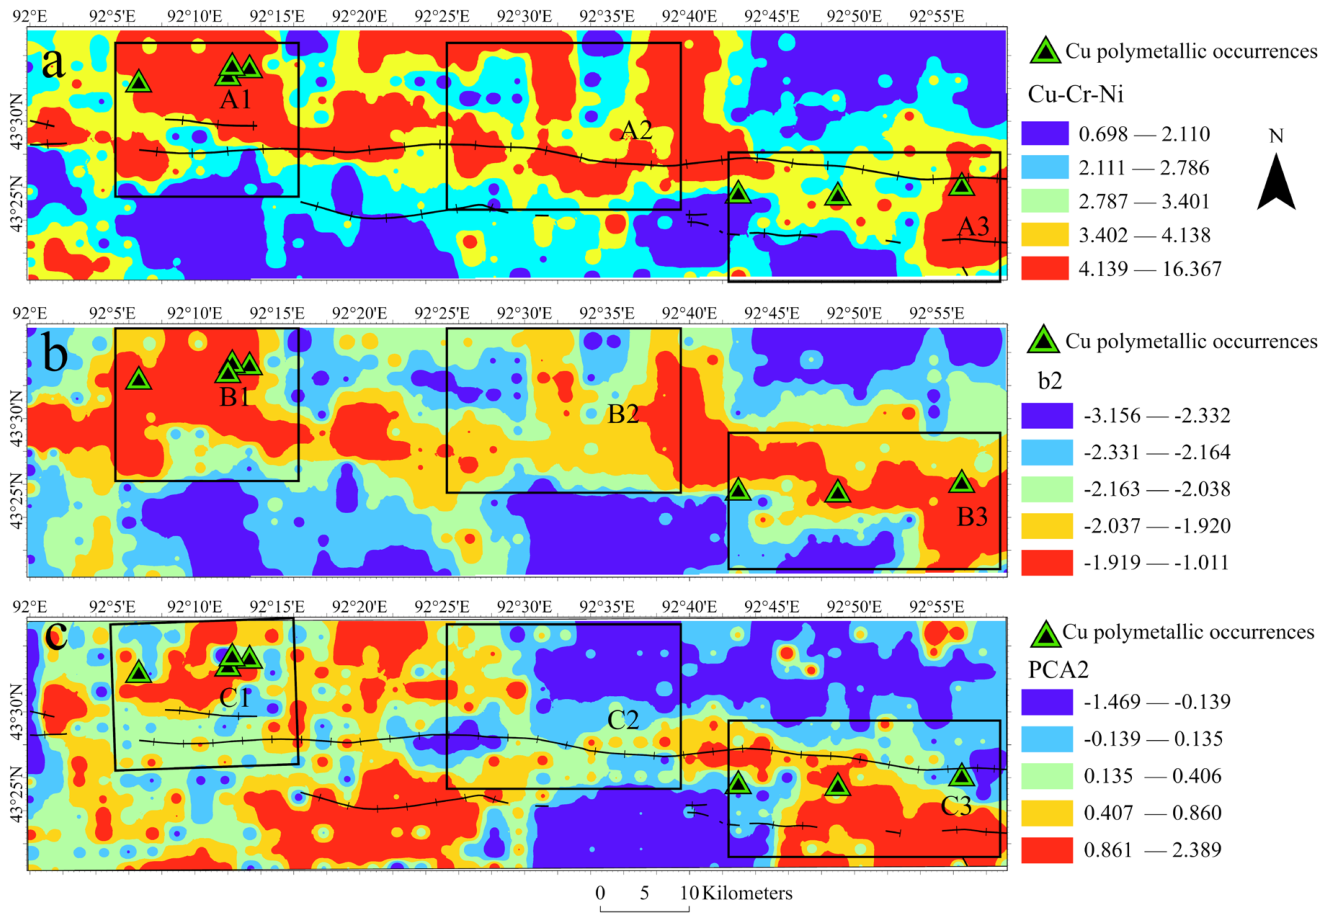
Figure 9.
Prospecting prediction targets and engineering verification map of the study area.
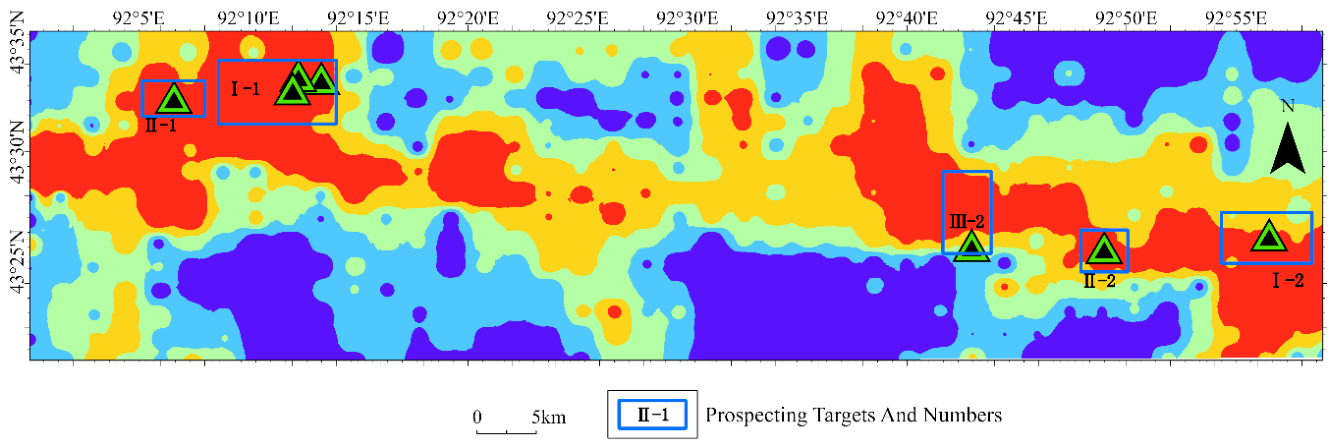

Table 1.
Variation matrix of geochemical elements.
| Cu | Cr | Ni | Co | Ti | V | As | Au | Hg | Pb | Sb | |
| Cu | 0 | 0.19 | 0.14 | 0.09 | 0.11 | 0.08 | 0.39 | 0.44 | 0.23 | 0.20 | 0.43 |
| Cr | 0 | 0.07 | 0.11 | 0.20 | 0.15 | 0.71 | 0.62 | 0.42 | 0.36 | 0.72 | |
| Ni | 0 | 0.05 | 0.13 | 0.11 | 0.64 | 0.57 | 0.36 | 0.28 | 0.65 | ||
| Co | 0 | 0.06 | 0.04 | 0.53 | 0.50 | 0.28 | 0.21 | 0.55 | |||
| Ti | 0 | 0.02 | 0.43 | 0.40 | 0.20 | 0.15 | 0.44 | ||||
| V | 0 | 0.44 | 0.45 | 0.23 | 0.22 | 0.46 | |||||
| As | 0 | 0.65 | 0.37 | 0.43 | 0.22 | ||||||
| Au | 0 | 0.53 | 0.36 | 0.71 | |||||||
| Hg | 0 | 0.24 | 0.34 | ||||||||
| Pb | 0 | 0.44 | |||||||||
| Sb | 0 |
Table 2.
Balance combinations of geochemical elements.
| b1=[Cu,Cr,Ni|V,Co,Ti,Au,Sb,As,Pb,Hg] | b6=[Ti|Co] |
| b2=[Cu,Ni,Cr|V,Co,Ti] | b7=[Hg|Au,Sb,As,Pb] |
| b3=[Cu|Ni,Cr] | b8=[Au,Pb|As,Sb] |
| b4=[Ni|Cr] | b9=[Au|Pb] |
| b5=[V|Ti,Co] | b10=[As|Sb] |
Table 3.
Analysis results of chemical sample.
| Sample Number | Analysis Result |
| Cu Concentration (%) | |
| Ⅰ-1(1-5) | 0.5%~1.3% |
| Ⅰ-1(6-9) | 0.3%~0.5% |
| Ⅰ-1(10-17) | 0.08%~0.3% |
| Ⅰ-2(1-6) | 0.5%~1% |
Disclaimer/Publisher’s Note: The statements, opinions and data contained in all publications are solely those of the individual author(s) and contributor(s) and not of MDPI and/or the editor(s). MDPI and/or the editor(s) disclaim responsibility for any injury to people or property resulting from any ideas, methods, instructions or products referred to in the content. |
© 2026 by the authors. Licensee MDPI, Basel, Switzerland. This article is an open access article distributed under the terms and conditions of the Creative Commons Attribution (CC BY) license (http://creativecommons.org/licenses/by/4.0/).
Copyright: This open access article is published under a Creative Commons CC BY 4.0 license, which permit the free download, distribution, and reuse, provided that the author and preprint are cited in any reuse.