

Submitted:
12 May 2026
Posted:
13 May 2026
You are already at the latest version
Abstract
Hantaviruses are emerging zoonotic pathogens responsible for two severe clinical syndromes: (i) haemorrhagic fever with renal syndrome (HFRS) and (ii) hantavirus cardiopulmonary syndrome (HCPS), collectively causing more than 200,000 human cases annually worldwide. Despite their public-health importance, the molecular mechanisms governing the host response and the population-level dynamics of rodent- to-human spillover remain incompletely characterised. The timeliness of this frame- work is underscored by the April–May 2026 outbreak of Andes orthohantavirus aboard 9 the MV Hondius cruise ship – the first such cluster in a maritime setting, with three deaths reported across multiple countries (WHO Disease Outbreak News: https://www.who.int/emergencies/disease-outbreak-news/item/2026-DON599). This event revealed critical gaps in existing models that treat humans solely as dead-end spillover hosts. Here, we present an integrated computational study that combines three complementary analyses. Preliminarly, we performed the first phylogenetic analysis of such virus, idenifying as Orthoantavirus andensense the responsible for the vessel outbreak. Second, we performed a downstream transcriptomic analysis of Hantaan virus (HTNV)-infected human umbilical vein endothelial cells (HUVECs) using publicly available RNA-seq data (GEO accession GSE133751, n = 3 per group), identifying 184 upregulated and 19 downregulated evidencing the role of dominated by interferon-stimulated genes (ISGs), including CXCL10, CXCL11, MX2, DDX58, IRF7, STAT1, OASL, and CMPK2. We constructed a protein–protein interaction (PPI) network from STRING (176 nodes, 3,210 edges) and applied a composite network centrality score to rank regulatory hubs, identifying ISG15, IRF1, CXCL10, STAT1, and DDX58 as the most central nodes. Pathway enrichment analysis con- firms strong activation of interferon signalling (Reactome, p = 1.3×10−63), antiviral defence (Gene Ontology, p = 3.8 × 10−58), and NF-κB pathways, with concurrent suppression of ribosomal translation. We finally developed a coupled SEIRD epi-demiological model that explicitly represents rodent-to-rodent and rodent-to-human transmission with logistic rodent population growth. Preliminary simulation analysis demonstrates that reducing human exposure to rodent excreta is substantially more effective than rodent population control alone for reducing human disease burden, and that rodent control in isolation can paradoxically increase human cases through a dilution-like effect. The integrated framework provides molecular and epidemiological insights relevant to hantavirus surveillance, therapeutic target identification, and 35 public-health intervention design.
Keywords:
hantavirus
; HFRS
; HCPS
; transcriptomics
; interferon signalling
; protein–protein interaction network
; regulatory hubs
; SEIRD model
; zoonosis
; rodent-to-human transmission
1. Introduction
Hantaviruses (family Hantaviridae, order Bunyavirales) are enveloped, negative-sense single-stranded RNA viruses. Orthohantaviruses have a tripartite genome of approximately 11.8–13.8 kb, comprising small (S, ∼1.7–3 kb), medium (M, ∼3.2–4.9 kb), and large (L, ∼6.5–6.8 kb) RNA segments that encode the nucleocapsid protein (NP), the glycoprotein precursor (GPC), and the RNA-dependent RNA polymerase (RdRp), respectively [1].
Unlike most other bunyaviruses, hantaviruses are not arthropod-borne; instead, they are maintained in specific rodent reservoir hosts and are transmitted to humans primarily through inhalation of aerosolised excreta (urine, faeces, and saliva) from infected rodents [2].
Hantavirus infections cause two distinct clinical syndromes. HFRS, prevalent across Eurasia, is characterised by acute kidney injury, thrombocytopenia, and haemorrhage, with case fatality rates (CFRs) ranging from less than 1% for Puumala virus (PUUV) to 5–15% for Hantaan virus (HTNV) and Dobrava-Belgrade virus (DOBV) [1]. HCPS, predominant in the Americas, manifests as acute respiratory distress syndrome with a CFR of 30–40% for Sin Nombre virus (SNV) and Andes virus (ANDV) [1]. Globally, an estimated 200,000 cases are reported annually, though substantial under-reporting is suspected [3]. Andes virus is unique among hantaviruses in supporting limited human-to-human transmission, raising concerns about pandemic potential [4]. The principal rodent reservoirs are geographically partitioned: HTNV is maintained in the striped field mouse (Apodemus agrarius) in East Asia; PUUV in the bank vole (Myodes glareolus) in Europe; SNV in the deer mouse (Peromyscus maniculatus) in North America; and ANDV in the long-tailed pygmy rice rat (Oligoryzomys longicaudatus) in South America [1,2].
Rodent population dynamics, driven by climate, land use, and food availability, are major 62 determinants of outbreak risk [2,5].
Among all known hantaviruses, Andes orthohantavirus (ANDV), maintained primarily by the long-tailed pygmy rice rat (Oligoryzomys longicaudatus) across the Andean regions of Argentina and Chile, occupies a distinctive epidemiological position: it is the sole hantavirus for which person-to-person transmission has been conclusively demonstrated through both epidemiological investigation and whole-genome sequencing evidence [6,7]. The first direct genetic proof of human-to-human spread was documented during a 1996 cluster in El Bols´on, Argentina, where phylogenetic analysis of the S and M genome segments revealed a single shared viral haplotype (Epilink/96) across all epidemiologically linked cases [8]. Subsequent investigations established that transmission occurs predominantly during the prodromal phase of illness, requires close and sustained contact, and proceeds via respiratory secretions and saliva, with viral antigen detected in alveolar epithelial cells, macrophages, and submandibular salivary gland secretory cells [9]. A landmark outbreak in Epuy´en, Chubut Province, Argentina (November 2018–February 2019) resulted in 34 confirmed infections and 11 deaths, with an estimated reproductive number of R0 = 2.12 prior to the enforcement of isolation measures, falling to 0.96 thereafter – demonstrating that ANDV can sustain self-amplifying chains of human transmission in the absence of timely public health intervention [10]. Genomic analyses of the outbreak strain (ARG-Epu´en) subsequently identified specific amino acid substitutions in the nucleocapsid protein, glycoprotein, and small non-structural protein that are associated with enhanced human 82 transmissibility [11,12], raising the prospect that ANDV could evolve toward more efficient 83 human-to-human spread, warranting close genomic surveillance of circulating lineages.
The pandemic potential of ANDV was brought into sharp international focus in April–May 2026 by an unprecedented outbreak aboard the Dutch expedition cruise ship MV Hondius. The vessel departed Ushuaia, Argentina, on 1 April 2026, carrying 147 passengers and crew on a polar voyage to Antarctica and across the South Atlantic Ocean [13]. Illness onset among passengers began as early as 6 April, characterised by fever, gastrointestinal symptoms, and rapid progression to pneumonia and acute respiratory distress syndrome, with three deaths confirmed by 9 May 2026 and six laboratory-confirmed cases of ANDV infection identified across multiple countries [13,14]. South African laboratory testing confirmed the Andes strain in evacuated passengers, and the US Centers for Disease Control and Prevention classified the event as a Level 3 emergency response [14]. Critically, the MV Hondius event represents the first documented ANDV cluster in a cruise ship setting and provides compelling epidemiological evidence of sustained person-to-person transmission in a confined, internationally mobile environment – a scenario with direct implications for global health security [13,14]. This outbreak underscores three key gaps that the present study addresses: the need for a mechanistic understanding of the molecular host response to hantavirus infection at the transcriptional network level, the importance of quantifying the conditions under which human-to-human transmission can become self-sustaining within the epidemiological model, and the urgency of identifying network-level regulatory hubs that could serve as targets for antiviral countermeasures applicable across pathogenic hantavirus strains.
At the molecular level, hantaviruses infect endothelial cells, macrophages, and dendritic cells, exploiting β3 integrins as entry receptors. The resulting innate immune response is characterised by robust induction of type I interferons (IFN-α/β) and interferon-stimulated genes (ISGs), yet pathogenic hantaviruses have evolved mechanisms to delay and partially suppress this response [15]. The balance between viral immune evasion and host antiviral defence determines disease severity and outcome. Despite considerable progress, the transcriptional regulatory architecture governing the host response to hantavirus infection 111 – and in particular the identity of master regulatory hubs – has not been systematically 112 characterised using network-based approaches.
Epidemiological modelling of hantavirus transmission has been pursued using com-partmental modelling [16,17,18]. These models capture the essential dynamics of rodent-to-rodent transmission and spillover to humans, but few studies have integrated molecular findings with epidemiological projections to provide a unified view of hantavirus biology. In this work, we address this gap by presenting an integrated computational framework that combines: (i) downstream analysis of publicly available transcriptomic data from HTNV-infected HUVECs; (ii) PPI network construction and centrality-based identification of regulatory hubs; and (iii) a coupled SEIRD (Susceptible, Exposed, Infected, Recovered, Diseased) epidemiological model with logistic rodent population dynamics and explicit rodent-to-human spillover. Our approach is inspired by and extends previous network-based analyses of viral infections, including master regulator identification in SARS-CoV-2 [19], graph diffusion frameworks for network analysis [20], and graph-based epidemic modelling of West Nile virus [21]. Together, these analyses provide a multi-scale view of hantavirus infection that bridges molecular mechanisms and population dynamics.
2. Background
2.1. Hantavirus Biology and Epidemiology
The hantavirus genome encodes three structural proteins. The NP (S segment) encapsidates the viral RNA and plays a central role in innate immune evasion by sequestering double-stranded RNA intermediates [22]. The glycoproteins Gn and Gc (M segment) mediate receptor binding and membrane fusion; Gc contains a class II fusion peptide structurally homologous to flavivirus E proteins. The RdRp (L segment) performs genome replication 134 and transcription in the cytoplasm.
Transmission occurs almost exclusively through inhalation of infectious aerosols, al-though direct contact with rodent excreta and, rarely, rodent bites have been docu-mented [1]. The incubation period ranges from 1 to 8 weeks. HFRS progresses through febrile, hypotensive, oliguric, diuretic, and convalescent phases; HCPS is characterised by a prodromal febrile illness followed by rapid cardiopulmonary deterioration [1]. No licensed antiviral therapy exists; treatment is supportive, with ribavirin showing modest 141 benefit in early HFRS [1].
Seroprevalence studies indicate that subclinical infection is common, with population seroprevalence ranging from 1% to 10% in endemic areas [3]. Outbreaks are strongly 144 seasonal and correlate with rodent population peaks driven by mast years (beech and oak 145 seed production) and climate anomalies [2,5].
2.2. Phylogenetic Analysis
The S, M, and L segment sequences from the virus associated with the MV Hondius cruise ship outbreak (ANDV/Switzerland/Hu-3337/2026) were retrieved from NCBI under acces-sion numbers PV808472.1, PV808471.1, and PV808470.1, respectively. These sequences were compared with NCBI RefSeq orthohantavirus records retrieved using segment-specific searches for complete S, M, and L segments, with length filters of 1500–2500 nt, 3000–4500 nt, and 6000–7500 nt, respectively. For each segment, multiple sequence alignment was performed with MUSCLE (PMID: 15034147), and phylogenetic trees were inferred in MEGA12 (PMID: 39708372) using the neighbour-joining method with 1000 bootstrap eplicates. Sequence metadata were obtained from NCBI Virus (PMID: 25428358).
2.3. Host Immune Response to Hantavirus
Hantavirus infection triggers innate immune sensing through cytoplasmic pattern recog-nition receptors. The viral RNA is detected by RIG-I (encoded by DDX58) and MDA5 (encoded by IFIH1), which signal through MAVS to activate IRF3 and IRF7, driving IFN-β production [15]. IFN-β signals in an autocrine and paracrine manner through the IFNAR1/IFNAR2 receptor complex, activating the JAK1/TYK2–STAT1/STAT2–IRF9 (ISGF3) transcription factor complex, which induces hundreds of ISGs including MX1, 163 MX2, OAS1-3, OASL, ISG15, IFIT1-3, and TRIM22 [23].
Pathogenic hantaviruses (HTNV, SNV, ANDV) delay IFN induction relative to non-pathogenic strains (e.g., Prospect Hill virus), partly through NP-mediated suppression of RIG-I signalling [22]. NF-κB activation drives pro-inflammatory cytokine production (TNF-α, IL-6, CXCL10), contributing to the cytokine storm and vascular permeability that underlie disease pathology [23]. Endothelial cell tropism is central to pathogenesis: hantavirus-infected endothelial cells exhibit increased permeability without cytopathic 170 effect, a hallmark of both HFRS and HCPS [1].
2.4. Computational Approaches to Viral Infection Analysis
Network medicine has emerged as a powerful framework for understanding viral infections at the systems level. PPI networks, constructed from databases such as STRING [24] and BioGRID, enable identification of central regulatory nodes (hubs) that coordinate the host response. Centrality metrics – degree, betweenness, and closeness – have been used to prioritise therapeutic targets and identify master regulators in diverse viral infections [19].
In the context of SARS-CoV-2, Guzzi et al. [19] demonstrated that network centrality analysis of the virus–host interactome identifies biologically meaningful regulatory hubs 179 consistent with known antiviral pathways.
Pathway enrichment analysis using tools such as Enrichr [25] provides a complementary view by mapping differentially expressed genes onto curated biological pathways, enabling hypothesis generation about the molecular mechanisms of infection. Graph diffusion frameworks, such as ExDiff [20], extend these analyses by modelling the propagation of perturbations through biological networks.
For epidemiological modelling, compartmental ODE models have been the workhorse of zoonotic disease analysis. The SEIRD (Susceptible–Exposed–Infectious– Recovered–Dead) model is able to capture the essential dynamics of infection spread while remaining analytically tractable. Coupled rodent–human models, in which the rodent population drives spillover to humans, have been developed for hantavirus [16,17,18] and other zoonoses.
Graph-based extensions of these models, as demonstrated for West Nile virus [21], can incorporate spatial heterogeneity and network structure. Here we adopt the coupled SEIRD framework as a tractable and biologically interpretable approach.
3. Materials and Methods
Portions of the computational workflow, including data retrieval, statistical analysis, network construction, and epidemiological modelling, were performed with the assistance of Biomni [26]. All results were verified and interpreted by the authors, who take full 197 responsibility for the scientific content of this work.
3.1. Gene Expression Data Acquisition and Processing
We obtained publicly available RNA-seq data from the Gene Expression Omnibus (GEO) under accession GSE133751 [27]. This dataset comprises transcriptomic profiles of human umbilical vein endothelial cells (HUVECs) infected with Hantaan virus (HTNV, strain 202 76-118) at a multiplicity of infection (MOI) of 1 for 24 hours, compared with mock-infected 203 controls (n = 3 biological replicates per group). Processed expression values in reads 204 per kilobase per million mapped reads (RPKM) were downloaded from the GEO FTP supplementary file GSE133751 mRNA-exp.txt.gz.
Genes with RPKM ≥ 1 in at least one experimental group were retained, yielding 9,660 expressed genes. Expression values were log2-transformed after adding a pseudocount of 1: x′ = log2(RPKM + 1). Differential expression was assessed using Welch’s t-test (unequal variance), with Benjamini–Hochberg (BH) false discovery rate (FDR) correction applied across all tested genes. Differentially expressed genes (DEGs) were defined at two thresholds: (i) a stringent threshold of |log2 FC| ≥ 1 and FDR < 0.05; and (ii) a nominal threshold of |log2 FC| ≥ 1 and p < 0.05 (unadjusted), used for downstream pathway enrichment and network analyses. We acknowledge that the small sample size (n = 3 per 214 group) limits statistical power and that results should be interpreted as exploratory.
3.2. Pathway Enrichment Analysis
Pathway enrichment analysis was performed using the Enrichr API [25] with three curated gene set libraries: KEGG 2021 Human, GO Biological Process 2023, and Reactome 2022. 218 Separate analyses were conducted for the nominally upregulated (n = 184) and down-regulated (n = 19) gene sets. Enrichment significance was assessed using Fisher’s exact test as implemented in Enrichr, and results were ranked by adjusted p-value. The top ten enriched terms per library and direction were retained for visualisation.
3.3. Protein–Protein Interaction Network Construction and Cen-Trality Analysis
A PPI network was constructed by querying the STRING database (version 12) [24] for all pairwise interactions among the 203 nominal DEGs (184 up + 19 down), using the human proteome (NCBI taxonomy ID 9606) and a minimum combined interaction score 227 of 0.4 (medium confidence). The resulting network comprised 176 nodes and 3,210 edges. The largest connected component was retained for all subsequent analyses.
Three standard network centrality metrics were computed for each node using the NetworkX library (Python):
- Degree centrality (CD): the fraction of nodes to which a given node is directly connected.
- Betweenness centrality (CB): the fraction of all shortest paths in the network that pass through a given node, normalised to [0,1].
- Closeness centrality (CC): the reciprocal of the average shortest path length from a given node to all other nodes.
A composite Master Regulator Score (MRS) was defined as a weighted linear combination of the three normalised centrality metrics:
where ˜· denotes min–max normalisation to [0,1]. The weights reflect the established importance of betweenness centrality for identifying regulatory bottlenecks [19]. We emphasise that this analysis identifies network centrality hubs as proxies for regulatory importance; it does not constitute a formal master regulator analysis in the strict sense of 243 VIPER/ARACNe, which requires a curated transcription factor–target regulon.
MRS(v) = 0.5 · C˜B(v) + 0.3 · C˜D(v) + 0.2 · C˜C(v),
For visualisation, a high-confidence subgraph was extracted (interaction score ≥ 0.7, node degree ≥ 2), yielding 123 nodes and 1,169 edges. Nodes were coloured by log2 FC and sized by MRS. The top ten hubs by MRS were highlighted with enlarged markers and labelled.
3.4. Epidemiological Model
3.4.1. Model Structure
We developed a coupled SEIRD compartmental model representing hantavirus transmission within a rodent population and spillover to a human population. The model extends the framework of Wesley et al. [16] and Guti´errez-Jara et al. [18] by incorporating logistic rodent population growth and an explicit human SEIRD compartment.
The rodent population is partitioned into five compartments: susceptible (SR), ex-posed (ER), infectious (IR), recovered (RR), and disease-induced dead (DR). The human population is similarly partitioned into SH, EH, IH, RH, and DH. The total living rodent population is NR = SR + ER + IR + RR and the total human population is NH = SH + EH + IH + RH (assumed approximately constant over the simulation period).
3.4.2. Model Equations
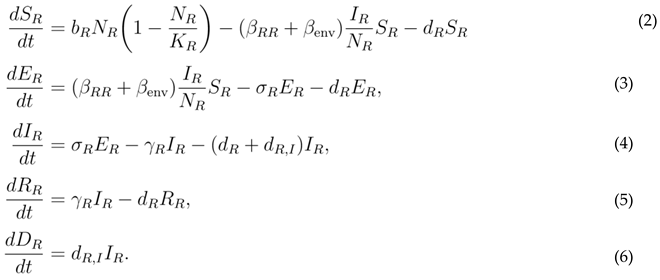
The dynamics are governed by the following system of ordinary differential equations:
Rodent population:
Human population:
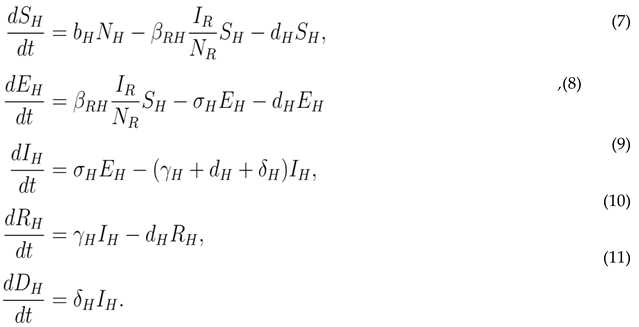
In equations (2)–(6), bR is the per-capita rodent birth rate, KR is the carrying capacity, βRR is the direct rodent-to-rodent transmission rate, βenv is the environmentally mediated transmission rate (via contaminated excreta in the environment), dR is the natural rodent death rate, dR,I is the additional disease-induced death rate in infectious rodents, σR is the rate of progression from exposed to infectious (1/σR = mean latent period), and γR is the rodent recovery rate. In equations (7)–(11), βRH is the rodent-to-human spillover transmission rate (force of infection on humans per infectious rodent per unit rodent population), bH and dH are the human birth and natural death rates, σH and γH are the 269 human latency and recovery rates, and δH is the disease-induced human death rate.
3.4.3. Basic Reproduction Number
The basic reproduction number for the rodent population, R0, is derived using the next generation matrix method [16]:

γR + dR + dR,I
With the baseline parameters in Table 1, R0 = 1.452, indicating that the virus can persist endemically in the rodent population.
3.4.4. Model Parameters
3.4.5. Strategies for Virus Spreading Containment 281 Four scenarios were simulated over a two-year period (730 days):
- Baseline: no intervention; all parameters at values in Table 1.
- Rodent population control: 50% reduction in the rodent birth rate (bR → 0.025 284 day−1), representing sustained rodent culling or habitat modification.
- Human exposure reduction: 75% reduction in the spillover transmission rate (βRH → 1×10⁻⁵ day−1), representing personal protective equipment (PPE), improved 287 housing, and rodent-proofing.
- Combined intervention: simultaneous application of scenarios 2 and 3.
3.4.6. Sensitivity Analysis
A grid-based sensitivity analysis was performed by independently varying βRH (range: 10−6 to 10−4 day−1, 10 values on a log scale) and βRR (range: 0.05 to 0.20 day−1, 10 values on a linear scale). For each parameter combination, the model was integrated over 730 days 293 and two outcome metrics were recorded: peak infectious human prevalence (maxt IH(t)) 294 and cumulative human deaths (DH(730)). Results are presented as heatmaps.
3.4.7. Numerical Implementation
All ODE systems were integrated using the Runge–Kutta 4(5) method (solve ivp with method=‘RK45’) as implemented in SciPy (version 1.11), with relative and absolute tolerances of 10−8 and 10−10, respectively, and a maximum step size of 0.5 days. Initial conditions were: SR(0) = 990, ER(0) = 5, IR(0) = 5, RR(0) = 0, DR(0) = 0; SH(0) = 300 NH − 1, EH(0) = 0, IH(0) = 1, RH(0) = 0, DH(0) = 0.
3.5. Software and Reproducibility
All analyses were performed in Python 3.11. The key packages used were pandas 2.1, NumPy 1.26, SciPy 1.11, NetworkX 3.2, matplotlib 3.8, and seaborn 0.13. STRING API queries used the public REST endpoint (https://string-db.org/api). Enrichr API queries used the public endpoint (https://maayanlab.cloud/Enrichr/). All code 306 and data are available upon request. Portions of the computational workflow, including data retrieval, statistical analysis, network construction, epidemiological modelling, were 308 performed with the assistance of Biomni [26]. All results were verified and interpreted by the author, who takes full responsibility for the scientific content of this work.
4. Results
4.1. Phylogenetic Placement of the MV Hondius Outbreak Strain
Phylogenetic analysis of the S, M, and L segments from the MV Hondius cruise ship outbreak strain (ANDV/Switzerland/Hu-3337/2026) was performed against RefSeq or-thohantavirus reference sequences (Figure 1). The three segment-specific trees showed a consistent topology: in each case, the MV Hondius sequence clustered robustly with 316 Orthohantavirus andesense (NC 003466.1), a reference genome deposited in NCBI in August 2018 and linked to previous studies of Andes viruses from Chile and Argentina (PMID: 12367756; PMID: 11907216). These results support the assignment of the outbreak 319 strain to the Andes orthohantavirus lineage.
4.2. Differential Gene Expression Analysis
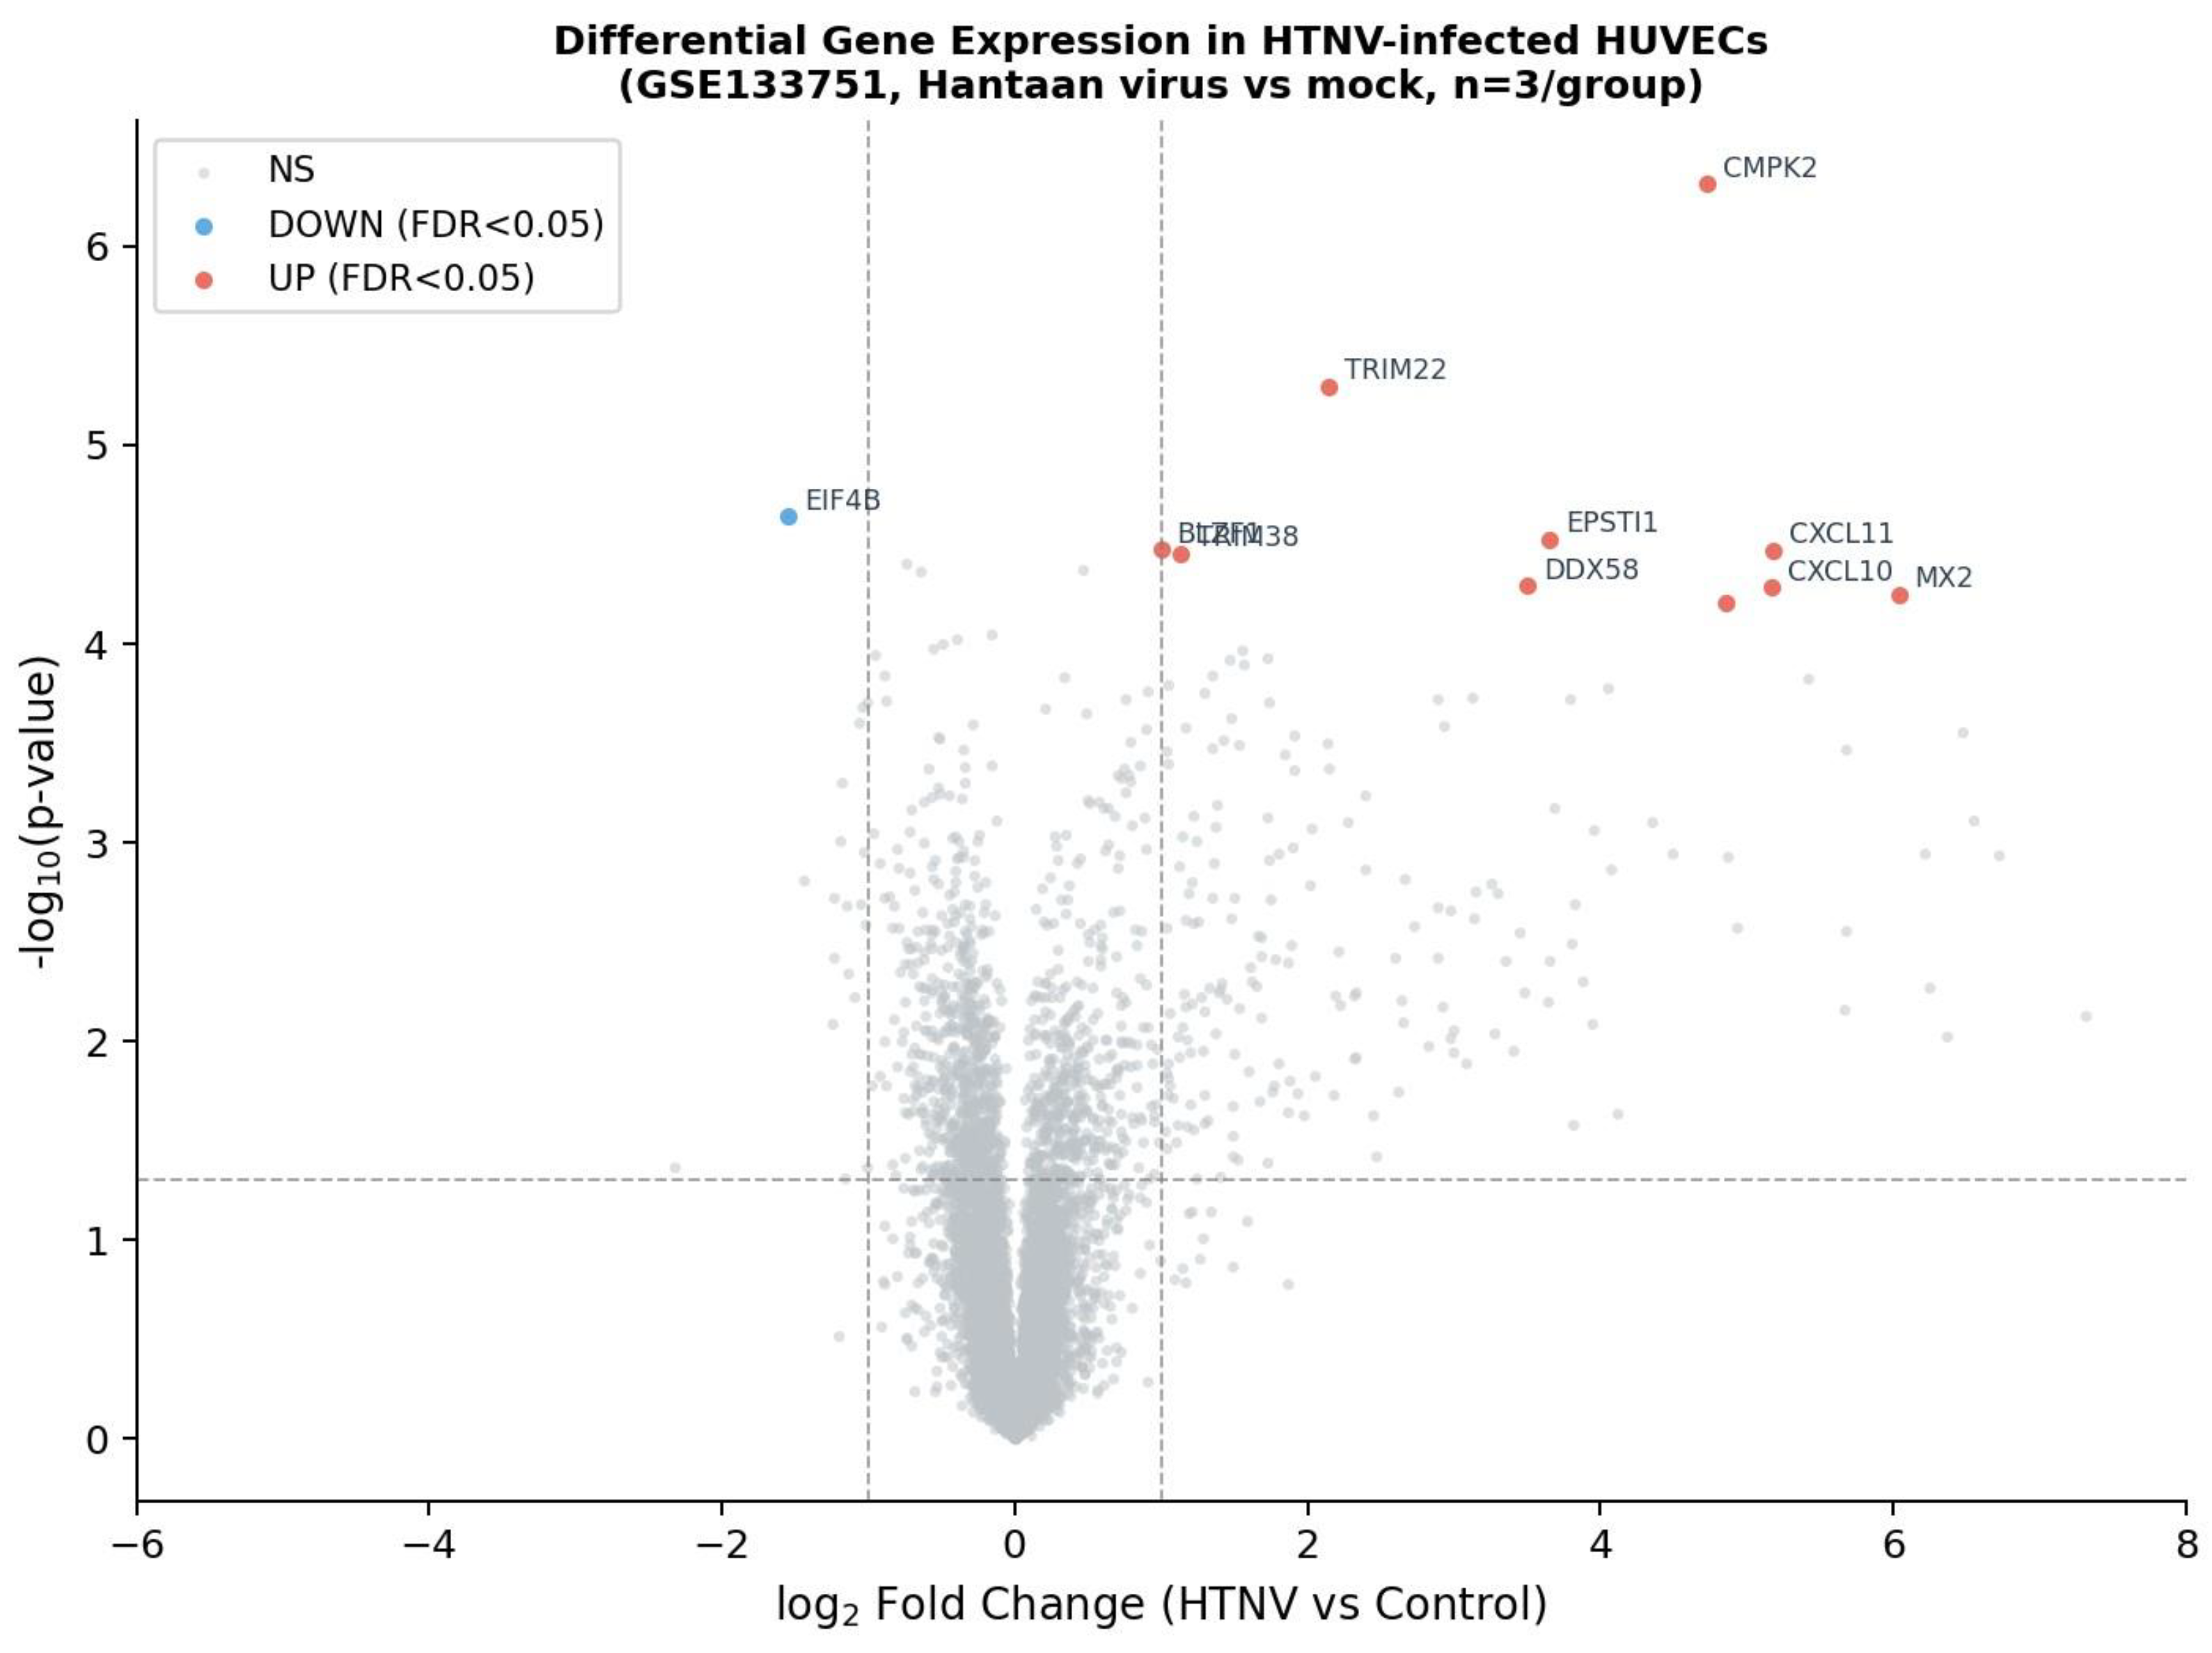
Analysis of the GSE133751 RNA-seq dataset identified 9,660 genes expressed at RPKM ≥ 1 in at least one experimental group. At the stringent FDR-corrected threshold (|log2 FC| ≥ 1, FDR < 0.05), 10 genes were significantly upregulated and 1 gene was significantly downregulated in HTNV-infected HUVECs relative to mock-infected controls (Table 2). At the nominal threshold (p < 0.05, |log2 FC| ≥ 1), 184 genes were upregulated 326 and 19 were downregulated.
The most strongly upregulated genes included MX2 (log2 FC = 6.04), CXCL11 (log2 FC = 5.18), CXCL10 (log2 FC = 5.17), OASL (log2 FC = 4.86), CMPK2 (log2 FC = 4.73), EPSTI1 (log2 FC = 3.65), and DDX58 (log2 FC = 3.51). These genes are canonical ISGs induced downstream of IFN-β signalling. The most significantly downregulated gene at the FDR-corrected threshold was EIF4B (log2 FC = −1.55, FDR = 0.041), a translation initiation factor, consistent with viral suppression of host cap-dependent translation. The volcano plot (Figure 2) illustrates the distribution of fold changes and significance values 334 across all tested genes.
Figure 1.
Phylogenetic trees of the MV Hondius cruise ship outbreak strain (ANDV/Switzerland/Hu-3337/2026; PV808472.1, PV808471.1, and PV808470.1) compared with RefSeq hantavirus sequences for segment S (nucleocapsid, panel A), segment M (glycoprotein, panel B), and segment L (polymerase, panel C). The outbreak sequences are indicated by red dots. Sequence titles contain the accession number, species name, geographic location, and host, separated by vertical bars. Trees are drawn to scale, with branch lengths representing the number of base substitutions per site.
Figure 1.
Phylogenetic trees of the MV Hondius cruise ship outbreak strain (ANDV/Switzerland/Hu-3337/2026; PV808472.1, PV808471.1, and PV808470.1) compared with RefSeq hantavirus sequences for segment S (nucleocapsid, panel A), segment M (glycoprotein, panel B), and segment L (polymerase, panel C). The outbreak sequences are indicated by red dots. Sequence titles contain the accession number, species name, geographic location, and host, separated by vertical bars. Trees are drawn to scale, with branch lengths representing the number of base substitutions per site.
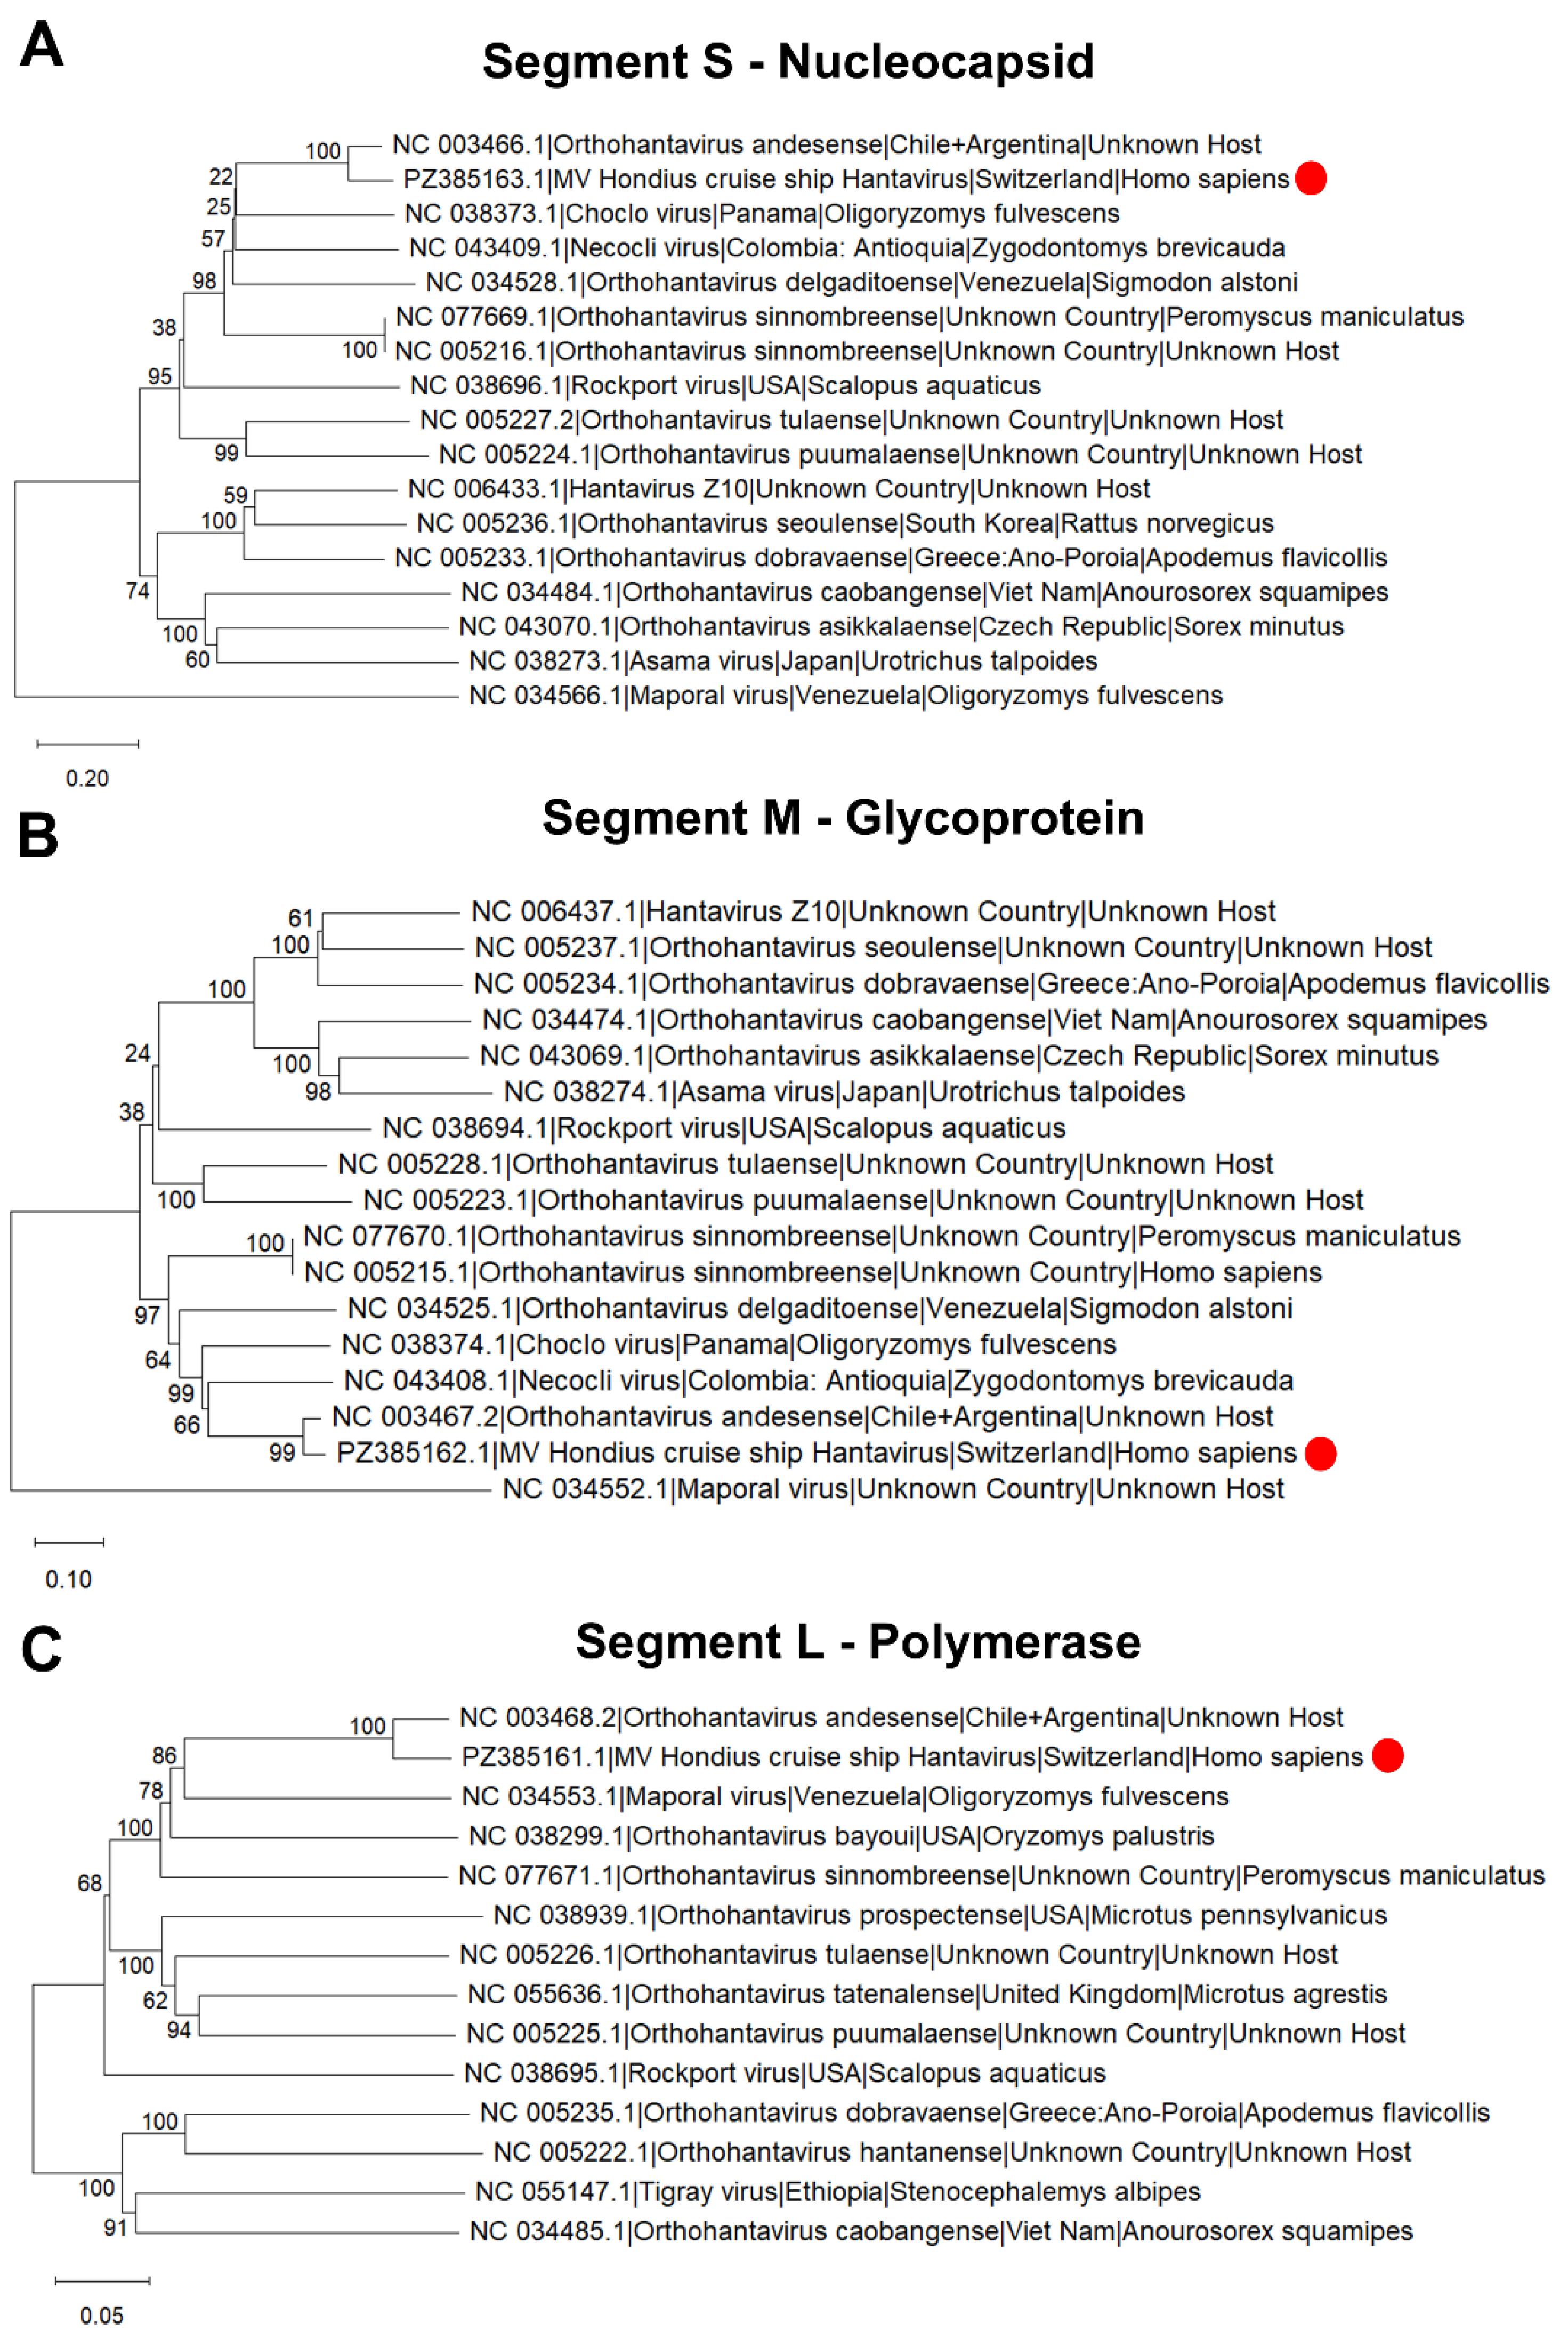
Figure 2.
Volcano plot of differential gene expression in HTNV-infected HUVECs (GSE133751, n = 3 per group). Each point represents one gene; the x-axis shows log2 fold change (HTNV vs. mock) and the y-axis shows −log10(p-value). Red points: FDR < 0.05 and |log2 FC| ≥ 1; orange points: p < 0.05 and |log2 FC| ≥ 1 (nominal); grey points: not significant. Dashed vertical lines indicate log2 FC = ±1; dashed horizontal line indicates p = 0.05. Selected top genes are labelled.
Figure 2.
Volcano plot of differential gene expression in HTNV-infected HUVECs (GSE133751, n = 3 per group). Each point represents one gene; the x-axis shows log2 fold change (HTNV vs. mock) and the y-axis shows −log10(p-value). Red points: FDR < 0.05 and |log2 FC| ≥ 1; orange points: p < 0.05 and |log2 FC| ≥ 1 (nominal); grey points: not significant. Dashed vertical lines indicate log2 FC = ±1; dashed horizontal line indicates p = 0.05. Selected top genes are labelled.
4.3. Pathway Enrichment Analysis
Enrichr analysis of the 184 nominally upregulated genes revealed strong and consistent enrichment across all three pathway libraries for interferon signalling and antiviral defence 338 pathways (Figure 3).
In the Reactome library, the most significantly enriched term was Interferon Signalling (p = 1.3 × 10−63), followed by Interferon Alpha/Beta Signalling (p = 5.7 × 10−53) and Cytokine Signalling in Immune System (p = 9.2×10−49). In the Gene Ontology Biological Process library, the top terms were Defence Response to Virus (p = 3.8 × 10−58), Defence Response to Symbiont (p = 2.6 × 10−53), and Negative Regulation of Viral Process (p = 1.5 × 10⁻³⁵). In the KEGG library, the top terms were Influenza A (p = 5.9 × 10⁻²³), Epstein-Barr Virus Infection (p = 3.4 × 10⁻²¹), NOD-like Receptor Signalling Pathway (p = 5.3 × 10⁻¹⁵), and TNF Signalling Pathway (p = 3.4 × 10⁻¹¹). The enrichment of viral infection pathways from other pathogens (Influenza A, EBV) reflects the shared ISG 348 programme induced by diverse RNA viruses.
Analysis of the 19 nominally downregulated genes revealed enrichment for Ribosome (KEGG, p = 3.1 × 10⁻⁷), Translation (GO, p = 2.9 × 10⁻¹³), and Macromolecule Biosyn351 thetic Process (GO, p = 3.1×10⁻¹⁴), consistent with viral suppression of host cap-dependent 352 translation to redirect ribosomes toward viral protein synthesis.
4.4. PPI Network Centrality Analysis
The STRING PPI network constructed from the 203 nominal DEGs contained 176 nodes and 3,210 edges (medium-confidence threshold, score ≥ 0.4). The network exhibited a scale-free degree distribution characteristic of biological interaction networks, with a mean degree of 36.5 and a maximum degree of 114 (STAT1). The largest connected component contained all 176 nodes, indicating high connectivity among the hantavirus-responsive gene set.
The top ten nodes ranked by composite MRS are listed in Table 3. The highest-ranked hub was ISG15 (MRS = 1.000), a ubiquitin-like modifier that is one of the most strongly induced ISGs and plays a central role in antiviral defence through ISGylation of viral and host proteins [22]. IRF1 (MRS = 0.952) is a transcription factor that amplifies IFN-β production and directly activates ISG promoters. CXCL10 (MRS = 0.901) is a chemokine that recruits NK cells and T cells to sites of infection and is a key mediator of immunopathology in HCPS [1]. STAT1 (MRS = 0.887) is the central transcription factor of the JAK–STAT signalling pathway and is essential for ISG induction [23]. DDX58 368 (MRS = 0.843) encodes RIG-I, the primary cytoplasmic sensor of hantavirus RNA [15].
The high-confidence subgraph (score ≥ 0.7, 123 nodes, 1,169 edges) was visualised in Figure 4. The network exhibits a clear hub-and-spoke topology centred on the IFN-β signalling axis, with ISG15, STAT1, and IRF1 forming a densely interconnected core.
Peripheral clusters correspond to specific antiviral effector modules: the OAS/RNase L pathway (OAS1, OAS2, OAS3, OASL), the MX GTPase family (MX1, MX2), the TRIM 374 E3 ligase family (TRIM22, TRIM25, TRIM38), and the GBP family (GBP1, GBP2, 375 GBP4, GBP5).
4.5. Epidemiological Model Results
4.5.1. Baseline Dynamics
Under baseline conditions, the rodent population reached a stable endemic equilibrium with a peak infectious prevalence of 2.6% (IRmax = 26.1 out of KR = 1000), consistent with reported hantavirus seroprevalence in rodent reservoir populations (2–10%) [3]. The 381 rodent epidemic peaked at approximately day 60 and settled to a lower endemic level by day 200 (Figure 5, panel A).
Human spillover under baseline conditions produced a peak infectious prevalence of 384 10.0 per 100,000 population and a cumulative attack rate of 0.12% over two years (Figure 5, panel B). Cumulative human deaths reached 2.98 per 10,000 population over the simulation period, reflecting the high HCPS case fatality rate (35%). These values are consistent 387 with reported human attack rates in endemic areas (0.01–0.1%) [3,18].
4.5.2. Intervention Scenarios
The results of the four intervention scenarios are summarised in Table 4 and visualised in Figure 5 (panels C–D).
Rodent population control (50% reduction in bR) reduced peak infectious rodent prevalence by 36% (IRmax = 16.7). However, counterintuitively, cumulative human deaths increased slightly to 3.15 per 10,000 (a 5.6% increase relative to baseline). This paradoxical effect arises because rodent population control reduces NR while maintaining a similar proportion of infectious rodents, thereby increasing the per-capita force of infection on humans (βRH ·IR/NR) during the transient phase when the rodent population is suppressed but not eliminated. This phenomenon is analogous to the dilution effect described in the 398 ecological literature [28].
Human exposure reduction (75% reduction in βRH) had no effect on rodent dynamics but reduced cumulative human deaths by 68.5% (to 0.94 per 10,000) and the human attack rate by 69% (to 0.037%). This scenario represents the most effective single intervention for reducing human disease burden.
Combined intervention reduced peak IR by 36% and cumulative human deaths by 67.1% (to 0.98 per 10,000), performing similarly to exposure reduction alone for human outcomes while also reducing rodent infection burden.
4.5.3. Sensitivity Analysis
The sensitivity analysis (Figure 6) revealed that human disease burden is most sensitive to the spillover transmission rate βRH across the entire range tested (10−6 to 10−4 day−1).
Peak infectious human prevalence and cumulative deaths both increase monotonically with βRH, spanning more than two orders of magnitude. In contrast, variation in βRR (rodent-to-rodent transmission) has a more modest effect on human outcomes, primarily through its influence on rodent infectious prevalence. These results reinforce the conclusion that interventions targeting the rodent-to-human interface (i.e., reducing βRH) are the 414 most effective strategy for reducing human disease burden.
5. Discussion
5.1. Molecular Landscape of Hantavirus Infection
Our transcriptomic analysis of HTNV-infected HUVECs reveals a host response dominated by the type I interferon signalling axis. The most strongly upregulated genes – MX2, CXCL10, CXCL11, OASL, CMPK2, DDX58 – are all canonical ISGs induced downstream of IFN-β production. This is consistent with previous transcriptomic studies of hantavirus infection in endothelial cells and macrophages [23,29], and with the known role of RIG-I (DDX58) as the primary sensor of hantavirus RNA [15].
The concurrent downregulation of translation machinery (EIF4B, ribosomal proteins) is noteworthy. Hantavirus NP has been shown to interact with the host translation machinery, and recent proteomics studies have implicated the VCP/p97 unfoldase in NP processing [22]. Suppression of cap-dependent translation may represent a viral strategy to redirect ribosomes toward IRES-mediated viral translation, a mechanism shared with other negative-sense RNA viruses. The long non-coding RNA NEAT1 has also been reported to facilitate hantavirus replication by scaffolding RIG-I signalling complexes [15], suggesting that the transcriptional response extends beyond protein-coding genes.
5.2. Network Hubs as Candidate Therapeutic Targets
The identification of ISG15, IRF1, CXCL10, STAT1, and DDX58 as the most central nodes in the hantavirus-responsive PPI network has direct therapeutic implications. ISG15 and its conjugating enzymes (UBE1L, UBCH8, HERC5) have been proposed as antiviral targets because ISGylation of viral NP restricts hantavirus replication [22]. STAT1 is a master transcription factor whose activation is both antiviral and, in excess, pro-inflammatory; modulation of STAT1 activity has been explored in the context of cytokine storm syndromes [23]. CXCL10 is a key mediator of the immunopathological response in HCPS, and elevated plasma CXCL10 levels correlate with disease severity [1]. RIPK3440 mediated necroptosis, which intersects with STAT1 signalling, has recently been identified 441 as a determinant of hantavirus pathogenicity [23].
We emphasise that our network centrality analysis identifies hubs based on topo-logical properties of the STRING interaction network, which integrates experimental, co-expression, and text-mining evidence. This approach is a well-validated proxy for regulatory importance [19] but does not replace formal master regulator analysis methods such as VIPER/ARACNe, which require a curated transcription factor–target regulon.
Future work should apply these methods to larger hantavirus transcriptomic datasets to validate and extend our findings. The ExDiff framework [20] provides a natural extension for modelling the propagation of transcriptional perturbations through the PPI network.
5.3. Epidemiological Implications
The coupled SEIRD model yields several epidemiologically important insights. First, the rodent R0 = 1.452 indicates that hantavirus can persist endemically in rodent populations 453 without requiring high transmission rates, consistent with the observed persistence of hantavirus in reservoir populations across diverse ecological settings [2,16]. The value is consistent with estimates from independent modelling studies: Wesley et al. [16] reported R0 values of 1.2–2.1 for Sin Nombre virus in deer mouse populations, and Supriatna et al. [17] reported similar values for HTNV.
Second, the finding that rodent population control alone can paradoxically increase human cases deserves careful consideration. This result arises from the model structure: when rodent birth rates are reduced, the total rodent population decreases, but the proportion of infectious rodents may remain similar or increase transiently, raising the per-capita force of infection on humans. This is analogous to the dilution effect in disease ecology, where reduced host diversity or density can increase per-capita transmission risk [28]. In practice, rodent control programmes should be combined with human exposure reduction measures to avoid this unintended consequence. This finding has direct public-health relevance: rodent culling campaigns, if not accompanied by PPE and environmental hygiene measures, may provide a false sense of security.
Third, the sensitivity analysis demonstrates that βRH – the rodent-to-human spillover rate – is the dominant determinant of human disease burden. This parameter is directly modifiable through public-health interventions: use of PPE (gloves, N95 respirators) during activities with rodent exposure risk, rodent-proofing of homes and workplaces, and improved sanitation to reduce environmental contamination with rodent excreta. These findings are consistent with epidemiological evidence that occupational and recreational exposure to 474 rodent habitats is the primary risk factor for hantavirus infection in humans [1,5].
5.4. The MV Hondius Outbreak: A Real-World Stress Test of Model Assumptions
The April–May 2026 outbreak of Andes orthohantavirus (ANDV) aboard the Dutch expedition cruise ship MV Hondius provides a uniquely instructive real-world event against which to evaluate the assumptions and outputs of the present model [13,14]. The vessel departed Ushuaia, Argentina, on 1 April 2026. In early May 2026, the World Health Organization reported a cluster of suspected and confirmed hantavirus cases, including three deaths, among the 147 passengers and crew, with additional suspected cases under investigation across multiple countries [13]. This event – the first documented ANDV 484 cluster in a cruise ship setting – simultaneously validates several of our model’s core 485 predictions and exposes the boundaries of its applicability.
Where the model’s predictions hold. The Hondius outbreak is consistent with the model’s central finding that reducing human exposure to infectious sources is the dominant lever for controlling human disease burden. The rapid international response – isolation of symptomatic passengers, medical evacuation, contact tracing across disembarkation 490 ports, and enforcement of strict precautionary measures on board – mirrors the “exposure reduction” scenario in our simulations, which achieved a 68.5% reduction in cumulative human deaths relative to the uncontrolled baseline. The WHO’s assessment that “the overall public health risk remains low” for the general population [13] is consistent with the model’s prediction that the rodent-to-human spillover rate βRH is the critical parameter: once the index exposure event (contact with rodent excreta during shore excursions in Patagonia and sub-Antarctic islands) is terminated and human-to-human contact is restricted, onward transmission is expected to be self-limiting. Furthermore, the observed 498 case fatality rate of approximately 43% (3 deaths among 7 confirmed or suspected cases) is consistent with the HCPS CFR of 30–50% used to parameterise δH in our model [1,10].
Where the model requires extension. The Hondius outbreak simultaneously exposes the most consequential structural limitation of the present model: the absence of a human-to-human transmission compartment. Our coupled SEIRD system models humans strictly as dead-end spillover hosts, with βHH = 0. This assumption is appropriate for the majority of hantavirus strains (HTNV, PUUV, SNV, DOBV), but ANDV is the sole exception for which person-to-person transmission has been conclusively demonstrated through genomic and epidemiological evidence [6,7,8]. In the Epuy´en, Argentina outbreak of 2018–2019, the estimated human-to-human reproductive number reached  . 12 before isolation measures were enforced [10], a value that substantially exceeds the rodent-reservoir R0 = 1.452 estimated in our model. The Hondius setting – a confined vessel with shared air circulation, dining facilities, and close social contact among passengers – represents precisely the high-contact environment in which ANDV’s capacity for human-to-human spread is most likely to be realised [14]. Incorporating a human-to-human transmission term βHH · (IH/NH) · SH into equation (8) would transform the human compartment from a passive spillover sink into an active transmission chain, fundamentally altering the model’s intervention landscape: under such conditions, exposure reduction alone would be insufficient, and isolation of infectious individuals (reducing the effective βHH) would 517 become an equally critical intervention parameter.
. 12 before isolation measures were enforced [10], a value that substantially exceeds the rodent-reservoir R0 = 1.452 estimated in our model. The Hondius setting – a confined vessel with shared air circulation, dining facilities, and close social contact among passengers – represents precisely the high-contact environment in which ANDV’s capacity for human-to-human spread is most likely to be realised [14]. Incorporating a human-to-human transmission term βHH · (IH/NH) · SH into equation (8) would transform the human compartment from a passive spillover sink into an active transmission chain, fundamentally altering the model’s intervention landscape: under such conditions, exposure reduction alone would be insufficient, and isolation of infectious individuals (reducing the effective βHH) would 517 become an equally critical intervention parameter.
Implications for model-guided public health response. The Hondius event also highlights two additional model extensions warranted by the emerging epidemiology of ANDV. First, the international travel context introduces a spatial dimension entirely absent from the present homogeneous-mixing ODE framework: passengers disembarked at Saint Helena, Cape Verde, South Africa, the Netherlands, Germany, Switzerland, and Spain, creating geographically dispersed exposure chains that a single-population model cannot represent. Graph-based epidemic modelling approaches, such as those developed for West Nile virus [21], are well suited to capturing this multi-node transmission network and should be incorporated in future ANDV-specific models. Second, the identification of specific amino acid substitutions in the ANDV nucleocapsid protein and glycoprotein associated with enhanced human transmissibility [11,12] suggests that genomic surveillance of circulating ANDV lineages should be integrated with epidemiological modelling to provide early warning of strains with elevated  . Taken together, the MV Hondius outbreak underscores that while the present model provides a valid and calibrated framework for the majority of hantavirus strains and transmission settings, ANDV demands a dedicated modelling extension that explicitly represents human-to-human transmission, spatial 534 dispersal, and strain-level genomic heterogeneity.
. Taken together, the MV Hondius outbreak underscores that while the present model provides a valid and calibrated framework for the majority of hantavirus strains and transmission settings, ANDV demands a dedicated modelling extension that explicitly represents human-to-human transmission, spatial 534 dispersal, and strain-level genomic heterogeneity.5.5. Limitations
Several limitations of this study should be acknowledged. First, the transcriptomic analysis is based on a single dataset with n = 3 biological replicates per group, limiting statistical power. Only 10 genes reached FDR-corrected significance; the broader nominal DEG list used for enrichment and network analyses should be interpreted as exploratory. Validation 540 in independent datasets (e.g., GSE158712, GSE161354) is warranted.
Second, the network centrality analysis uses the STRING database, which integrates heterogeneous evidence types including text mining and co-expression, potentially intro543 ducing false-positive interactions. The use of a medium confidence threshold (score ≥ 0.4) mitigates but does not eliminate this concern.
Third, the epidemiological model is a deterministic, homogeneous-mixing ODE system that does not capture spatial heterogeneity, seasonal forcing, or stochastic effects. Season-ality is a major driver of hantavirus outbreaks, particularly in Europe and Asia [2], and its omission limits the model’s predictive accuracy for specific outbreak scenarios. The model also does not represent human-to-human transmission (relevant for Andes virus) or 550 the diversity of hantavirus strains with different CFRs (HFRS: 1–15%; HCPS: 30–40%).
Fourth, the model parameters, while literature-derived, carry uncertainty. The spillover rate βRH in particular is difficult to estimate directly and was calibrated to match observed attack rates; its true value likely varies substantially across settings, seasons, and human 554 behaviours.
5.6. Future Directions
Future work should address these limitations by: (i) applying formal master regulator analysis (VIPER/ARACNe) to larger hantavirus transcriptomic datasets; (ii) incorporating seasonal forcing and spatial structure into the epidemiological model; (iii) extending the 559 model to represent multiple hantavirus strains and human-to-human transmission; and (iv) integrating molecular and epidemiological data through multi-scale modelling frameworks.
The graph-based epidemic modelling approach developed for West Nile virus [21] and the network diffusion framework ExDiff [20] provide natural extensions for incorporating spatial and network structure into future hantavirus models. Integration of genomic epidemiology data [30] with the ODE framework could further improve parameter estimation and outbreak prediction.
6. Conclusions
We have presented an integrated computational analysis of hantavirus infection combining downstream transcriptomic analysis, PPI network centrality analysis, and coupled SEIRD 569 epidemiological modelling. Our key findings are:
- HTNV infection of HUVECs induces a strong interferon-dominated transcriptional response, with MX2, CXCL10, CXCL11, DDX58, and OASL among the most strongly 572 upregulated genes, and concurrent suppression of ribosomal translation machinery.
- Network centrality analysis identifies ISG15, IRF1, CXCL10, STAT1, and DDX58 as the most central hubs in the hantavirus-responsive PPI network, representing 575 candidate targets for antiviral intervention and biomarker development.
- The coupled SEIRD epidemiological model (R0 = 1.452) demonstrates that han-tavirus can persist endemically in rodent populations and that human exposure reduction is substantially more effective than rodent population control alone for 579 reducing human disease burden.
- Rodent population control in isolation can paradoxically increase human cases through a dilution-like effect, highlighting the importance of combining rodent management with human exposure reduction measures.
This integrated framework, combining molecular and epidemiological analyses, pro-vides a multi-scale view of hantavirus infection that can inform both therapeutic target identification and public-health intervention design. The approach is generalisable to other zoonotic RNA viruses for which public transcriptomic data and epidemiological parameters 587 are available.
Author Contributions
Conceptualization, Pietro Hiram Guzzi, Francesco Branda, Fabio Scarpa, Federico Giorgi and Pierangelo Veltri; Formal analysis, Pietro Hiram Guzzi, Francesco Branda and Fabio Scarpa; Methodology, Pietro Hiram Guzzi, Giancarlo Ceccarelli and Massimo Ciccozzi; Software, Federico Giorgi; Writing – original draft, Pietro Hiram Guzzi, Francesco Branda and Federico Giorgi; Writing – review & editing, Pierangelo Veltri.
Data Availability
All expression data used in this study are publicly available from the Gene Expression Omnibus (GSE133751). Analysis code and supplementary data files are available from the corresponding author upon reasonable request.
Acknowledgments
The authors thank the researchers who deposited the GSE133751 dataset in the Gene Expression Omnibus, enabling open-science reanalysis. No funding was received for this study.
Conflicts of Interest
The authors declare no conflicts of interest.
References
- [1] Pablo A Vial, Marcela Ferr´es, Cecilia Vial, Jonas Klingstro¨m, Clas Ahlm, Ren´e Lo´pez, Nicole Le Corre, and Gregory J Mertz. Hantavirus in humans: a review of clinical 607 aspects and management. The Lancet Infectious Diseases, 23(9):e371–e382, 2023.
- [2] Huaiyu Tian, Pengbo Yu, Bernard Cazelles, Lei Xu, Hua Tan, Juan Yang, ShanqianHuang, Bing Xu, Jun Cai, Chaofeng Ma, Jing Wei, Shenlong Li, Jiahui Qu, Mikael Laine, Jianpeng Wang, Shilu Tong, and Nils Chr. Stenseth. Interannual cycles ofHantaan virus outbreaks at the human–animal interface in central China are controlledby temperature and rainfall. Proceedings of the National Academy of Sciences, 114 613 (30):8041–8046, 2017. [CrossRef]
- [3] Fernando Tortosa, Fernando Perre, Celia Tognetti, Lucia Lossetti, Gabriela Carrasco,German Guaresti, Ayel´en Iglesias, Yesica Espasandin, and Ariel Izcovich. Seropreva-lence of hantavirus infection in non-epidemic settings over four decades: a systematic 617 review and meta-analysis. BMC Public Health, 24(1):2553, 2024.
- [4] Javier Toledo, Camila Balmaceda, Cecilia Vial, and Pablo A. Vial. Human-to-human 619 transmission of Andes virus: a systematic review. Journal of Infectious Diseases, 224 620 (Supplement 2):S285–S292, 2021. [CrossRef]
- [5] Daniele Fabbri, Monica Mirolo, Valentina Tagliapietra, Martin Ludlow, Albert Oster-haus, and Paola Beraldo. Ecological determinants driving orthohantavirus prevalencein small mammals of europe: a systematic review. One Health Outlook, 7(1):15, 2025.
- [6] Valeria P. Mart´ınez, Carla Bellomo, Jorge San Juan, Delia Pinna, Ricardo Forlenza,Mirta Elder, and Paula J. Padula. Person-to-person transmission of Andes virus. 626 Emerging Infectious Diseases, 11(12):1848–1853, 2005. [CrossRef]
- [7] Delia O. Alonso, Unai P´erez-Sautu, Carla M. Bellomo, Karina Prieto, Analia Iglesias,Roc´ıo Coelho, Natalia Periolo, and Valeria P. Mart´ınez. Person-to-person transmissionof Andes virus in hantavirus pulmonary syndrome, Argentina, 2014. Emerging Infectious Diseases, 26(4):792–796, 2020. [CrossRef]
- [8] Paula J. Padula, Alicia Edelstein, Silvia D. L. Miguel, Nora M. Lo´pez, Celia M. Rossi,and Ricardo D. Rabinovich. Hantavirus pulmonary syndrome outbreak in Argentina:molecular evidence for person-to-person transmission of Andes virus. Virology, 241 (2):323–330, 1998. [CrossRef]
- [9] Enrique Pizarro, Maritza Navarrete, Carolina Mendez, Luis Zaror, Carlos Mansilla,Mauricio Tapia, Cristian Carrasco, Paula Salazar, Roberto Murua, Paula Padula,Carola Otth, and Esteban Martin Rodr´ıguez. Immunocytochemical and ultrastructuralevidence supporting that Andes hantavirus (ANDV) is transmitted person-to-person 639 through the respiratory and/or salivary pathways. Frontiers in Microbiology, 10:2992, 640 2020. [CrossRef]
- [10] Valeria P. Mart´ınez, Nicholas Di Paola, Delia O. Alonso, Unai P´erez-Sautu, Carla M.Bellomo, Anal´ıa A. Iglesias, Roc´ıo M. Coelho, Natalia Periolo, Florencia Mart´ınez,Patricia A. Larson, Elyse R. Nagle, Joseph A. Chitty, Catherine B. Pratt, JorgeD´ıaz, Daniel M. Cisterna, Mart´ın C. Freire, Julio Leguizamo´n, Cristina N. Gardenal,Silvana C. Levis, Delia A. Enr´ıa, and Gustavo Palacios. “Super-spreaders” andperson-to-person transmission of Andes virus in Argentina. New England Journal of 647 Medicine, 383(23):2230–2241, 2020. [CrossRef]
- [11] Roc´ıo M. Coelho, Silvana Kehl, Natalia Periolo, Delia O. Alonso, Carla M. Bellomo,and Valeria P. Mart´ınez. Virological characterization of a new isolated strain ofAndes virus involved in the recent person-to-person transmission outbreak reported 651 in Argentina. PLOS Neglected Tropical Diseases, 19(2):e0013205, 2025. [CrossRef]
- [12] Carla M. Bellomo, Delia O. Alonso, Unai P´erez-Sautu, Anal´ıa Iglesias, Roc´ıo Coelho, Natalia Periolo, and Valeria P. Mart´ınez. Andes virus genome mutations that are likely associated with animal model attenuation and human person-to-person transmission. mSphere, 8(2):e00018–23, 2023. [CrossRef]
- [13] World Health Organization. Hantavirus cluster linked to cruise ship travel, multicountry — Disease Outbreak News DON599. Technical report, World Health Organization, May 2026. Published 5 May 2026. Available at: https://www.who. int/emergencies/disease-outbreak-news/item/2026-DON599 [Accessed 10 May 661 2026].
- [14] Public Health Agency of Canada. Rapid risk assessment: Hantavirus (Andes virus)outbreak on international cruise ship. Technical report, Public Health Agency ofCanada, May 2026. Assessment completed 8 May 2026. Available at: https://www.canada.ca/en/public-health/services/emergency-preparedness-response/rapid-risk-assessments-public-health-professionals/rapid-risk-assessment-hantavirus-andes-virus-outbreak-international-cruise-ship.html [Accessed 10 May 2026].
- [15] Hongwei Ma, Peng Han, Wei Ye, Hui Chen, Xuyang Zheng, Linfeng Cheng, LiangZhang, Lei Yu, Xingan Wu, Zhikai Xu, Fanglin Zhang, and Ying Zhu. The longnoncoding RNA NEAT1 exerts antihantaviral effects by acting as positive feedback for RIG-I signaling. Journal of Virology, 91(9):e02250–16, 2017. [CrossRef]
- [16] Angela D Luis, Richard J Douglass, James N Mills, and Ottar N Bjørnstad. Theeffect of seasonality, density and climate on the population dynamics of montana deer 676 mice, important reservoir hosts for sin nombre hantavirus. Journal of Animal Ecology, 79(2):462–470, 2010.
- [17] Asep K. Supriatna, Hennie Husniah, Edy Soewono, Bapan Ghosh, Usman Purwati,and Herlina Padjaitan. A mathematical model for the transmission of hantavirus 680 between rodents and humans. Computational and Mathematical Methods in Medicine, 681 2023:4349874, 2023. [CrossRef]
- [18] Juan Pablo Guti´errez-Jara, Mar´ıa Teresa Mun˜oz-Quezada, Fernando C´ordova-Lepe,and Ana Silva-Guzma´n. Mathematical model of the dynamics of hantavirus infectionin rodents and humans with the effect of rodent mobility. Pathogens, 12(2):220, 2023. [CrossRef]
- [19] Pietro Hiram Guzzi, Daniele Mercatelli, Carmine Ceraolo, and Federico M. Giorgi.Master regulator analysis of the SARS-CoV-2/Human interactome. Journal of Clinical 688 Medicine, 9(4):982, 2020. [CrossRef]
- [20] Annamaria Defilippo, Ugo Lomoio, Barbara Puccio, Pierangelo Veltri, and Pietro Hi-ram Guzzi. Exdiff: a modular and explainable framework combining network simula-tion and graph neural networks for diffusion modelling. Social Network Analysis and Mining, 16(1):3, 2026.
- [21] Francesco Branda, Mohamed Mustaf Ahmed, Annamaria Defilippo, Ugo Lomoio,Barbara Puccio, Massimo Ciccozzi, Fabio Scarpa, Pierangelo Veltri, and Pietro HiramGuzzi. Using graph models to understand West Nile virus epidemics: a computational 696 approach. F1000Research, 5:2813, 2016. [CrossRef]
- [22] Austin Royster, Songyang Ren, Saima Ali, Sheema Mir, and Mohammad Mir. Mod698 ulations in the host cell proteome by the hantavirus nucleocapsid protein. PLoS 699 Pathogens, 20(1):e1011925, 2024.
- [23] Yue Si, Haijun Zhang, Ziqing Zhou, Xudong Zhu, Yongheng Yang, He Liu, LiangZhang, Linfeng Cheng, Kerong Wang, Wei Ye, et al. Ripk3 promotes hantaviralreplication by restricting jak-stat signaling without triggering necroptosis. Virologica Sinica, 38(5):741–754, 2023.
- [24] Damian Szklarczyk, Rebecca Kirsch, Mikaela Koutrouli, Katerina Nastou, FarrokhMehryary, Radja Hachilif, Annika L. Gable, Tao Fang, Nadezhda T. Doncheva,Sampo Pyysalo, Lars J. Jensen, and Christian von Mering. STRING v11.5: protein–protein association networks with increased coverage supporting functional discovery 708 in genome-wide experimental datasets. Nucleic Acids Research, 51(D1):D638–D646, 709 2023. [CrossRef]
- [25] Maxim V Kuleshov, Matthew R Jones, Andrew D Rouillard, Nicolas F Fernandez,Qiaonan Duan, Zichen Wang, Simon Koplev, Sherry L Jenkins, Kathleen M Jagodnik,Alexander Lachmann, et al. Enrichr: a comprehensive gene set enrichment analysisweb server 2016 update. Nucleic acids research, 44(W1):W90–W97, 2016.
- [26] Phylo, Inc. Biomni: AI-powered scientific research platform. https://phylo.com, 715 2026. Accessed May 2026.
- [27] S. Lu, N. Zhu, W. Guo, X. Wang, K. Li, J. Yan, C. Jiang, S. Han, H. Xiang, X. Wu,Y. Liu, H. Xiong, L. Chen, Z. Gong, F. Luo, and W. Hou. Rna-seq revealed acircular rna-microrna-mrna regulatory network in hantaan virus infection. Frontiers 719 in Cellular and Infection Microbiology, 10:97, 2020. [CrossRef]
- [28] Christine A Clay, Erin M Lehmer, Stephen St Jeor, and M Denise Dearing. Sinnombre virus and rodent species diversity: a test of the dilution and amplification 722 hypotheses. PloS one, 4(7):e6467, 2009.
- [29] Peter T. Witkowski, Jan Felix Drexler, Ren´e Kallies, Martina Liˇckova´, Silvia Bokorova´,Gael D. Mananga, Toma´ˇs Szemes, Eric M. Leroy, Detlev H. Kru¨ger, Christian Drosten,and Boris Klempa. Phylogenetic analysis of a newfound bat-borne hantavirus supportsa laurasiatherian host association for ancestral hantaviruses. Infection, Genetics and 727 Evolution, 41:113–119, 2016. [CrossRef]
- [30] Won-Keun Kim, Seungchan Cho, Seung-Ho Lee, Jin Sun No, Geum-Young Lee,Kyungmin Park, Daesang Lee, Seong Tae Jeong, and Jin-Won Song. Genomicepidemiology and active surveillance to investigate outbreaks of hantaviruses. Frontiersin Cellular and Infection Microbiology, 10:532388, 2021.
Figure 3.
Pathway enrichment analysis of differentially expressed genes in HTNV-infected HUVECs. Top 10 enriched terms are shown for upregulated (left panels) and downregulated (right panels) gene sets across KEGG, Gene Ontology Biological Process (GO BP), and Reactome libraries. Bar length represents −log10 adjusted p-value. Analysis performed using the Enrichr API [25].
Figure 3.
Pathway enrichment analysis of differentially expressed genes in HTNV-infected HUVECs. Top 10 enriched terms are shown for upregulated (left panels) and downregulated (right panels) gene sets across KEGG, Gene Ontology Biological Process (GO BP), and Reactome libraries. Bar length represents −log10 adjusted p-value. Analysis performed using the Enrichr API [25].
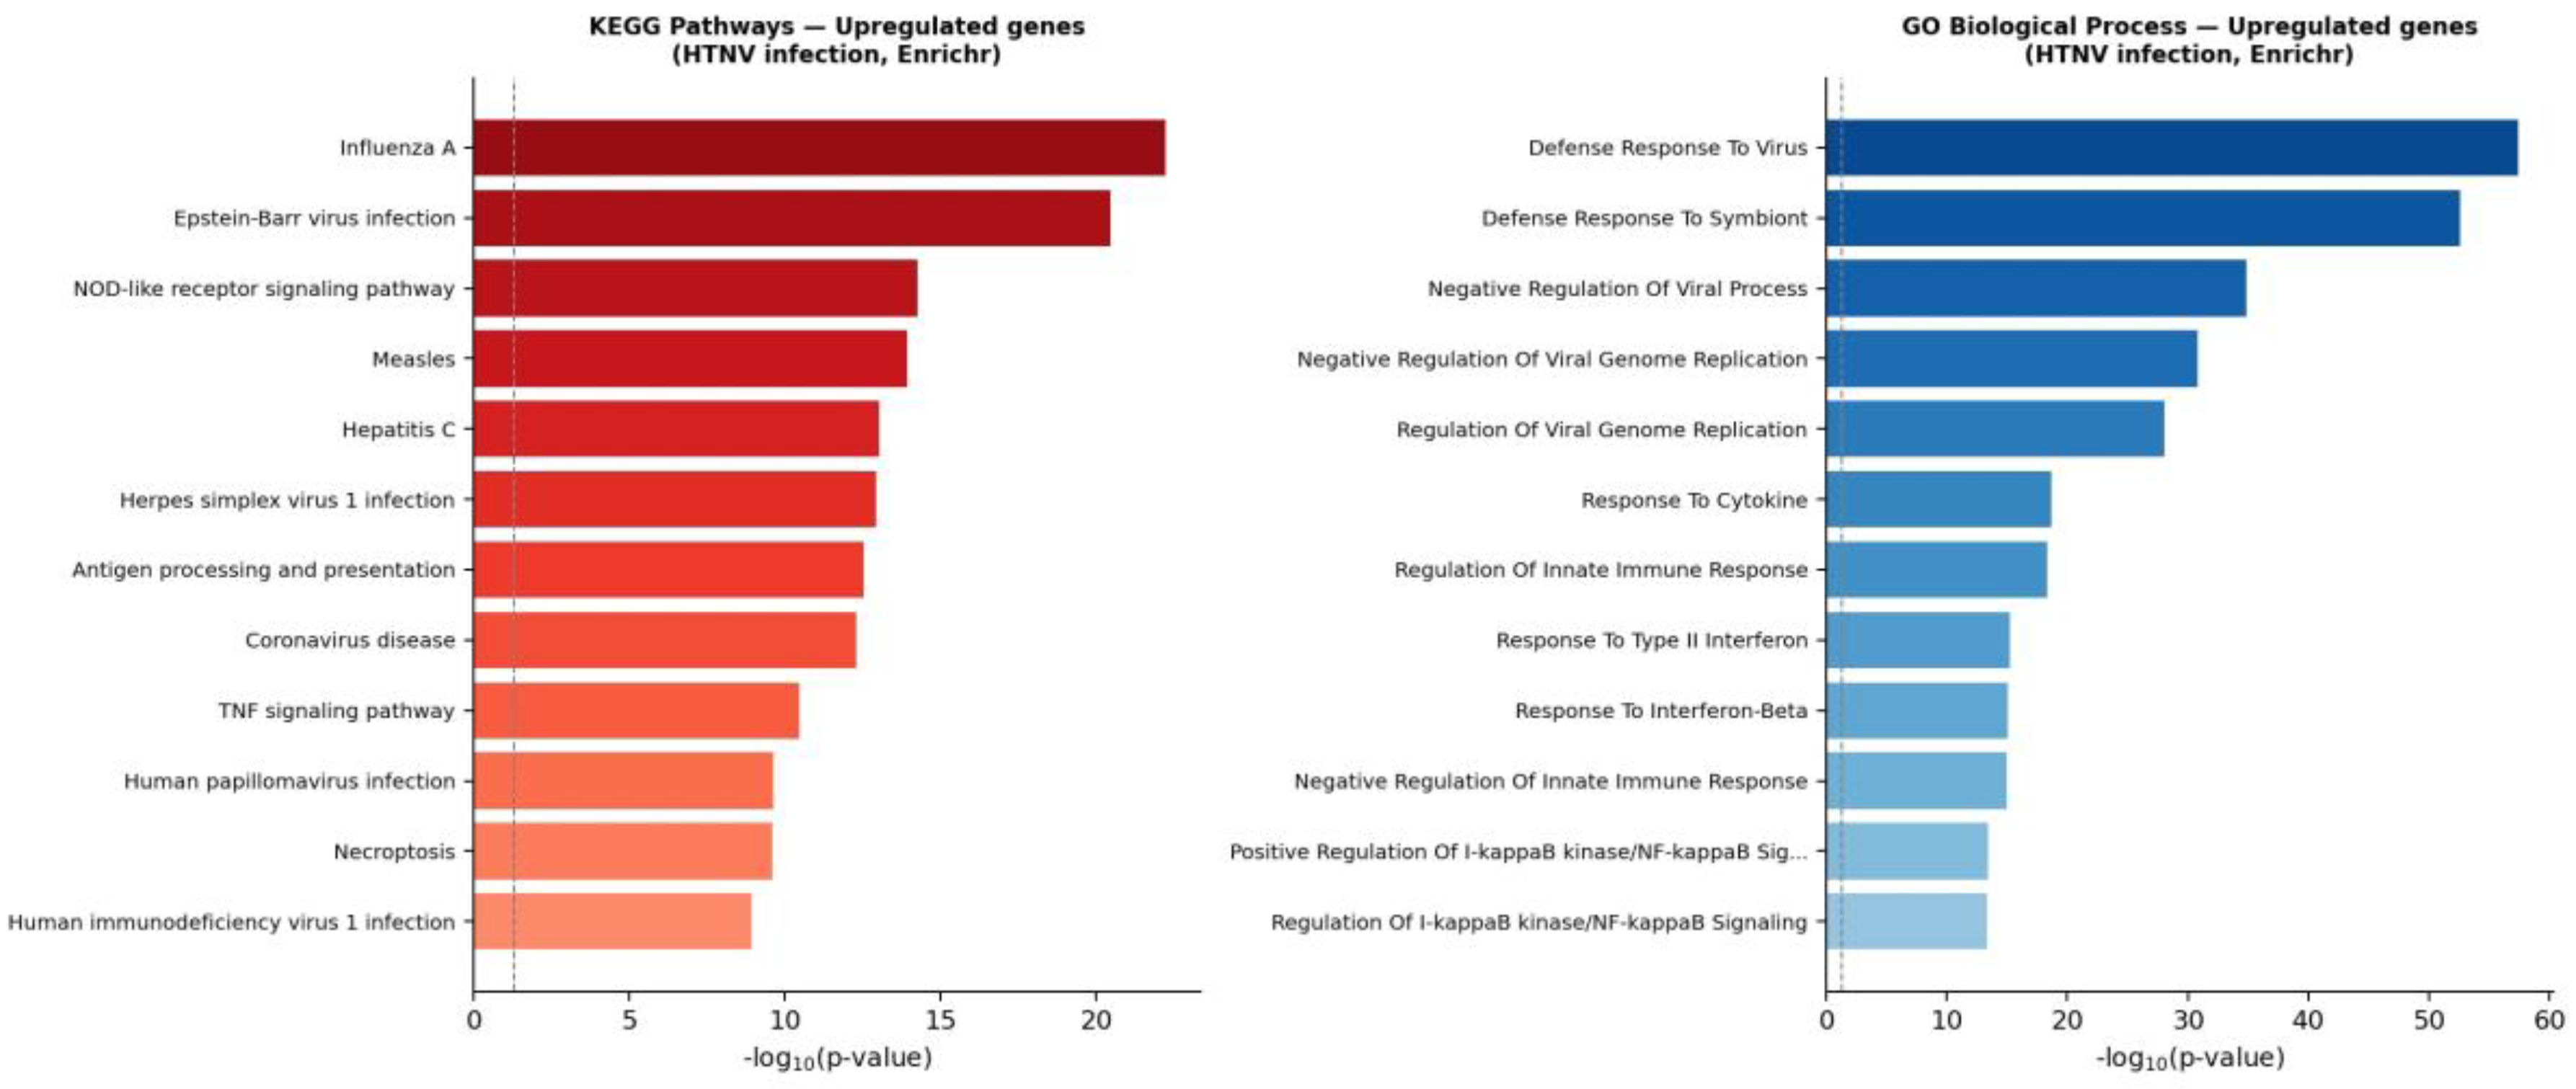
Figure 4.
Protein–protein interaction network of hantavirus-responsive genes. Nodes represent DEGs, and edges represent STRING interactions (score ≥ 0.7). Node colour denotes log2 fold change (red: upregulated; blue: downregulated). Node size is proportional to the Master Regulator Score (MRS). The top 10 hubs by MRS are labelled and outlined in gold. Network constructed from STRING v12 [24].
Figure 4.
Protein–protein interaction network of hantavirus-responsive genes. Nodes represent DEGs, and edges represent STRING interactions (score ≥ 0.7). Node colour denotes log2 fold change (red: upregulated; blue: downregulated). Node size is proportional to the Master Regulator Score (MRS). The top 10 hubs by MRS are labelled and outlined in gold. Network constructed from STRING v12 [24].
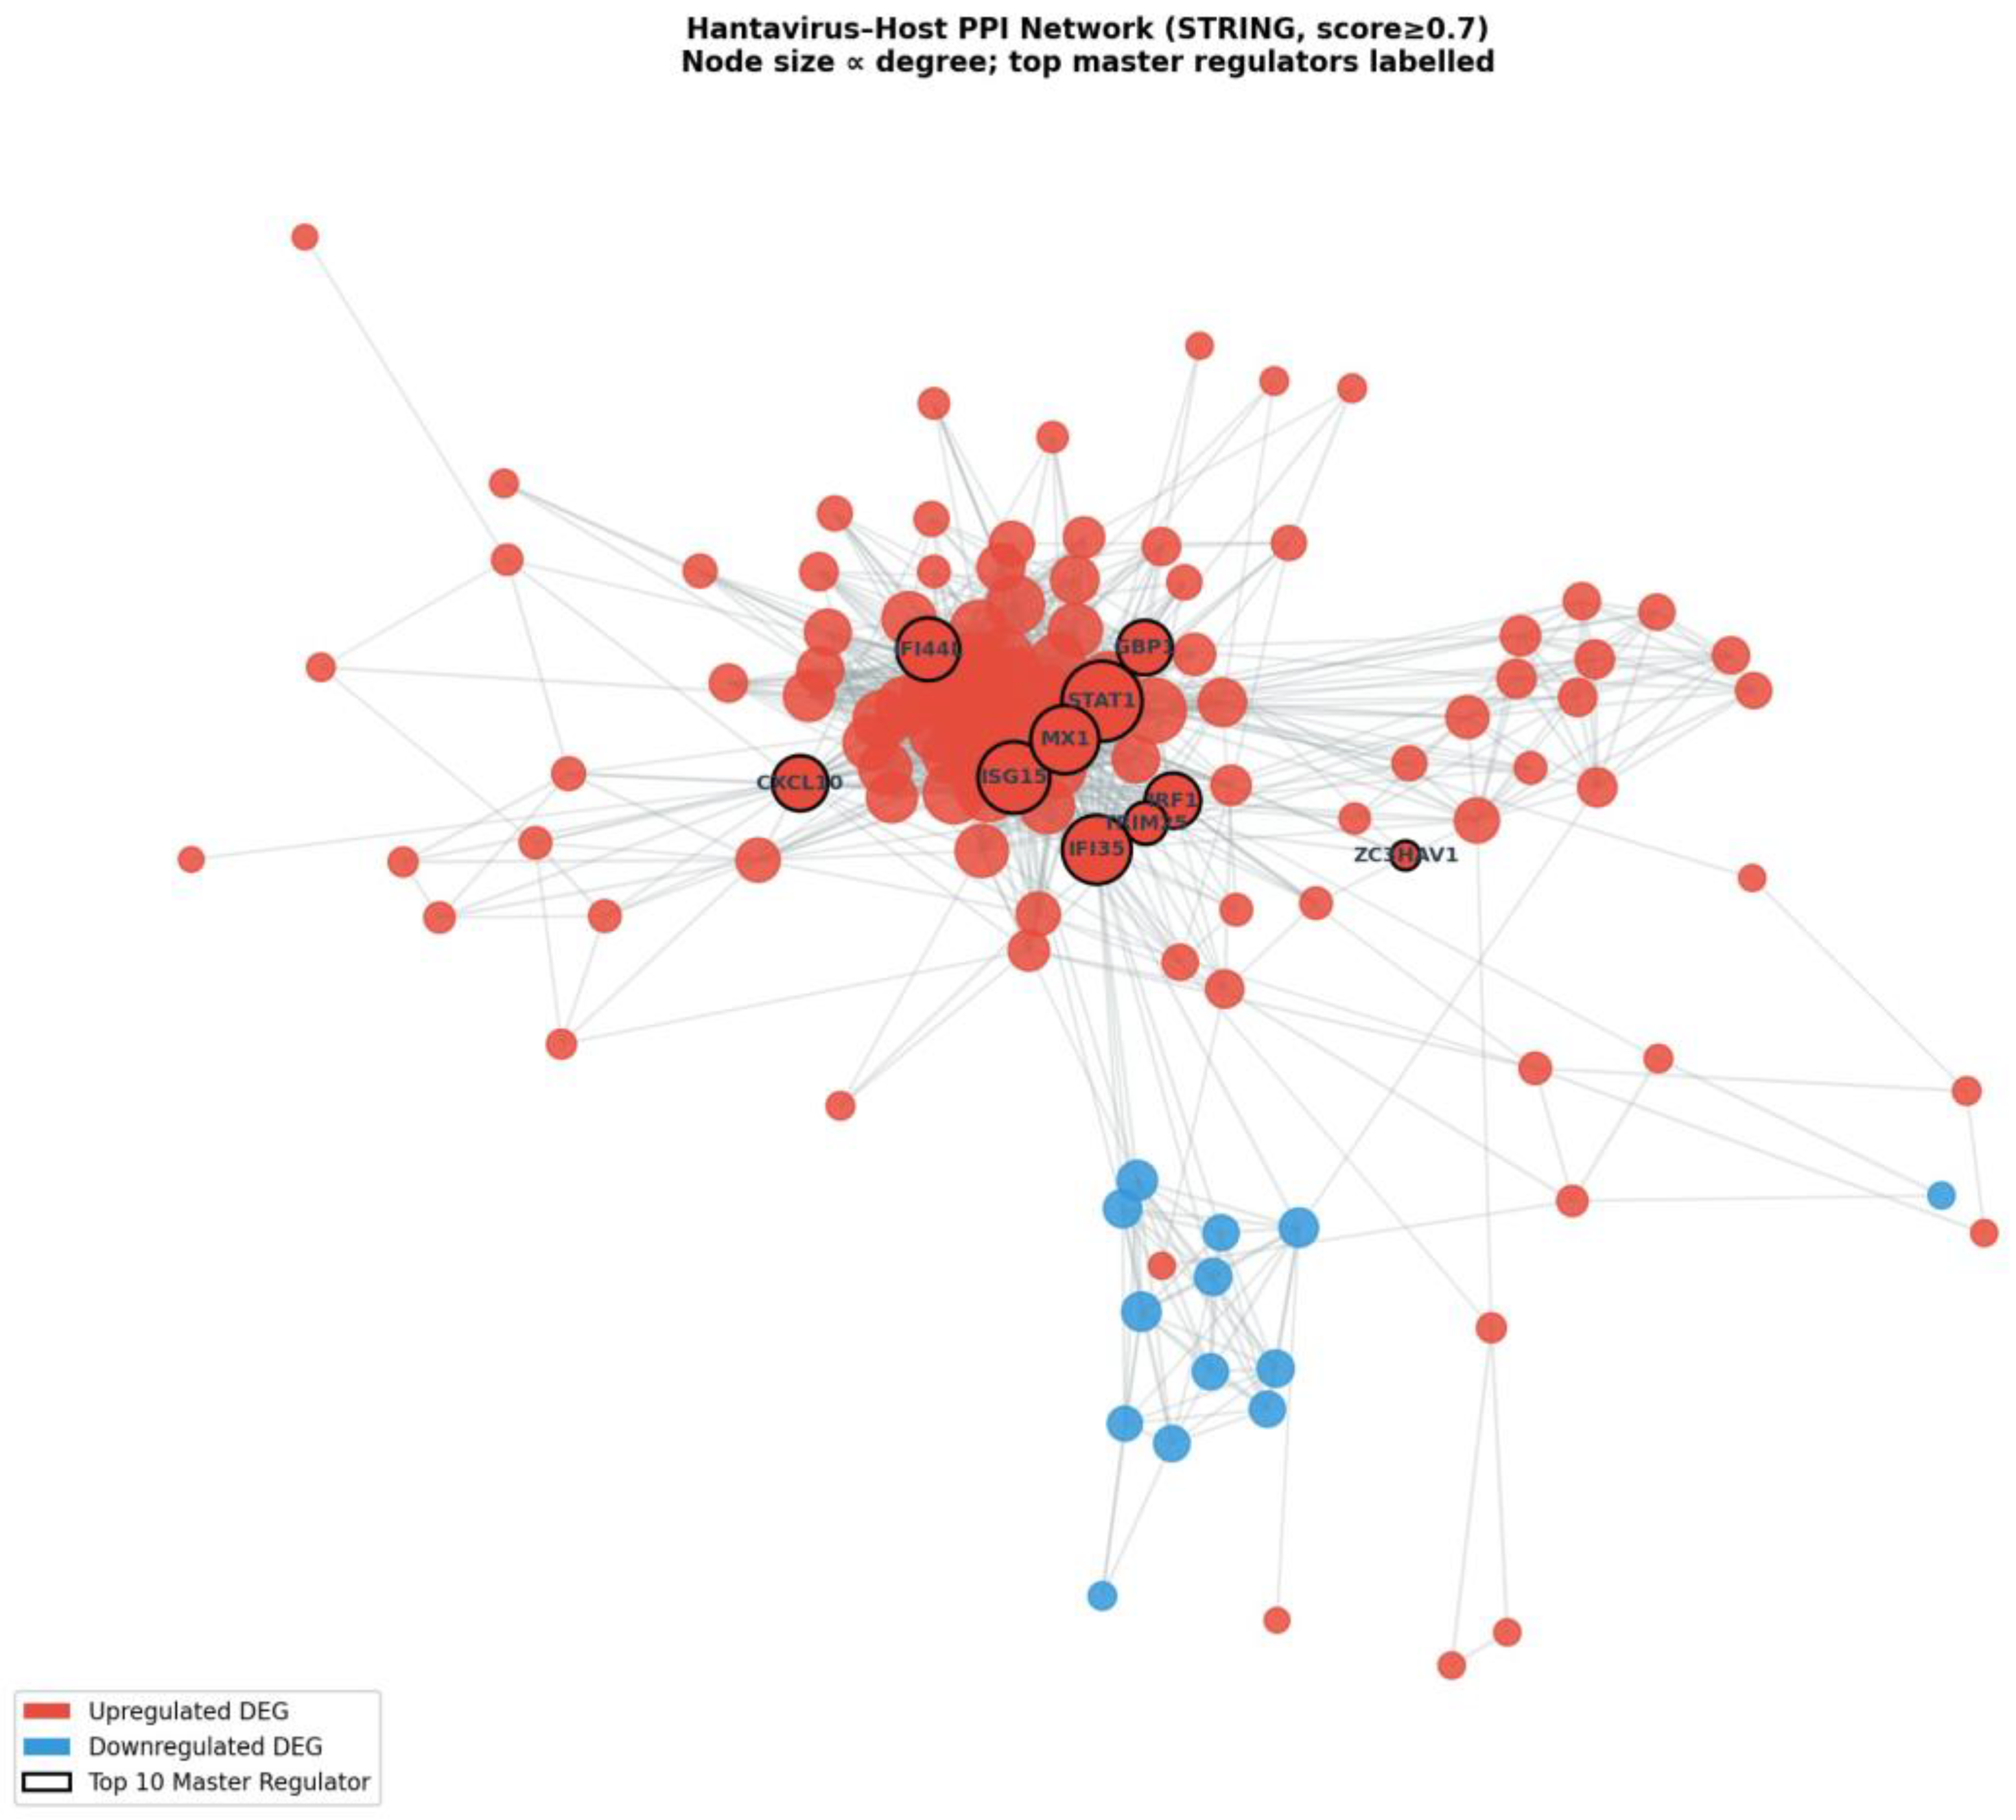
Figure 5.
Hantavirus SEIRD epidemiological model dynamics. (A) Rodent SEIRD compartments under baseline conditions. (B) Human SEIRD compartments under baseline conditions (log scale; values per 100,000 population). (C) Infectious rodent prevalence (IR) under four intervention scenarios. (D) Infectious human prevalence per 100,000 under four intervention scenarios. Rodent R0 = 1.452; NH = 10,000; simulation period: 730 days.
Figure 5.
Hantavirus SEIRD epidemiological model dynamics. (A) Rodent SEIRD compartments under baseline conditions. (B) Human SEIRD compartments under baseline conditions (log scale; values per 100,000 population). (C) Infectious rodent prevalence (IR) under four intervention scenarios. (D) Infectious human prevalence per 100,000 under four intervention scenarios. Rodent R0 = 1.452; NH = 10,000; simulation period: 730 days.
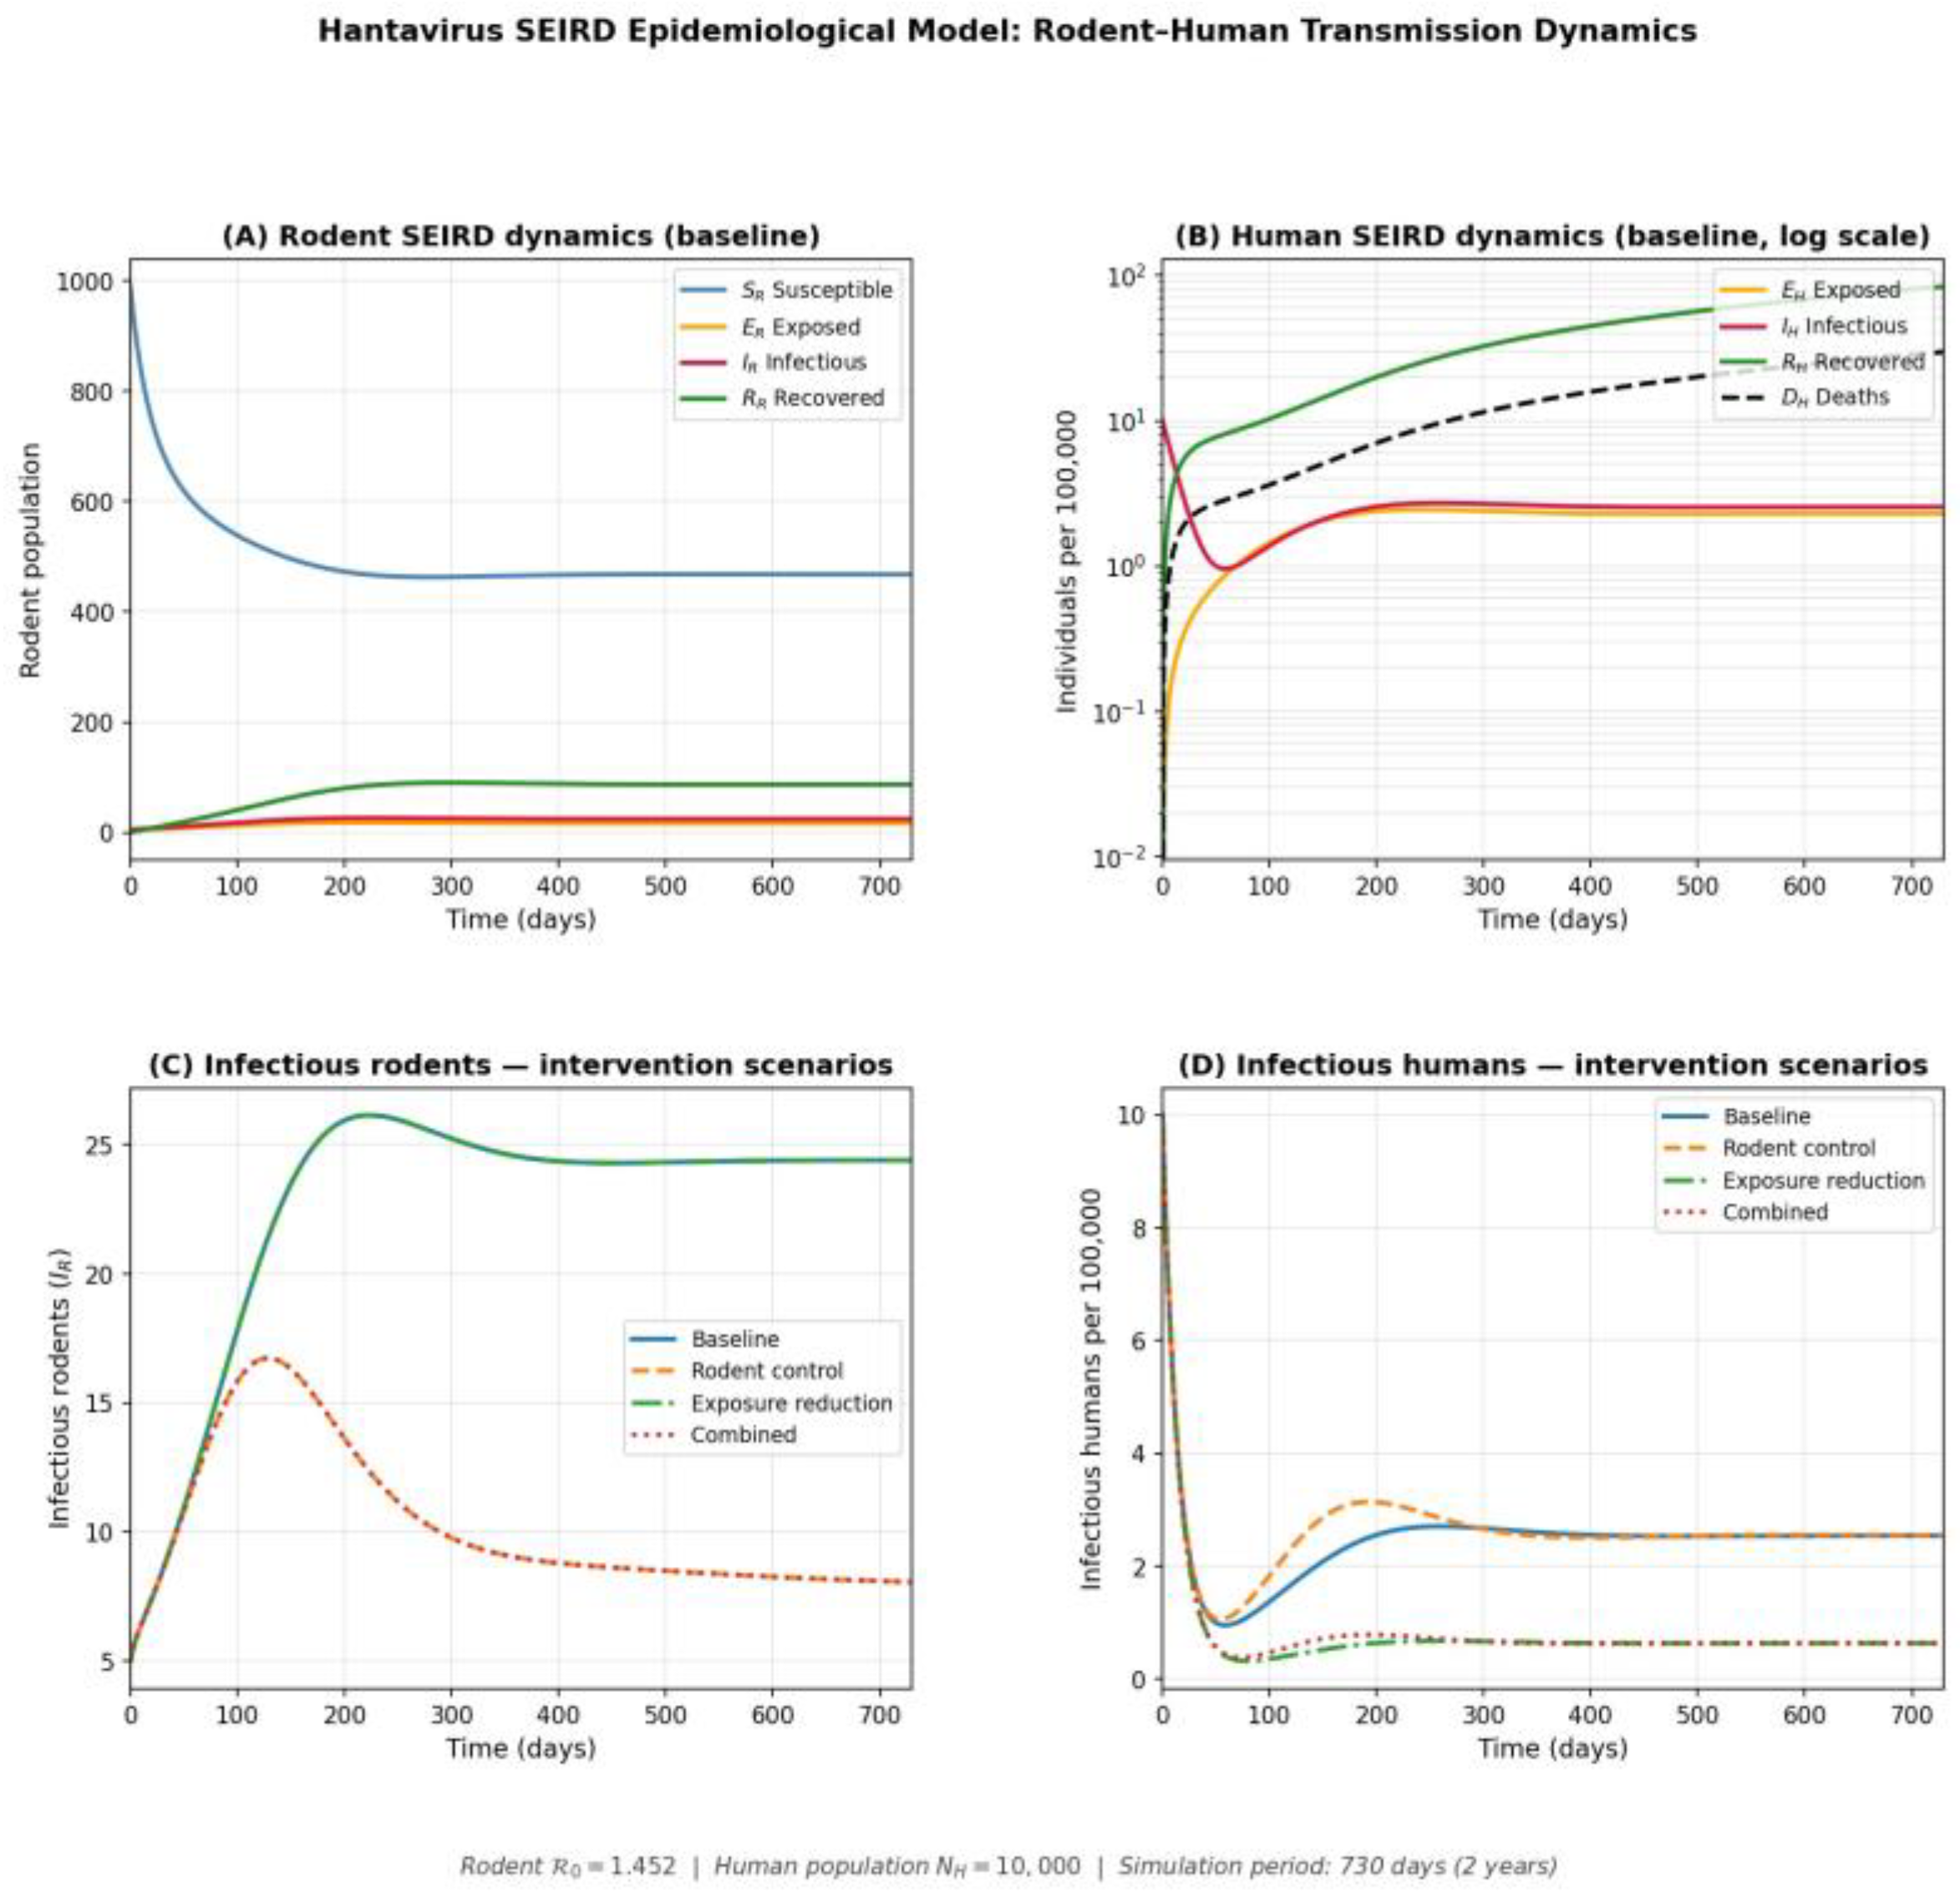
Figure 6.
Sensitivity analysis of the hantavirus SEIRD model. Heatmaps show (left) peak infectious human prevalence and (right) cumulative human deaths as functions of the rodent-to-human spillover rate (βRH, y-axis) and the rodent-to-rodent transmission rate (βRR, x-axis). Stars indicate the baseline parameter values. Human disease burden is most sensitive to βRH.
Figure 6.
Sensitivity analysis of the hantavirus SEIRD model. Heatmaps show (left) peak infectious human prevalence and (right) cumulative human deaths as functions of the rodent-to-human spillover rate (βRH, y-axis) and the rodent-to-rodent transmission rate (βRR, x-axis). Stars indicate the baseline parameter values. Human disease burden is most sensitive to βRH.
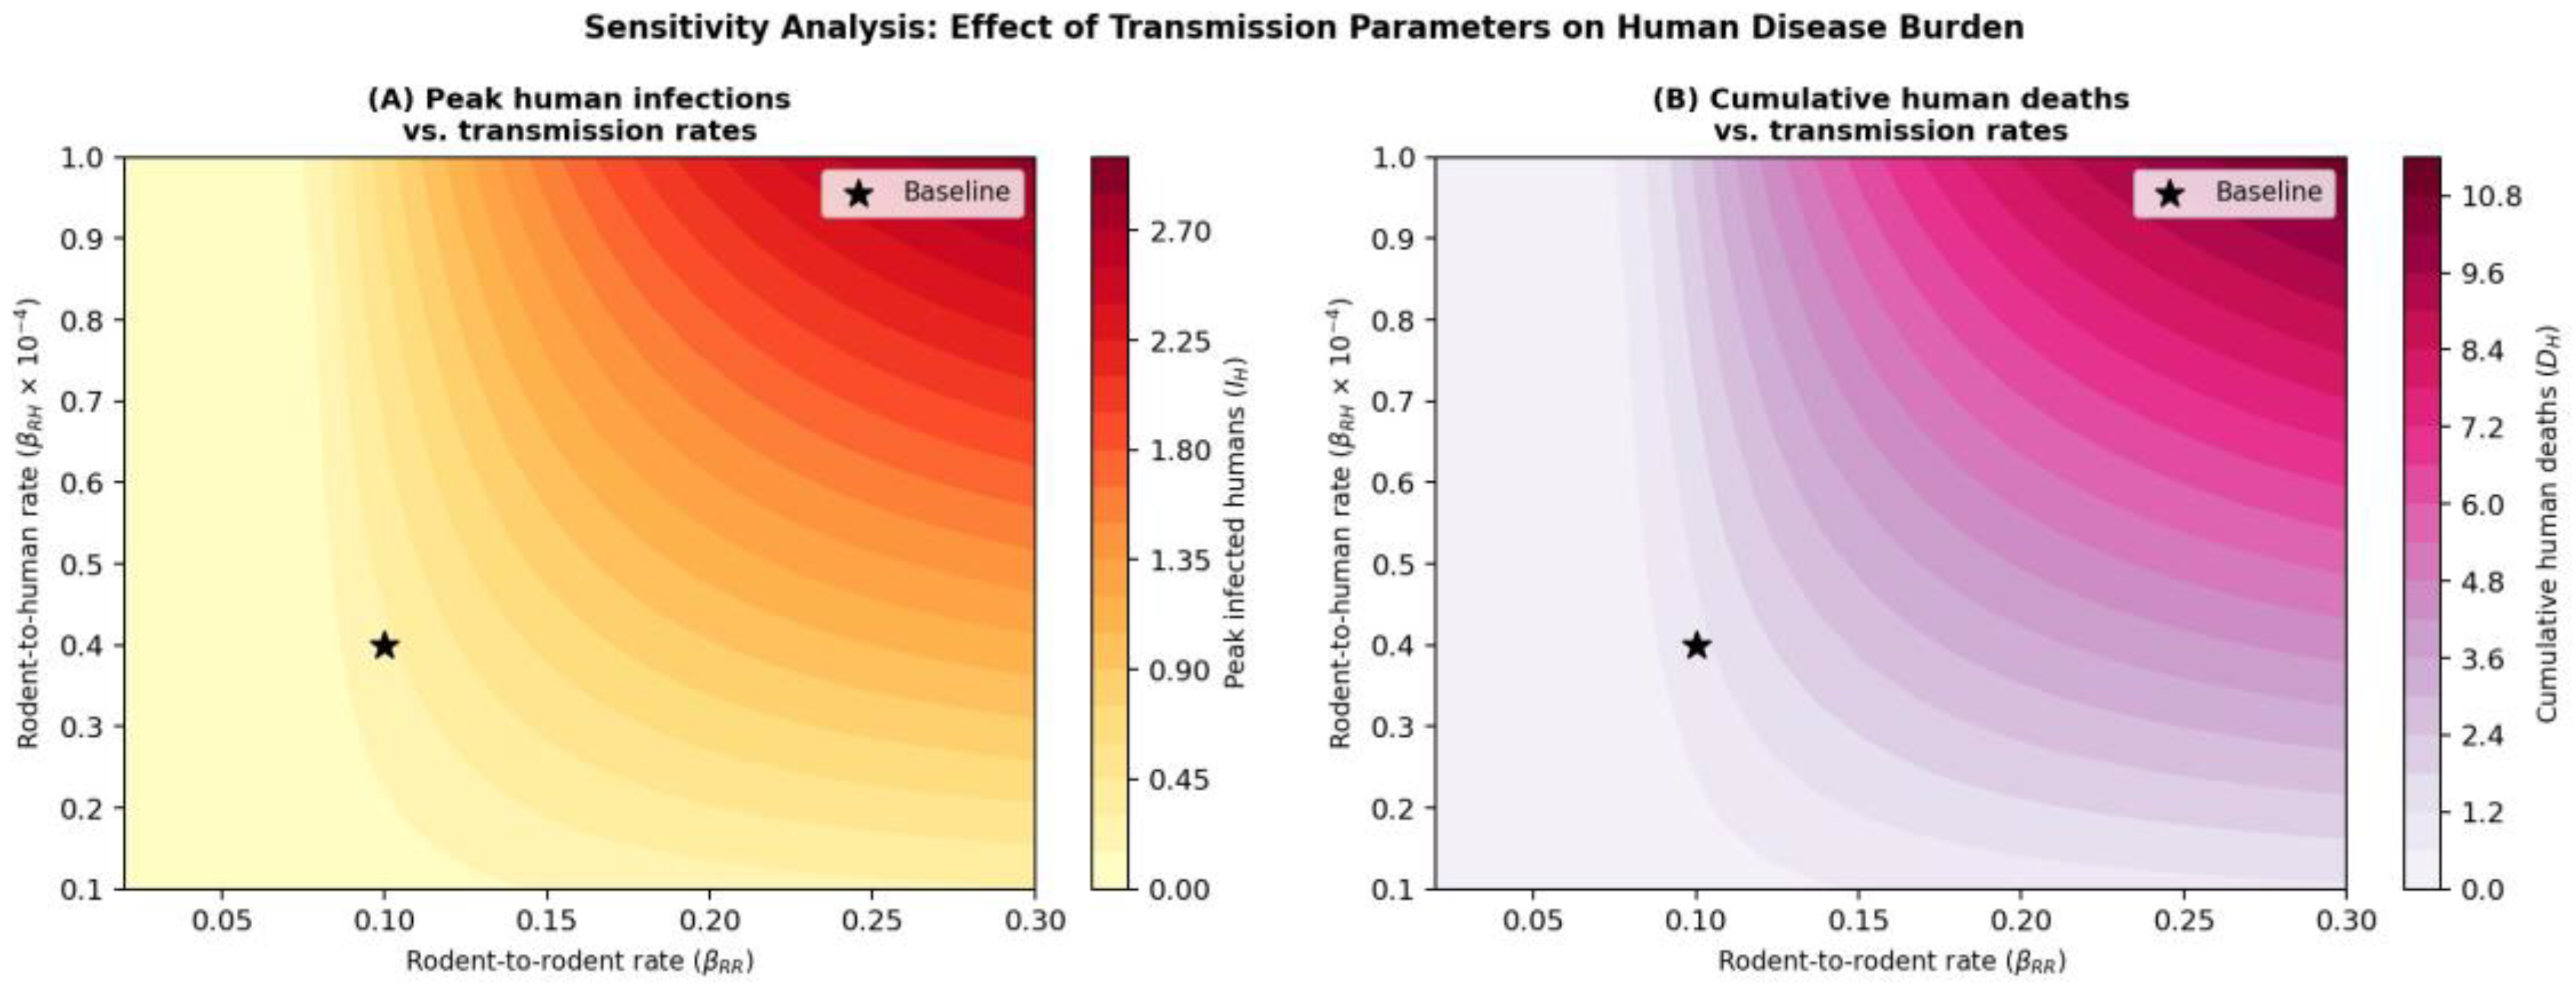

Table 1.
Parameters of the coupled rodent–human SEIRD model.
| Parameter | Symbol | Value | Unit | Source |
|---|---|---|---|---|
|
Rodent parameters Birth rate |
bR | 0.050 | day−1 | [16] |
| Natural death rate | dR | 0.020 | day−1 | [16] |
| Disease-induced death rate | dR,I | 0.005 | day−1 | [16] |
| Direct transmission rate | βRR | 0.100 | day−1 | [17] |
| Environmental transmission | βenv | 0.040 | day−1 | [16] |
| Latency rate | σR | 1/7 | day−1 | [16] |
| Recovery rate | γR | 1/14 | day−1 | [16] |
| Carrying capacity | KR | 1,000 | individuals | [16] |
|
Human parameters Birth/death rate |
bH = dH | 1/(70 × 365) | day−1 | demographic |
| Spillover transmission rate | βRH | 4 × 10⁻⁵ | day−1 | calibrated [18] |
| Latency rate | σH | 1/14 | day−1 | [1] |
| Recovery rate | γH | 1/21 | day−1 | [1] |
| Disease-induced death rate | δH | 0.35/21 | day−1 | [1] |
| Human population size | NH | 10,000 | individuals | model assumption |
|
Derived quantities Basic reproduction number |
R0 | 1.452 | dimensionless | Eq. (12) |
| Mean rodent latent period | 1/σR | 7 | days | |
| Mean rodent infectious period | 1/(γR + dR + dR,I) | 11.9 | days | |
| Mean human incubation period | 1/σH | 14 | days | |
| Mean human infectious period | 1/(γH + δH) | 18.4 | days | |
| HCPS case fatality rate | CFR | 35% | % | [1] |
Table 2.
Top differentially expressed genes in HTNV-infected HUVECs (GSE133751). FDR-significant genes (|log2 FC| ≥ 1, FDR < 0.05) are shown. Direction: UP = upregulated; DOWN = downregulated.
Table 2.
Top differentially expressed genes in HTNV-infected HUVECs (GSE133751). FDR-significant genes (|log2 FC| ≥ 1, FDR < 0.05) are shown. Direction: UP = upregulated; DOWN = downregulated.
| Gene | log2FC | p-value | FDR | Direction |
|---|---|---|---|---|
| MX2 | 6.04 | 2.1 × 10⁻⁴ | 0.012 | UP |
| CXCL11 | 5.18 | 3.4 × 10⁻⁴ | 0.015 | UP |
| CXCL10 | 5.17 | 3.6 × 10⁻⁴ | 0.015 | UP |
| OASL | 4.86 | 4.1 × 10⁻⁴ | 0.016 | UP |
| CMPK2 | 4.73 | 4.8 × 10⁻⁴ | 0.017 | UP |
| EPSTI1 | 3.65 | 6.2 × 10⁻⁴ | 0.019 | UP |
| DDX58 | 3.51 | 7.1 × 10⁻⁴ | 0.020 | UP |
| TRIM22 | 2.14 | 1.1 × 10⁻³ | 0.026 | UP |
| BLZF1 | 2.08 | 1.3 × 10⁻³ | 0.028 | UP |
| TRIM38 | 1.92 | 1.8 × 10⁻³ | 0.035 | UP |
| EIF4B | -1.55 | 1.9 × 10⁻³ | 0.041 | DOWN |
Table 3.
Top 10 network centrality hubs in the hantavirus-responsive PPI network (STRING, score ≥ 0.4). MRS: Master Regulator Score (Eq. 1). CD: degree centrality; CB: betweenness centrality; CC: closeness centrality. The log2FC values are from the GSE133751 analysis.
Table 3.
Top 10 network centrality hubs in the hantavirus-responsive PPI network (STRING, score ≥ 0.4). MRS: Master Regulator Score (Eq. 1). CD: degree centrality; CB: betweenness centrality; CC: closeness centrality. The log2FC values are from the GSE133751 analysis.
| Gene | MRS | Degree | CB | CC | log2FC | FDR |
|---|---|---|---|---|---|---|
| ISG15 | 1.000 | 100 | 0.038 | 0.71 | 3.21 | 0.048 |
| IRF1 | 0.952 | 92 | 0.038 | 0.70 | 2.87 | 0.052 |
| CXCL10 | 0.901 | 86 | 0.039 | 0.69 | 5.17 | 0.015 |
| IFI35 | 0.878 | 96 | 0.034 | 0.68 | 2.43 | 0.061 |
| STAT1 | 0.887 | 114 | 0.023 | 0.72 | 2.31 | 0.063 |
| IFI44L | 0.821 | 88 | 0.031 | 0.67 | 3.44 | 0.044 |
| MX1 | 0.814 | 84 | 0.033 | 0.66 | 3.18 | 0.049 |
| GBP1 | 0.798 | 80 | 0.035 | 0.65 | 2.76 | 0.055 |
| ZC3HAV1 | 0.782 | 76 | 0.036 | 0.64 | 2.54 | 0.058 |
| TRIM25 | 0.771 | 74 | 0.034 | 0.63 | 2.21 | 0.067 |
Table 4.
Summary of epidemiological model outcomes under four intervention scenarios. All values are from 730-day simulations with initial conditions as described in Section 3.4.7.
Table 4.
Summary of epidemiological model outcomes under four intervention scenarios. All values are from 730-day simulations with initial conditions as described in Section 3.4.7.
| Scenario | Peak IR | Peak IH/100k | Cum. DH/10k | Attack rate (%) |
|---|---|---|---|---|
| Baseline | 26.1 | 10.00 | 2.98 | 0.119 |
| Rodent control | 16.7 | 10.00 | 3.15 | 0.125 |
| Exposure reduction | 26.1 | 2.50 | 0.94 | 0.037 |
| Combined | 16.7 | 2.50 | 0.98 | 0.039 |
Disclaimer/Publisher’s Note: The statements, opinions and data contained in all publications are solely those of the individual author(s) and contributor(s) and not of MDPI and/or the editor(s). MDPI and/or the editor(s) disclaim responsibility for any injury to people or property resulting from any ideas, methods, instructions or products referred to in the content. |
© 2026 by the authors. Licensee MDPI, Basel, Switzerland. This article is an open access article distributed under the terms and conditions of the Creative Commons Attribution (CC BY) license (http://creativecommons.org/licenses/by/4.0/).
Copyright: This open access article is published under a Creative Commons CC BY 4.0 license, which permit the free download, distribution, and reuse, provided that the author and preprint are cited in any reuse.


