
Submitted:
12 May 2026
Posted:
13 May 2026
You are already at the latest version
Abstract
This study aimed to analyze the temporal trends and spatial distribution of mortality from malignant central nervous system (CNS) neoplasms in Brazil from 2000 to 2023. An ecological, time-series study using Joinpoint regression for temporal analysis and Global and Local Moran’s I for spatial patterns. Data were retrieved from the Mortality Information System (SIM). A total of 187,551 deaths were recorded. The Average Annual Percent Change (AAPC) showed a significant growth of +2.1% (95% CI: 1.8 – 2.4). However, a significant inflection point was identified in 2013; between 2000–2013, the APC was +4.1% (p < 0.05), becoming non-significant (+0.8%) thereafter, likely reflecting methodological data inconsistencies in the national system. Spatially, high-high clusters were concentrated in the South and Southeast regions (Moran’s I p < 0.05), while the North and Northeast presented low-low clusters, suggesting significant underreporting. While mortality trends appear to increase, they are heavily influenced by regional diagnostic disparities and information system transitions. This is the first nationwide study to integrate spatio-temporal dynamics to highlight these inequities in Brazil.
Keywords:
brain neoplasms
; glioblastoma
; mortality
; spacial analysis
Introduction
Neoplasms affecting the central nervous system (CNS) constitute a relevant segment in the global oncological landscape, although they represent a relatively small fraction, totaling approximately 1.6% of all cancer diagnoses globally [1]. However, the burden of oncological morbidity and mortality imposed by these tumors is disproportionately high, given their aggressive nature and limited survival rates [2]. Among all brain tumors, glioblastoma (GBM) stands out as the most common primary tumor and, at the same time, the most lethal in the brain of adult patients [3,4].
Recent epidemiological data released by GLOBOCAN underscore the seriousness of the situation, estimating more than 308,000 new cases of CNS tumors and 251,000 annual deaths worldwide [1]. Specifically, glioblastoma is the main cause of the most severe outcomes, accounting for approximately 16% of malignant brain neoplasms in the United States and Western Europe [3,6]. The overall survival outlook remains quite limited; despite therapeutic and surgical advances, five-year survival in large international registries is still less than 5% [5,7].
In Brazil, the epidemiological scenario largely follows the international context. Analyses carried out with national data demonstrate a mortality pattern that intensifies from the age of 50, peaking in the age group between 55 and 65 years, with greater involvement in men and a marked heterogeneity among the Federative Units [8]. About 74% of cases in the country occur in patients over 50 years of age, predominantly located in the frontal, parietal and temporal lobes [9].
For this reason, the analysis of these data, even with their limitations, is essential for health planning [10,11]. Despite the remarkable progress achieved in neurosurgical oncology and the adoption of new treatment protocols in Brazil over the past two decades, the survival of patients with glioblastoma has remained practically stagnant [7,13]. The regional differences observed not only reflect inequalities in access to diagnostic technologies but also indicate a persistent barrier to reducing mortality [10]. While previous studies have touched upon cancer mortality, there is a lack of national-level research integrating both long-term temporal trends and spatial autocorrelation to identify risk clusters and data quality gaps in CNS tumors. Therefore, this study aims to analyze the temporal trends and spatial distribution of malignant CNS tumor mortality in Brazil (2000–2023), identifying areas of high risk and potential underreporting to support equitable health policies.
Methods
Type of Study
This is an ecological, population-based study using aggregated mortality data. The unit of analysis is the administrative state (Federative Unit), using temporal, spatial, and spatiotemporal analysis techniques, with central nervous system deaths registered in Brazil from 2000 to 2023 as the unit of analysis.
Study Area and Notification Form
Brazil is divided into five major regions (North, Northeast, Central-West, Southeast, and South) and 27 states (federative units). In 2022, the Brazilian population was estimated at 203,080,756 inhabitants. The distribution is similar across the different regions of Brazil; however, there are significant variations in socioeconomic conditions, health, and access to essential services. The North and Northeast face greater challenges regarding access to specialized healthcare, reflected in distinct indicators of the population affected by central nervous system tumors.
Since 1975, all deaths in the country have been recorded in the Mortality Information System (SIM) of the Ministry of Health. In 1999, the standard Death Certificate (DO) form, completed by a physician, was implemented. Access to the database and the routine for collecting and entering information is public, allowing for detailed analyses in large time series.
Data Source and Variables
All data in this study are public. The sociodemographic characteristics of the deaths, including age, sex, race/color, marital status, education level, and state of residence, were obtained from SIM/DATASUS. Population data and digital cartographic meshes of the states were obtained from the Brazilian Institute of Geography and Statistics (IBGE). Reference populations for each age group, sex, state, and year were obtained via Demographic Censuses (2000, 2010, 2022) and intercensal estimates (2001–2009, 2011–2021).
Study Population
All deaths mentioning glioblastoma as the underlying or associated cause, classified under codes C70 (malignant neoplasm of the meninges), C71 (malignant neoplasm of the brain), and C72 (malignant neoplasm of the spinal cord, cranial nerves, and others) of the 10th Revision of the International Classification of Diseases (ICD-10), residing in any Brazilian state, of both sexes and all ages, from 2000 to 2023, were included.
To ensure precision, we included all deaths where the underlying cause was coded as C70, C71 and C72 according to ICD-10. Although glioblastoma is the most frequent histology, these codes encompass all malignant CNS tumors; thus, the study refers to “Malignant CNS Tumors” for terminological accuracy. Ill-defined deaths were not redistributed to maintain the integrity of the official reported data, allowing for the identification of reporting gaps.
Statistical Analysis
Crude mortality rates (CMR) were calculated using the number of deaths from glioblastoma in the numerator and the reference population, stratified by age group and federative unit, in the denominator, always for the same period analyzed. These rates were also age-standardized using the direct method, using the WHO world standard population as a reference (ASMR).
Spatial distribution was analyzed at the scale of Federative Units (states) to identify regional disparities. We constructed a spatial weight matrix based on the contiguity criterion (Queen matrix), which considers states with shared borders as neighbors. The Global Moran’s I index was calculated to assess the presence of spatial autocorrelation, followed by the Local Indicators of Spatial Association (LISA) to identify statistically significant (p < 0.05) clusters: High-High, Low-Low, High-Low, and Low-High. Mortality rates were age-standardized by the direct method, using the WHO World Standard Population (2000-2025) as the reference to neutralize the confounding effect of demographic aging.
The temporal trends of glioblastoma mortality were analyzed using segmented linear regression through the Joinpoint Regression Program (version 5.0.2). The Annual Percentage Change (APC) and Average Annual Percent Change (AAPC) were calculated with 95% confidence intervals.Population weighting was applied to the APC estimates to account for the variance in mortality rates across different age groups and years.
Software
As análises estatísticas e as tabelas descritivas foram realizadas utilizando o R (versão 4.3.1) e o Excel 365. Os mapas espaciais foram gerados no QGIS (versão 3.32.2) e no GeoDa (versão 1.20) and temporal analysis in Joinpoint Regression Software™ 5.0.2.
Ethical Considerations
Only public, aggregated, and anonymized data were used. There is no possibility of individual identification, thus eliminating the need for informed consent and approval by an Ethics Committee, in accordance with current Brazilian legislation.
Results
Sociodemographic Characteristics of Deaths Associated with Malignant Brain Neoplasm and Temporal Distribution of Mortality
Between 2000 and 2023, Brazil recorded 187,551 deaths from glioblastoma. Most deaths occurred in males (52.1%) and the white population (61.9%). While individuals with 4–7 years of schooling represented the highest absolute frequency (19.7%), a significant portion of the data (25.8%) remains missing for this variable, suggesting socioeconomic reporting disparities (Table 1).
However, throughout the historical series, there was a reduction in mortality from 14.4 to 12.3 deaths per 100,000 women in the 50-59 age group, from 18.1 to 15.1 in the 60-69 age group, and from 30.5 to 25.6 in the 80 years and older age group. Conversely, there was an increase from 0.6 to 1.2 deaths per 100,000 women in the 20-29 age group and from 3.5 to 5.6 deaths per 100,000 women in the 30-39 age group (Figure 1). The analysis by region revealed a large disparity. The highest average ASMRs were recorded in the South ([0.72] per 100,000) and Southeast ([0.65] per 100,000) regions, while the lowest rates were in the North ([0.18]) and Northeast ([0.25]) regions (Figure 1).
A wide and heterogeneous spatial distribution of mortality associated with malignant neoplasms of the central nervous system was observed. Temporal trend analyses for Brazil revealed that the standardized rate (ASMR) showed a growth trend at the beginning of the period (2000–2010), however, it was strongly affected by data inconsistency after 2013. The 2021 rate was 4.61 per 100,000 inhabitants.
The presence of spatial clustering was confirmed by a positive Global Moran’s I index (p < 0.05), indicating that mortality risk is not randomly distributed. LISA (Local Indicators of Spatial Association) mapping identified High-High Clusters statistically significant hot spots in the South (Rio Grande do Sul, Paraná) and Southeast (São Paulo) and Low-Low Clusters cold spots predominantly in the North and Northeast (Acre and Maranhão). The disparity between these regions was formally assessed, showing that the risk of recorded death in the South is nearly four times higher than in the North, a difference that suggests regional underreporting and unequal access to diagnostic neuroimaging rather than purely environmental or genetic factors (Figure 2).
The national Age-Standardized Mortality Rate (ASMR) was calculated at 0.43 per 100,000 inhabitants (WHO standard), a value that reflects the strict glioblastoma coding but may be subject to underreporting in specific regions. Joinpoint regression identified an overall upward trend with an Average Annual Percent Change (AAPC) of +2.1% (95% CI: 1.8 to 2.4; p < 0.001).
Analysis of the inflection points revealed two distinct periods: 2000–2013 with a significant growth trend with an APC of +4.1% (95% CI: 3.8 to 4.5; p < 0.001) and 2014–2023, a period of instability where the trend became statistically non-significant (APC: +0.8%; 95% CI: -0.5 to 2.1; p = 0.200). This post-2013 “instability” is characterized by a high coefficient of variation and likely reflects methodological artifacts, such as updates in the Mortality Information System (SIM) and adjustments in IBGE population estimates after the 2010 Census, rather than a biological shift in disease incidence (Figure 3).
Mortality trends varied significantly by age. The most relevant epidemiological pattern was the marked increase in the elderly population (80+ years) during the first decade (APC: +5.37%; 95% CI: 4.6 to 6.0; p < 0.001), followed by stabilization. In contrast, intermediate age groups (40–59 years) showed a significant decrease in rates after 2012 (e.g., 40–49 years: APC -1.55%; p < 0.001), which may reflect improvements in early diagnosis or, conversely, data inconsistencies in the latter half of the series (Table 2).
Discussion
The investigation revealed significant geographic and chronological trends across various age groups and all Brazilian macro-regions. We identified clusters of high and low glioblastoma mortality, as well as areas of epidemiological transition. Such evidence provides a foundation for the implementation of cost-effective interventions in strategic locations, where mitigating the impact of brain cancer can be achieved more efficiently.
There is a trend of increasing incidence of glioblastoma in various parts of the globe. This upward trajectory is largely attributed to the global demographic transition, a phenomenon that increases life expectancy and, consequently, the median age of the population [5,12]. In parallel, constant improvements in neuroimaging diagnostic methods — in particular, magnetic resonance imaging — and the strengthening of epidemiological surveillance systems also contribute to better detection of cases that may have previously been underreported, especially in middle-income countries [13,14]. In developed nations, such as those in Europe and the USA, age-adjusted incidence rates typically range between 2 and 3 cases per 100,000 inhabitants/year, with the median age at diagnosis being close to 65 years, with a notably higher incidence in males [3,15].
When we performed the Age Standardized Mortality Rate (ASMR) analysis for Brazil as a whole, we observed that the risk of death from Glioblastoma remained stable or showed only a slight increase over the two decades studied, even considering an important methodological challenge in the series. This finding is a clear reflection of the global difficulty in overcoming the lethality inherent in this pathology, even in the face of the advances, albeit limited, that contemporary neuro-oncology has managed to achieve [16,17,18]. In the international scenario, it is understood that the literature has pointed to a stabilization or a slight decline in the incidence of certain CNS tumors in high-income nations, a pattern that countries with the sociodemographic complexity of Brazil do not yet demonstrate uniformly in all their regions [19].
The point of greatest sensitivity in our time series is the abrupt break in rates observed right after 2012–2013. The sudden decline, manifested in both the Crude Mortality Rate (CMR) and ASMR, cannot be attributed solely to a biological factor or a public health intervention that had an immediate impact [20].
Several elements may have influenced the initial decline detected, most notably the consolidation of the Unified Health System (SUS) and the Family Health Strategy, alongside the expansion of diagnostic infrastructure and government support for therapeutic fronts. Conversely, the subsequent rise in mortality rates can be interpreted as a reflection of the evolving accuracy of death notifications in the country [21,22]. The refinement of records within the Mortality Information System (SIM) allowed for a more reliable delimitation of the epidemiological landscape of glioblastoma. Additionally, it is hypothesized that disparities in healthcare access and changes in the population’s exposure profiles may have conditioned the increase in rates observed from 2013 onwards [22].
Our data indicated a significant concentration of deaths among individuals with low levels of education (up to 7 years of schooling), which strongly reinforces the hypothesis of the existence of a socioeconomic gradient influencing mortality from Glioblastoma [23,24]. This pattern is generally explained by the delay in diagnosis, since people with less social and educational capital tend to seek health services in more advanced stages of the disease [25]. In addition, full adherence and complete follow-up of the complex Glioblastoma treatment protocol (which includes surgery, radiotherapy and chemotherapy with temozolomide) are extremely vulnerable to geographical, financial and educational barriers [26].
The high mortality rate in the older population (especially in the 50-69 and over 80 age groups) only confirms the inherent nature of CNS as a disease primarily linked to cellular aging, the accumulation of mutations, and age-related changes in the tumor microenvironment [27,28]. The complexity of therapeutic management in these patients contributes to the high risk of death and shows little sensitivity to temporal variation.
Our spatial analysis demonstrated a well-defined geographic risk pattern, with high mortality hotspots predominantly concentrated in the South and Southeast regions. It is important to understand that the higher Crude Mortality Rate (CMR) observed in these states does not necessarily imply a higher biological incidence. On the contrary, it suggests better completeness in the registration of deaths and a higher density of neuro-oncology reference centers [29]. Wider access to advanced neuroimaging technologies and more precise pathologies has the effect of minimizing underreporting, allowing the true rate of the disease to be reflected in the data [30].
In contrast, the low risk observed in the North and Northeast regions may be a strong indicator of underreporting and under-registration. The scarcity of specialized services in these areas results in late diagnosis or, worse, in the classification of death under unrelated codes (ICD-10: R00-R99, Signs and Symptoms) or as “neoplasms of unspecified site” (C76-C80) [31,32]. The spatial cluster map (LISA), by identifying clusters of low mortality in these regions, is in fact mapping the incompleteness of the health information system, and not a real low prevalence of the disease, which poses a serious problem of equity in access to health.
Furthermore, the scientific literature hypothesizes that specific genetic and environmental factors of populations with greater European ancestry, which is predominant in the South, may somehow contribute to a higher incidence of Glioblastoma [33,34]. More recent studies also explore the possible correlation between exposure to environmental factors, such as pesticides, and the higher incidence of CNS tumors in agricultural regions, although the definitive evidence for Glioblastoma remains inconclusive [35,36].
It is essential to consider some limitations of this work when interpreting the results obtained. Since this investigation falls within the sphere of ecological studies, it is not possible to draw conclusions about the characteristics of the population at the individual level. Certain inferences, established for larger geographic scales, may, in part, originate from the specific behavior of smaller spatial units, which were not the subject of our evaluation. Additionally, it is reasonable to assume that the use of secondary data sources may have resulted in the loss of information, notably due to diagnostic challenges, which potentially led to an underestimation of the results. Finally, regional diversity in the quality and effectiveness of mortality surveillance may have contributed, even if only partially, to the differences in rates that were observed.
To conclude, our findings emphasize the urgency of investments in improving the coding and registration of mortality in the North and Northeast regions, as well as in expanding access to high-complexity neuro-oncological diagnosis and treatment. The conclusions of this research, therefore, should serve as a solid guide for public policies that seek not only to improve information systems, but, above all, to promote greater equity and advances in the clinical outcomes of patients with Glioblastoma throughout Brazil.
Conclusion
Mortality from malignant neoplasm of the brain (Glioblastoma) in Brazil is high and presents an increasingly concentrated risk in the South and Southeast Regions. The findings demonstrate the urgent need to improve the quality of death records in regions with lower apparent risk, as well as the need for public policies focused on improving cancer diagnosis and treatment in these areas. The continued monitoring of glioblastoma trends is fundamental to Brazilian public health.
Author Contributions
All authors contributed to the study conception and design. The first draft of the manuscript was written by Ranya Sthephanie Nascimento Ribeiro, and all authors commented on previous versions of the manuscript. All authors read and approved the final manuscript.
Funding
The authors declare that no specific funding was received for this study.
Institutional Review Board Statement
The study was conducted using secondary, non-identifiable data obtained from the Brazilian Ministry of Health’s public information systems (DATASUS). According to the Brazilian National Health Council (CNS) Resolution No. 510/2016, research involving publicly available data that does not identify subjects is exempt from formal Ethical Committee (CEP/CONEP) approval.
Data Availability Statement
The datasets generated during and/or analyzed during the current study are available in the Department of Health Informatics of the Unified Health System (DATASUS) repository, https://datasus.saude.gov.br/transferencia-de-arquivos/ and Brazilian Institute of Geography and Statistics (IBGE) https://sidra.ibge.gov.br/.
References
- Miranda Filho, A.; Bray, F.; Saracci, R. Cancer incidence and mortality worldwide: sources, methods and major patterns in GLOBOCAN 2020. Int. J. Cancer. 2021, 149, 774–784. [Google Scholar]
- Tan, A.C.; Ashley, D.M.; López-Ginés, C.; Pineda, E.; Alfaro, G.; et al. Management of glioblastoma: state of the art and future perspectives. Ann. Surg. Oncol. 2023, 30, 6299–6309. [Google Scholar]
- Ostrom, Q.T.; Price, M.; Cioffi, G.; High, R.; Waite, K.A.; Kruchko, C.; et al. CBTRUS Statistical Report: Primary Brain and Other Central Nervous System Tumors Diagnosed in the United States, 2017–2021. Neuro-Oncology. 2024, 26, i1–i160. [Google Scholar]
- Louis, D.N.; Perry, A.; Wesseling, P.; Liu, D.; et al. The 2021 WHO Classification of Tumours of the Central Nervous System: a summary. Neuro-Oncology. 2021, 23, 1231–1251. [Google Scholar] [CrossRef]
- Lantos, G.; Zelená, H.; Šmíd, J.; Kučera, R.; Škrha, J.; et al. Global Incidence and Mortality Trends of Glioblastoma from 1990 to 2019: A Joinpoint and Age-Period-Cohort Analysis. Cancers 2023, 15, 1989. [Google Scholar]
- Lathia, J.D.; Liu, L.; Lathia, J.D.; et al. Glioblastoma, The Road Ahead. Trends Mol. Med. 2021, 27, 15–28. [Google Scholar]
- Molinaro, A.M.; Hervey-Jumper, S.L.; et al. Integrated clinical and molecular risk stratification for newly diagnosed glioblastoma. Nat. Commun. 2022, 13, 5007. [Google Scholar]
- Silva, A.A.; Almeida, M.L.; Leal, A.; Costa, S.; et al. Trends in cancer mortality in Brazil: analysis of mortality information system data. Rev. Saude Publica. 2021, 55, 36. [Google Scholar]
- Pinto, T.R.; Pires, A.L.; Silva, T.A.; Pinto, T.R.; et al. Glioblastoma Epidemiology and Survival in Brazil: A Population-Based Study. Clin. Oncol. (R Coll Radiol) 2023, 35, e185–e192. [Google Scholar]
- Malta, D.C.; Oliveira, T.P.; Malta, D.C.; et al. Uso de códigos de causa básica de morte por neoplasia maligna e problemas de qualidade no Brasil, 2000–2019. Rev. Bras. Epidemiol. 2022, 25, e220021. [Google Scholar]
- Paiva, L.; Queiroz, S.; Paiva, L.; et al. Avaliação da qualidade do Sistema de Informações sobre Mortalidade (SIM) em estados do Nordeste do Brasil: uma revisão sistemática. Cien Saude Colet. 2019, 24, 4501–4514. [Google Scholar]
- Westhoff, M.A.; Meyer, T.; Enzenmüller, S.; Schliamser, L.L.; et al. Incidence of glioblastoma in Germany: an analysis of cancer registry data. Eur. J. Cancer. 2020, 126, 104–111. [Google Scholar]
- Diao, W.; Chen, F.; Zhou, B. Trends in the incidence and mortality of central nervous system tumors in the USA from 1999 to 2018. Cancer Manag Res. 2021, 13, 7989–8000. [Google Scholar]
- Smedby, K.E.; Klint, A.; Smedby, K.E.; et al. Temporal trends in incidence of primary tumours of the central nervous system in Sweden, 1990–2015. Eur. J. Cancer. 2019, 114, 1–10. [Google Scholar]
- Karsy, M.; Azab, M.A.; Konakondla, S.; Azab, M.A.; et al. Age, period, and cohort effects on glioblastoma incidence and survival in the United States, 2000–2018. Neuro-Oncology. 2022, 24, 2091–2101. [Google Scholar]
- Borges, L.F.; Costa, L.F.L.; Silva, F.F.; Oliveira, J.C.; Pôças, A.L.; Souza, D.L. Análise da qualidade da informação sobre óbitos por neoplasias no Brasil entre 2009 e 2019. Rev. Bras. Epidemiol. 2022, 25, e220022. [Google Scholar]
- D’Acunto, E.; Gnisci, M.; D’Agostino, G.; Della Mura, M.; Biffi, M.; Fico, F.; et al. Overcoming challenges in glioblastoma treatment: targeting infiltrating cancer cells and harnessing the tumor microenvironment. Front Cell Neurosci. 2023, 17, 1327621. [Google Scholar]
- Wen, P.Y.; Weller, M.; Lee, E.Q.; Alexander, B.M.; Barnholtz-Sloan, J.S.; Barthel, F.P.; et al. Glioblastoma in adults: a Society for Neuro-Oncology (SNO) and European Society of Neuro-Oncology (EANO) consensus review on current management and future directions. Neuro Oncol. 2020, 22, 1073–1113. [Google Scholar] [CrossRef]
- Ostrom, Q.T.; Price, M.; Neff, C.; Cioffi, G.; Waite, K.A.; Kruchko, C.; et al. CBTRUS Statistical Report: Primary Brain and Other Central Nervous System Tumors Diagnosed in the United States in 2016–2020. Neuro Oncol. 2023, 25, iv1–iv107. [Google Scholar] [CrossRef] [PubMed]
- Lima, M.S.; Siqueira, H.F.F.; Moura, A.R. Tendência temporal da mortalidade por câncer em um estado brasileiro com Índice de Desenvolvimento Humano médio (1980–2018). Sci. Rep. 2020, 10, 21384. [Google Scholar] [CrossRef]
- de Souza Sampaio, G.; Rebelo, M.; de Souza-Santos, R.; de Souza, M. Impact of redistributing deaths by ill-defined causes in oral and oropharyngeal cancer mortality in Brazil. J. Oral. Pathol. Med. 2022, 51, 909–915. [Google Scholar]
- Melo, M.S.; Lima, S.V.M.A.; dos Santos, A.D.; et al. Tendências temporais, agrupamentos espaciais e espaço-temporais da mortalidade por câncer de colo do útero no Brasil de 2000 a 2021. Sci. Rep. 2024, 14, 24436. [Google Scholar] [CrossRef]
- Oliveira, N. P. D. D.; Cancela, M. D. C.; Martins, L. F. L.; de Souza, D. L. B. Spatial distribution of advanced stage diagnosis and mortality of breast cancer: Socioeconomic and health service offer inequalities in Brazil. PLoS ONE 2021, 16, e0246333. [Google Scholar] [CrossRef]
- Srinivasan, S.; Zavarella, S.; Dadario, N.B.; Johnson, M.; Kolb, L.; O’Donnell, C.; et al. Racial/ethnic disparities in treatment pattern and time to treatment for adults with glioblastoma in the US. Cancers 2024, 16, 1898. [Google Scholar]
- Guimarães, I.; Adami, F.; Mesquita, M.; Fregnani, J.; Gutierres, E.; Pícoli, A. Treatment delays among women with breast cancer in a low socio-economic status region in Brazil. J. Eval. Clin. Pract. 2018, 24, 1342–1349. [Google Scholar]
- de Almeida, E.; Oliveira, A.; Ferman, S.; de Souza, P.; Meireles, B.; da Silva, R.; et al. Geographic accessibility to cancer treatment in Brazil: A network analysis. Lancet Reg. Health Am. 2022, 5, 100109. [Google Scholar]
- D’Alessio, A.; Proietti, G.; Sica, G.; Scicchitano, S. Glioblastoma in the Elderly: Review of Molecular and Therapeutic Aspects. Int. J. Mol. Sci. 2022, 23, 3076. [Google Scholar]
- Lee-Chang, C.; Miska, J.; Balyasnikova, I.V.; Zhang, P.; Baly, M.; Zannikou, M.; et al. Advanced Age in Humans and Mouse Models of Glioblastoma Show Decreased Survival from Extratumoral Influence. Clin. Cancer Res. 2023, 29, 4973–4987. [Google Scholar] [CrossRef]
- Hora, B. K. S.; Pereira, P. C.; Brito, M. S.; Cedraz, M. E. S.; Neto, H. S. B.; de Melo, A. C. C.; Lima, S. O. Análise espacial e temporal da mortalidade por câncer gástrico no Brasil, 2001 a 2020. Res. Soc. Dev. 2022, 11, e550111436909. [Google Scholar] [CrossRef]
- Wu, B.; Miao, Y.; Bai, Y.; Ye, M.; Xu, Y.; Chen, H.; Qiu, Y. Subgroup economic analysis for glioblastoma in a health resource-limited setting. PLoS ONE 2012, 7, e34588. [Google Scholar] [CrossRef] [PubMed]
- Pinhata, M.M.W.; Almeida, E.; Frias, P.G. GBD 2019 Brazil Garbage Code Collaborators. Distribution of garbage codes in the Mortality Information System, Brazil, 2000 to 2020. J. Health Popul Nutr. 2024, 43, 7. [Google Scholar]
- de Mélo, K. C.; dos Santos, A. G. G.; Amorim, J. R.; de Oliveira Fernandes, T. R. M.; de Souza, C. D. F. Análise temporal da mortalidade por cancer de pele melanona no Brasil: 2000 a 2016. Surg. Cosmet. Dermatol. 2019, 11, 287–294. [Google Scholar] [CrossRef]
- Wang, Y.; Luo, Y.; Liu, J.; Duan, H.; Zhao, Z.; Zhang, C.; et al. Single-Nucleotide Polymorphisms Related to Glioblastoma Risk and Worldwide Epidemiology: A Systematic Review and Meta-Analysis. Mol. Neurobiol. 2025, 62, 500–516. [Google Scholar]
- Ostrom, Q.T.; Bauchet, L.; Davis, F.G.; Deltour, I.; Fisher, J.L.; Langer, C.E.; et al. The epidemiology of glioma in adults: a “state of the science” review. Neuro Oncol. 2014, 16, 896–913. [Google Scholar] [CrossRef]
- Kumar, A.; Sharma, S.; Singh, P.; Kumar, P.; Singh, A.; Singh, P.; et al. A systematic review of pesticide exposure, associated risks, and long-term human health impacts. Env. Sci. Pollut. Res. Int. 2025, 32, 16447–16471. [Google Scholar]
- Kunic, B.; D’Agostino, G.; Fabris, M.; Furlan, M.; Piazzoni, C.; Zanconati, F.; et al. Epidemiology of Glioblastoma Multiforme-Literature Review. Int. J. Mol. Sci. 2022, 23, 5927. [Google Scholar]
Figure 1.
Spatial Distribution of the Crude Mortality Rate (CMR) for Glioblastoma (GBM) in Brazilian Federative Units from 2000 to 2023. The map illustrates the average CMR (per 100,000 inhabitants) in each state, with coloring (gradient) representing the intensity of the rate.
Figure 1.
Spatial Distribution of the Crude Mortality Rate (CMR) for Glioblastoma (GBM) in Brazilian Federative Units from 2000 to 2023. The map illustrates the average CMR (per 100,000 inhabitants) in each state, with coloring (gradient) representing the intensity of the rate.
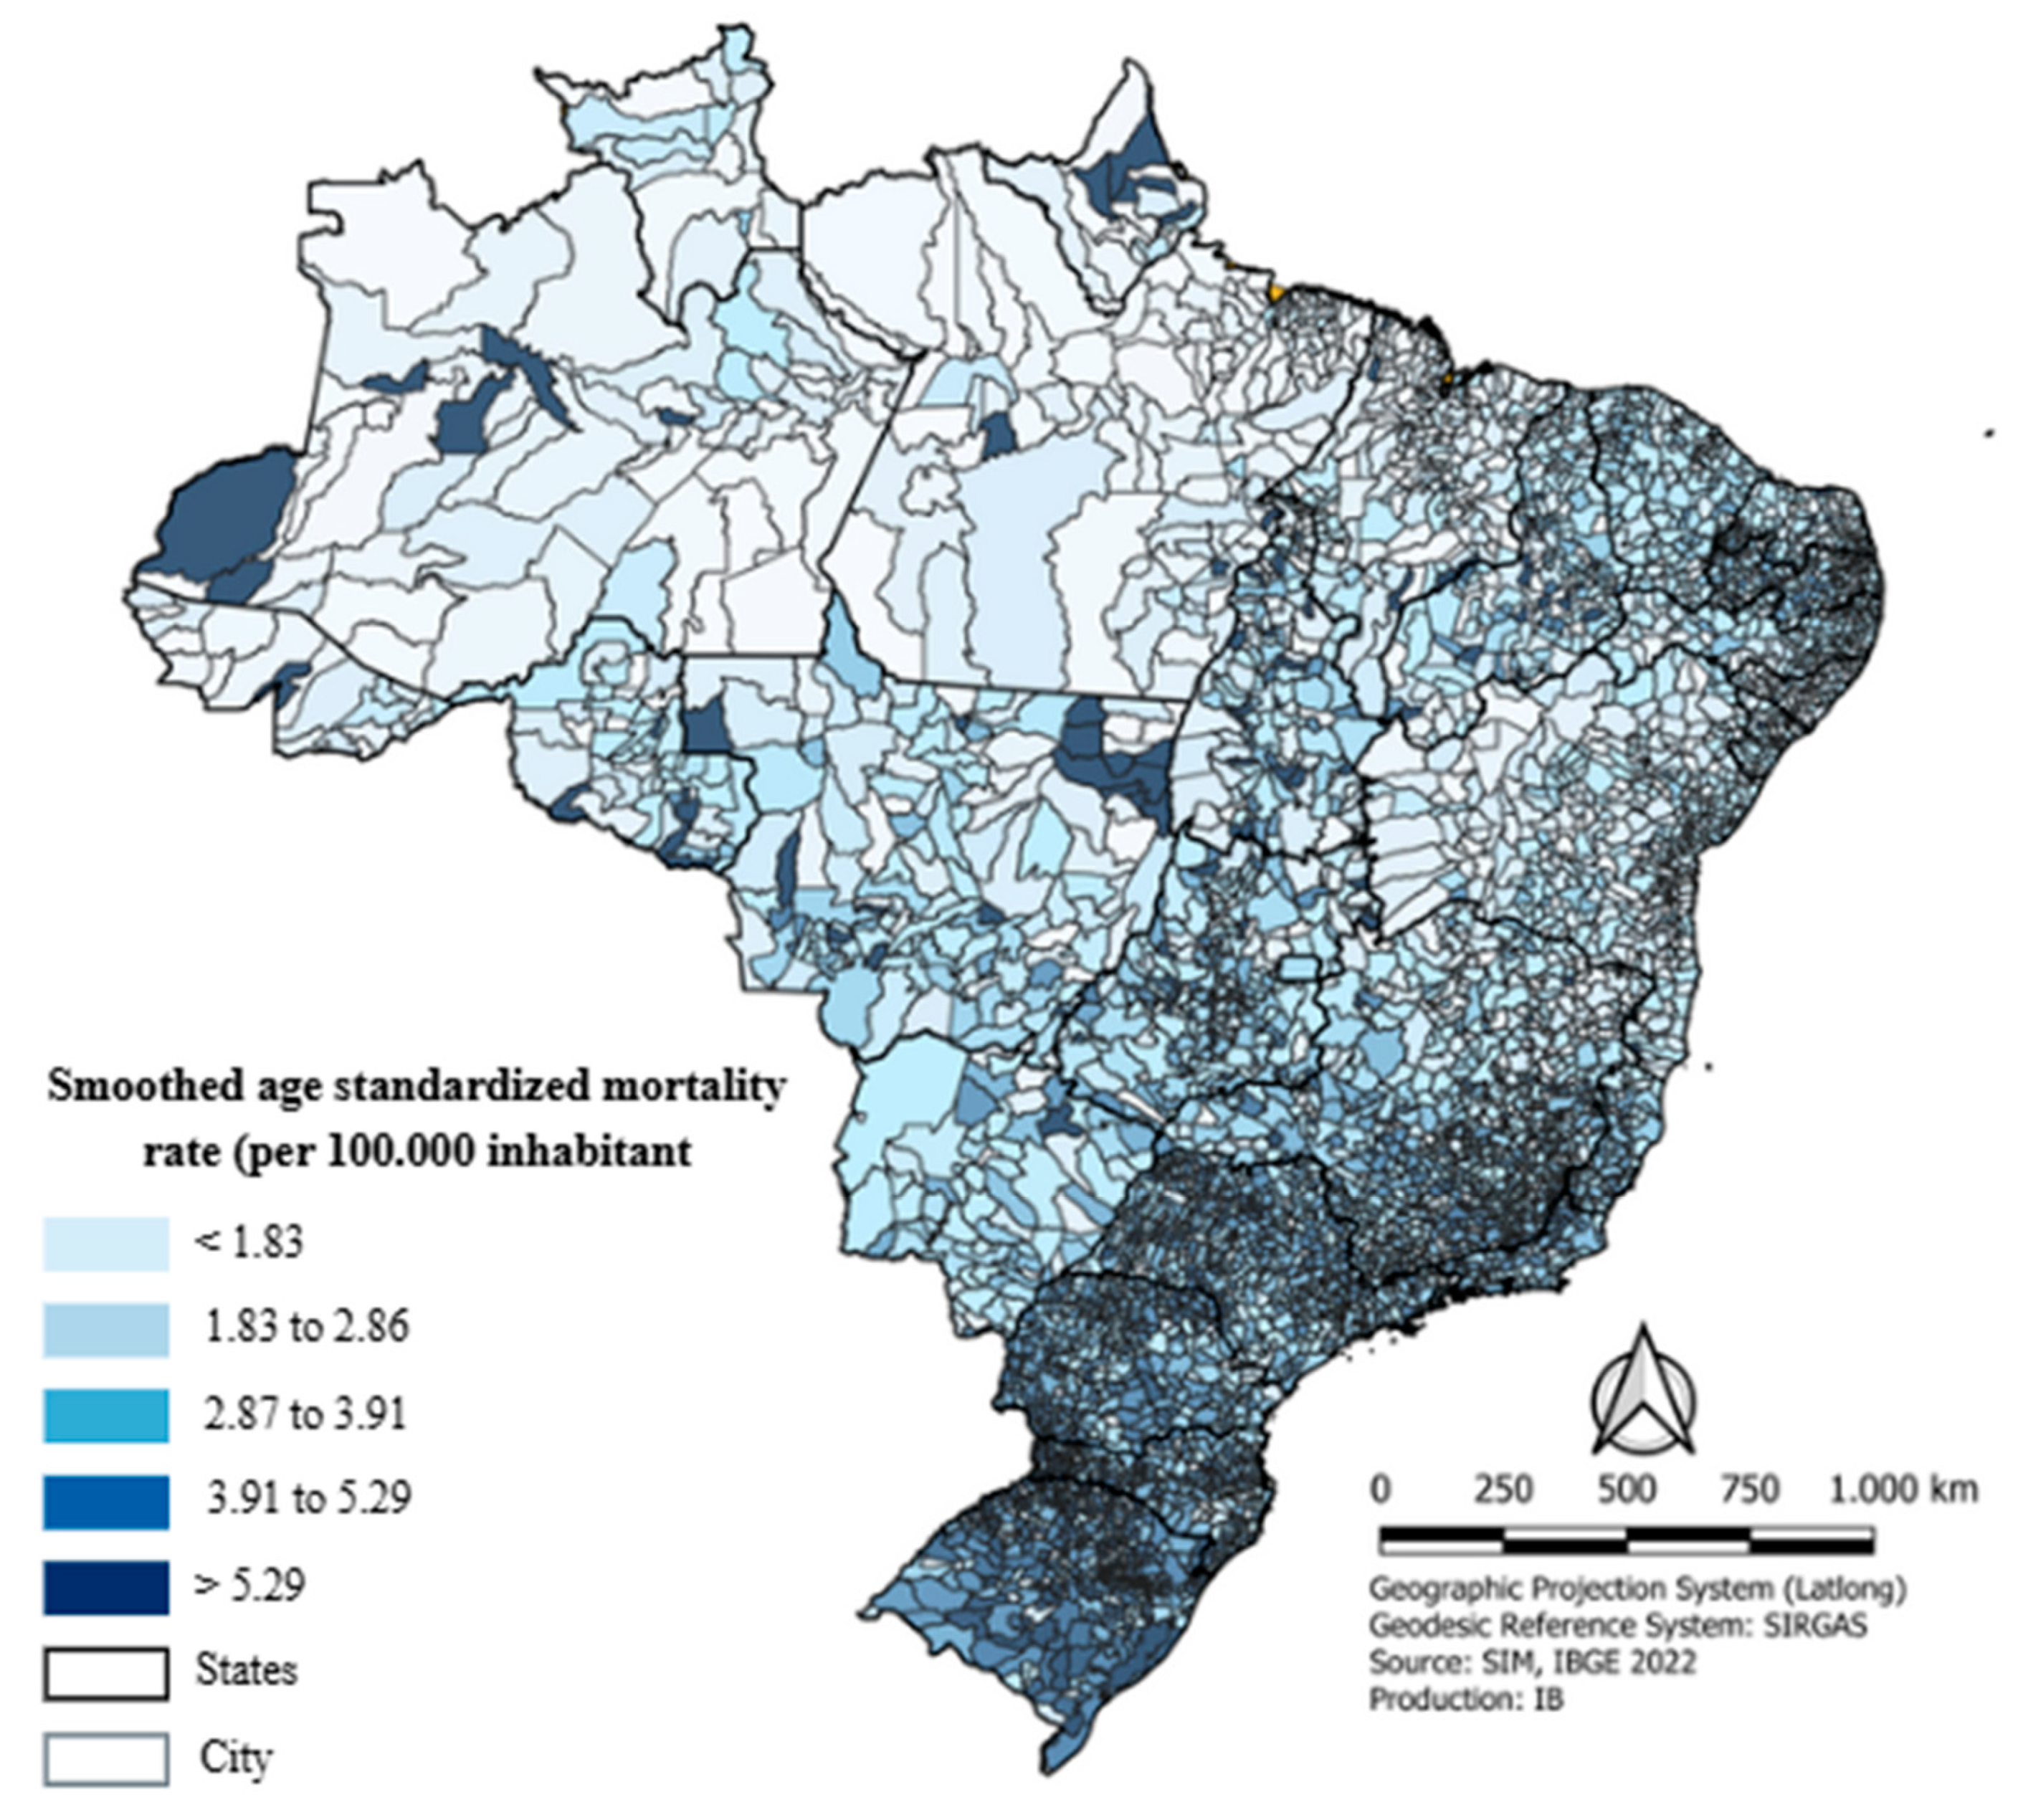
Figure 2.
LISA (Local Indicators of Spatial Association) map of the Crude Mortality Rate (CMR) for Glioblastoma (GBM) in Brazil, 2000–2023. The LISA map identifies statistically significant clusters (p<0.05) of mortality rates. High-High indicates clusters of high CMR, and Low-Low indicates clusters of low CMR.
Figure 2.
LISA (Local Indicators of Spatial Association) map of the Crude Mortality Rate (CMR) for Glioblastoma (GBM) in Brazil, 2000–2023. The LISA map identifies statistically significant clusters (p<0.05) of mortality rates. High-High indicates clusters of high CMR, and Low-Low indicates clusters of low CMR.
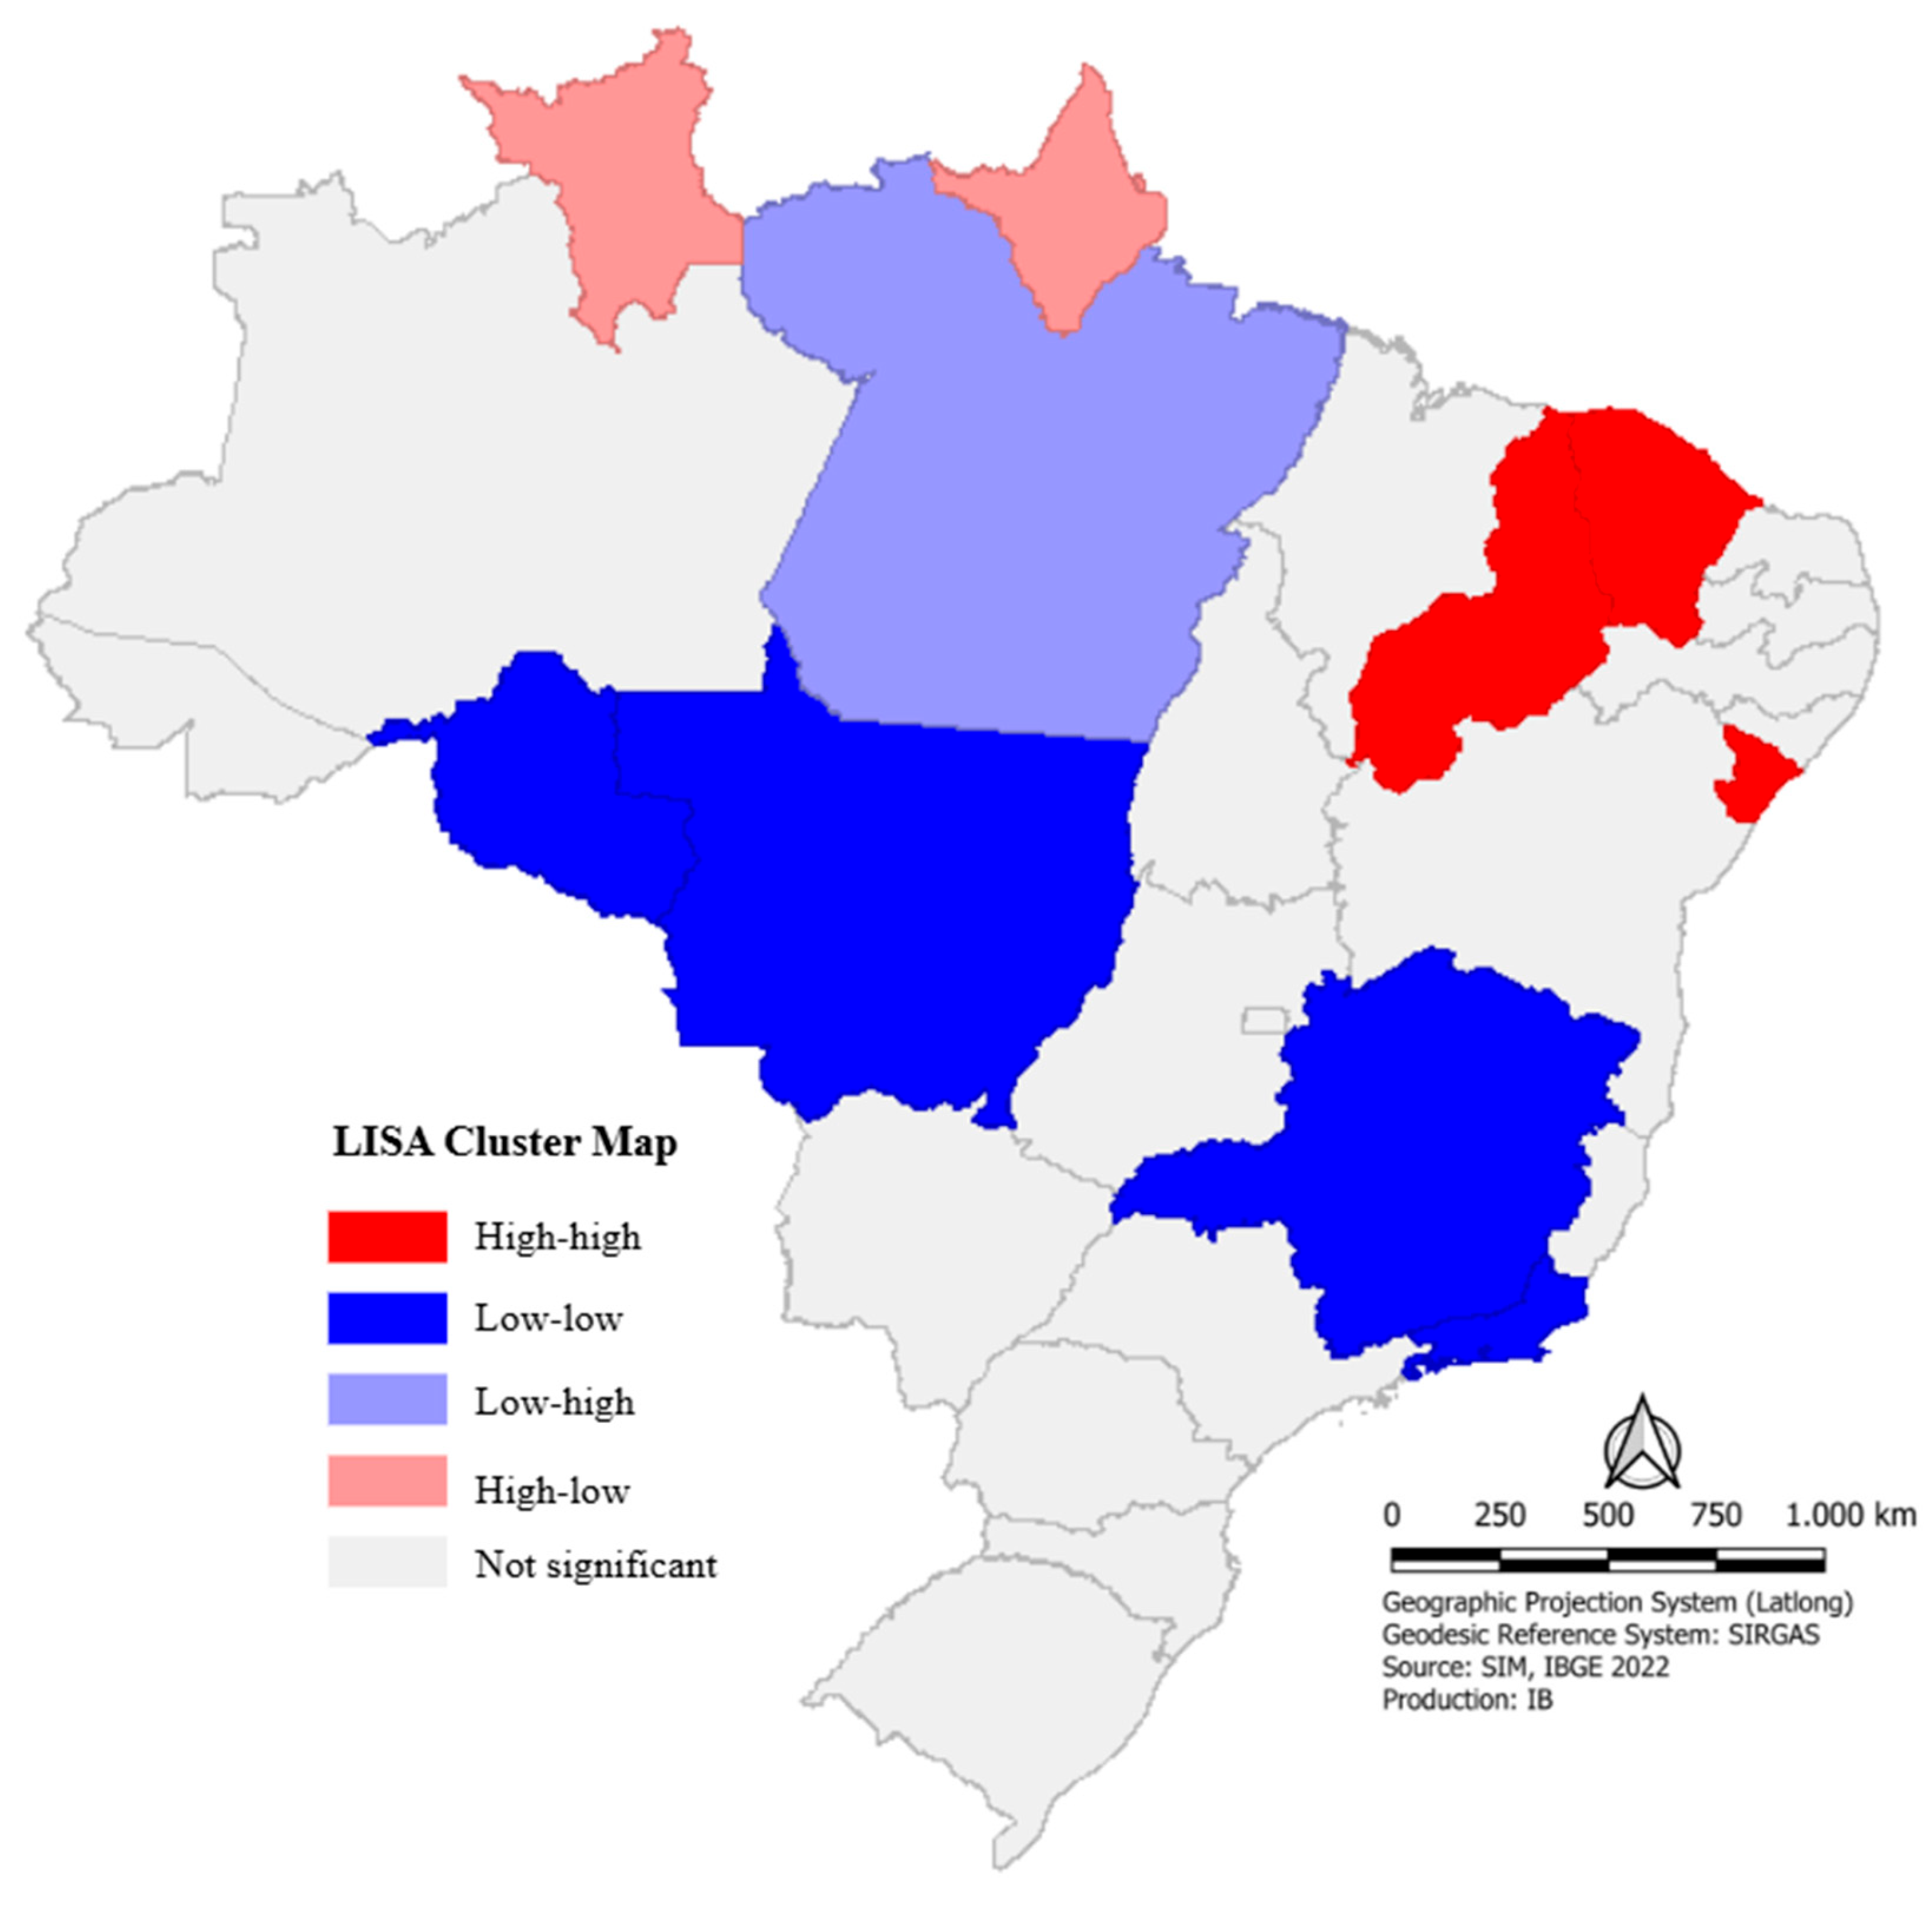
Figure 3.
Temporal Trend of Glioblastoma (GBM) Mortality Rate in Brazil, 2000–2023. The scatter plot shows the observed Annual Mortality Rates (black dots) and the segmented regression line fitted by the Jointpoint software (solid line).
Figure 3.
Temporal Trend of Glioblastoma (GBM) Mortality Rate in Brazil, 2000–2023. The scatter plot shows the observed Annual Mortality Rates (black dots) and the segmented regression line fitted by the Jointpoint software (solid line).
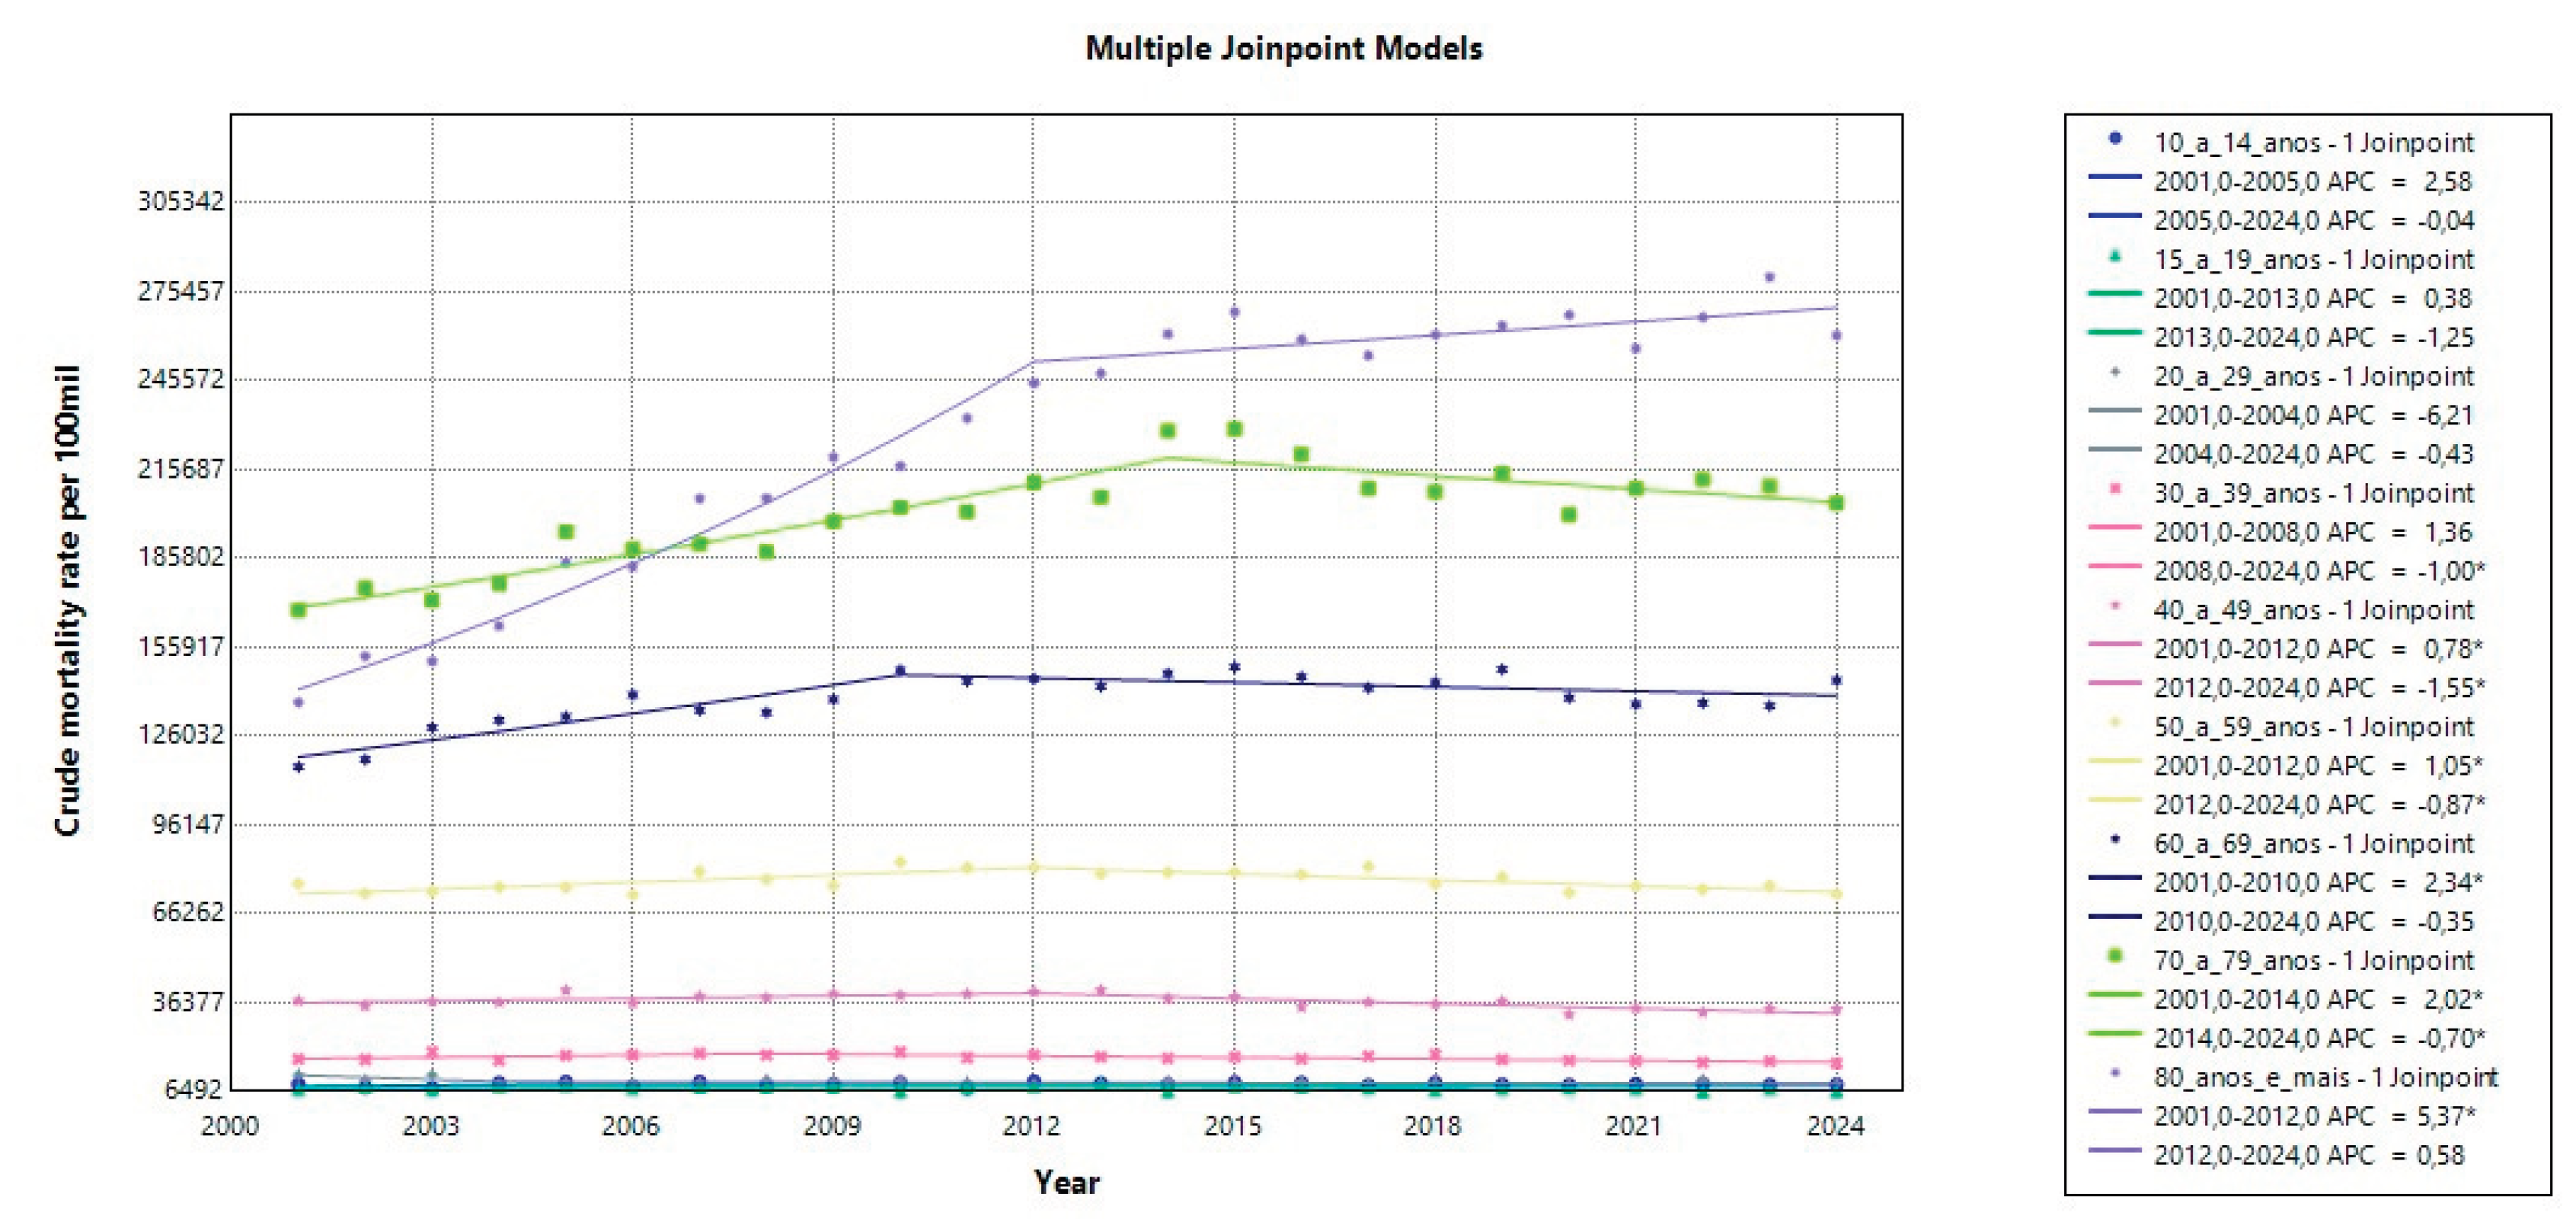

Table 1.
Sociodemographic characteristics of population whose deaths were associated with glioblastoma cancer according to region of residence. Brazil, 2000-2023. No: Absolute frequency. %: Relative frequency.
Table 1.
Sociodemographic characteristics of population whose deaths were associated with glioblastoma cancer according to region of residence. Brazil, 2000-2023. No: Absolute frequency. %: Relative frequency.
| Variables | Brazil (N= 187.551) |
North (N= 8.609) |
Northeast (N= 39.580) |
Southeast (N= 88.351) |
South (N= 37.721) |
Midwest (N= 13.290) |
||||||
|---|---|---|---|---|---|---|---|---|---|---|---|---|
| No | % | No | % | No | % | No | % | No | % | No | % | |
| Age group (years) | ||||||||||||
| < 1 year | 732 | 0.4 | 57 | 0.7 | 199 | 0.5 | 304 | 0.3 | 110 | 0.3 | 62 | 0.5 |
| 1-4 | 3.422 | 1.8 | 261 | 3.0 | 958 | 2.4 | 1.391 | 1.6 | 517 | 1.4 | 295 | 2.2 |
| 5-9 | 4.367 | 2.3 | 322 | 3.7 | 1.202 | 3.0 | 1.780 | 2.0 | 693 | 1.8 | 370 | 2.8 |
| 10-14 | 3.439 | 1.8 | 242 | 2.8 | 974 | 2.5 | 1.412 | 1.6 | 529 | 1.4 | 282 | 2.1 |
| 15-19 | 3.157 | 1.7 | 265 | 3.1 | 869 | 2.2 | 1.250 | 1.4 | 519 | 1.4 | 254 | 1.9 |
| 20-29 | 7.604 | 4.1 | 554 | 6.4 | 2.090 | 5.3 | 3.099 | 3.5 | 1.263 | 3.3 | 598 | 4.5 |
| 30-39 | 13.054 | 7.0 | 841 | 9.8 | 3.277 | 8.3 | 5.649 | 6.4 | 2.235 | 5.9 | 1.052 | 7.9 |
| 40-49 | 22.401 | 11.9 | 1.106 | 12.9 | 5.021 | 12.7 | 10.266 | 11.6 | 4.323 | 11.5 | 1.685 | 12.7 |
| 50-59 | 35.783 | 19.1 | 1.558 | 18.1 | 7.233 | 18.3 | 16.812 | 19.0 | 7.621 | 20.2 | 2.559 | 19.3 |
| 60-69 | 41.925 | 22.4 | 1.612 | 18.7 | 8.040 | 20.3 | 20.456 | 23.2 | 8.954 | 23.7 | 2.863 | 21.6 |
| 70-79 | 33.714 | 18.0 | 1.232 | 14.3 | 6.312 | 16.0 | 16.695 | 18.9 | 7.299 | 19.4 | 2.176 | 16.4 |
| 80 or more | 17.904 | 9.5 | 555 | 6.4 | 3.389 | 8.6 | 9.216 | 10.4 | 3.656 | 9.7 | 1.088 | 8.2 |
| Race/color | ||||||||||||
| White | 116.133 | 65.5 | 2.616 | 31.4 | 12.681 | 35.1 | 60.455 | 72.2 | 33.381 | 91.6 | 7.000 | 54.8 |
| Black | 9.676 | 5.5 | 359 | 4.3 | 2.417 | 6.7 | 5.206 | 6.2 | 1.025 | 2.8 | 669 | 5.2 |
| Brown | 50.563 | 28.5 | 5.237 | 62.9 | 20.857 | 57.7 | 17.544 | 21.0 | 1.924 | 5.3 | 5.001 | 39.2 |
| Yellow | 786 | 0.4 | 33 | 0.4 | 118 | 0.3 | 477 | 0.6 | 103 | 0.3 | 55 | 0.4 |
| Indigenous | 242 | 0.1 | 85 | 1.0 | 58 | 0.2 | 26 | 0.0 | 28 | 0.1 | 45 | 0.4 |
| Marital status | ||||||||||||
| Unmarried | 45.905 | 26.7 | 2.953 | 38.4 | 11.490 | 33.8 | 20.631 | 24.9 | 7.423 | 21.0 | 3.408 | 28.4 |
| Maried/stable union | 83.949 | 48.8 | 3.147 | 40.9 | 15.761 | 46.3 | 40.683 | 49.1 | 18.807 | 53.2 | 5.551 | 46.3 |
| Widow | 26.038 | 15.1 | 782 | 10.2 | 4.289 | 12.6 | 13.421 | 16.2 | 5.901 | 16.7 | 1.645 | 13.7 |
| Divorced | 11.958 | 7.0 | 297 | 3.9 | 1.389 | 4.1 | 6.778 | 8.2 | 2.477 | 7.0 | 1.017 | 8.5 |
| Others | 4.138 | 2.4 | 517 | 6.7 | 1.113 | 3.3 | 1.356 | 1.6 | 776 | 2.2 | 376 | 3.1 |
| Schooling | ||||||||||||
| None | 16.232 | 11.7 | 1.078 | 15.3 | 5.660 | 20.9 | 5.745 | 8.8 | 2.398 | 8.2 | 1.351 | 13.2 |
| 1 to 3 years | 35.573 | 25.6 | 1.780 | 25.3 | 7.343 | 27.1 | 16.320 | 24.9 | 7.703 | 26.3 | 2.427 | 23.7 |
| 4 to 7 years | 37.077 | 26.6 | 1.795 | 25.5 | 6.022 | 22.2 | 17.149 | 26.2 | 9.393 | 32.1 | 2.718 | 26.5 |
| 8 to 11 years | 31.954 | 23.0 | 1.744 | 24.8 | 5.384 | 19.9 | 16.026 | 24.5 | 6.459 | 22.0 | 2.341 | 22.8 |
| 12 years or more | 18.307 | 13.2 | 647 | 9.2 | 2.713 | 10.0 | 10.187 | 15.6 | 3.345 | 11.4 | 1.415 | 13.8 |
Table 2.
Glioblastoma (GBM) Mortality Rate in Brazil, Age-Adjusted Rate (ASMR), and Temporal Trend (APC/AAPC) by Age Group from 2000 to 2023.
Table 2.
Glioblastoma (GBM) Mortality Rate in Brazil, Age-Adjusted Rate (ASMR), and Temporal Trend (APC/AAPC) by Age Group from 2000 to 2023.
| Variables | Segmented period | |||
|---|---|---|---|---|
| Period | APC (95% CI) | Trend | Prob > |t| | |
| Age group in years | ||||
| 10 to 14 | 2001 to 2005 | 2,5 (-4,1 to 9,8) | Stable | 0,444535 |
| 2005 to 2024 | -0,03 (-0,6 to 0,6) | Stable | 0,904066 | |
| 15 to 19 | 2001 to 2013 | 0,38 (-0,8 to 1,6) | Stable | 0,540176 |
| 2013 to 2025 | -1,24 (-2,6 to 0,19) | Stable | 0,086041 | |
| 20 to 29 | 2001 to 2004 | -6,2 (-14,8 to 3,3) | Stable | 0,181406 |
| 2004 to 2024 | -0,4 (-0,9 to 0,1) | Stable | 0,107658 | |
| 30 to 39 | 2001 to 2008 | 1,36 (-0,04 to 6,0) | Stable | 0,058388 |
| 2008 to 2024 | -1,0 (-2,2 to -0,5) | Decreasing | 0,001600 | |
| 40 a 49 | 2001 to 2012 | 0,78 (0,09 to 1,9) | Increasing | 0,026395 |
| 2012 to 2024 | -1,55 (-2,5 to -0,9) | Decreasing | < 0,000001 | |
| 50 to 59 | 2001 to 2012 | 1,05 (0,5 to 1,8) | Increasing | < 0,000001 |
| 2012 to 2024 | -0,87 (-1,5 to -0,4) | Decreasing | 0,000400 | |
| 60 to 69 | 2001 to 2010 | 2,34 (1,5 to 3,1) | Increasing | 0,000010 |
| 2010 to 2024 | -0,34 (-0,7 to 0,07) | Stable | 0,098607 | |
| 70 to 79 | 2001 to 2014 | 2,02 (1,5 to 2,6) | Increasing | < 0,000001 |
| 2014 to 2024 | -0,69 (-1,6 to -0,01) | Decreasing | 0,045991 | |
| 80 or more | 2001 to 2012 | 5,37 (4,6 to 6,0) | Increasing | < 0,000001 |
| 2012 to 2024 | 0,57 (-0,003 to 1,16) | Stable | 0,051190 | |
Disclaimer/Publisher’s Note: The statements, opinions and data contained in all publications are solely those of the individual author(s) and contributor(s) and not of MDPI and/or the editor(s). MDPI and/or the editor(s) disclaim responsibility for any injury to people or property resulting from any ideas, methods, instructions or products referred to in the content. |
© 2026 by the authors. Licensee MDPI, Basel, Switzerland. This article is an open access article distributed under the terms and conditions of the Creative Commons Attribution (CC BY) license.
Copyright: This open access article is published under a Creative Commons CC BY 4.0 license, which permit the free download, distribution, and reuse, provided that the author and preprint are cited in any reuse.