
Submitted:
14 July 2026
Posted:
15 July 2026
You are already at the latest version
Abstract
Background/Objectives: Successful endodontic treatment depends on preserving sufficient radicular dentine during canal instrumentation to prevent complications such as perforations during cleaning and shaping. Mandibular first molars are particularly susceptible due to their complex root morphology and the presence of “danger zones,” especially within the mesial root. Data on dentine thicknesses for South African populations remain limited. Methods: This cross-sectional descriptive study evaluated micro-computed tomography scans of 77 mandibular first molars obtained from 45 Black South African individuals. A novel software program was used to generate orthogonal virtual sections along the entire root length adapting to its curved axis, enabling automated dentine thickness measurements at 0.1 mm intervals. Statistical analyses were performed to assess variations according to root surface, root level, sex, side, and age. Results: The mesial root consistently demonstrated thinner dentinal walls than the distal root, with the distal aspect of the mesial root representing the thinnest region. Progressive tapering of dentine thickness toward the apical third was observed in both roots. Buccal and lingual surfaces remained significantly thicker than mesial and distal surfaces in the coronal and middle thirds (p < 0.05). No statistically significant differences were identified between left and right molars, between sexes, or in relation to age. Conclusions: This study provides comprehensive three-dimensional baseline data on mandibular first molar dentine thickness in a Black South African sample to highlight clinically relevant areas of reduced dentine thickness. Thinner dentine thicknesses were reported in this study using micro-CT scans and a novel software program compared to the literature, emphasizing the need for increased clinical caution.
Keywords:
danger zone
; safety zone
; mesial root
; distal root
; raycasting
; surface-to-interface thickness
1. Introduction
Endodontic treatment success depends on multiple factors, including avoiding procedural complications such as perforations (pathological communications between the root canal and surrounding periodontium) which can arise during access preparation or canal instrumentation, particularly in areas of thin dentine known as “danger zones” [1,2,3,4]. As first molars, in general, are frequently treated endodontically due to their early eruption, complex occlusal anatomy, and susceptibility to caries [5,6], assessment of dentine thickness is particularly important in these teeth to minimize endodontic complications and preserve tooth strength.
While the maxillary first molar is often noted for its three-root complexity [7], the mandibular first molar presents a distinct set of anatomical challenges, primarily within its mesial root system. This root frequently contains two separate canals namely the mesiobuccal and mesiolingual canals, often connected by a narrow isthmus [8,9]. The external morphology of the mesial root is typically characterized by a 'figure-eight' cross-section, featuring a deep longitudinal developmental depression on its distal aspect [10]. This concave area creates a primary “danger zone” where the radicular dentine is characteristically thinner, leaving a narrow margin of safety for mechanical instrumentation [6,11]. Failure to account for this specific concavity significantly increases the risk of strip perforations, particularly in the middle and apical thirds where the root structure begins to taper.
Root canals are typically irregular in shape, often flattened rather than circular, which may result in perforation when removal of dentine is made in multiple directions during cleaning and shaping [12,13,14]. While knowledge of dentinal thickness in all directions is therefore crucial for the operator to minimize procedural risks, particularly since dentine tapers from coronal to apical regions, it also dictates instrument design and taper which influence the extent of dentine removal [15]. Since previous studies have often focused on specific roots or regions, such as only the mesial root of mandibular molars and typically examined only the first 7 mm below the furcation [6,16,17,18,19], this study set out to expand on prior work by measuring all sides of all roots in mandibular first molars along the full root length.
Historically, quantifying dentine thickness has relied on manual two-dimensional (2D) measurements derived from three-dimensional (3D) datasets [20]. However, such methods are often limited when applied to the naturally curved trajectories of mandibular roots [21]. Traditional cross-sections are not likely to be generated orthogonally to the local axis of the root, leading to oblique measurement errors that may misrepresent the actual surface-to-interface thickness [22,23]. To address these inaccuracies, this study utilizes a computational approach that generates adaptive virtual sections on micro-CT scans described by Meyer et al. (2026) [23]. By calculating a precise centerline that follows the root’s curvature, the software ensures that every thickness measurement is taken perpendicular to the surface. The raycasting technique used allows for a high-resolution, automated analysis of the entire root length, moving beyond the 7 mm limit of previous literature to provide a comprehensive map of structural tapering [23].
While dentinal thickness and canal morphology have been evaluated in various populations around the world [6,16,17,18,19], there is a distinct lack of data regarding South African populations. By using a novel software program to generate orthogonal sections to the central axis along the entire root canal in multiple directions on micro-CT scans, this study aims to provide clinicians with essential population-specific data regarding root dentine thicknesses of mandibular first molars for more precise preoperative planning and optimized treatment strategies. Ultimately, these findings aim to guide the design of instruments and clinical techniques tailored to preserve the maximum amount of tooth structure and improve endodontic outcomes within this population.
2. Materials and Methods
In this cross-sectional, descriptive, quantitative study, micro-CT scans of 77 mandibular first molars from 45 individuals (25 males (between ages 23 – 87 years) and 20 females (between 22 – 66 years)) were analyzed. Where possible, left and right first molars from the same individual were included. The scans were retrospectively obtained from the dry skeletal collections of the Anatomy Departments of two universities in Gauteng Province, South Africa [24].
Ethical approval for the study, titled “Evaluation of dentinal thickness in first molars of a South African sample”, was granted by the School of Medicine Research Committee (SREC) and the Ethics Committee (SMUREC) of Sefako Makgatho Health Sciences University (SMUREC/M/443/2024:PG) (13 February 2025 – 12 March 2027). The study complied with institutional and international ethical standards for research involving human participants. All micro-CT scans were anonymized, and any information that could identify individuals was removed prior to storage. The anonymized dataset will be retained as part of the Sefako Makgatho Health Sciences University scan collection (smu.ac.za) for a minimum of 15 years.
A convenience sampling method was utilized, and inclusion was based on scan availability. Exclusion criteria included poor preservation of the first molars, incomplete root formation, any major enamel or dentinal defects, root fractures, coronal or radicular resorption within the pulp–root complex, extensive caries that impeded accurate measurement, evidence of prior endodontic treatment, or metallic restorations (e.g., full or partial metal crowns, or porcelain-fused-to-metal crowns). Demographic data was available for all scans to allow for group comparisons.
The composition of the scan collection is presented in Table 1.
2.1. Data Processing
A novel surface-to-interface thickness measuring tool for curved biological structures [23] was used to analyze the scans. Post-acquisition data processing was conducted in Microsoft Excel to refine the raw thickness values. The software initially captured measurements at 0.1 mm increments across the mesial, distal, buccal, and lingual surfaces from a line parallel to the reference plane along the cemento-enamel junction through the most inferior point on the furcation [23]. To facilitate a standardized analysis, these data points were aggregated into 1 mm segments by calculating the mean of every ten consecutive measurements, starting at the line parallel to the reference plane along the cemento-enamel junction through the most inferior point on the furcation as shown in Figure 1. For instance, the first millimeter (0.0–0.9 mm) from the furcation represents the average of ten initial points, with subsequent segments derived through the same grouping.
2.2. Statistical analysis
The software’s precision was previously established using a series of computer-generated geometric benchmarks, including cylindrical and cuboidal models [23]. These validation trials confirmed the tool’s ability to handle the geometric extremes inherent in dental anatomy. Because the measurement process is purely computational, it offers inherent repeatability, providing a precise and objective alternative to traditional manual assessment methods.
Statistical analyses were performed using PAST software version 4.11 [25]. Statistical comparisons between sexes and sides were performed to assess the appropriateness of pooling the data versus analyzing each sex and side independently. Differences between left and right sides were assessed using paired t-tests for normally distributed data, while the Wilcoxon signed-rank test was employed for non-normally distributed datasets. Demographic analysis of male and female groups was performed using independent samples t-tests or the Mann–Whitney U test.
To describe dentine thickness patterns, descriptive statistics including the mean, standard deviation, and range were calculated for each root surface along each root at 1 mm increments from coronal to distal. The normality of the data was then assessed using the Shapiro–Wilk test, as it is particularly reliable for the sample sizes typically found in micro-CT studies. The level of significance was set at p < 0.05. This was done to ensure that the subsequent statistical tests were appropriate for the distribution of the measurements; if the data did not follow a normal distribution, non-parametric tests were used instead to ensure the statistical findings remained valid.
Firstly, variations across root surfaces (mesial, distal, buccal, and lingual) along each root at 1 mm increments from coronal to distal were evaluated statistically through repeated measures ANOVA or the Friedman test, depending on the results of the normality testing. Where non-parametric methods were required, a Bonferroni correction was applied to adjust for multiple pairwise comparisons. Following the primary assessment across all individual 1-mm cross-sectional slices, each mesial and distal root was subsequently divided into coronal, middle, and apical third levels. The average dentine thickness for each third was then calculated to enable comparison between surfaces of each root third in the analysis of broader longitudinal tapering patterns. Statistical differences between adjacent thirds were evaluated using the Shapiro-Wilk test for data normality, followed by parametric paired t-tests for normally distributed data or the non-parametric Wilcoxon signed-rank test for skewed distributions. The level of significance was set at p < 0.05.
Furthermore, the correlation between age and root dentine thickness was determined using Pearson’s or Spearman’s coefficients. A Bonferroni correction was applied to all multiple comparisons where applicable to ensure the accuracy of the findings.
3. Results
3.1. Repeatability Results
As described in Meyer et al. (2026) [23], the software demonstrated high measurement consistency across all benchmark models. Dimensional accuracy was recorded within 0.0001 mm for cylindrical geometries, while absolute precision was achieved for all cuboidal structures.
Initial comparisons between the left and right sides using paired t-tests and Wilcoxon signed-rank tests yielded no statistically significant variations. Therefore, subsequent analyses were restricted to the left side. Similarly, as no significant differences were detected between male and female cohorts using independent samples t-tests or Mann-Whitney U tests, the data were pooled. This consolidated dataset was then utilized for all surface, level, and age-related evaluations. The age distribution of the pooled sample is graphically represented in Figure 2.
3.2. Descriptive Statistics
Descriptive statistics for the mandibular mesial and distal roots per 1 mm segment for the pooled sample are summarized in Table 2. The lingual and buccal surfaces consistently demonstrated greater thickness than the mesial and distal surfaces, with a progressive reduction in dentine thickness observed from the coronal region toward the apex. Standard deviations tended to increase apically, suggesting greater morphological variability at the root tip. Post-hoc analysis confirmed significant differences in wall thickness based on root surface orientation (p < 0.05).
Coronally (0-4 mm), the mesial and distal surfaces were significantly different from one another in both roots. In the mesial root, the distal surface was consistently the thinnest aspect (L ≠ B ≠ M ≠ D) or ((L ≈ B) ≠ M ≠ D). Conversely, in the distal root, the mesial surface was identified as the significantly thinner aspect compared to the distal surface ((B ≈ L) ≠ D ≠ M) across the upper 4 mm.
A distinct shift in these anatomical patterns occurred in the apical direction. In the mesial root, the mesial and distal walls became temporarily similar at 5 mm ((L ≈ B) ≠ (M ≈ D)), but closer to the apex (9–10 mm), the distal surface became uniquely and significantly thinner than all other walls (D ≠ (B ≈ L ≈ M)). In the distal root, the mesial and distal surfaces converged and were statistically identical at 6 mm and 7 mm (D ≈ M), before the distal surface became significantly thinner than the buccal and mesial walls at 8 mm (D ≠ (B ≈ M)). Finally, as the sample size decreased near the root tip (10 mm, N=3), all significant differences among the four walls disappeared within the distal root (M ≈ D ≈ L ≈ B), demonstrating complete anatomical uniformity.
N = number of roots
Bold = mean thickness
Italics = standard deviation
= Mesial; D = Distal; L = Lingual; B = Buccal
≈ statistically insignificant, ≠ statistically significant
*Note: At 8 mm in the distal root (N=22), the lingual wall (L) demonstrated high variance and did not differ significantly from any of the other three walls.
Repeated measures ANOVA and Friedman tests performed on the pooled sample revealed not only significant differences across root surfaces but also across levels for most of the analyzed segments. While both roots exhibited tapering, the mesial root of the mandibular molar generally presented a more complex anatomy compared to the distal root. The boxplots in Figure 3 highlight that the mesial root's distal wall was frequently the thinnest point of the entire mandibular molar complex. In contrast, the distal root tended to maintain a slightly more robust dentine thickness on its mesial aspect, though it still remained thinner relative to its own buccal and lingual walls.
Quantitative analysis of the mandibular molar roots revealed a consistent and progressive reduction in radicular dentine thickness from the coronal third toward the apex. As demonstrated in Figure 4, all four surfaces (mesial, distal, buccal, and lingual) exhibited a downward trajectory in mean thickness as the root tapered. Statistically, the reduction between each third was significant (p < 0.05), with the comparison between coronal and apical thirds showing an extremely significant decrease (p < 0.001). This morphological tapering was most pronounced in the mesial root, particularly along the distal (furcal) surface, which remained the thinnest wall across all levels.
In both the mesial and distal roots, the buccal and lingual walls represented the thickest structural components in the coronal and middle thirds (Figure 3 and Figure 4). While these surfaces remained the most robust throughout the root's length, the significant gap between these and the thinner mesial and distal walls reduces as the root progresses apically. In the mesial root specifically, the distal wall remained the most vulnerable point, yet the extreme thickness gap observed in the coronal third begins to resolve in the apical region. By the apical third, the structural dimensions across all four surfaces tended to converge as can be seen in Figure 5 where blue indicates the thinnest dentine and red indicates the thickest dentine.
Neither Pearson’s nor Spearman’s correlation analyses demonstrated statistically significant associations between root dentine thickness and age. While most correlation coefficients indicated weak positive relationships (all weaker than 0.40 with one exception of 0.46), several negative correlations (weaker than -0.18) were observed as well.
4. Discussion
This investigation establishes a foundational baseline for root dentine thickness in this Black South African sample, a group which is historically underrepresented in endodontic morphological literature. Unlike previous studies that focused on isolated roots or limited their analysis to the first few millimeters apical to the furcation, the current research provides a comprehensive mapping of both the distal and mesial roots at 1-mm increments throughout their entire longitudinal extent. Utilizing micro-CT imaging and a specialized software application, the study accurately documented the complex tapering of dentine from the coronal aspect to the root apex.
A significant finding of this research relates to the identification of "danger zones," regions characterized by naturally reduced dentine thickness that are essentially more prone to iatrogenic complications. The mesial aspect of the distal root and the distal aspect of the mesial root consistently exhibited lower average thickness, particularly within the apical segment. Such areas may increase the risk of procedural complications, including strip perforations during mechanical instrumentation.
The mesial root presents a more complex morphology than the distal root, with its distal wall frequently constituting the thinnest point of the radicular complex (Figure 3). This structural feature may be attributed to the presence of developmental depressions or 'concavities' often found on the distal aspect of mesial roots [11,26]. Consequently, these localized anatomical variations suggest that the mesial root requires more conservative instrumentation protocols to avoid compromising its structural stability. Beyond these localized concavities, the overall predictable longitudinal tapering of the mandibular root walls, particularly evident within the mesial root, matches the morphological trends observed in maxillary buccal roots [27]. This progressive reduction of radicular dentine toward the apex creates a distinct structural vulnerability in the middle and apical thirds. As a result, it underscores a heightened risk of strip perforation, root fracture, or instrument separation during endodontic procedures, as the reduced volume of mineralized tissue offers less resistance to mechanical stress.
In Table 3, the findings of investigations conducted on the dentine thickness of mandibular first molars are summarized. Comparing the current results to this international literature highlights both universal anatomical patterns and unique characteristics within this South African sample. Globally, the thinnest dentinal walls are consistently located on the distal/furcal aspect of the mesial roots of mandibular molars, particularly within the middle third frequently falling below a 1.0 mm threshold [6,28,29,30,31].
While the identification of the mesial root’s distal wall as a primary "danger zone" aligns with global trends [6,11,35], the longitudinal distribution of this thinning varied significantly in the current sample. While previous literature sometimes identifies the point of minimum thickness 1-2 mm below the furcation, for instance Tabrizizadeh et al. (2010) [33] who describes it at 1.5 mm below the furcation, the current findings indicate that the radicular dentine becomes progressively thinner into the apical third. Anatomical comparison with previously recorded minimum values is therefore limited because of the different levels measurements were taken. Importantly, Table 3 also shows a major gap in global endodontic literature, demonstrating a trend where researchers focus almost entirely on the mesial root [6,19]. By providing data for both roots, the current study establishes a necessary comparative framework, confirming that the mesial surface of the distal root represents its own highly vulnerable aspect.
Paired t-tests together with the Wilcoxon signed-rank test did not reveal any significant differences in dentine thickness between the left and right mandibular first molars. This suggests high bilateral symmetry, allowing clinicians to hypothetically use the morphology of a contralateral tooth as a reliable guide for pre-operative planning. Furthermore, no statistically significant differences were detected between male and female groups, showing a high degree of sexual symmetry that contradicts larger international datasets where males typically present with significantly thicker walls [6].
Even though this study did not demonstrate statistically significant age correlations, age is a critical factor to consider. Studies which included pediatric and adolescent cases noted an ongoing deposition of secondary dentine which typically results in narrower canal spaces and a corresponding increase in wall thickness in older patients [37,38,39,40]. This study only included individuals from 22 years with limited numbers beyond 60 years especially in females. With the age spread leaning heavily toward younger individuals (Figure 2) and only a few older individuals represented, definitive age-related conclusions cannot be drawn. Larger samples with a more even spread over the age groups as for instance performed by Zhou et al. (2020) [6] on a clinical sample size of 1,792 teeth, might reveal different trends.
From a demographic perspective, the results deviate from several established studies. Unlike Zhou et al. (2020) [6], who found that males had significantly thicker dentine walls than females, this South African cohort showed a high degree of sexual symmetry. Although direct functional modulation of dentine thickness is less firmly established than for bone, variations in tooth anatomy have been linked to genetic factors and masticatory habits [41], which could account for the weak variation in dentine thickness with aging noted in this study. It is also interesting to note that findings from another unrelated South African micro-CT investigation (where researchers used the same scan collection than the one used for the current study) revealed that the Black South African sampled group showed fewer significant negative correlations between age and cortical thickness of the mandibular corpus than that of the White sampled group. In some sites, particularly lingual regions, thickness even increased slightly with age/tooth loss interactions [42]. Taken together, these findings suggest distinct population-specific patterns of both internal radicular and external gnathic tissue preservation during aging.
While population-specific anatomical variation may contribute to the reduced dentine thickness observed in this sample compared to other cohorts who exhibit more robust dentine thickness with walls often exceeding 1.2 mm [32,33], compared to the minimum values in this South African cohort reaching only 0.36 mm, the difference in dentine thickness may also be attributed to the imaging modalities utilized across studies. For instance, Zhou et al. (2020) [6] reported minimum values between 0.76 mm and 0.82 mm in Chinese subjects using clinical cone beam computed tomography (CBCT), while the current study utilized high-resolution micro-CT. This matches established methodological literature showing that micro-CT imaging consistently produces smaller minimum thickness measurements than CBCT or conventional sectioning techniques, likely due to their superior spatial resolution and ability to generate true orthogonal three-dimensional sections [18,19,30]. Because clinical CBCT has a lower spatial resolution and is highly prone to partial volume effects, it tends to smooth over extreme localized thinning that micro-CT successfully captures.
However, even when compared to other micro-CT research such as that by Keles et al. [19], which recorded minimum distances of 0.93 mm to 0.97 mm in Turkish samples, the values in this South African cohort remain substantially lower. While the thinner dentine thickness observed in this study could indicate a more precarious "danger zone" in this population than previously reported, necessitating greater clinical caution, it is more likely that the semi-automated orthogonal sectioning technique utilized by the novel software program on micro-CT scans revealed more precise measurements. Traditional methods based on two-dimensional sections of three-dimensional root anatomy cannot reliably adapt to the local axis of the dental root which may result in oblique sections with enlarged measurements. Traditional cross-sections are not likely to be generated orthogonally to the local axis of the root, leading to oblique measurement errors that may misrepresent the actual surface-to-interface thickness.
This high-resolution methodological accuracy holds immense clinical relevance regarding the underreported prevalence of iatrogenic root perforations, which literature estimates to affect between 3% and 12% of endodontically treated teeth [43]. In clinical practice, these procedural complications frequently present as strip perforations within vulnerable root concavities during early access cavity refinement, mechanical cleaning and shaping, and post space formulation [44]. The relatively high incidence of these procedural errors supports the premise that true residual dentine walls are often narrower than conventional diagnostic modalities suggest, thereby significantly reducing the clinical margin for error.
5. Conclusions
This study has established a comprehensive 3D baseline for root dentine thickness in the mandibular first molars of this Black South African cohort, addressing a specific gap in regional morphological data. The results confirm a significant "danger zone" on the distal aspect of the mesial root that extends and progresses into the apical third, which is more pronounced than the corresponding thinning on the mesial aspect of the distal root. These findings pinpoint the areas at highest risk for perforation during mechanical shaping.
Statistical analysis revealed a high degree of bilateral symmetry and a lack of significant sexual dimorphism, suggesting that these morphological trends are consistent across this population. Furthermore, the absence of a correlation between age and dentine thickness in the middle and apical thirds challenges the assumption that older patients possess a greater "safety zone" due to secondary dentine deposition. Instead, the data indicates that the risk of procedural complications remains a constant concern regardless of patient age.
Thinner dentine thicknesses were reported in this study using micro-CT scans and a novel software program compared to the literature, emphasizing the need for increased clinical caution during endodontic procedures. These findings suggest that dentinal walls may be more vulnerable to excessive instrumentation than previously recognized, thereby highlighting the importance of accurate anatomical assessment for safer endodontic instrumentation and long-term tooth preservation.
Supplementary Materials
The following supporting information can be downloaded at Preprints.org, STROBE guidelines checklist for this study.
Author Contributions
Conceptualization, C.H.J.; methodology, M.M., A.C.O. and C.H.J.; validation, M.M., A.C.O. and C.H.J.; formal analysis, M.M. and A.C.O.; investigation, M.M.; resources, C.H.J., A.C.O., S.R.-S. and M.M.; data curation, M.M., A.C.O. and C.H.J.; writing—original draft preparation, M.M.; writing—review and editing, S.R.-S., A.C.O. and C.H.J.; visualization, S.R.-S., A.C.O., C.H.J. and M.M.; supervision, S.R.-S., A.C.O. and C.H.J.; project administration, A.C.O.; funding acquisition, S.R.-S. All authors have read and agreed to the published version of the manuscript.
Funding
This study was supported by the National Research Foundation (NRF) under the Research Development Grants for New Generation of Academics Program (nGAP) [Grant No: NGAP240205203589] and co-funded by the Department of Higher Education and Training (DHET) through the Staffing South African Universities Framework (SSAUF) and nGAP.
Institutional Review Board Statement
Ethical approval for this study was obtained from the School of Medicine Research Committee of the Sefako Makgatho Health Sciences Univer sity (SREC) and the Sefako Makgatho Health Sciences University Ethics Committee (SMUREC) (SMUREC/M/443/2024:PG) (13 February 2025), ensuring adherence to the guidelines for research involving human subjects.
Informed Consent Statement
Informed consent from patients was not possible as Micro-CT scans from skulls of deceased individuals were used. Permission for research was given by family members in the case of a donation, and unclaimed bodies are protected by the National Health Act 61 of 2012.
Data Availability Statement
The data presented in this study are available from the corresponding author upon request. The data are not publicly available due to ethical reasons.
Conflicts of Interest
The authors declare no conflicts of interest.
References
- Davis, G.R.; Tayeb, R.A.; Seymour, K.G.; Cherukara, G.P. Quantification of residual dentine thickness following crown preparation. J. Dent. 2012, 40, 571–576. [Google Scholar] [CrossRef] [PubMed]
- Lee, K.W.; Kim, Y.; Perinpanayagam, H.; Lee, J.K.; Yoo, Y.J.; Lim, S.M.; Chang, S.W.; Ha, B.H.; Zhu, Q.; Kum, K.Y. Comparison of alternative image reformatting techniques in micro-computed tomography and tooth clearing for detailed canal morphology. J. Endod. 2014, 40, 417–422. [Google Scholar] [CrossRef] [PubMed]
- Tabassum, S.; Khan, F.R. Failure of endodontic treatment: the usual suspects. Eur. J. Dent. 2016, 13, 144–147. [Google Scholar] [CrossRef] [PubMed]
- Sarao, S.K.; Berlin-Broner, Y.; Levin, L. Occurrence and risk factors of dental root perforations: a systematic review. Int. Dent. J. 2020, 71, 96–105. [Google Scholar] [CrossRef] [PubMed]
- Bjørndal, L.; Laustsen, M.H.; Reit, C. Root canal treatment in Denmark is most often carried out in carious vital molar teeth and retreatments are rare. Int. Endod. J. 2006, 39, 785–790. [Google Scholar] [CrossRef] [PubMed]
- Zhou, G.; Leng, D.; Li, M.; Zhou, Y.; Zhang, C.; Sun, C.; Wu, D. Root dentine thickness of danger zone in mesial roots of mandibular first molars. BMC Oral Health 2020, 20, 43. [Google Scholar] [CrossRef] [PubMed]
- Jonker, C.H.; van der Vyver, P.J.; Oettlé, A.C. Root and canal morphology of the maxillary first molar: A micro-computed tomography-focused review of literature with illustrative cases: Part 1: External root morphology. S. Afr. Dent. J. 2024, 79, 7–10. [Google Scholar] [CrossRef]
- Mannocci, F.; Peru, M.; Sherriff, M.; Cook, R.; Pitt Ford, T.R. The isthmuses of the mesial root of mandibular molars: a micro-computed tomographic study. Int. Endod. J. 2005, 38, 558–563. [Google Scholar] [CrossRef] [PubMed]
- Fu, Y.; Gao, Y.; Gao, Y.; Tan, X.; Zhang, L.; Huang, D. Three-dimensional analysis of coronal root canal morphology of 136 permanent mandibular first molars by micro-computed tomography. J. Dent. Sci. 2022, 17, 482–489. [Google Scholar] [CrossRef] [PubMed]
- Keleş, A.; Keskin, C.; Alqawasmi, R.; Versiani, M.A. Evaluation of dentine thickness of middle mesial canals of mandibular molars prepared with rotary instruments: a micro-CT study. Int. Endod. J. 2020, 53, 519–528. [Google Scholar] [CrossRef] [PubMed]
- Abou-Rass, M.; Frank, A.L.; Glick, D.H. The anticurvature filing method to prepare the curved root canal. J. Am. Dent. Assoc. 1980, 101, 792–794. [Google Scholar] [CrossRef] [PubMed]
- Lim, S.S.; Stock, C.J.R. The risk of perforation in the curved canal: anticurvature filing compared with the stepback technique. Int. Endod. J. 1987, 20, 33–39. [Google Scholar] [CrossRef] [PubMed]
- Versiani, M.A.; Pécora, J.D.; Sousa-Neto, M.D. A micro-computed tomography study of the root canal morphology of single-rooted maxillary canines. Int. Endod. J. 2013, 44, 1062–1072. [Google Scholar] [CrossRef] [PubMed]
- Subramanian, P.; Al-Marzok, M.I.K.; Murugeshappa, D.G.; Kacharaju, K.R.; Mohamad Hanapi, N.S.; Nambiar, P. Comparative evaluation of the remaining dentin thickness using different root canal retreatment techniques: a cone-beam computed tomography study. J. Int. Dent. Med. Res. 2021, 14, 901–909. [Google Scholar]
- Versiani, M.A.; Ordinola-Zapata, R.; Keleş, A.; Alcin, H.; Bramante, C.M.; Pécora, J.D.; Sousa-Neto, M.D. Middle mesial canals in mandibular first molars: a micro-CT study in different populations. Arch. Oral Biol. 2016, 61, 130–137. [Google Scholar] [CrossRef] [PubMed]
- Sauaia, T.S.; Gomes, B.P.F.A.; Pinheiro, E.T.; Zaia, A.A.; Ferraz, C.C.R.; Souza-Filho, F.J.; Valdrighi, L. Thickness of dentine in mesial roots of mandibular molars with different lengths. Int. Endod. J. 2010, 43, 555–559. [Google Scholar] [CrossRef] [PubMed]
- Ordinola-Zapata, R.; Martins, J.N.R.; Versiani, M.A.; Bramante, C.M. Micro-CT analysis of danger zone thickness in the mesiobuccal roots of maxillary first molars. Int. Endod. J. 2019, 52, 524–529. [Google Scholar] [CrossRef] [PubMed]
- De-Deus, G.; Rodrigues, E.A.; Belladonna, F.G.; Simões-Carvalho, M.; Cavalcante, D.M.; Oliveira, D.S.; Souza, E.M.; Giorgi, K.A.; Versiani, M.A.; Lopes, R.T.; Silva, E.J.N.L.; Paciornik, S. Anatomical danger zone reconsidered: a micro-CT study on dentine thickness in mandibular molars. Int. Endod. J. 2019, 52, 1501–1507. [Google Scholar] [CrossRef] [PubMed]
- Keleş, A.; Keskin, C.; Alqawasmi, R.; Versiani, M.A. Evaluation of dentine thickness of middle mesial canals of mandibular molars prepared with rotary instruments: a micro-CT study. Int. Endod. J. 2020, 53, 519–528. [Google Scholar] [CrossRef] [PubMed]
- Paqué, F.; Ganahl, D.; Peters, O.A. Effects of root canal preparation on apical geometry assessed by micro-computed tomography. J. Endod. 2009, 35, 1056–1059. [Google Scholar] [CrossRef] [PubMed]
- Peters, O.A. Current challenges and concepts in the preparation of root canal systems: A review. J. Endod. 2004, 30, 559–567. [Google Scholar] [CrossRef] [PubMed]
- Hildebrand, T.; Rüegsegger, P. A new method for the model-independent assessment of thickness in three-dimensional images. J. Microsc. 1997, 185, 67–75. [Google Scholar] [CrossRef]
- Meyer, M.; Potgieter, R.; Jonker, C.H.; Rajbaran-Singh, S.; Oettlé, A.C. Outer shell thickness measuring tool for structures with curved surfaces. Res. Sq. 2026. [Google Scholar] [CrossRef] [PubMed]
- L’Abbé, E.N.; Krüger, G.C.; Theye, C.E.; Hagg, A.C.; Sapo, O. The Pretoria Bone Collection: A 21st Century Skeletal Collection in South Africa. J. Forensic Sci. 2021, 1, 220–227. [Google Scholar] [CrossRef]
- Hammer, Ø.; Harper, D.A.T.; Ryan, P.D. PAST: Paleontological statistics software package for education and data analysis. Palaeontol. Electron. 2001, 4, 1–9. [Google Scholar]
- Degerness, R.A.; Bowles, W.R. Dimension, anatomy and morphology of the mesiobuccal root canal system in maxillary first molars. J. Endod. 2010, 36, 985–989. [Google Scholar] [CrossRef] [PubMed]
- Meyer, M.; Potgieter, R.; Jonker, C.H.; Rajbaran-Singh, S.; Oettlé, A.C. Root Dentine Thickness of Maxillary First Molars in a Black South African Sample Using a Novel Software Program. Preprints 2026, 2026050349. [Google Scholar] [CrossRef]
- Garcia Filho, P.F.; Letra, A.; Menezes, R. Danger zone in mandibular molars before instrumentation: an in vitro study. J. Appl. Oral Sci. 2003, 11, 324–326. [Google Scholar] [CrossRef] [PubMed]
- Chang, Y.R.; Choi, Y.S.; Choi, G.W. Evaluation of danger zone in mesial root of mandibular first molar by cone beam computed tomography (CBCT). Korean J. Oral Maxillofac. Radiol. 2007, 40, 103–110. [Google Scholar]
- Harris, S.P.; Bowles, W.R.; Fok, A. An anatomic investigation of the mandibular first molar using micro-computed tomography. J. Endod. 2013, 39, 1374–1378. [Google Scholar] [CrossRef] [PubMed]
- Sousa, V.C.D.; Alencar, A.H.G.D.; Bueno, M.R. Evaluation in the danger zone of mandibular molars after root canal preparation using novel CBCT software. Braz. Oral Res. 2022, 36, 1–12. [Google Scholar] [CrossRef] [PubMed]
- Berutti, E.; Fedon, G. Thickness of cementum/dentin in mesial roots of mandibular first molars. J. Endod. 1992, 18, 545–548. [Google Scholar] [CrossRef] [PubMed]
- Tabrizizadeh, M.; Reuben, J.; Khalesi, M. Evaluation of radicular dentin thickness of danger zone in mandibular first molars. J. Dent. 2010, 7, 196–199. [Google Scholar]
- Dwivedi, S.; Dwivedi, C.D.; Mittal, N. Correlation of root dentin thickness and length of roots in mesial roots of mandibular molars. J. Endod. 2014, 40, 1435–1438. [Google Scholar] [CrossRef] [PubMed]
- Leite Pinto, S.; Lins, R.; Videira Marceliano-Alves, M. The internal anatomy of danger zone of mandibular molars: A cone-beam computed tomography study. J. Conserv. Dent. 2018, 21, 481–484. [Google Scholar] [CrossRef] [PubMed]
- Bolbolian, M.; Ramezani, M.; Valadabadi, M.; Alizadeh, A.; Tofangchiha, M.; Ghonche, M.R.A.; Reda, R.; Zanza, A.; Testarelli, L. Dentin Thickness of the Danger Zone in the Mesial Roots of the Mandibular Molars: A Cone Beam Computed Tomography Analysis. Front. Biosci. Sch. 2023, 15, 1. [Google Scholar] [CrossRef] [PubMed]
- Hisham, S.; Abdullah, N.; Noor, M.H.M.; Franklin, D. Quantification of secondary dentin formation based on the analysis of MDCT scans and dental OPGs in a contemporary Malaysian population. Leg. Med. 2019, 36, 59–66. [Google Scholar] [CrossRef] [PubMed]
- Maeda, H. Aging and senescence of dental pulp and hard tissues of the tooth. Front. Cell Dev. Biol. 2020, 8*, 605996. [Google Scholar] [CrossRef] [PubMed]
- Solomonov, M.; Kim, H.C.; Hadad, A.; Levy, D.H.; Itzhak, J.B.; Levinson, O.; Azizi, H. Age-dependent root canal instrumentation techniques: a comprehensive narrative review. Restor. Dent. Endod. 2020, 45. [Google Scholar] [CrossRef] [PubMed]
- Panov, V. Root canal treatment in elderly patients. Varna Med. Forum 2022, 11, 180–185. [Google Scholar] [CrossRef]
- Murray, P.E.; Stanley, H.R.; Matthews, J.B.; Sloan, A.J.; Smith, A.J. Age-related odontometric changes of human teeth. Oral Surg. Oral Med. Oral Pathol. Oral Radiol. Endod. 2002, 93, 474–482. [Google Scholar] [CrossRef] [PubMed]
- Theye, C.E. The Effects of Aging and Tooth Loss on the Microstructure of the Mandible in South Africans. Doctoral dissertation, University of Pretoria, 2022. [Google Scholar]
- Clauder, T.; Shin, S.M. Repair of perforations with MTA: clinical applications and mechanisms of action. Endod. Top. 2006, 15, 32–55. [Google Scholar] [CrossRef]
- Alshehri, M.M.; Alhawsawi, B.F.; Alghamdi, A.; Aldobaikhi, S.O.; Alanazi, M.H.; Alahmad, F.A. The management of root perforation: A review of the literature. Cureus 2024, 16, e72296. [Google Scholar] [CrossRef] [PubMed]
Figure 1.
Process showing how 0.1 mm measurements were grouped and averaged to yield a single representative thickness value per mm.
Figure 1.
Process showing how 0.1 mm measurements were grouped and averaged to yield a single representative thickness value per mm.
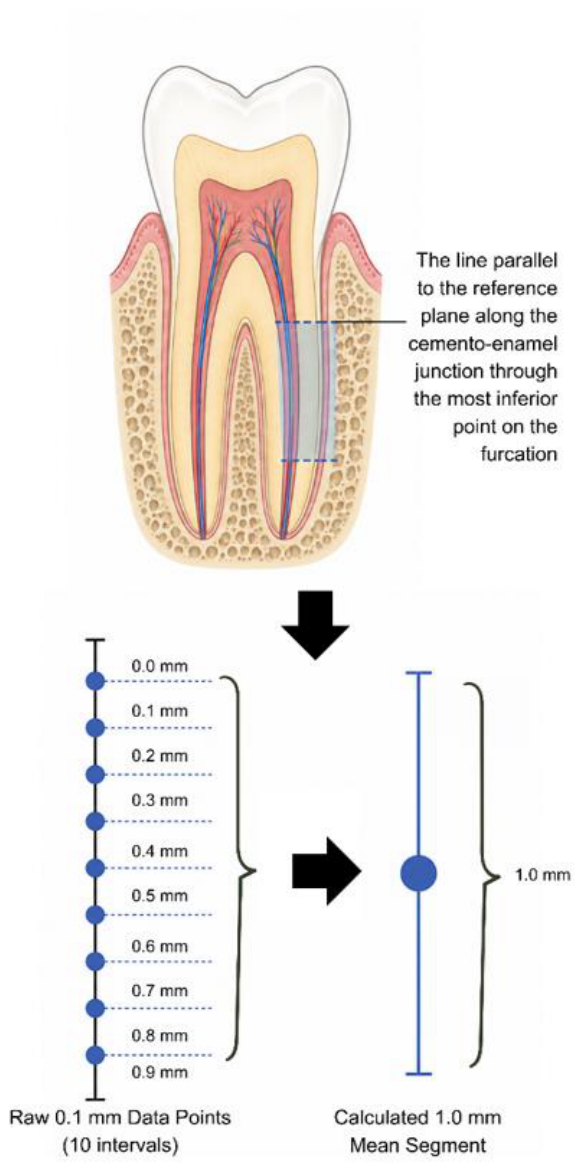
Figure 2.
Age distribution of sample.
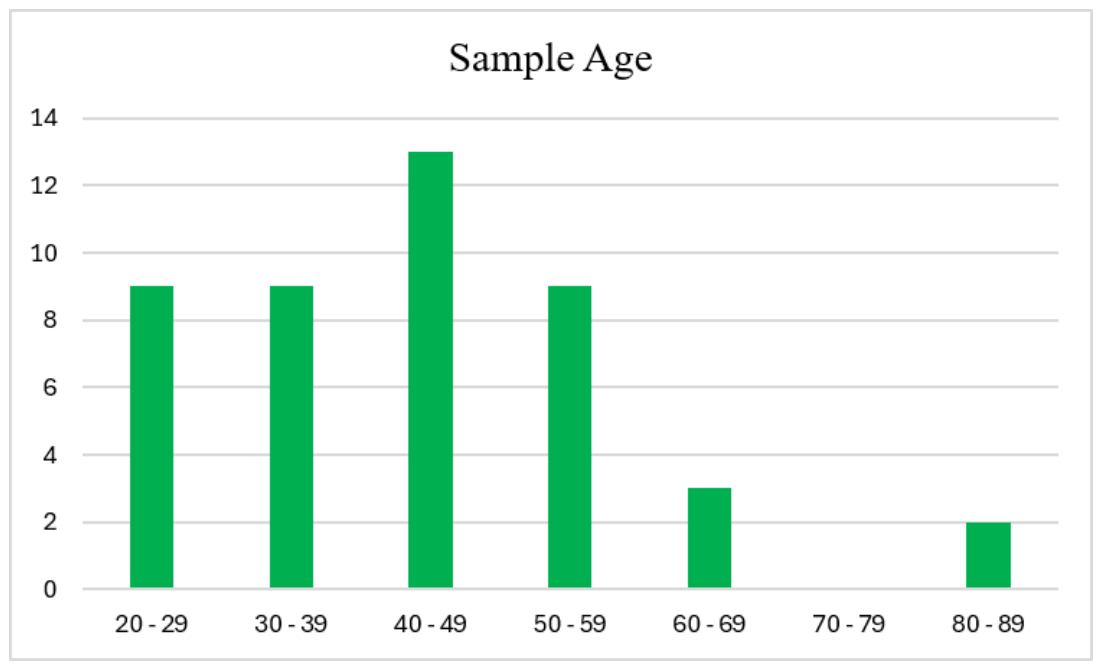
Figure 3.
Comparison of dentine thickness (mm) between root levels (coronal, middle, and apical thirds) across the mesial, distal, buccal, and lingual surfaces of mandibular mesial (left) and distal (right) roots.
Figure 3.
Comparison of dentine thickness (mm) between root levels (coronal, middle, and apical thirds) across the mesial, distal, buccal, and lingual surfaces of mandibular mesial (left) and distal (right) roots.
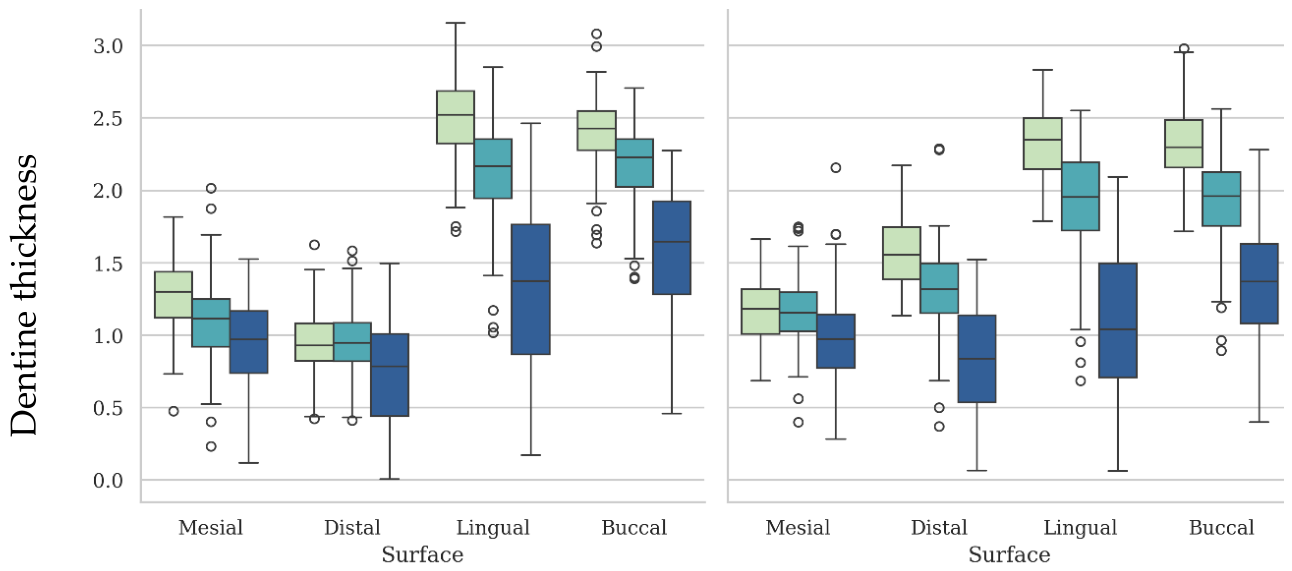
Figure 4.
Linear profile plot illustrating the mean dentine thickness reduction from the coronal third to the apical third in mandibular molars distal root (left) and mesial root (right). Each line represents a specific root surface.
Figure 4.
Linear profile plot illustrating the mean dentine thickness reduction from the coronal third to the apical third in mandibular molars distal root (left) and mesial root (right). Each line represents a specific root surface.
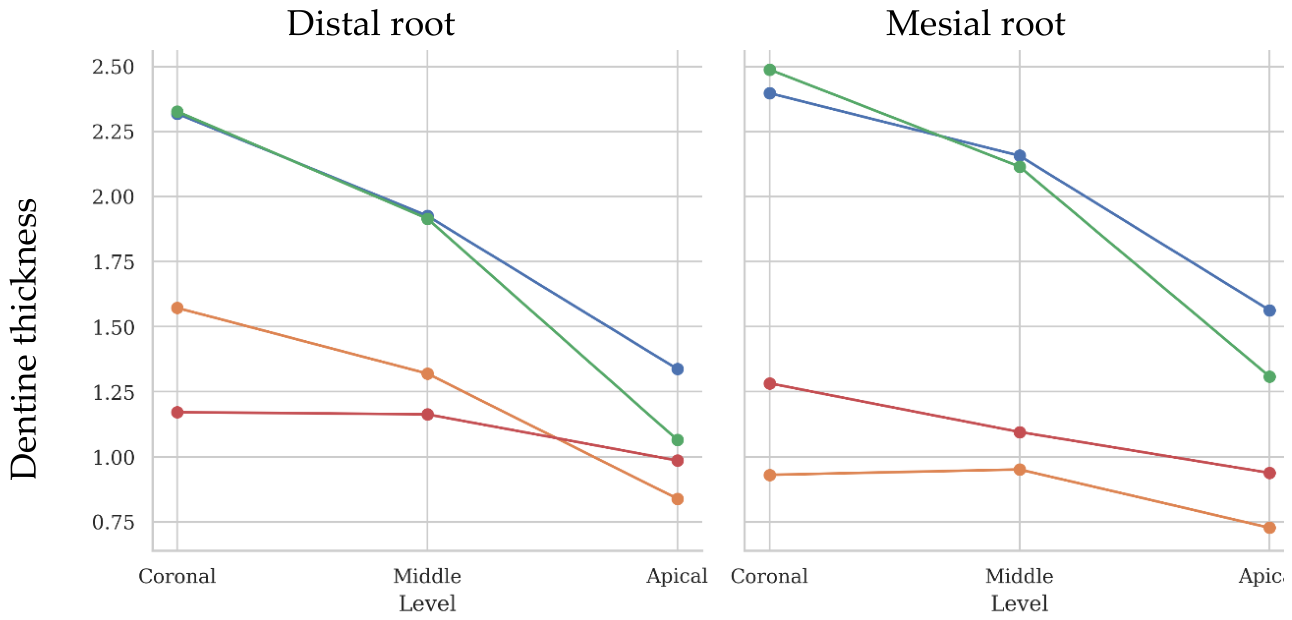
Figure 5.
Thickness map indicating thinnest areas of dentine in blue and thickest areas of dentine in red.
Figure 5.
Thickness map indicating thinnest areas of dentine in blue and thickest areas of dentine in red.
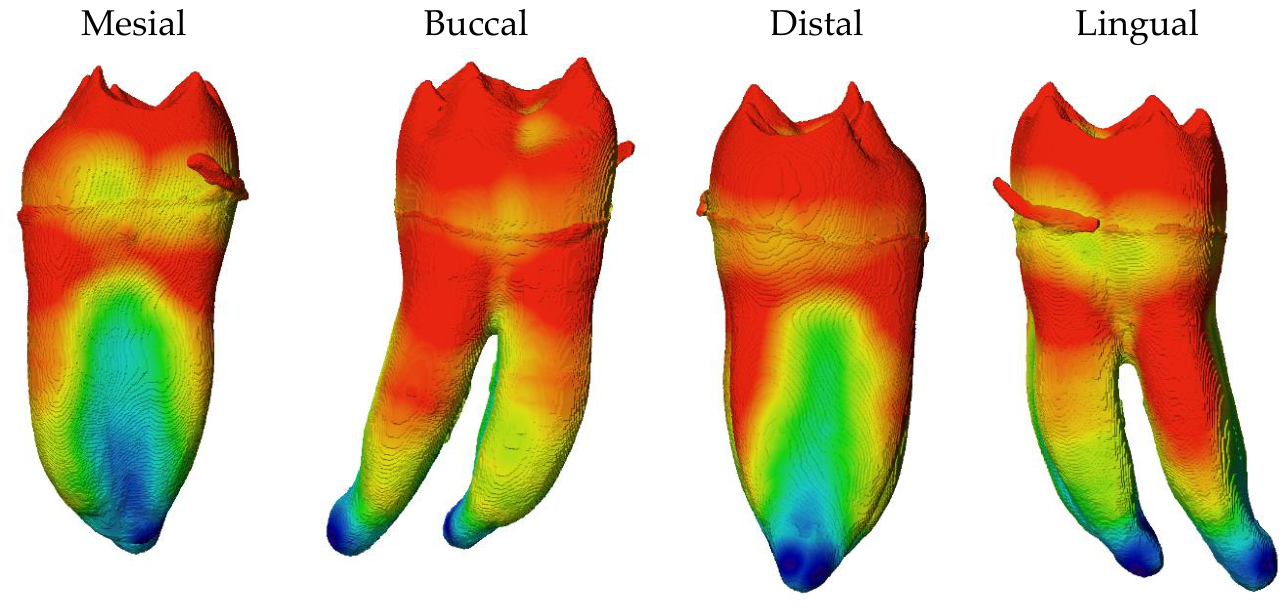

Table 1.
Distribution of micro-CT samples.
| Left | Right | Total | |
|---|---|---|---|
| Females | 16 | 17 | 33 |
| Males | 21 | 23 | 44 |
| Total | 37 | 40 | 77 |
Table 2.
Pooled dentine thickness in mm of mesial and distal roots.
| Root | Mesial | Distal | |||||||||
|---|---|---|---|---|---|---|---|---|---|---|---|
| Area | M | D | L | B | Significant differences |
M | D | L | B | Significant differences |
|
| Distance from furcation level (mm) | 0 | N=37 1.42 0.22 |
N=37 0.98 0.26 |
N=37 2.61 0.25 |
N=37 2.48 0.25 |
L ≠ B ≠ M ≠ D | N=37 1.18 0.24 |
N=37 1.67 0.23 |
N=37 2.41 0.23 |
N=37 2.43 0.23 |
(B ≈ L) ≠ D ≠ M |
| 1 | N=37 1.26 0.22 |
N=37 0.91 0.22 |
N=37 2.48 0.26 |
N=37 2.39 0.24 |
L ≠ B ≠ M ≠ D | N=37 1.15 0.22 |
N=37 1.57 0.23 |
N=37 2.33 0.22 |
N=37 2.32 0.23 |
(B ≈ L) ≠ D ≠ M | |
| 2 | N=37 1.16 0.23 |
N=37 0.91 0.20 |
N=37 2.38 0.26 |
N=37 2.32 0.23 |
(L ≈ B) ≠ M ≠ D | N=37 1.19 0.20 |
N=37 1.48 0.21 |
N=37 2.25 0.23 |
N=37 2.21 0.23 |
(B ≈ L) ≠ D ≠ M | |
| 3 | N=37 1.14 0.25 |
N=37 0.94 0.19 |
N=37 2.28 0.26 |
N=37 2.25 0.25 |
(L ≈ B) ≠ M ≠ D | N=37 1.21 0.20 |
N=37 1.40 0.24 |
N=37 2.13 0.25 |
N=37 2.09 0.23 |
(B ≈ L) ≠ D ≠ M | |
| 4 | N=37 1.11 0.24 |
N=37 0.97 0.22 |
N=37 2.15 0.28 |
N=37 2.18 0.27 |
(L ≈ B) ≠ M ≠ D | N=37 1.18 0.22 |
N=37 1.34 0.26 |
N=37 1.95 0.31 |
N=37 1.95 0.25 |
(B ≈ L) ≠ D ≠ M | |
| 5 | N=37 1.04 0.27 |
N=37 0.95 0.26 |
N=37 1.92 0.37 |
N=37 2.04 0.29 |
(L ≈ B) ≠ (M ≈ D) | N=37 1.10 0.27 |
N=37 1.21 0.30 |
N=37 1.67 0.41 |
N=37 1.74 0.33 |
(B ≈ L) ≠ (D ≈ M) | |
| 6 | N=37 0.98 0.30 |
N=37 0.84 0.34 |
N=37 1.63 0.50 |
N=37 1.82 0.34 |
B ≠ L ≠ M ≠ D | N=37 1.07 0.31 |
N=37 0.97 0.38 |
N=37 1.29 0.48 |
N=37 1.51 0.41 |
B ≠ L ≠ (D ≈ M) | |
| 7 | N=37 0.94 0.31 |
N=37 0.71 0.36 |
N=37 1.29 0.52 |
N=37 1.52 0.43 |
B ≠ L ≠ M ≠ D | N=31 0.91 0.37 |
N=31 0.83 0.30 |
N=31 1.00 0.47 |
N=31 1.30 0.37 |
B ≠ (L ≈ M ≈ D) | |
| 8 | N=31 0.88 0.33 |
N=31 0.61 0.34 |
N=31 0.96 0.49 |
N=31 1.31 0.45 |
B ≠ (L ≈ M) ≠ D | N=22 0.95 0.29 |
N=22 0.63 0.31 |
N=22 0.78 0.30 |
N=22 1.10 0.44 |
D ≠ (B ≈ M)* | |
| 9 | N=22 0.84 0.28 |
N=22 0.48 0.21 |
N=22 0.76 0.38 |
N=22 1.13 0.46 |
D ≠ (B ≈ L ≈ M) | N=13 0.83 0.27 |
N=13 0.48 0.31 |
N=13 0.64 0.27 |
N=13 0.84 0.45 |
M ≈ D ≈ L ≈ B | |
| 10 | N=13 0.75 0.28 |
N=13 0.36 0.25 |
N=13 0.59 0.32 |
N=13 0.83 0.46 |
D ≠ (B ≈ L ≈ M) | N=3 0.82 0.28 |
N=3 0.41 0.23 |
N=3 0.58 0.35 |
N=3 0.78 0.40 |
M ≈ D ≈ L ≈ B | |
| 11 | N=2 0.79 0.57 |
N=2 0.28 0.22 |
N=2 0.66 0.41 |
N=2 0.52 0.16 |
Insufficient data | ||||||
Table 3.
Studies conducted on dentine thickness of mandibular first molars.
| Author, year of study and location | Root/s | Measurement modalities | Location of sections | Measurements in mm | ||
|---|---|---|---|---|---|---|
| Berutti & Fedon, 1992 Italy, Europe [32] | 15 extracted mesial roots of mandibular molars | Photographs at 12x magnification | 1.5 mm below furcation | 1.2 – 1.3 | ||
| Garcia Filho et al., 2003 Rio de Janeiro, Brazil [28] |
200 extracted mesial roots of mandibular molars | Microscope with 10X magnification and a precision of 0.001 mm | 2 mm below furcation | Distance to distal wall: Average MB/ML: 0.79 |
||
| Chang et al., 2007 Korea [29] |
20 intact mesial roots of mandibular first molars | CBCT images | Pulpal floor thickness | 2.40 | ||
| Distance below canal orifice: 3 mm 4 mm 5 mm |
Distance to distal wall: MB: 1.04, ML: 1.11, Central: 1.09 MB: 0.92, ML: 0.97, Central: 0.93 MB: 0.88, ML: 0.93, Central: 0.91 |
|||||
| Distance below canal orifice: 3 mm 4 mm 5 mm |
Distance to mesial wall: MB: 1.21, ML: 1.36 MB: 1.12, ML: 1.23 MB: 1.01, ML: 1.09 |
|||||
|
Sauáia et al., 2010 Brazil [16] |
285 extracted mesial roots of mandibular first molars | Photographs at 10× magnification | 2 mm below furcation |
Distance to distal wall Long roots: MB: 0.92, ML: 0.93, MB-ML:3.54 Medium roots: MB: 0.97, ML: 0.91; MB-ML:3.26 Short roots: MB: 1.01, ML: 0.94; MB-ML:2.97 |
||
| Tabrizizadeh et al., 2010 Iran [33] |
53 extracted mesial and distal roots of mandibular first molars | Photographs at 6× magnification | 4 mm below canal orifice | Mesial roots: MB/ML MB/ML: distance to distal wall: 1.2 & distance to mesial wall: 1.96 MB: distance to buccal wall: 2.17 ML: distance to lingual wall: 2.2 Distal roots: MB/ML MB/ML: distance to distal wall: 1.98 & distance to mesial wall: 1.3 MB: distance to buccal wall: 2.33 Min. distance to lingual wall: 2.38 |
||
| Harris et al., 2013 [30] Minneapolis, USA |
22 extracted mesial and distal roots of mandibular molars | Micro-CT | 1.5 mm from furcation |
MB-ML: 1.43 - 3.09; DB-DL: 1.98 Central: 4.35 |
||
|
1.5 mm from furcation 3 mm from apex |
Distance to distal wall MB/ML: 0.81–1.22 MB/ML: 0.22–1.13 Average distance: 1.28 |
|||||
|
0.5 mm from apex 5 mm from apex |
Distance to mesial wall DB/DL: 0.25 DB/DL: 1.47 |
|||||
|
Dwivedi et al., 2014 India [34] |
45 extracted mesial roots of mandibular first molars | Stereomicroscopic integrated camera 36× magnification |
2 mm below furcation |
Distance to distal wall Long roots: MB: 1.07, ML: 1.14, MB-ML:2.71 Medium roots: MB: 1.33, ML: 1.04; MB-ML:2.76 Short roots: MB: 1.88, ML: 1.69; MB-ML:2.97 |
||
| Junction between the apical and middle thirds of the roots | Long roots: MB: 0.82, ML: 0.81, MB-ML:2.13 Medium roots: MB: 0.90, ML: 0.88; MB-ML:3.18 Short roots: MB: 1.06, ML: 0.91; MB-ML:1.01 |
|||||
| Leite Pinto et al., 2018 Brazil [35] |
50 extracted mesial roots of mandibular first molars | CBCT |
Pulpal floor thickness | 2.23 | ||
|
0 mm 1 mm. 2 mm 3 mm 4 mm below furcation |
Distance to distal wall MB/ML: 1.14 MB/ML: 0.95 MB/ML: 0.86 MB/ML: 0.81 MB/ML: 0.86 |
|||||
|
0 mm 1 mm 2 mm 3 mm 4 mm below furcation |
Distance to mesial wall MB/ML: 1.56 MB/ML: 1.37 MB/ML: 1.21 MB/ML: 1.06 MB/ML: 1.03 |
|||||
| De Deus et al., 2019 Brazil [18] |
50 extracted mesial roots of mandibular first and second molars | Micro-CT | 4.37 mm below furcation |
Minimum distance to distal/mesial wall MB: 1.13; ML: 1.10 |
||
| Keles et al., 2020 Türkiye [19] |
11 extracted mesial roots of mandibular first molars | Micro-CT | 5 mm below furcation |
Distance to distal wall MB: 1.14; ML: 1.11; MM: 0.97 Distance to mesial wall MB: 1.03; ML: 1.19; MM: 0.93 |
||
| Zhou et al., 2020 China [6] |
1792 intact mesial roots of mandibular first molars | CBCT |
Men: 1 mm 2 mm 3 mm 4 mm 5 mm below furcation |
Minimum distance to distal wall No significant difference between MB and ML, In MB roots: |
||
| 18-30 years 0.95 0.80 0.78 0.80 0.78 |
31 -50 years 0.96 0.82 0.80 0.79 0.81 |
> 51 years 1.01 0.85 0.82 0.83 0.83 |
||||
| Women: 1 mm 2 mm 3 mm 4 mm 5 mm below furcation |
18-30 years 0.89 0.76 0.74 0.76 0.76 |
31 -50 years 0.93 0.79 0.79 0.80 0.80 |
> 51 years 0.97 0.84 0.81 0.81 0.82 |
|||
| Men: 1 mm 2 mm 3 mm 4 mm 5 mm below furcation |
Long 0.97 0.82 0.78 0.78 0.78 |
Medium 0.93 0.79 0.76 0.76 0.78 |
Short 0.92 0.76 0.74 0.75 0.75 |
|||
| Women: 1 mm 2 mm 3 mm 4 mm 5 mm below furcation |
Long 0.97 0.82 0.79 0.82 0.82 |
Medium 0.91 0.77 0.75 0.75 0.76 |
Short 0.87 0.73 0.71 0.73 0.74 |
|||
| Sousa et al., 2022 Brazil [31] |
210 extracted mesial roots of mandibular first and second molars | CBCT |
1 mm 3 mm below furcation |
Distance to distal wall MB: 1.06; ML: 1.07 MB: 0.88; ML: 0.92 |
||
| Bolbolian et al., 2023 Qazvin, Iran [36] |
210 intact mesial roots of mandibular first molars | CBCT | Average distance to furcation 1.58 mm |
Average distance to distal wall MB: 0.88; ML: 0.90 |
||
Disclaimer/Publisher’s Note: The statements, opinions and data contained in all publications are solely those of the individual author(s) and contributor(s) and not of MDPI and/or the editor(s). MDPI and/or the editor(s) disclaim responsibility for any injury to people or property resulting from any ideas, methods, instructions or products referred to in the content. |
© 2026 by the authors. Licensee MDPI, Basel, Switzerland. This article is an open access article distributed under the terms and conditions of the Creative Commons Attribution (CC BY) license (http://creativecommons.org/licenses/by/4.0/).
Copyright: This open access article is published under a Creative Commons CC BY 4.0 license, which permit the free download, distribution, and reuse, provided that the author and preprint are cited in any reuse.


