

Submitted:
03 May 2026
Posted:
05 May 2026
You are already at the latest version
Abstract
Road traffic accidents pose a growing public safety challenge in rapidly urbanizing regions of Nigeria, where infrastructure development and traffic management often lag behind increasing vehicle use. This study investigates the spatial distribution and hotspot patterns of road traffic accidents in Jega Local Government Area, Kebbi State, Nigeria, using Inverse Distance Weighting (IDW) spatial interpolation. Georeferenced accident count data were analyzed through descriptive statistics, spatial visualization, and interpolation on a 200 × 200 grid with an edge buffer to minimize boundary effects. Accident hotspots were delineated using an 80th percentile threshold of interpolated intensity values. The results reveal a strongly clustered spatial structure, characterized by pronounced inequality in accident occurrence, where a small number of locations account for a disproportionate share of recorded accidents. IDW surfaces, contour maps, three-dimensional visualizations, and Google Earth-compatible outputs consistently identify high-risk zones around major junctions and traffic convergence areas. The findings demonstrate that IDW provides a transparent, computationally efficient, and operationally effective approach for accident hotspot identification in data-constrained urban settings. The study offers practical decision-support tools for targeted road safety interventions and contributes to evidence-based traffic management planning in developing urban environments.
Keywords:
road traffic accidents
; spatial interpolation
; inverse distance weighting
; hotspot analysis
; GIS
; Nigeria
1. Introduction
Road traffic accidents remain one of the leading causes of injury and mortality worldwide, imposing a substantial public health and socio-economic burden, particularly in low- and middle-income countries where more than 90% of global road traffic fatalities occur (World Health Organization, 2023). Rapid urbanization, population growth, and increased motorization in these regions have often outpaced the development of adequate road infrastructure, traffic management systems, and enforcement mechanisms. As a result, road safety challenges are especially pronounced in urban environments with mixed traffic conditions and high pedestrian activity.
In Nigeria, the situation is particularly critical. The steady rise in vehicle ownership, coupled with inadequate road design, poor maintenance, weak traffic law enforcement, and limited availability of reliable traffic data, has significantly intensified accident risks. These challenges are more evident in small and medium-sized urban centres, where transportation planning and safety interventions are often constrained by limited technical capacity and financial resources. Consequently, road traffic accidents in such settings tend to exhibit persistent spatial concentration, leading to repeated incidents at specific locations such as junctions, markets, and major access roads.
Understanding the spatial structure of accident occurrence is therefore essential for effective road safety planning and intervention. Spatial analytical methods provide a systematic framework for identifying high-risk locations, examining spatial heterogeneity in accident patterns, and supporting the targeted allocation of limited safety resources. By revealing where accidents are concentrated rather than assuming uniform risk across space, spatial analysis enhances the effectiveness of engineering, enforcement, and educational interventions (Lord and Mannering, 2010).
A wide range of spatial approaches has been applied to road traffic accident analysis. These include kernel density estimation for hotspot visualization (Anderson, 2009), spatial econometric models for investigating spatial dependence (Anselin, 1988), and geographically weighted regression for capturing spatially varying relationships between accidents and explanatory factors (Brunsdon et al., 1996; Fotheringham et al., 2002). In the Nigerian context, recent studies have increasingly adopted geostatistical and localized modeling techniques to account for spatial heterogeneity in accident occurrence and to improve the effectiveness of location-specific safety interventions (Abubakar and Umar, 2020; Abubakar et al., 2025).
Among available spatial interpolation techniques, Inverse Distance Weighting (IDW) remains widely used due to its conceptual simplicity, minimal data requirements, and ability to capture localized spatial influence. IDW operates on the principle that nearby observations exert greater influence on predicted values than distant ones, making it particularly suitable for modeling spatial intensity patterns where auxiliary explanatory variables are scarce (Li and Heap, 2014). Unlike regression-based or exposure-dependent methods, IDW does not require detailed traffic volume, road geometry, or socio-economic data, which are often unavailable or unreliable in developing urban settings.
Against this background, this study applies Inverse Distance Weighting interpolation to road traffic accident data from Jega, Nigeria. The study aims to characterize the statistical structure of accident occurrence, generate a continuous spatial representation of accident intensity, identify high-risk accident hotspots using a transparent percentile-based criterion, and produce spatial decision-support outputs to inform targeted and evidence-based road safety planning. By focusing on a data-constrained urban environment, the study contributes to practical methodological approaches for accident hotspot identification and supports the development of more efficient, location-specific safety interventions in similar settings.
2. Study Area and Data
2.1. Study Area
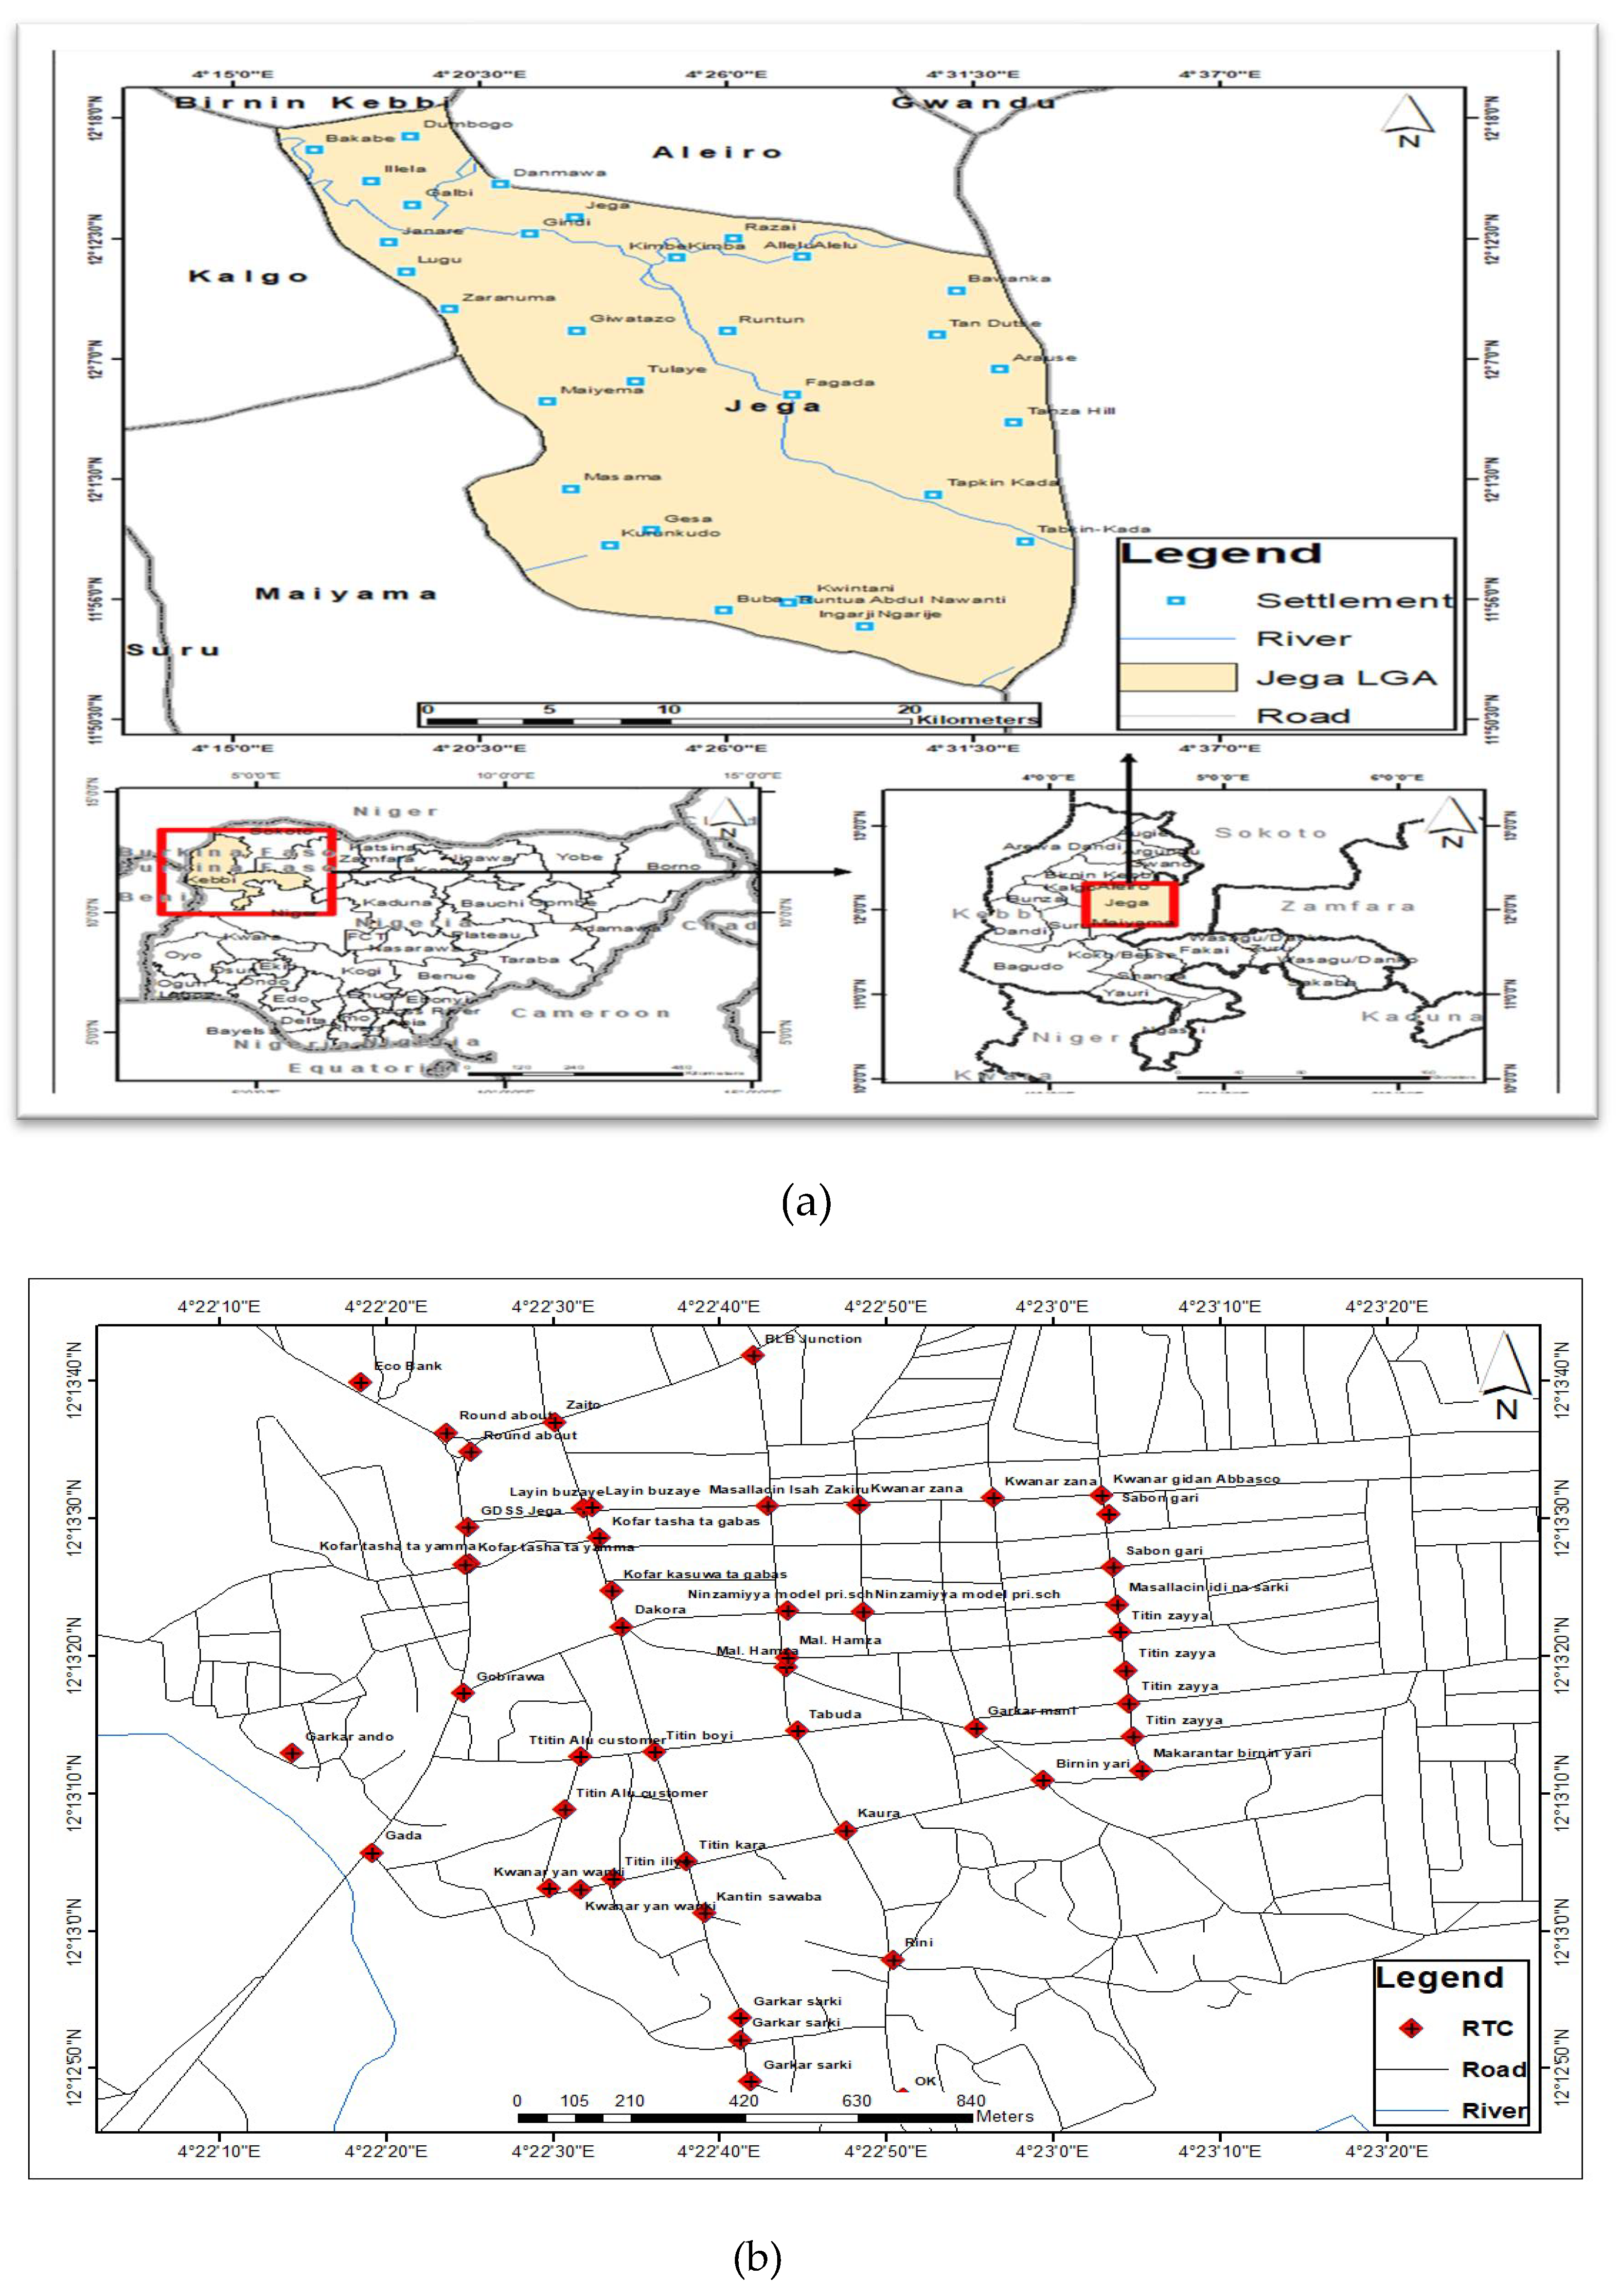
Jega Local Government Area is located in Kebbi State, north-western Nigeria. The town serves as a regional commercial centre, characterized by market activities, intersecting road networks, and mixed traffic conditions. The spatial analysis was conducted using projected UTM coordinates, enabling accurate distance-based interpolation. The map of the study is showing the accident points is given below
Figure 1.
(a) the geographic illustration of the study location (b) The geographic layout displays the distribution of 50 accident data points across Jega LGA.
Figure 1.
(a) the geographic illustration of the study location (b) The geographic layout displays the distribution of 50 accident data points across Jega LGA.
2.2. Accident Data
The dataset comprises georeferenced road traffic accident locations, each associated with a recorded accident count for the study period. The data were obtained from official traffic records and supplemented by field verification. The dataset includes spatial coordinates (X and Y), accident counts per location, and unique location identifiers. This data structure is appropriate for spatial intensity modeling and the identification of accident hotspots.
3. Methodology
3.1. Descriptive Statistical Analysis
Descriptive statistics were computed to summarize accident frequency patterns, including measures of central tendency, dispersion, skewness, and kurtosis. These statistics provide an initial assessment of variability and concentration in accident occurrence.
3.2. Inverse Distance Weighting (IDW) Interpolation
IDW interpolation estimates accident intensity at unsampled locations as a distance-weighted average of observed values:
where the weights are inversely proportional to the distance raised to a power parameter. A power value of 2 was adopted, consistent with common practice in environmental and accident studies (Li and Heap, 2014).
Interpolation was performed on a 200 × 200 grid, with a 10% buffer applied to reduce edge effects.
3.3. Hotspot Identification
Hotspots were delineated using an 80th percentile threshold of interpolated accident intensity values. Grid cells exceeding this threshold were classified as high-risk zones. Spatial connectivity was used to identify distinct hotspot clusters.
3.4. Visualization and Output Generation
A range of spatial and statistical visualizations was produced to support exploratory analysis and result interpretation. These included distributional plots such as histograms, box plots, and violin plots to assess accident frequency characteristics; spatial scatter and bubble maps to examine the geographic distribution of observed accident locations; IDW-derived heatmaps, contour maps, and three-dimensional surfaces to visualize spatial variation in accident intensity; and Google Earth–compatible KML files to facilitate operational visualization and practical decision-making.
4. Results
4.1. Descriptive Statistics of Accident Data
Accident counts show strong positive skewness and high kurtosis, indicating that accidents are unevenly distributed across space. Most locations experience few accidents, while a small number of sites record repeated incidents. This statistical structure supports the use of hotspot-based spatial analysis rather than uniform safety interventions.

Table 1.
Summary statistics of accident counts in Jega.
| Statistic | Value |
| Number of locations | 50 |
| Total recorded accidents | 104 |
| Mean accidents per location | 2.08 |
| Median accidents | 2 |
| Minimum | 1 |
| Maximum | 7 |
| Standard deviation | 1.63 |
| Variance | 2.66 |
| Skewness | 1.21 |
| Kurtosis | 1.87 |
4.2. Distributional Characteristics of Accident Counts
The histogram (Figure. 2) reveals a right-skewed distribution, while the box and violin plots (Figure 3 and Figure 4) highlight upper-end outliers.
Figure 2.
Histogram of accident counts.
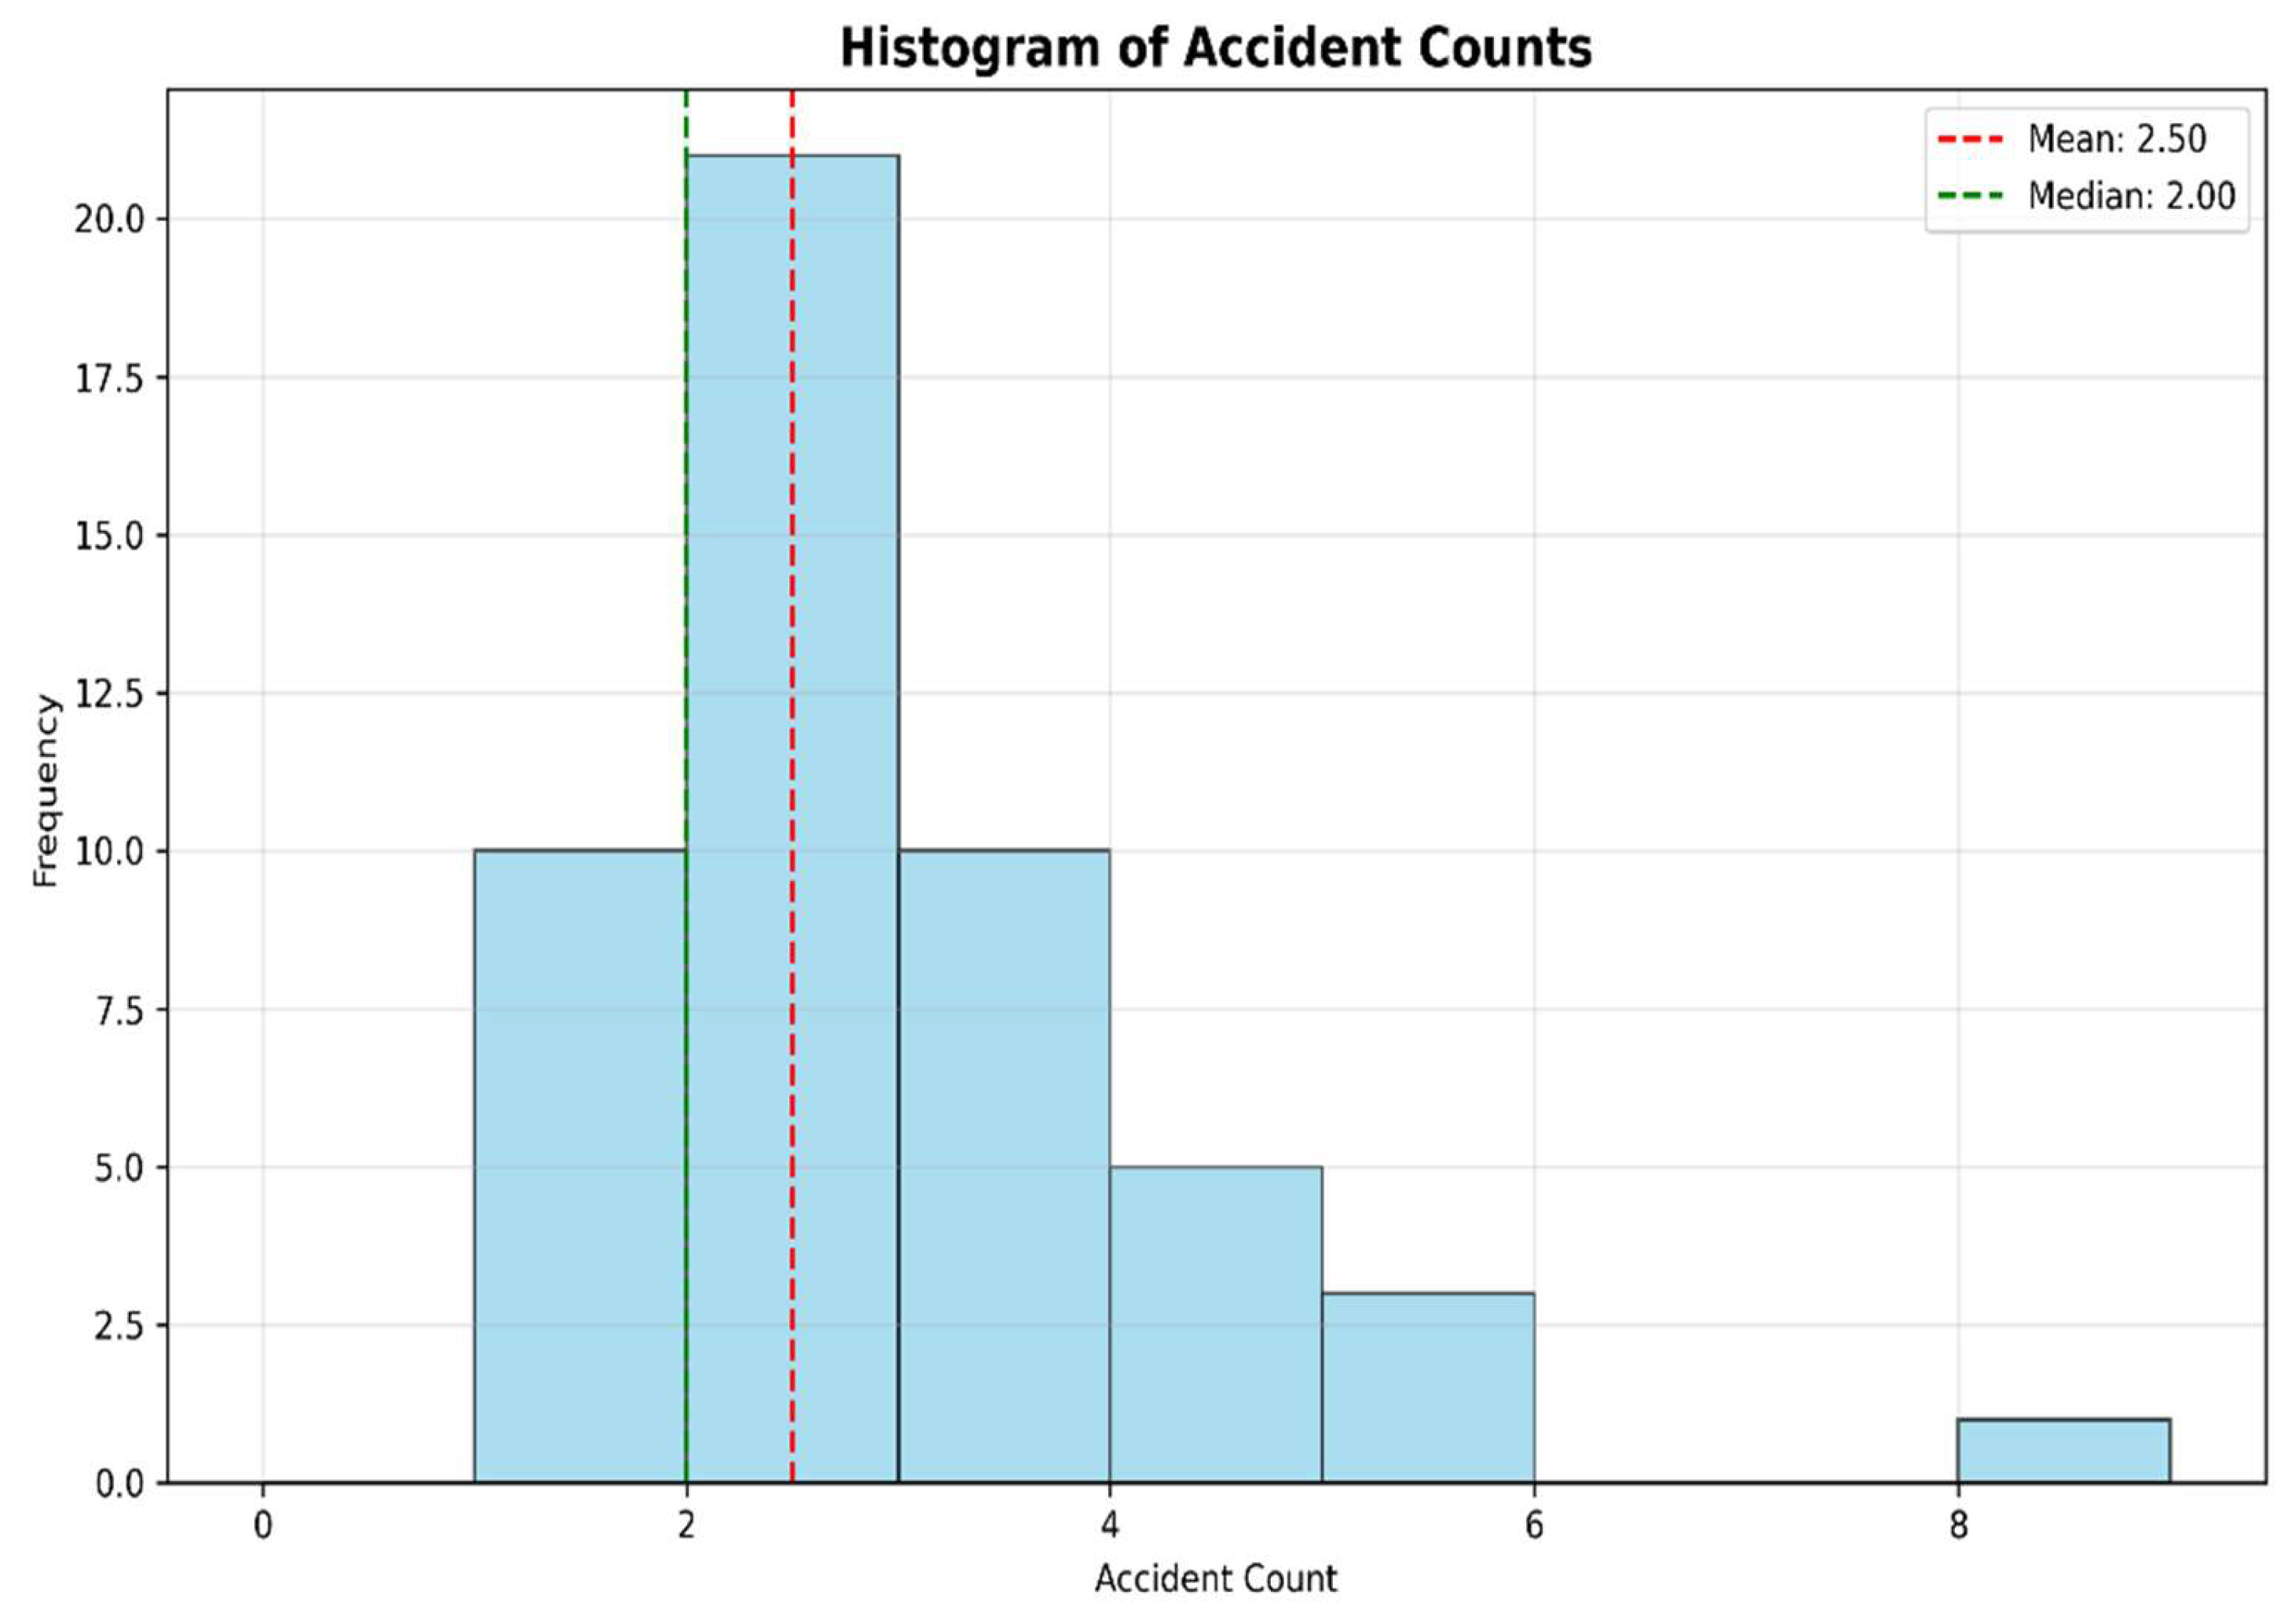
Figure 3.
Box plot of accident counts.
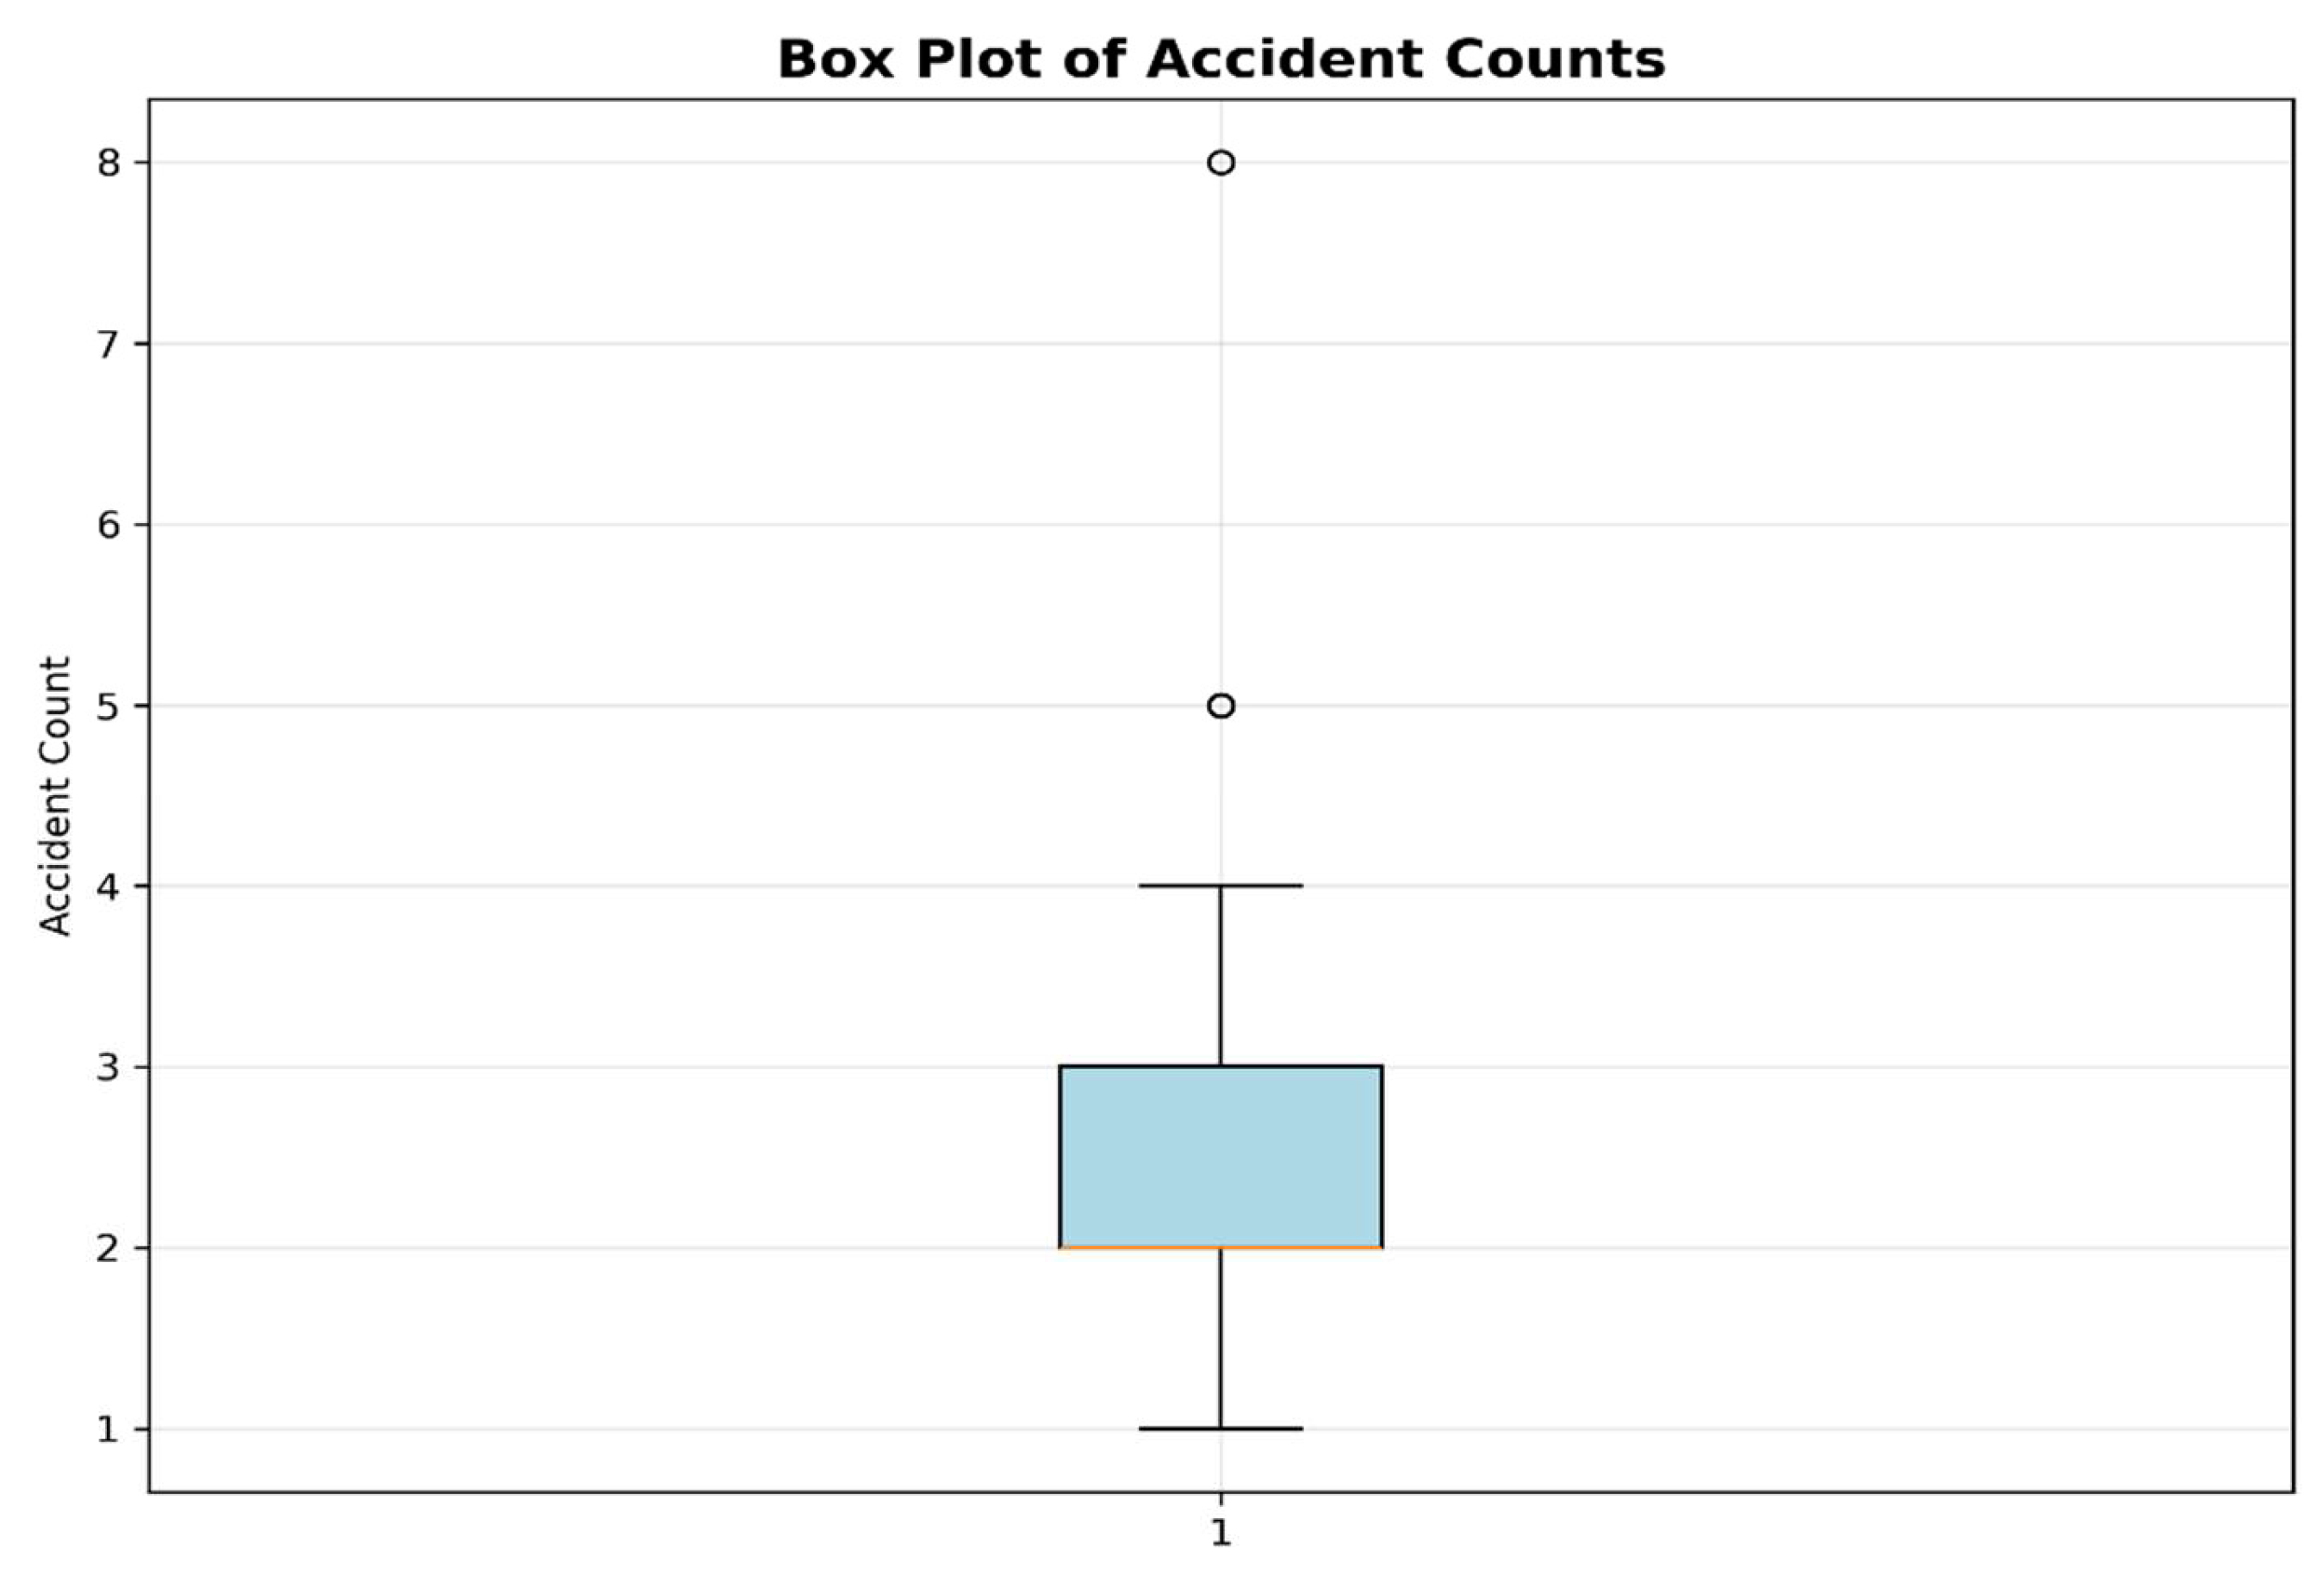
Figure 4.
Violin plot of accident counts.
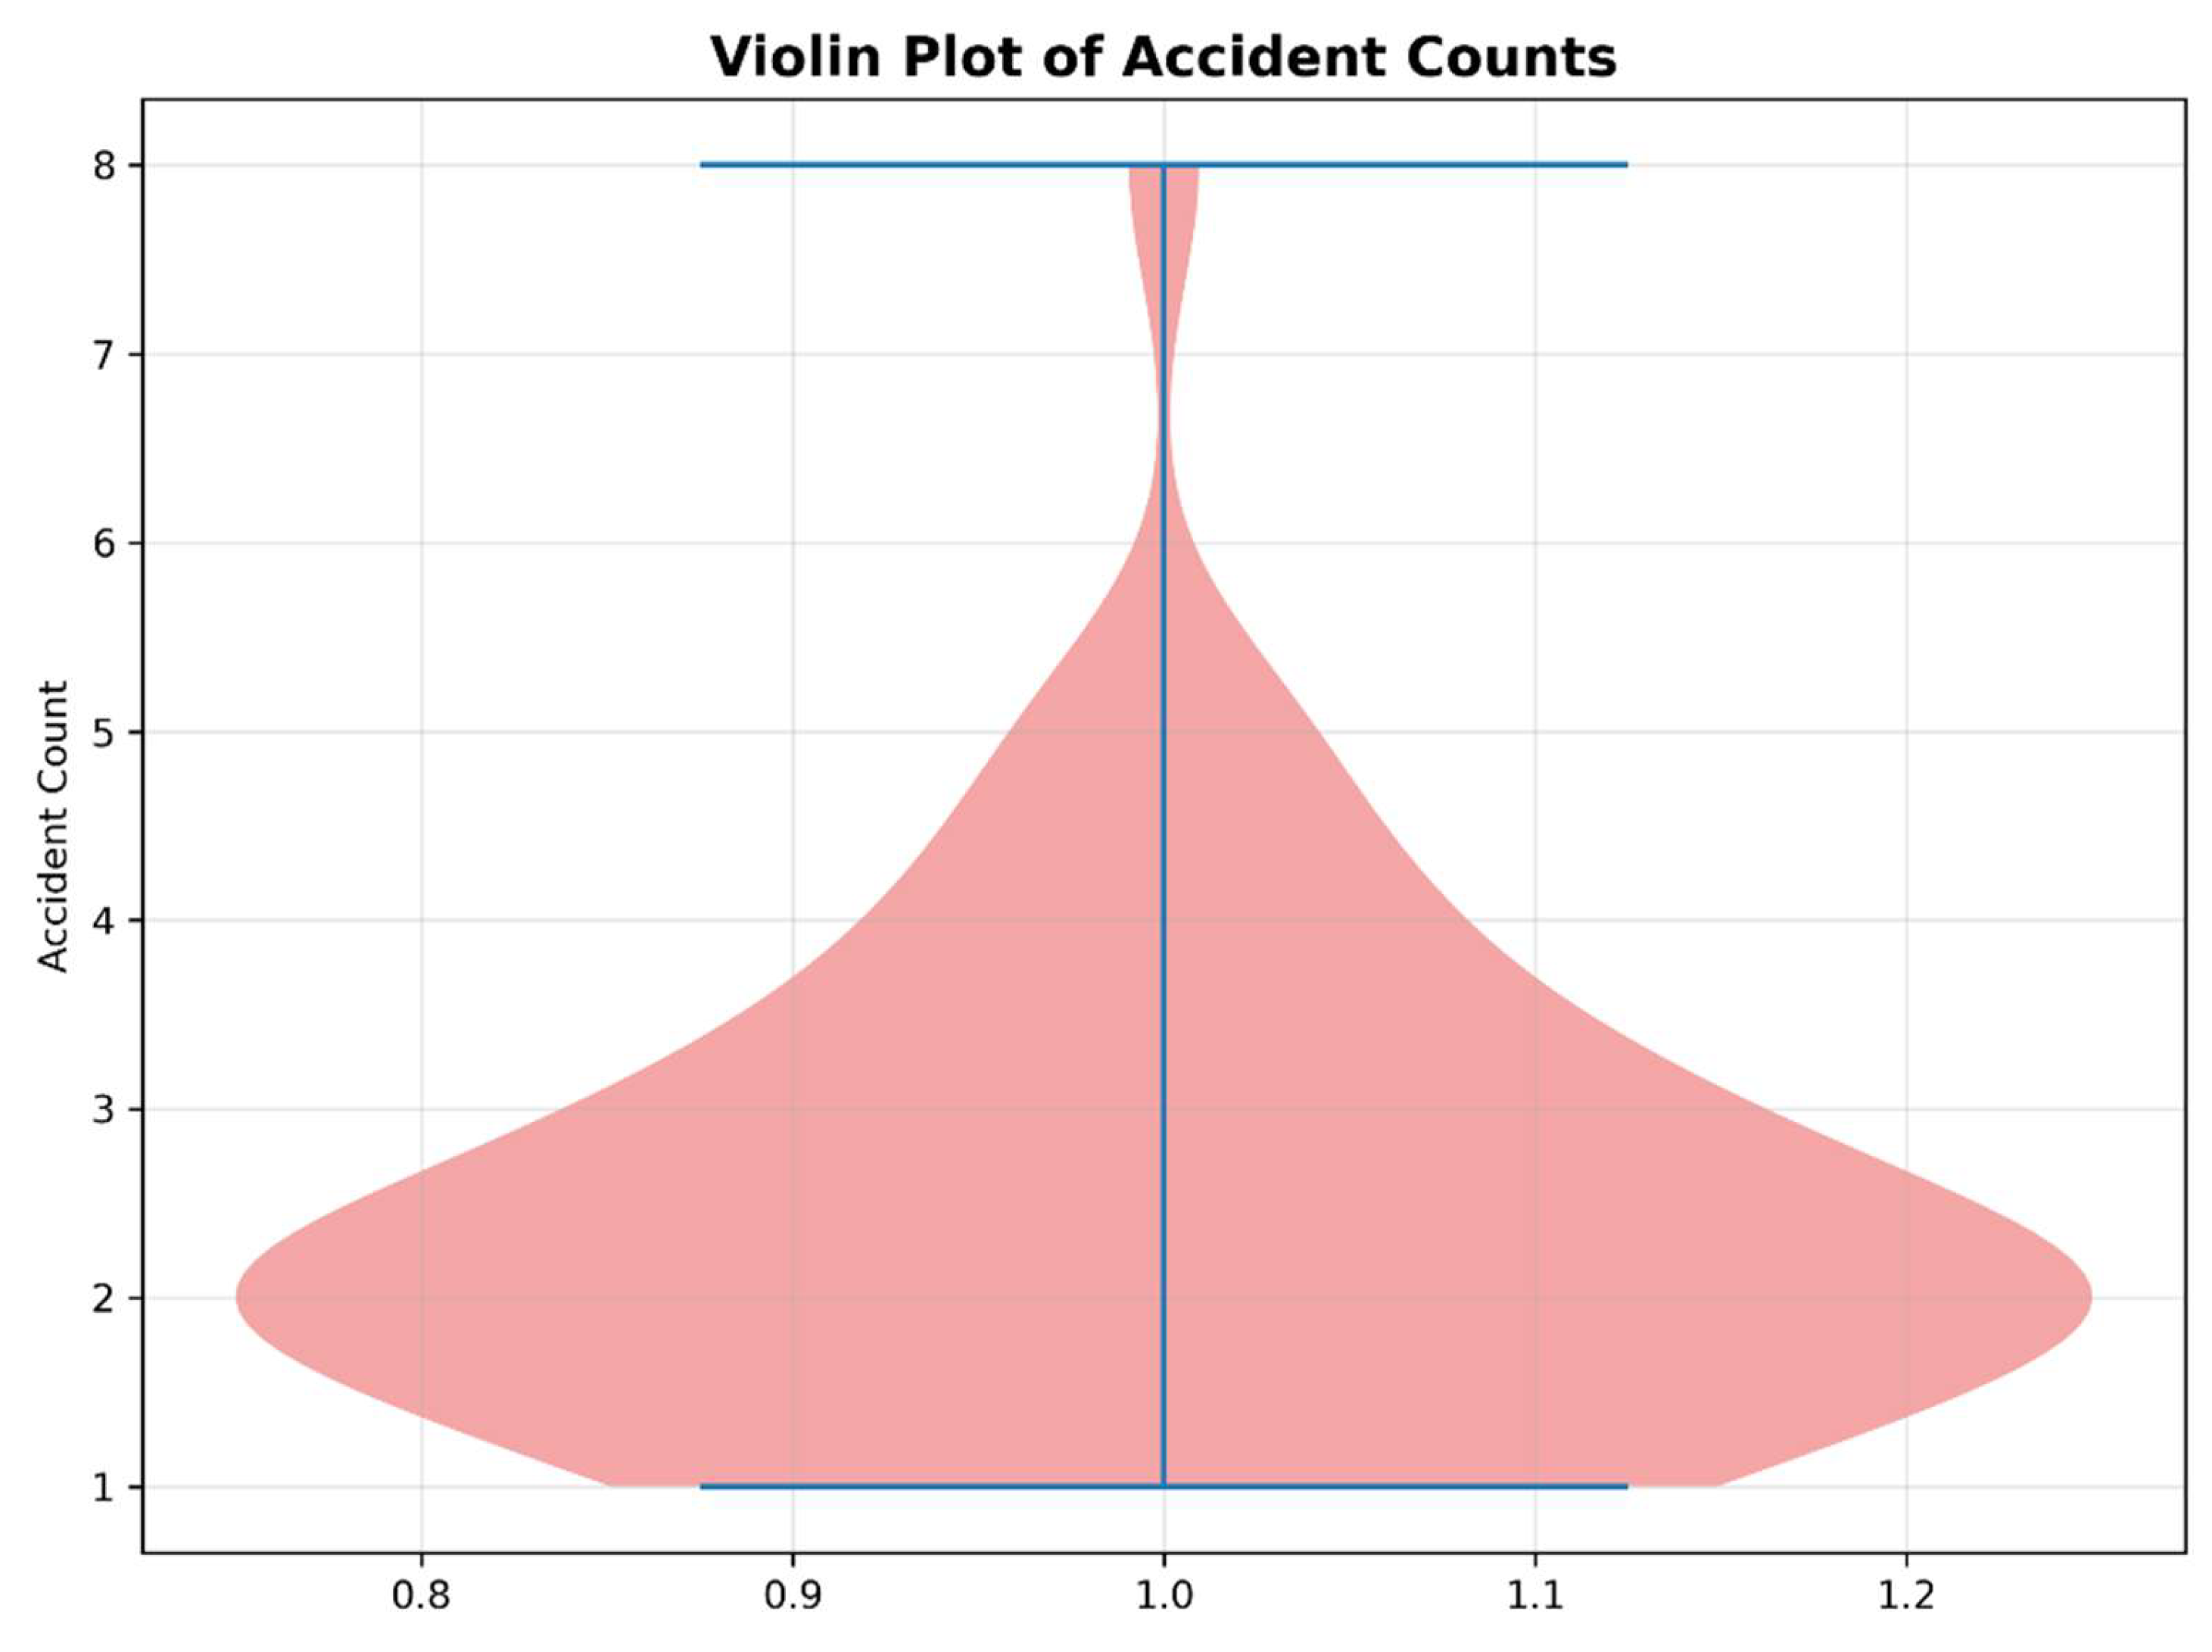
The separation between the mean and median, combined with visible outliers, confirms that a limited number of locations disproportionately contribute to total accident frequency, a pattern consistent with previous hotspot studies.
4.3. Spatial Distribution of Observed Accident Locations
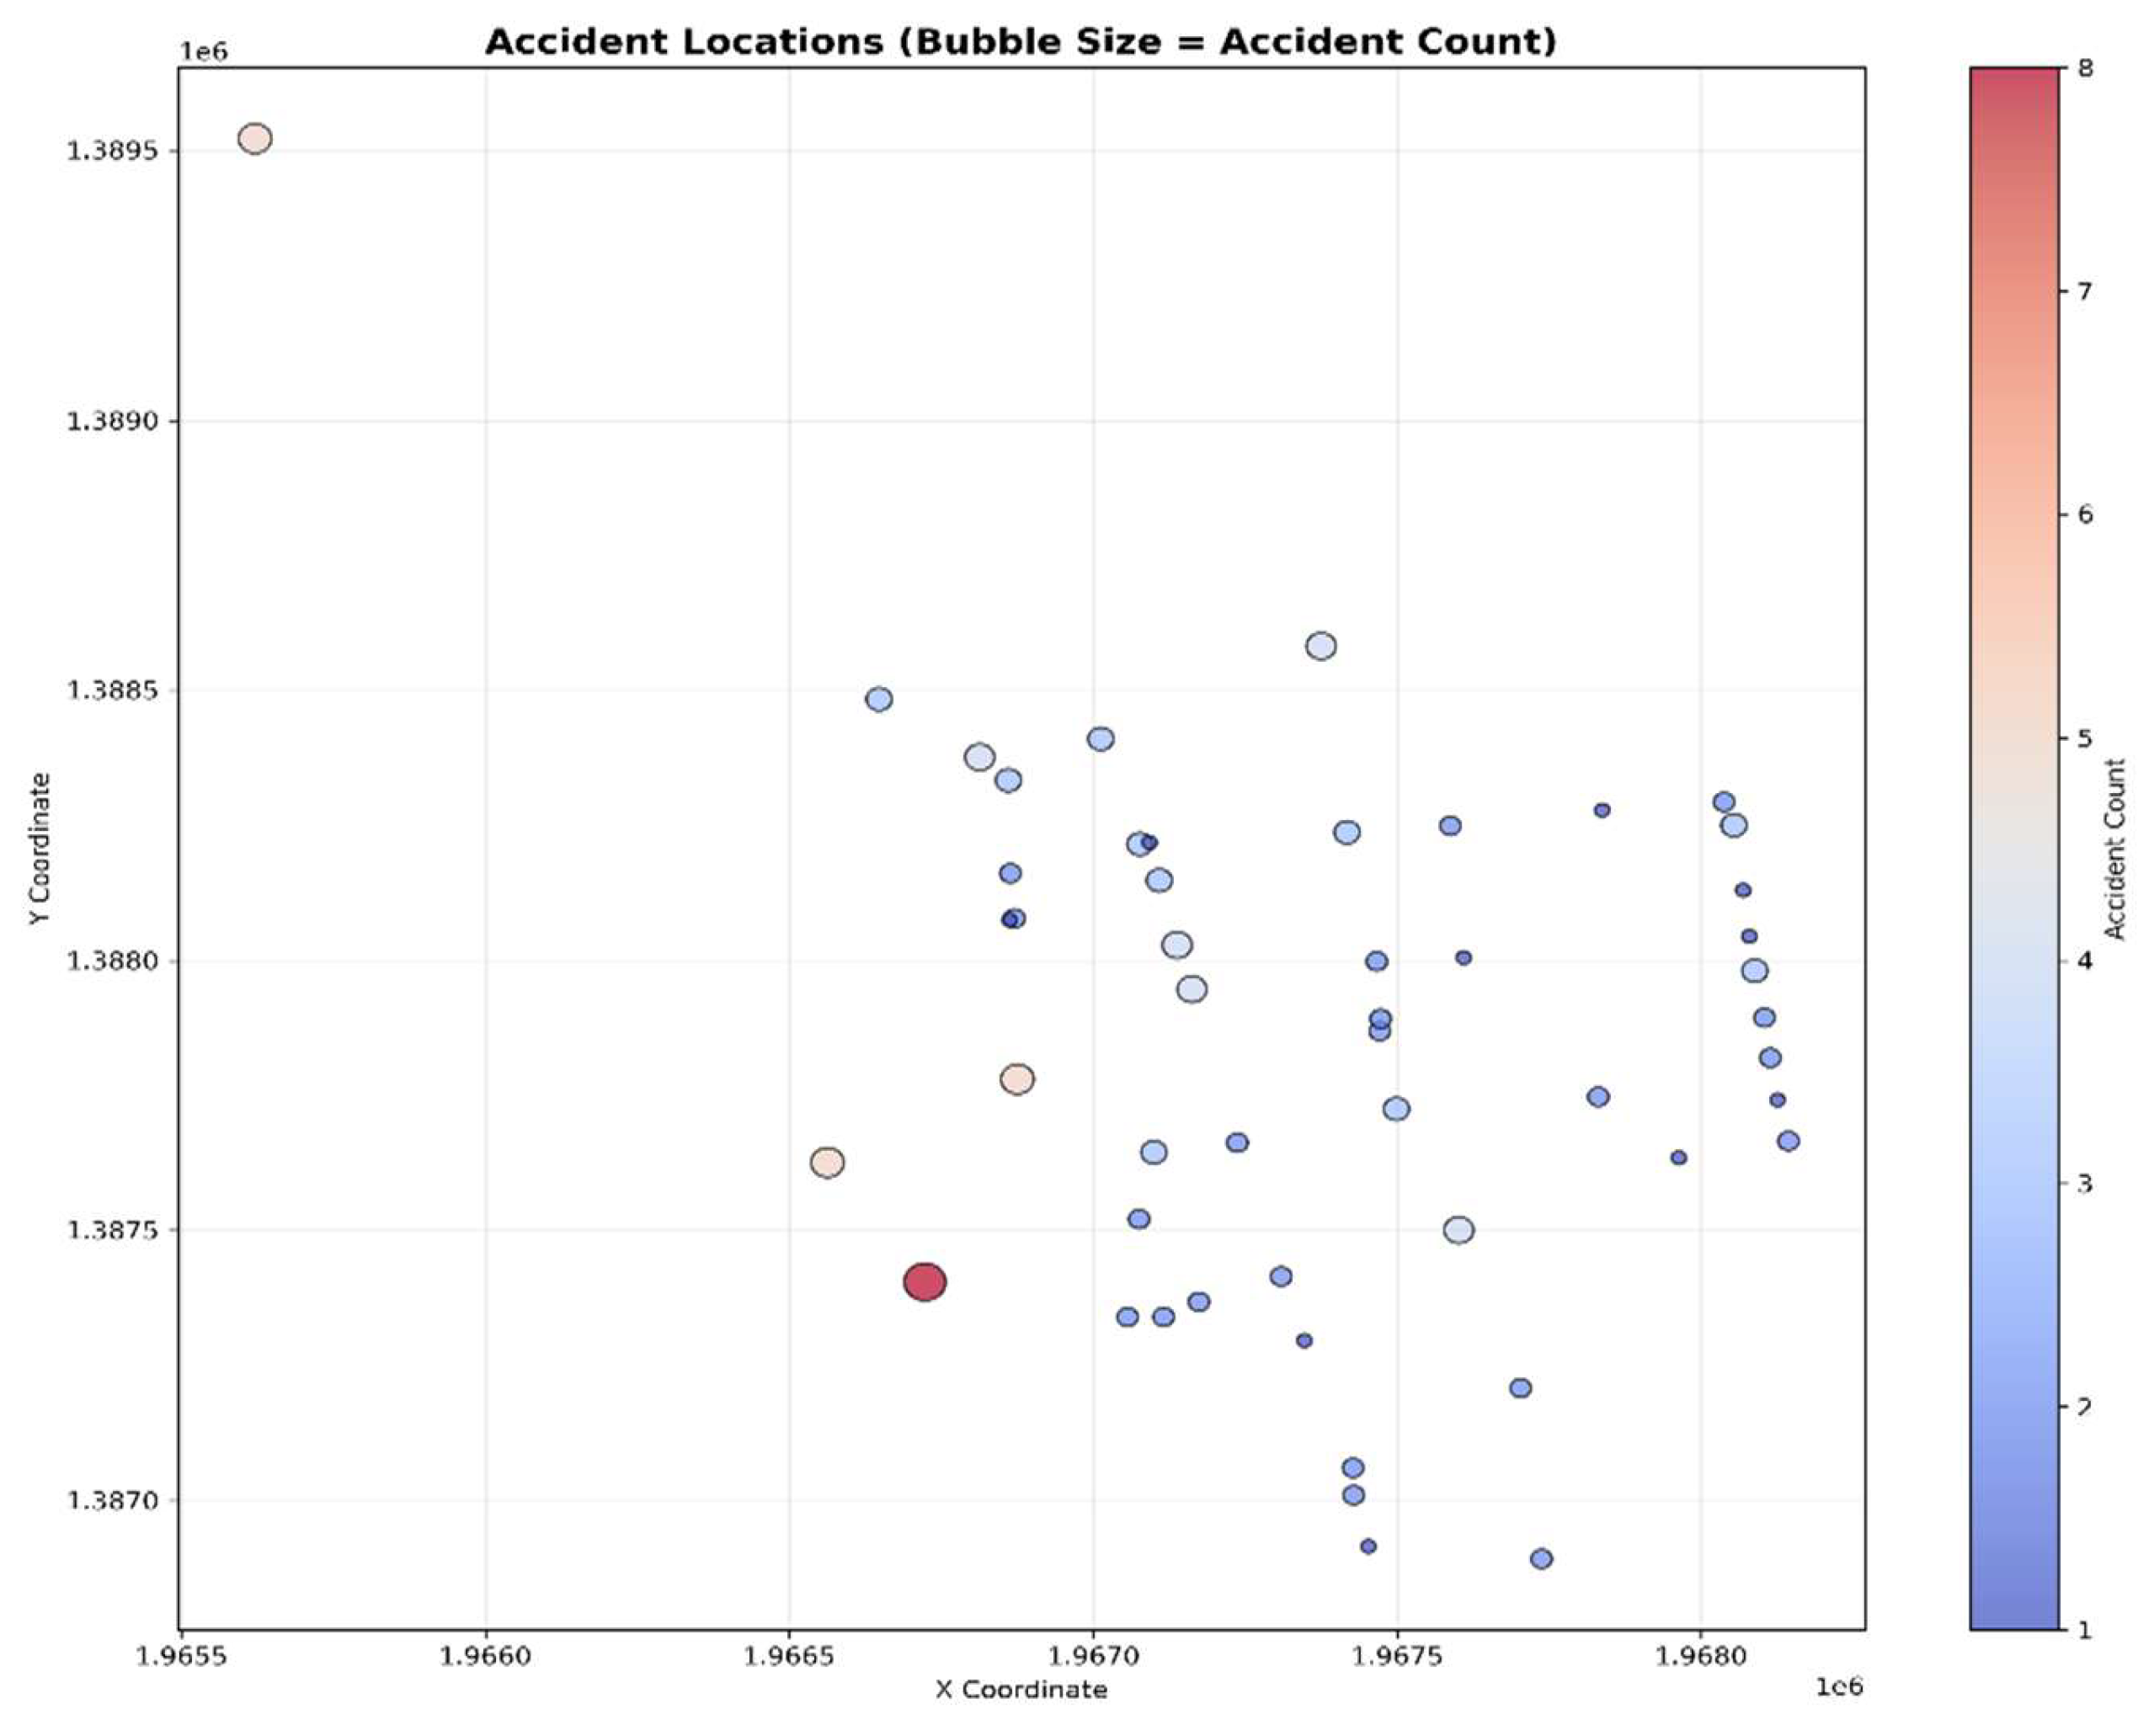
Observed accidents are spatially clustered, with larger bubbles concentrated around major junctions and traffic corridors. This indicates the influence of localized factors such as traffic volume, road geometry, and pedestrian activity.
Figure 5.
Bubble scatter map of accident locations.
4.4. IDW Spatial Interpolation Results
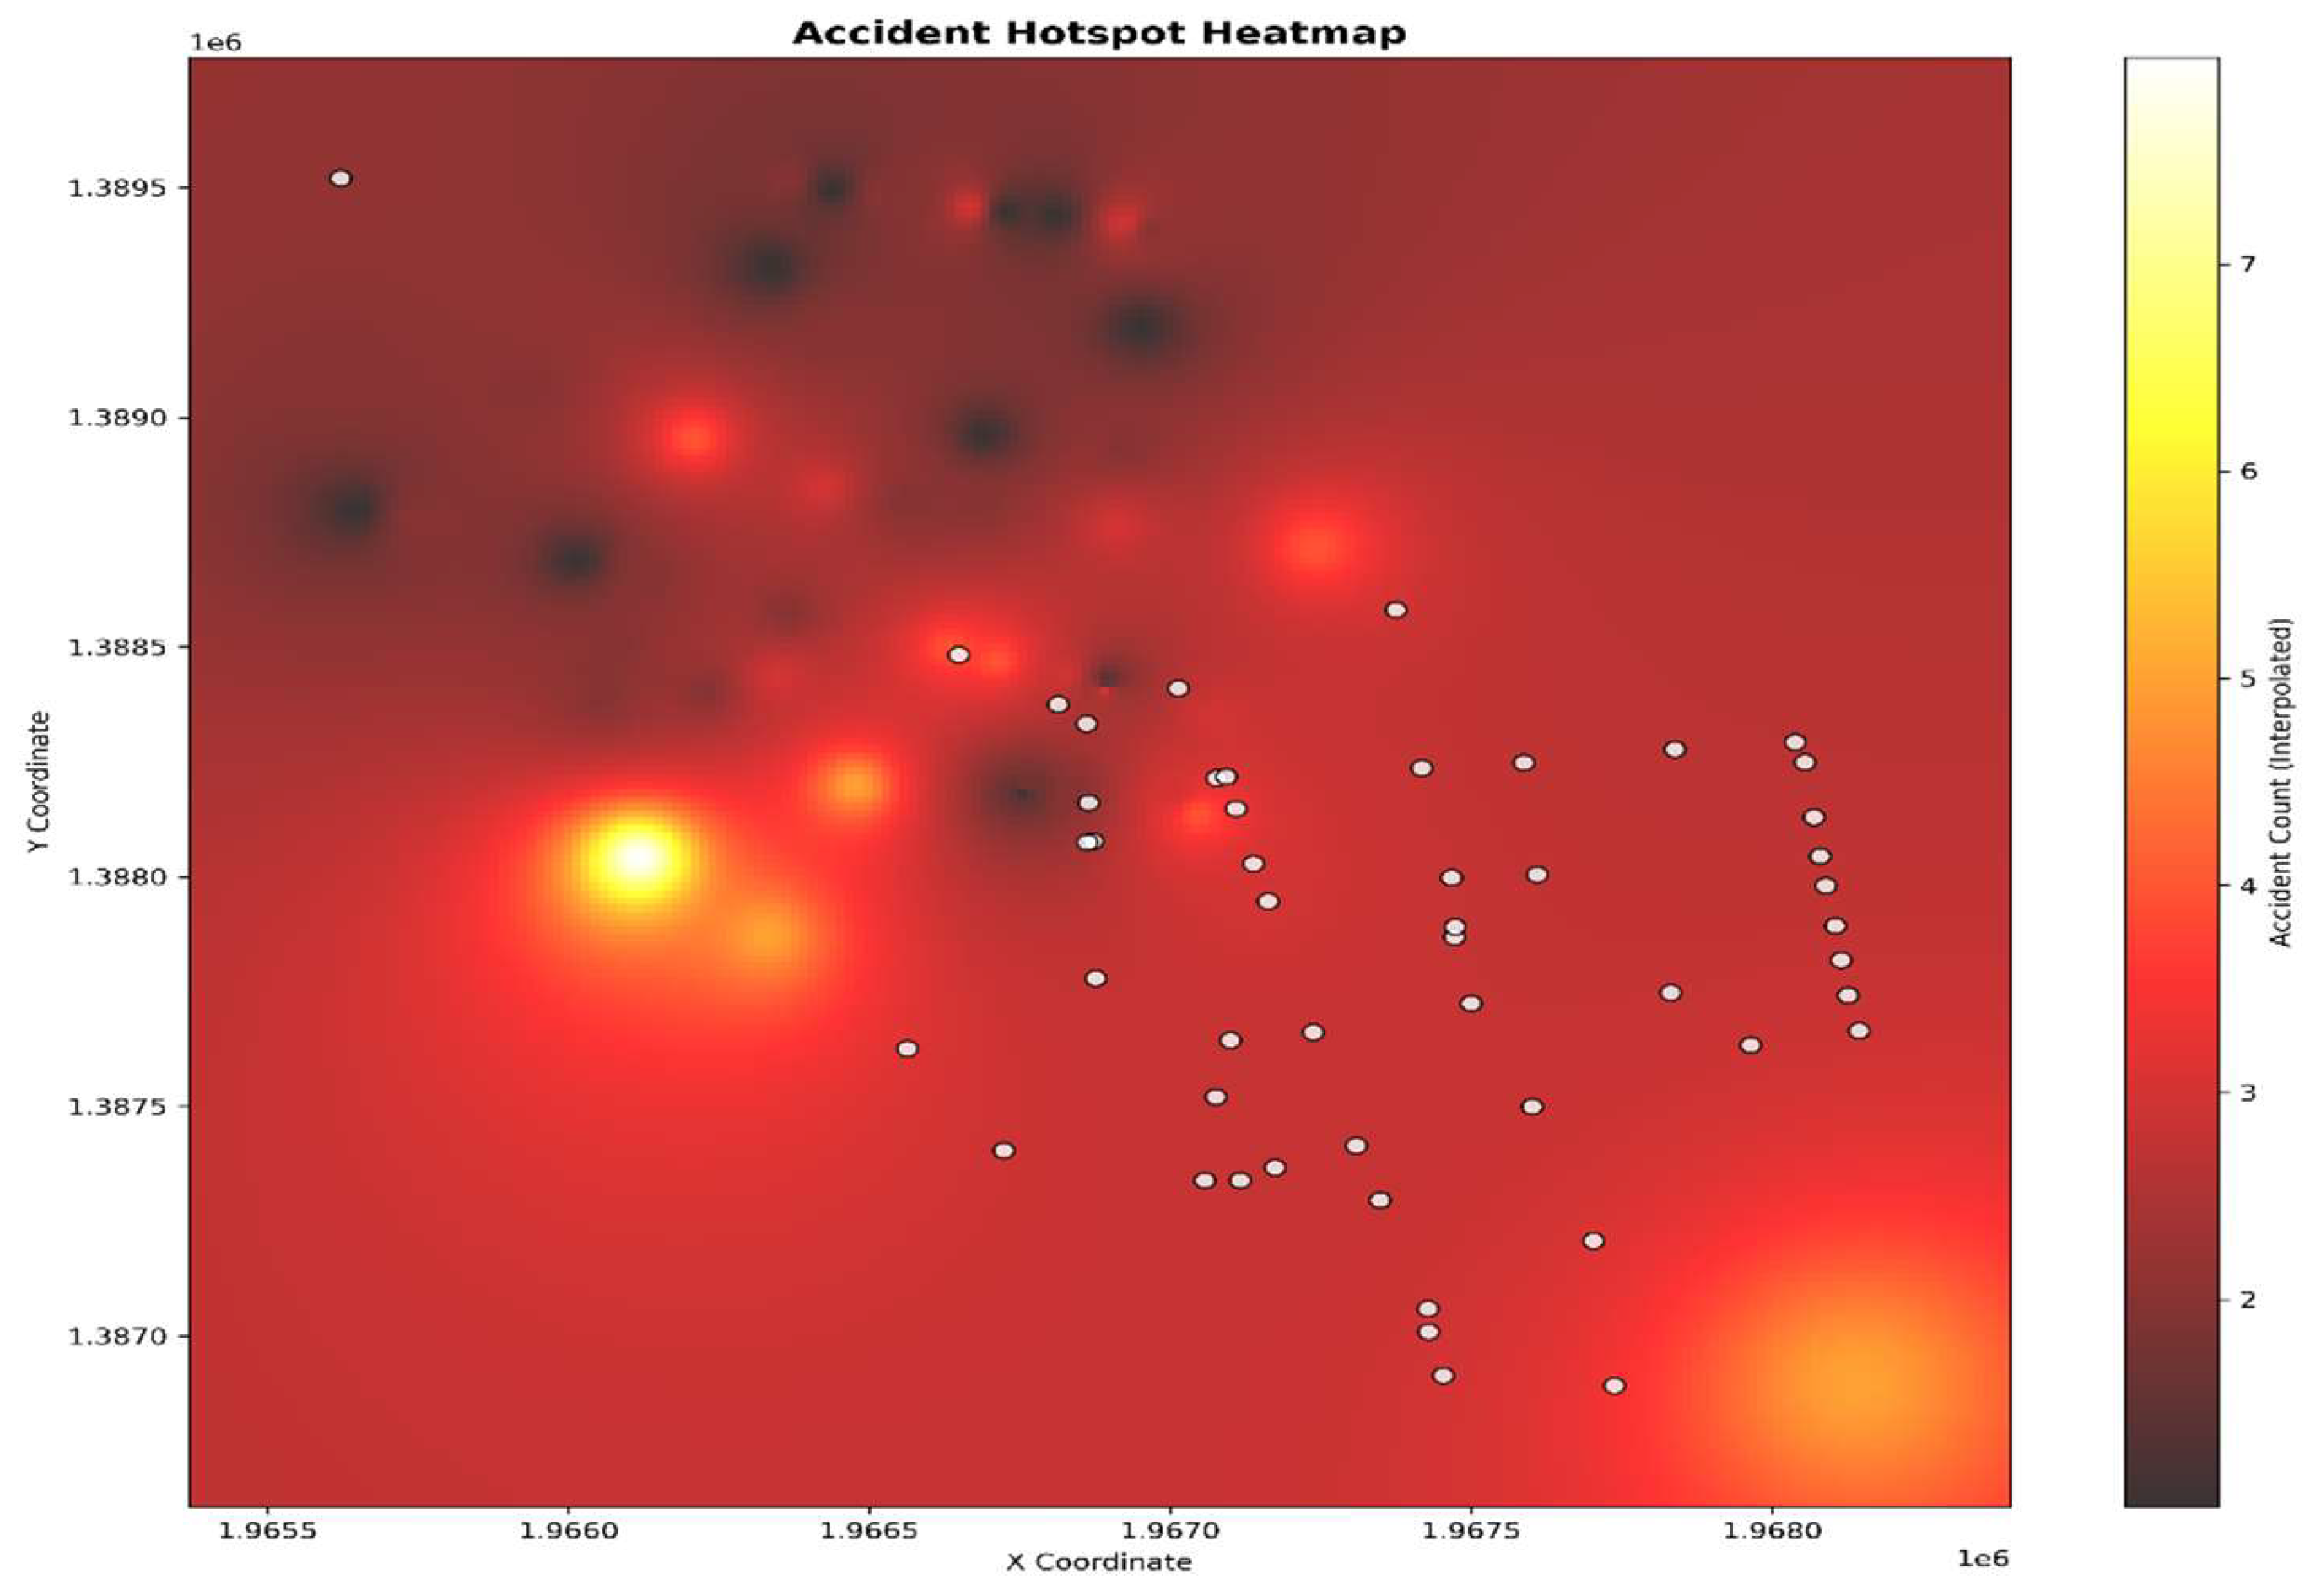
The IDW surface reveals clear spatial gradients in accident intensity, with pronounced peaks around known high-accident locations. The interpolation effectively captures localized risk without requiring auxiliary explanatory variables.
Figure 6.
IDW interpolated accident surface with hotspot overlay.
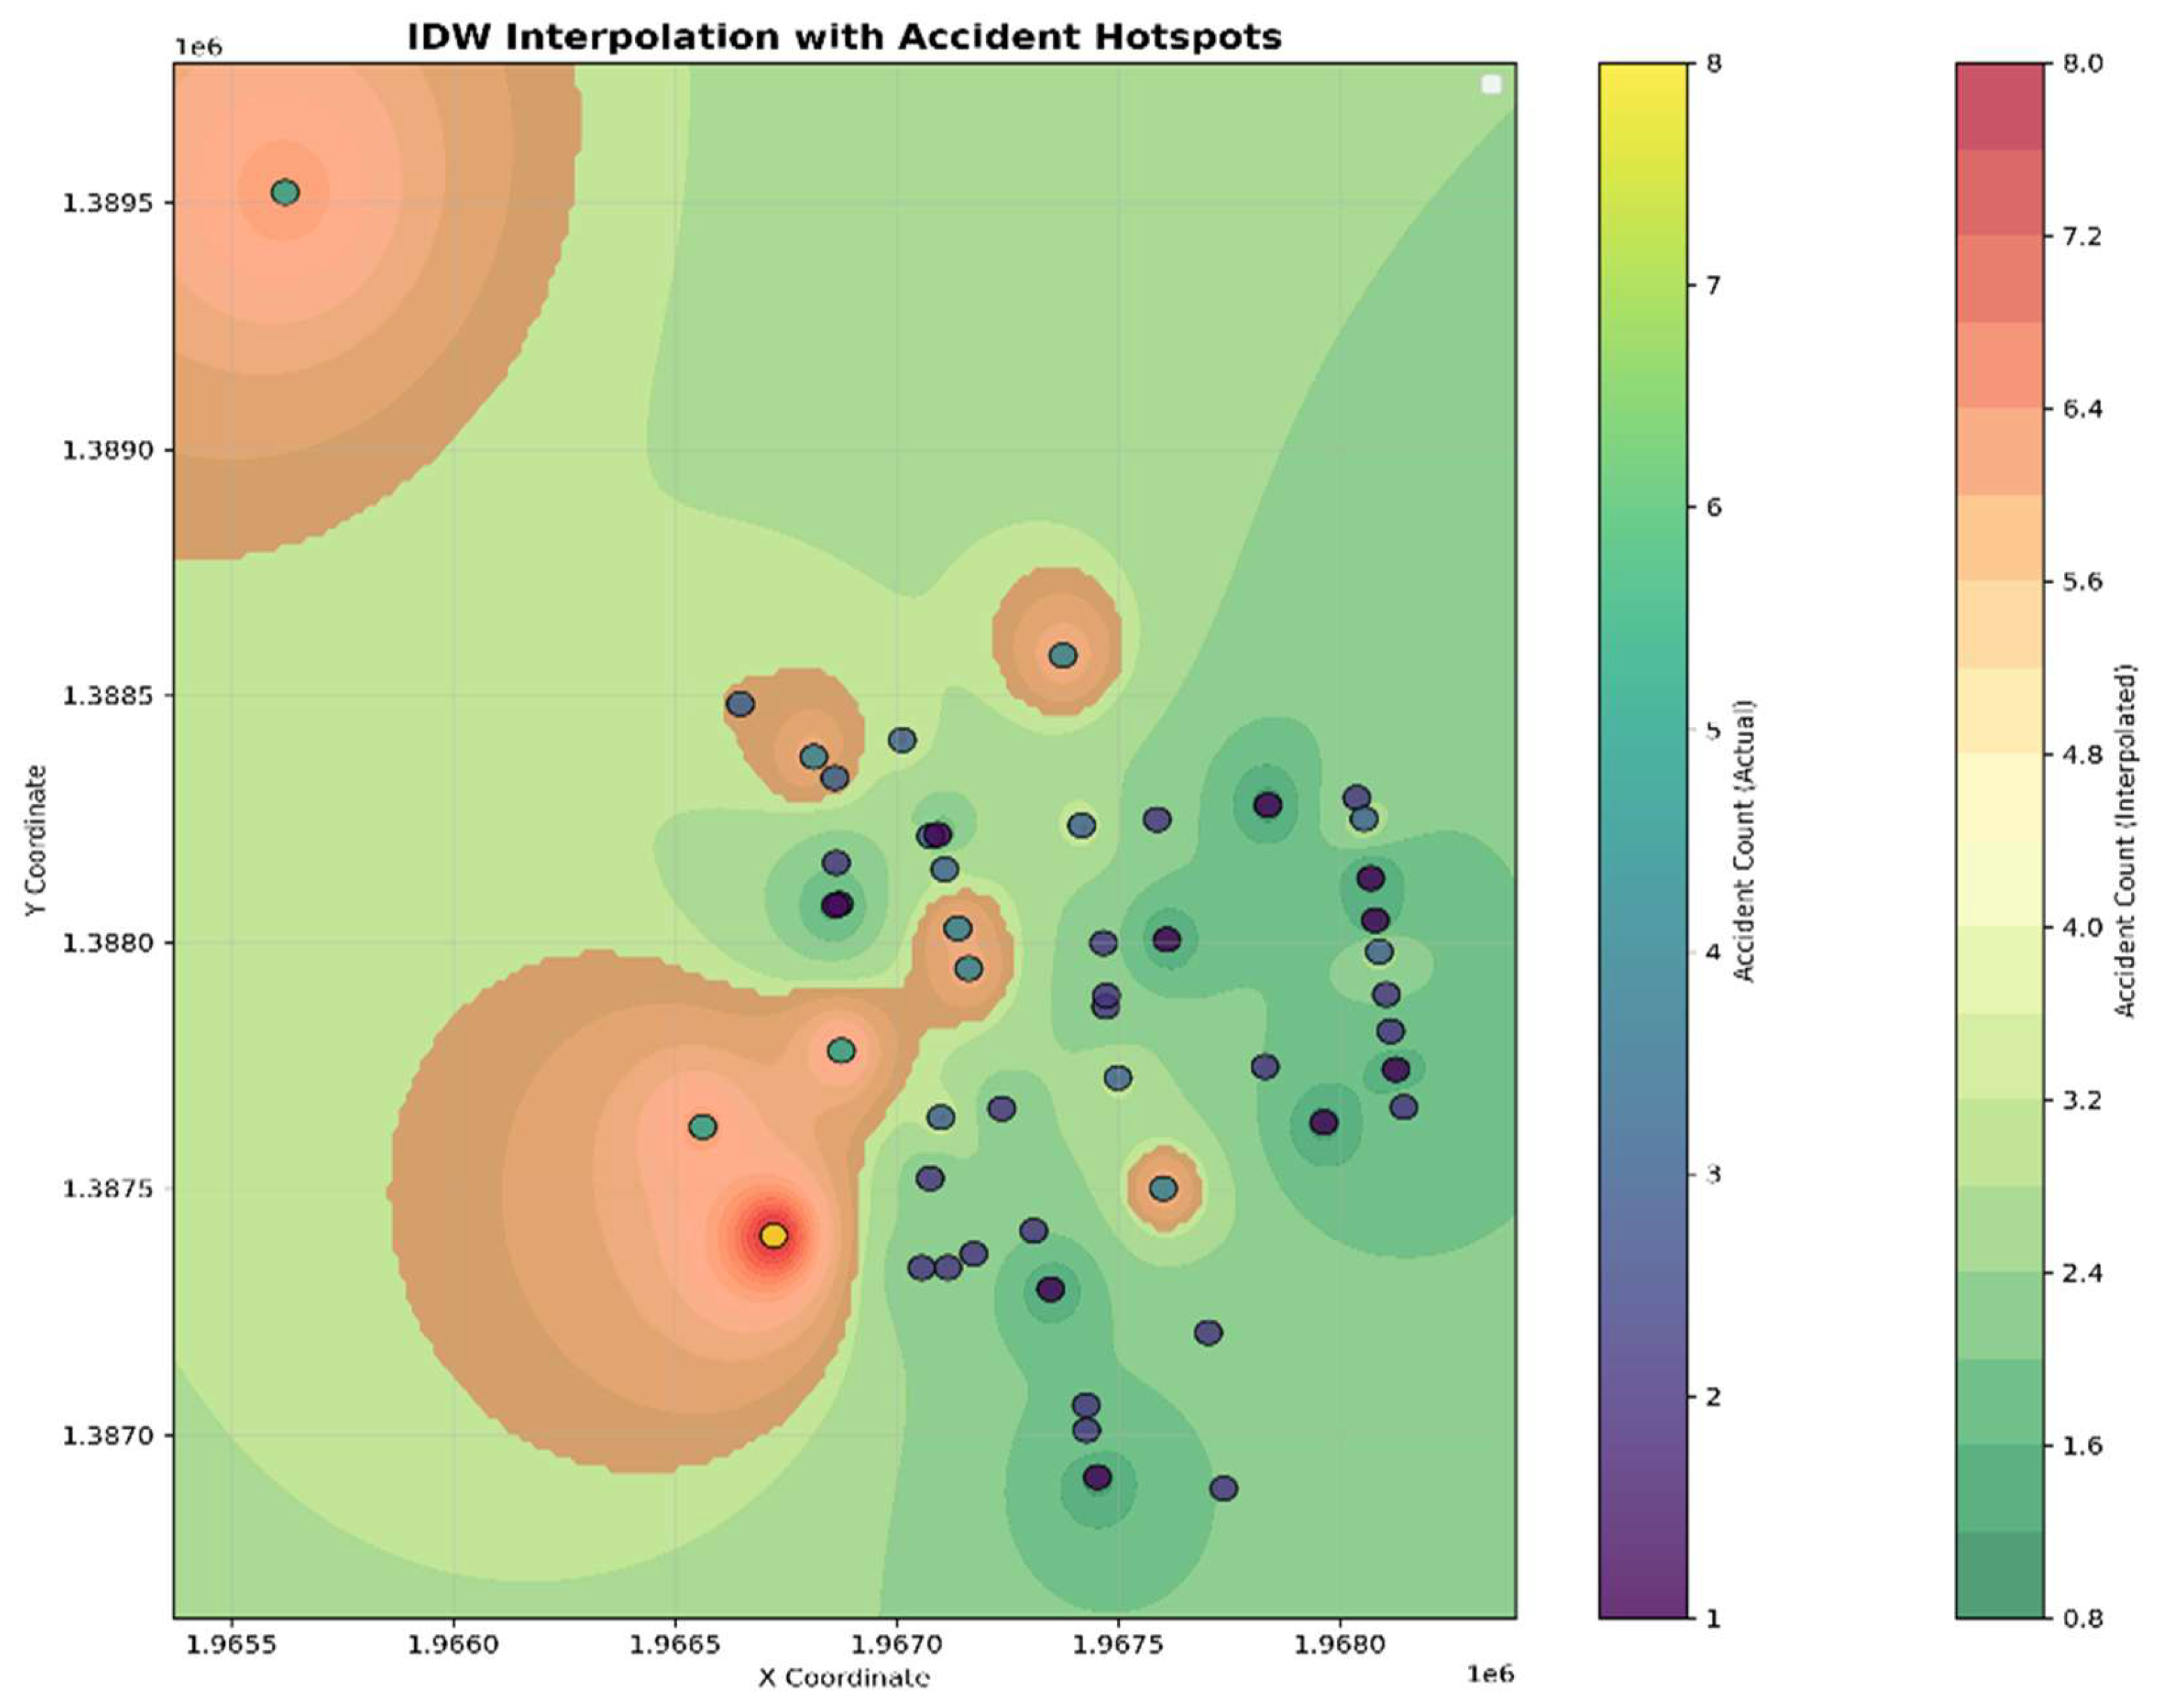
Table 2.
IDW interpolation parameters.
| Parameter | Specification |
| Interpolation method | Inverse Distance Weighting |
| Power parameter (p) | 2 |
| Grid resolution | 200 × 200 |
| Spatial buffer | 10% |
| Coordinate system | UTM (projected) |
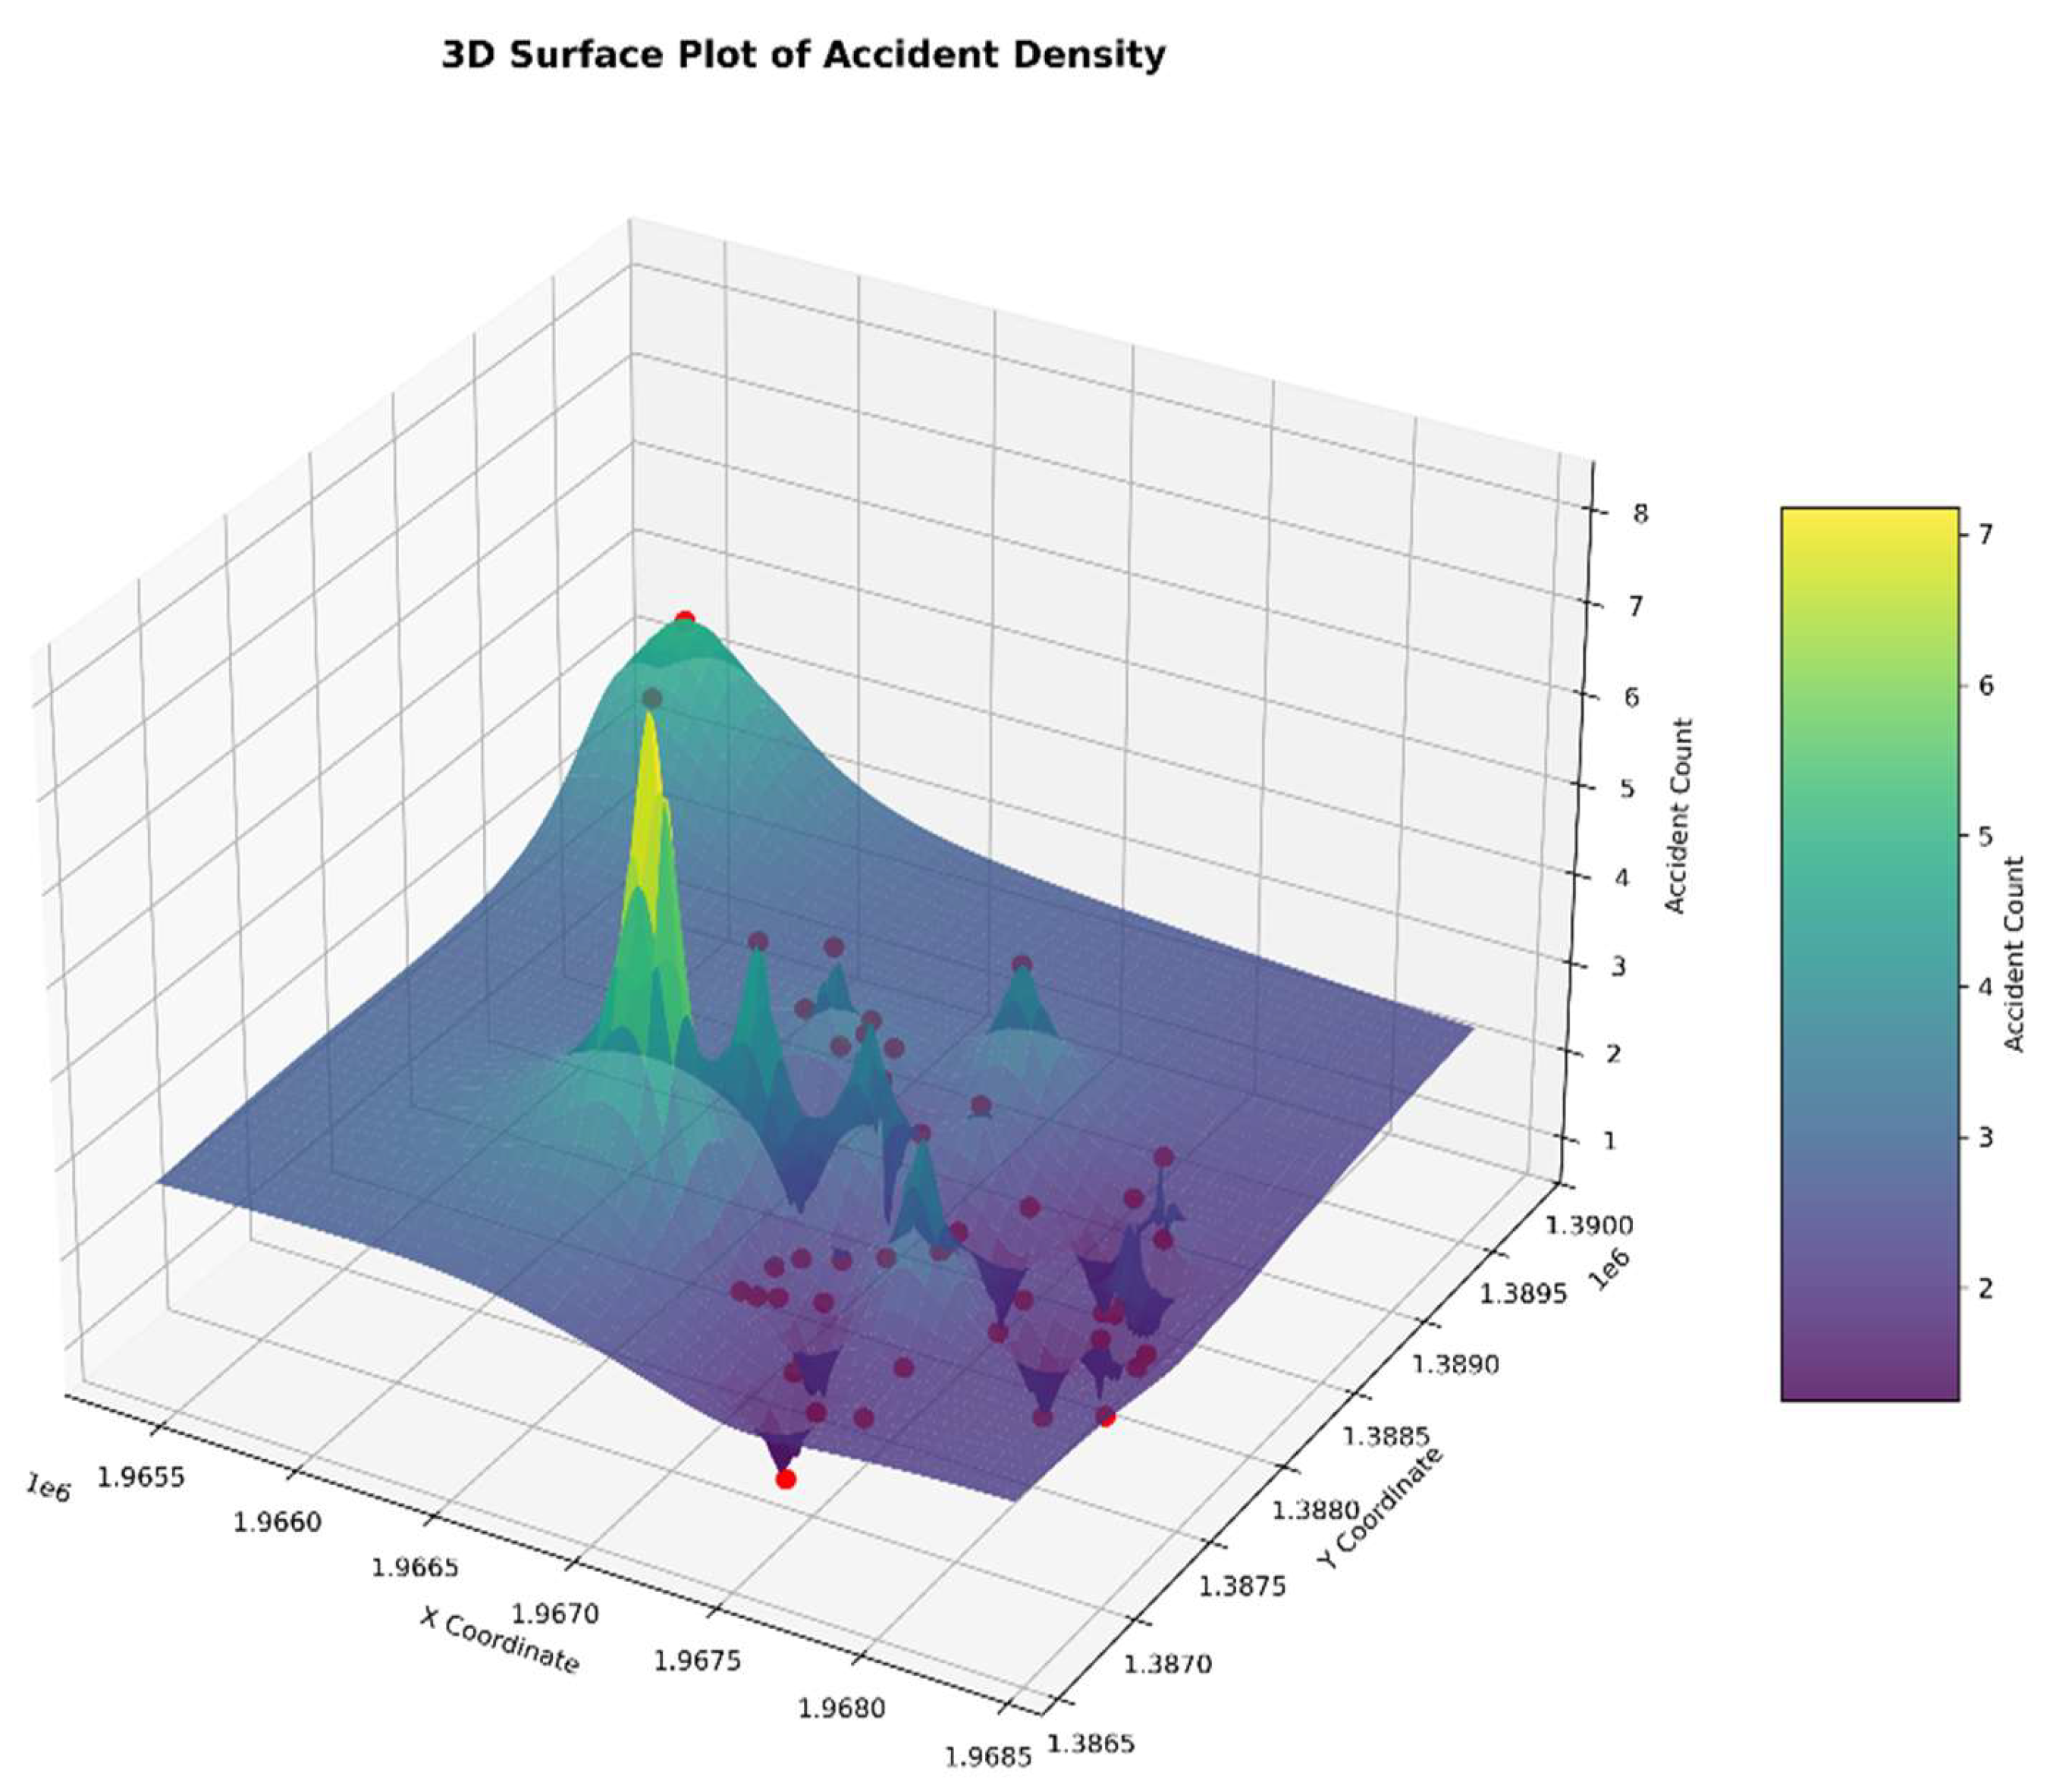
Figure 7.
3D surface of IDW accident intensity.
4.5. Hotspot Identification and Spatial Concentration
Hotspot zones occupy a small fraction of the study area but represent regions of elevated accident intensity. This spatial concentration implies that targeted interventions within these zones could yield disproportionately large safety benefits.
Table 3.
Hotspot identification criteria.
| Attribute | Value |
| Threshold method | Percentile-based |
| Hotspot threshold | 80th percentile |
| Risk class identified | Top 20% |
| Spatial coverage | Limited area |
| Risk implication | High accident concentration |
Figure 8.
Contour map with hotspot zones.
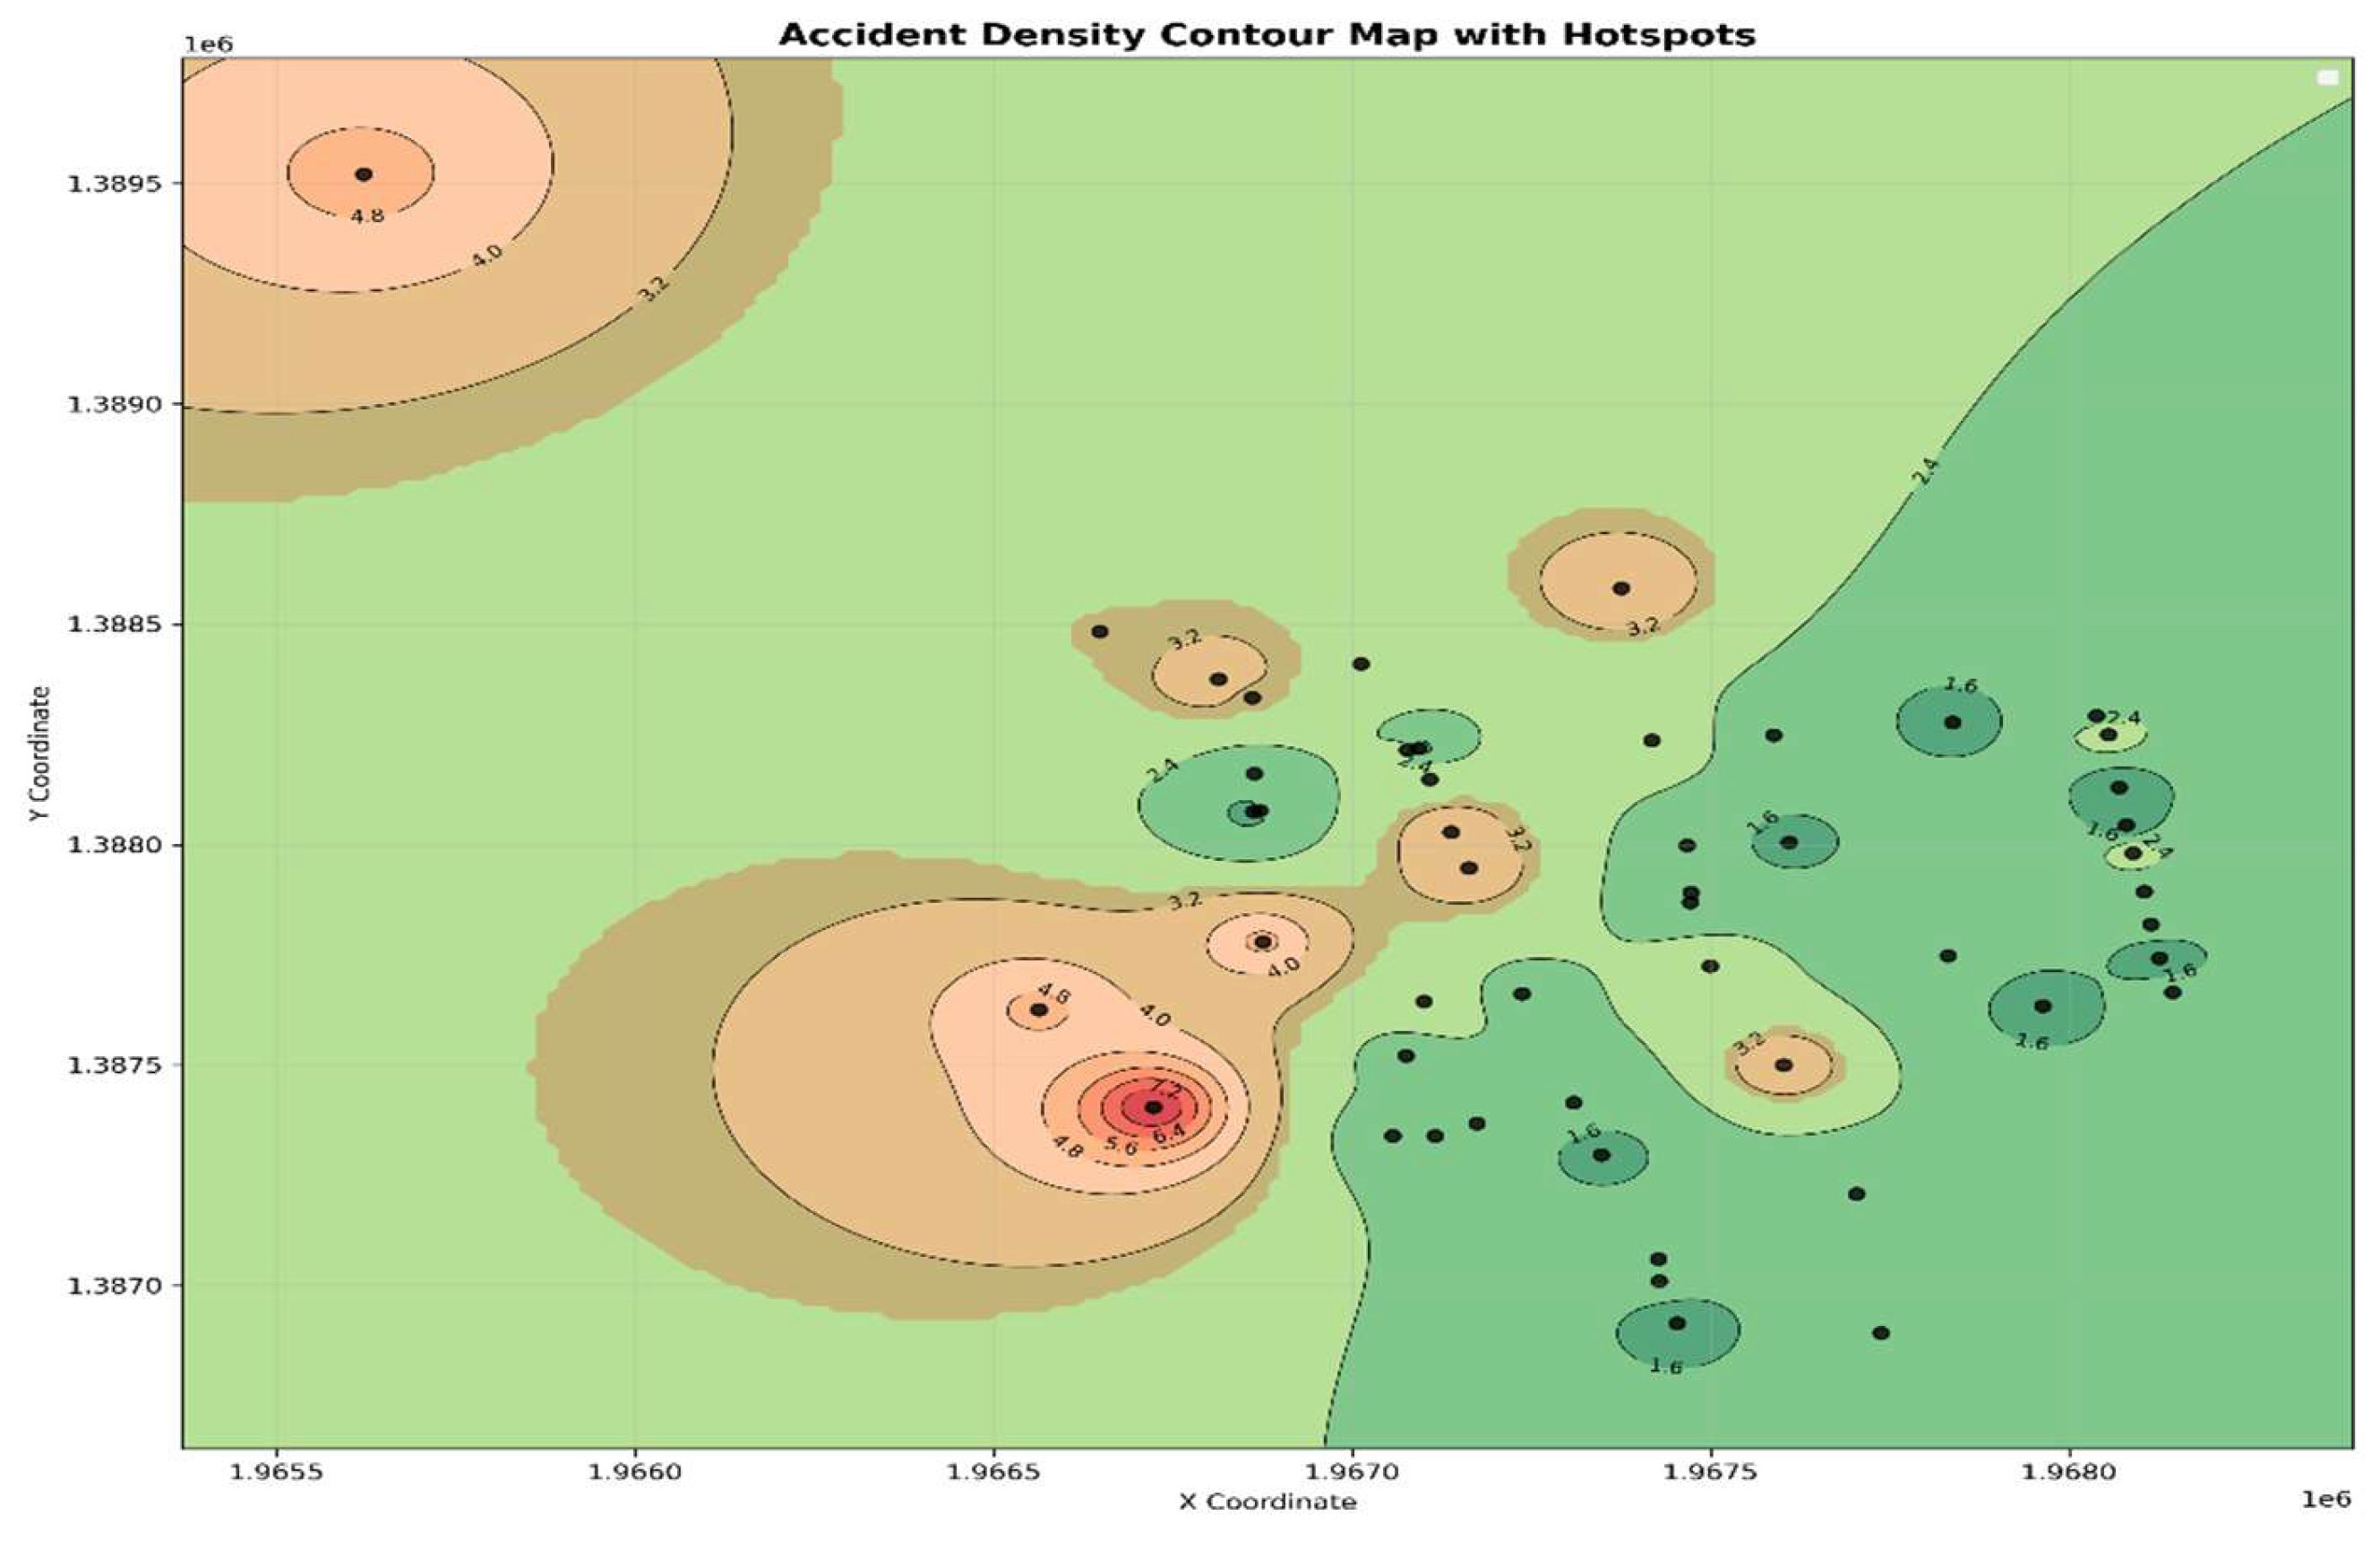
Figure 9.
IDW heatmap of accident intensity.
4.6. Inequality in Accident Occurrence
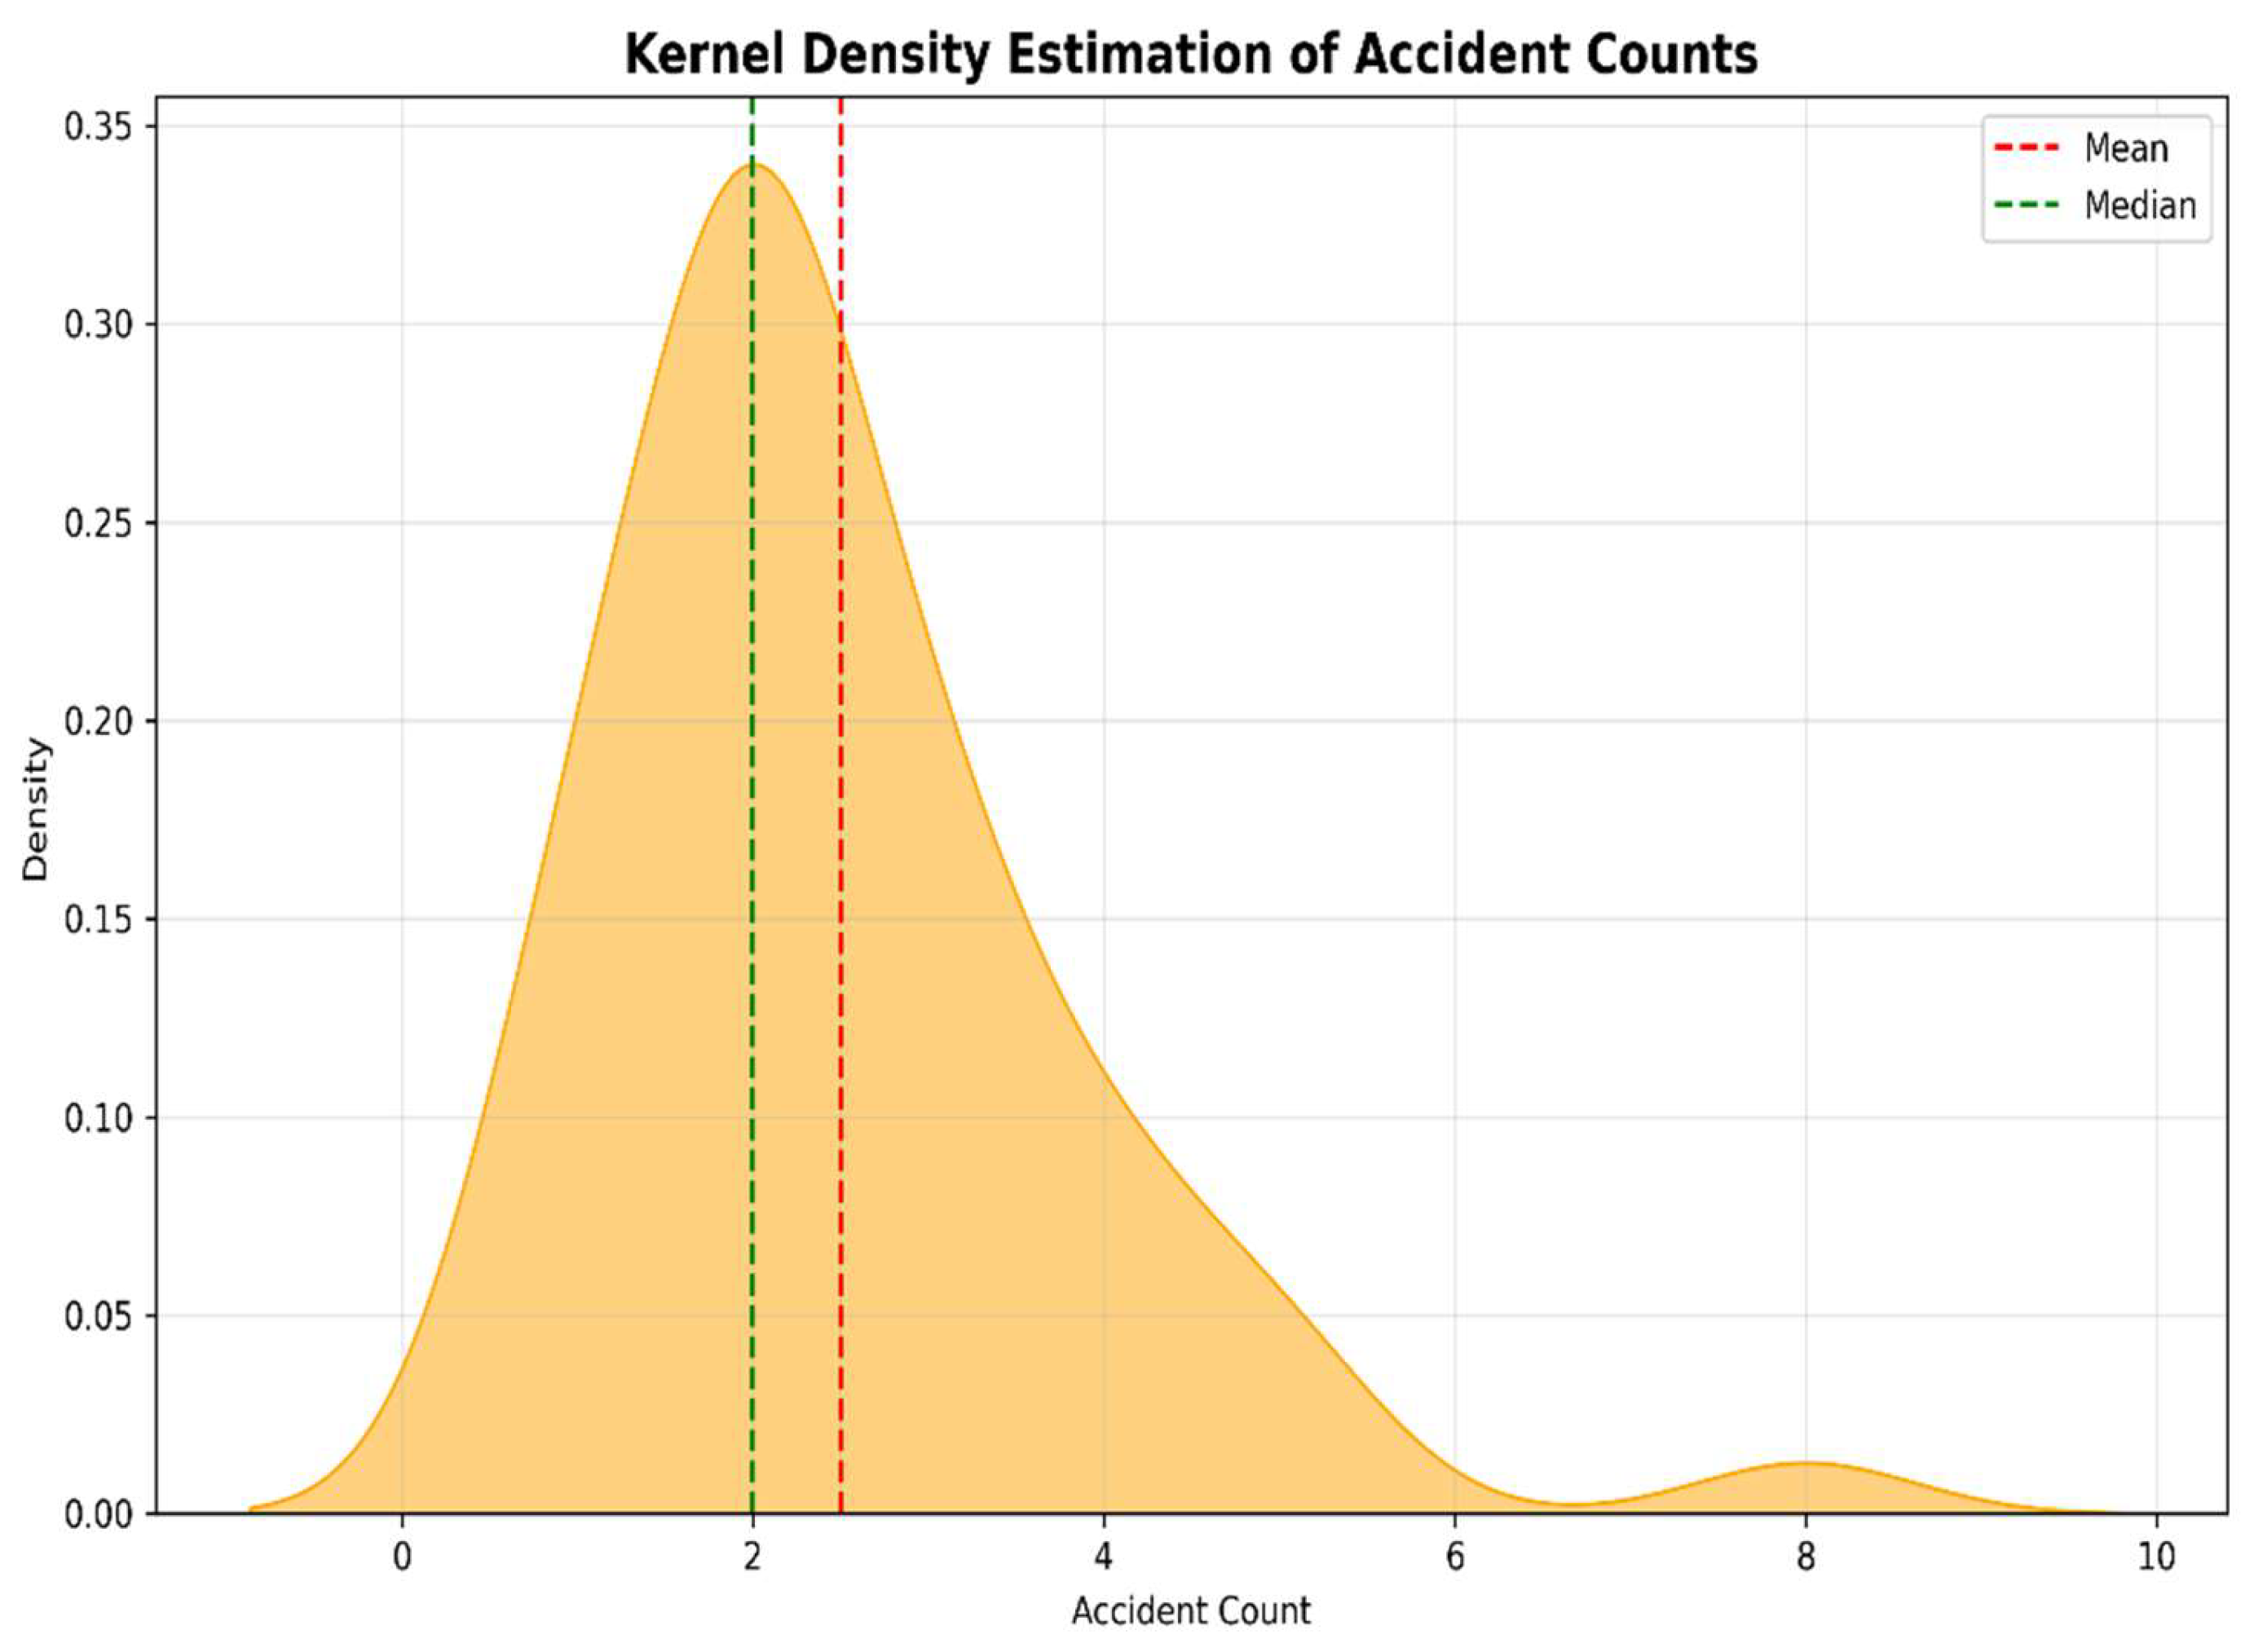
The CDF shows that a large proportion of accidents is contributed by a small percentage of locations, while the KDE confirms a dominant low-risk mode with a long upper tail. Together, these results demonstrate strong inequality in accident risk distribution, consistent with Pareto-type patterns reported in the literature.
Figure 10.
Cumulative distribution function (CDF).
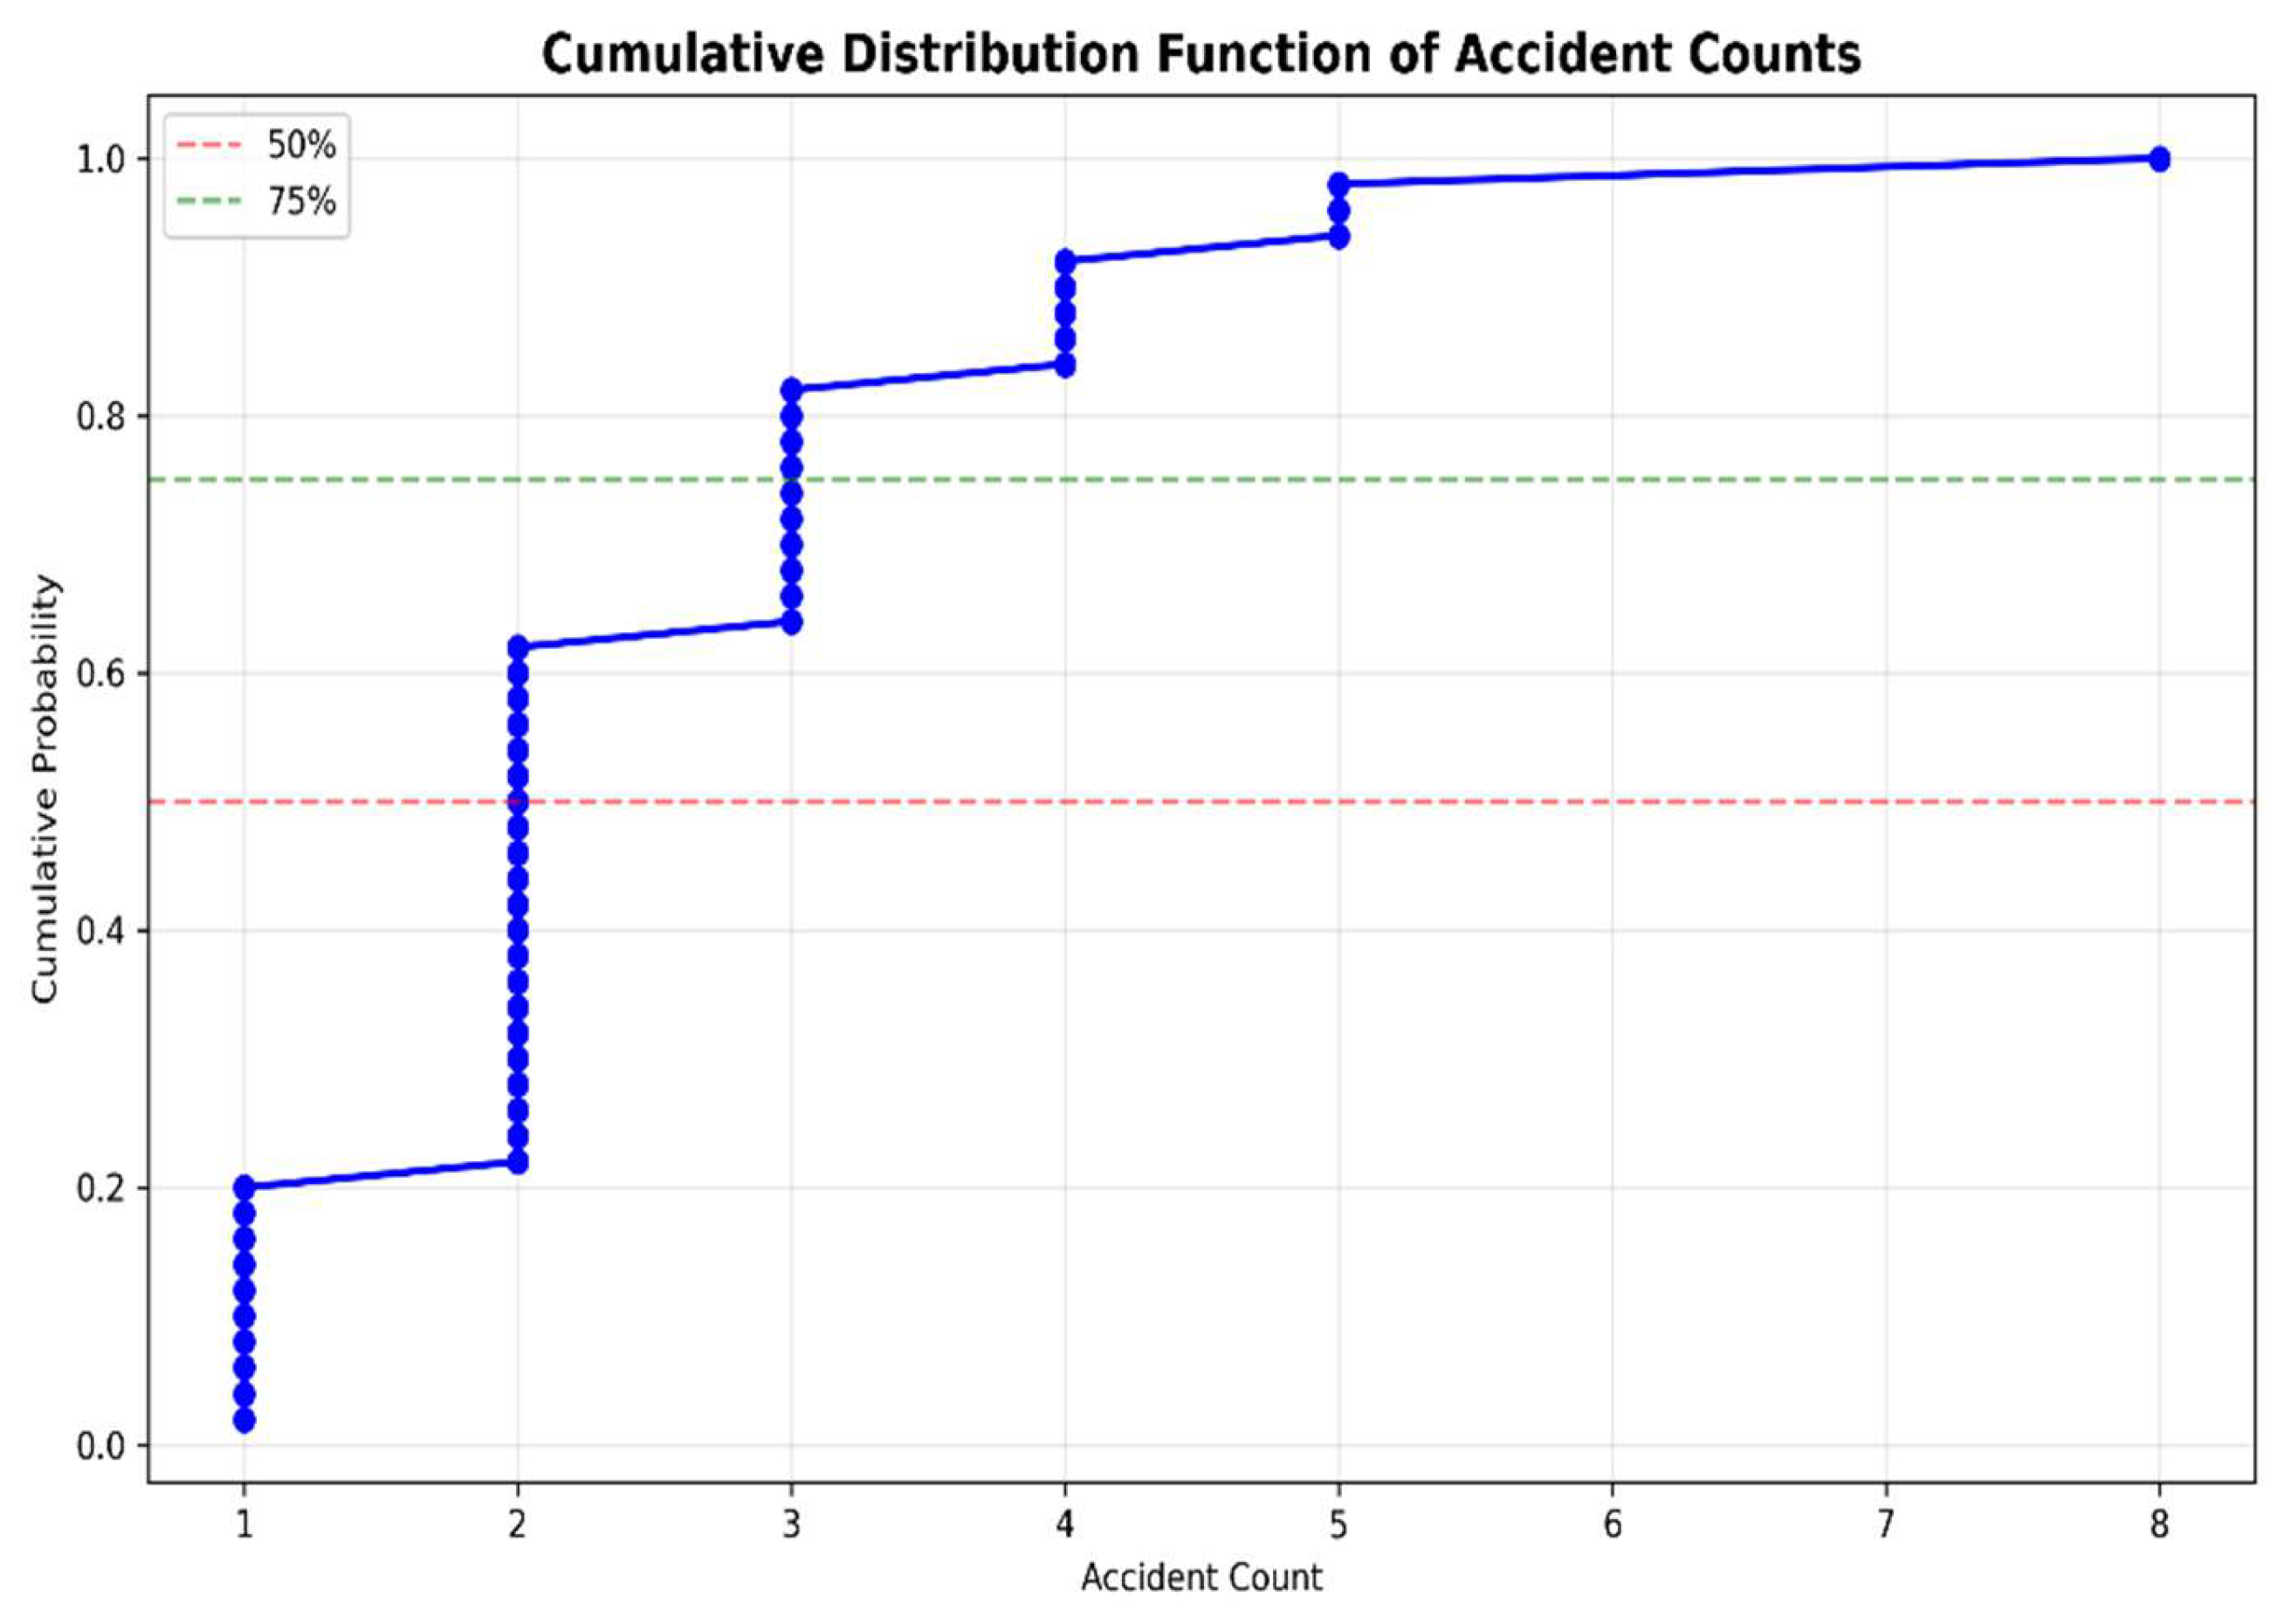
Figure 11.
Kernel density estimation (KDE).
4.7. Accident Severity Classification
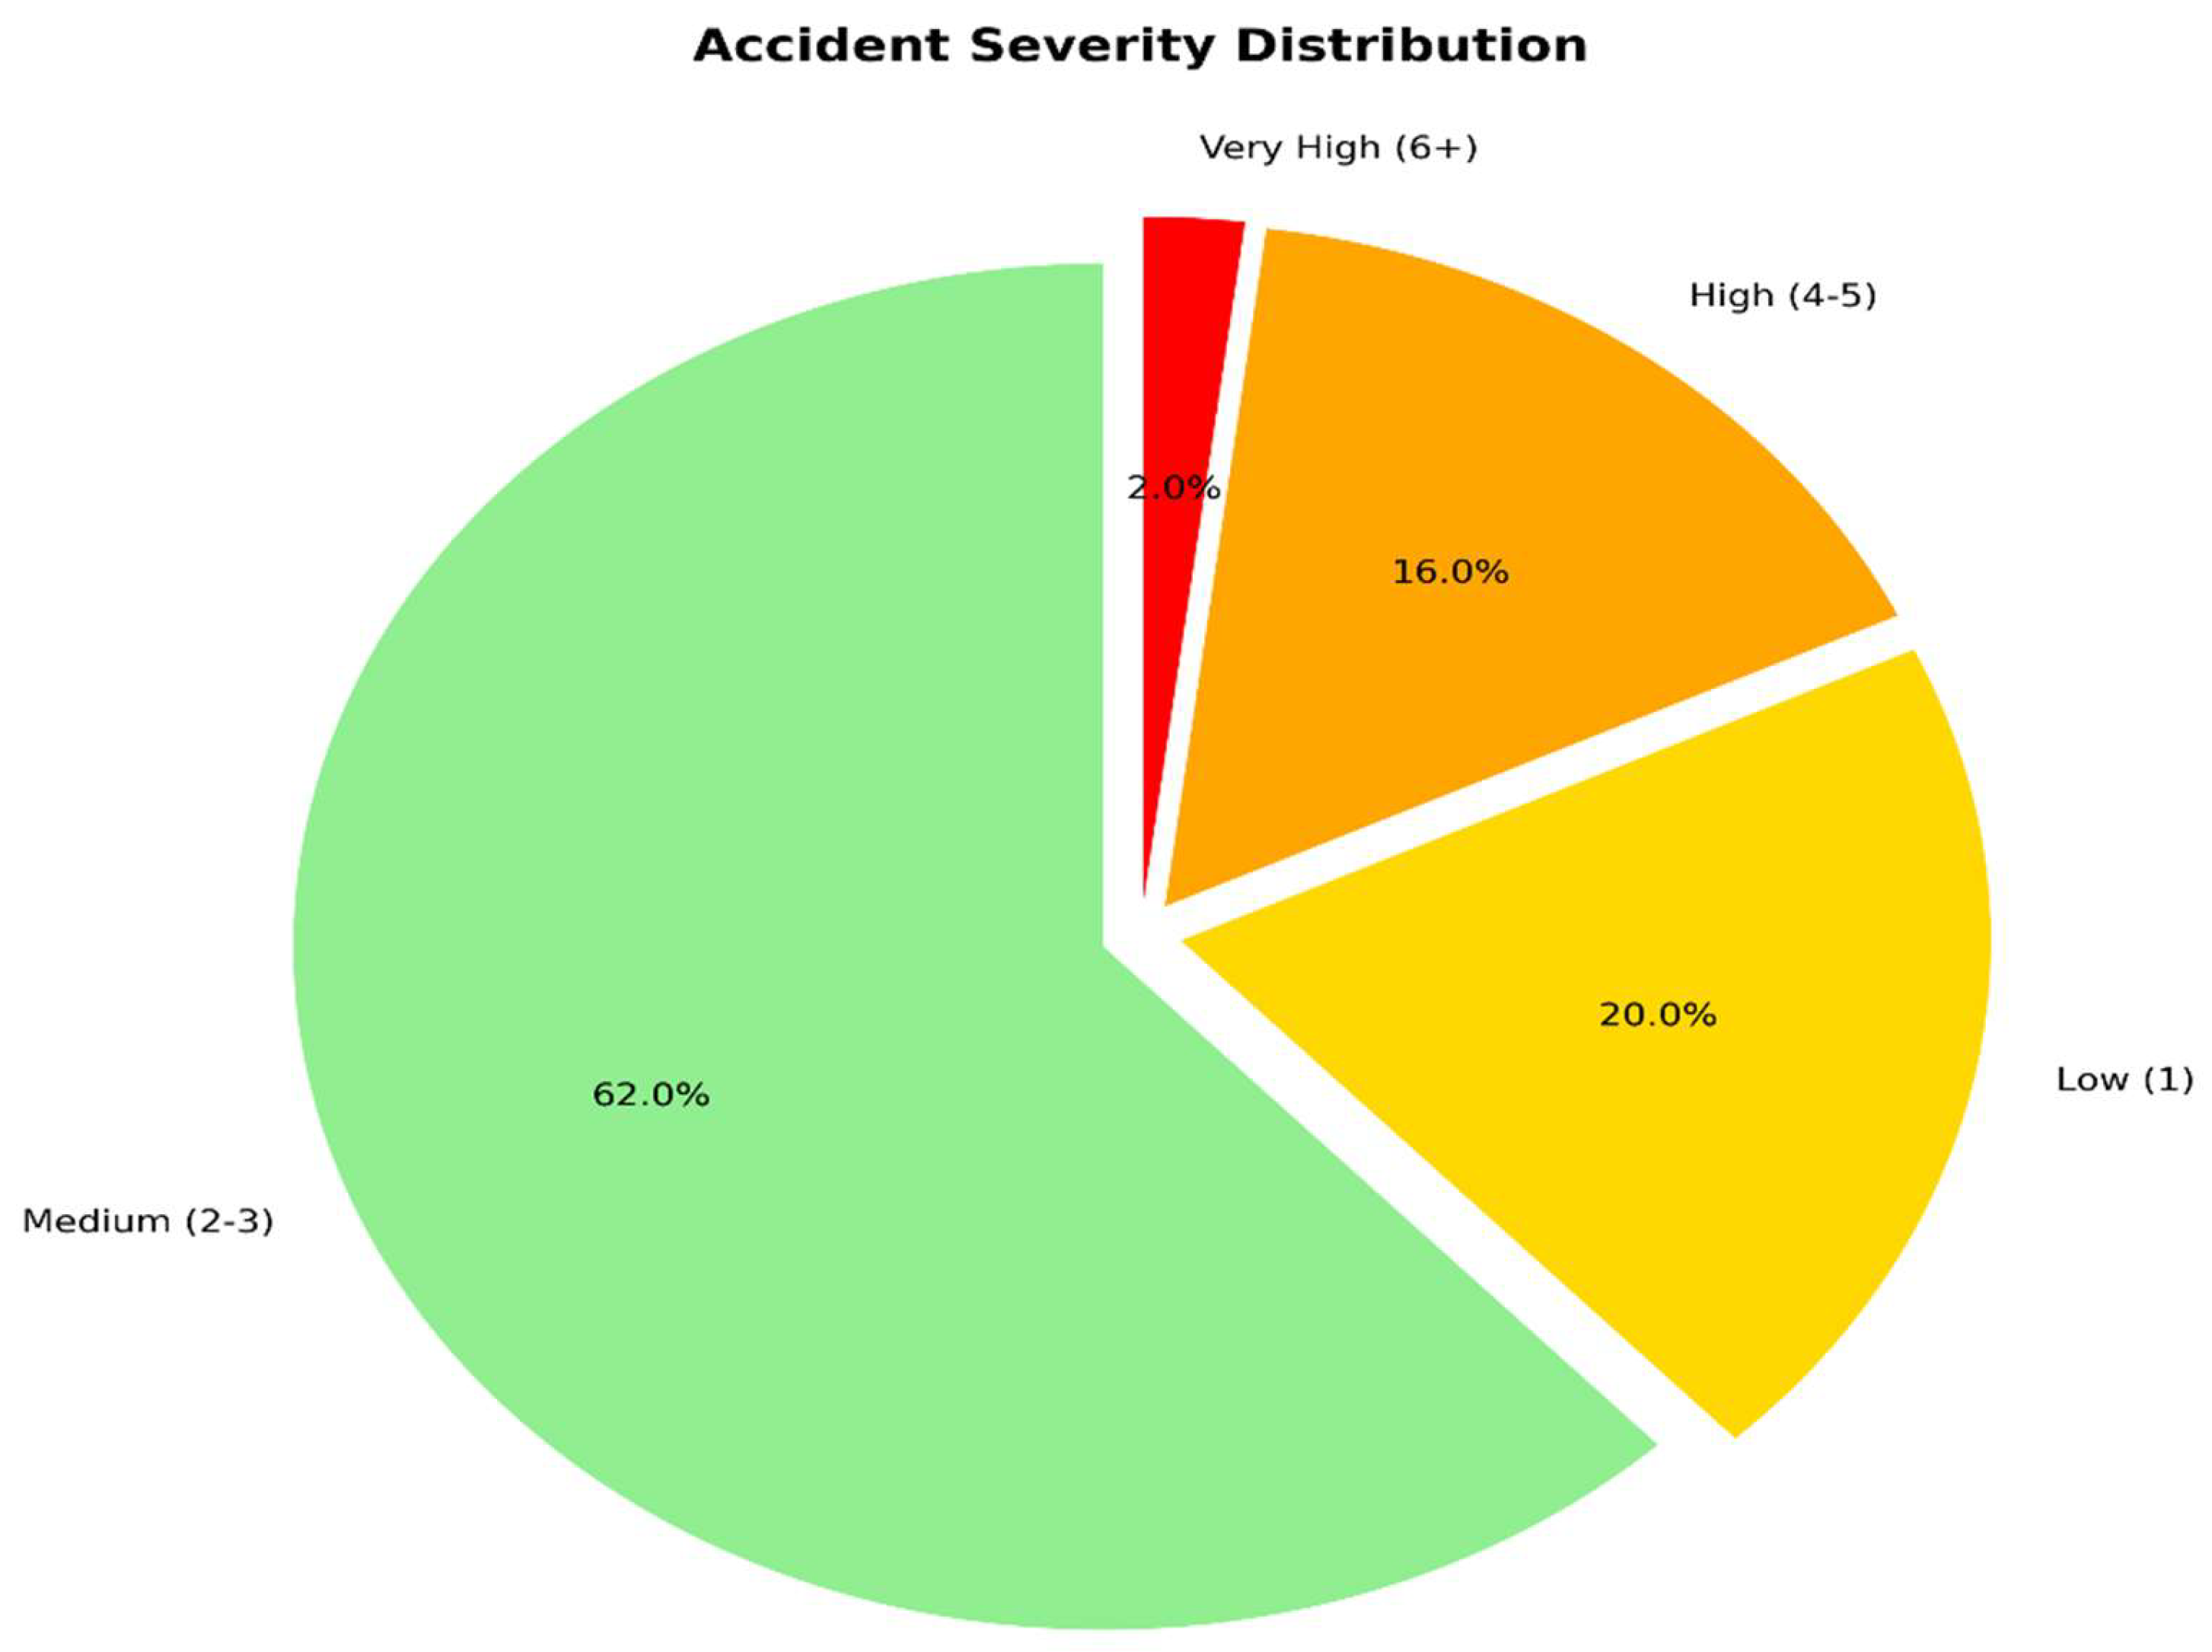
Although high and very high severity locations are relatively few, they represent persistent accident recurrence points and should be prioritized for immediate engineering and enforcement measures.
Table 4.
Accident severity classification.
| Severity category | Accident count range | Interpretation |
| Low | 1 | Minor localized risk |
| Medium | 2–3 | Moderate concern |
| High | 4–5 | Elevated risk |
| Very High | ≥ 6 | Critical intervention point |
Figure 12.
Pie chart of severity categories.
4.8. Ranking of High-Risk Locations
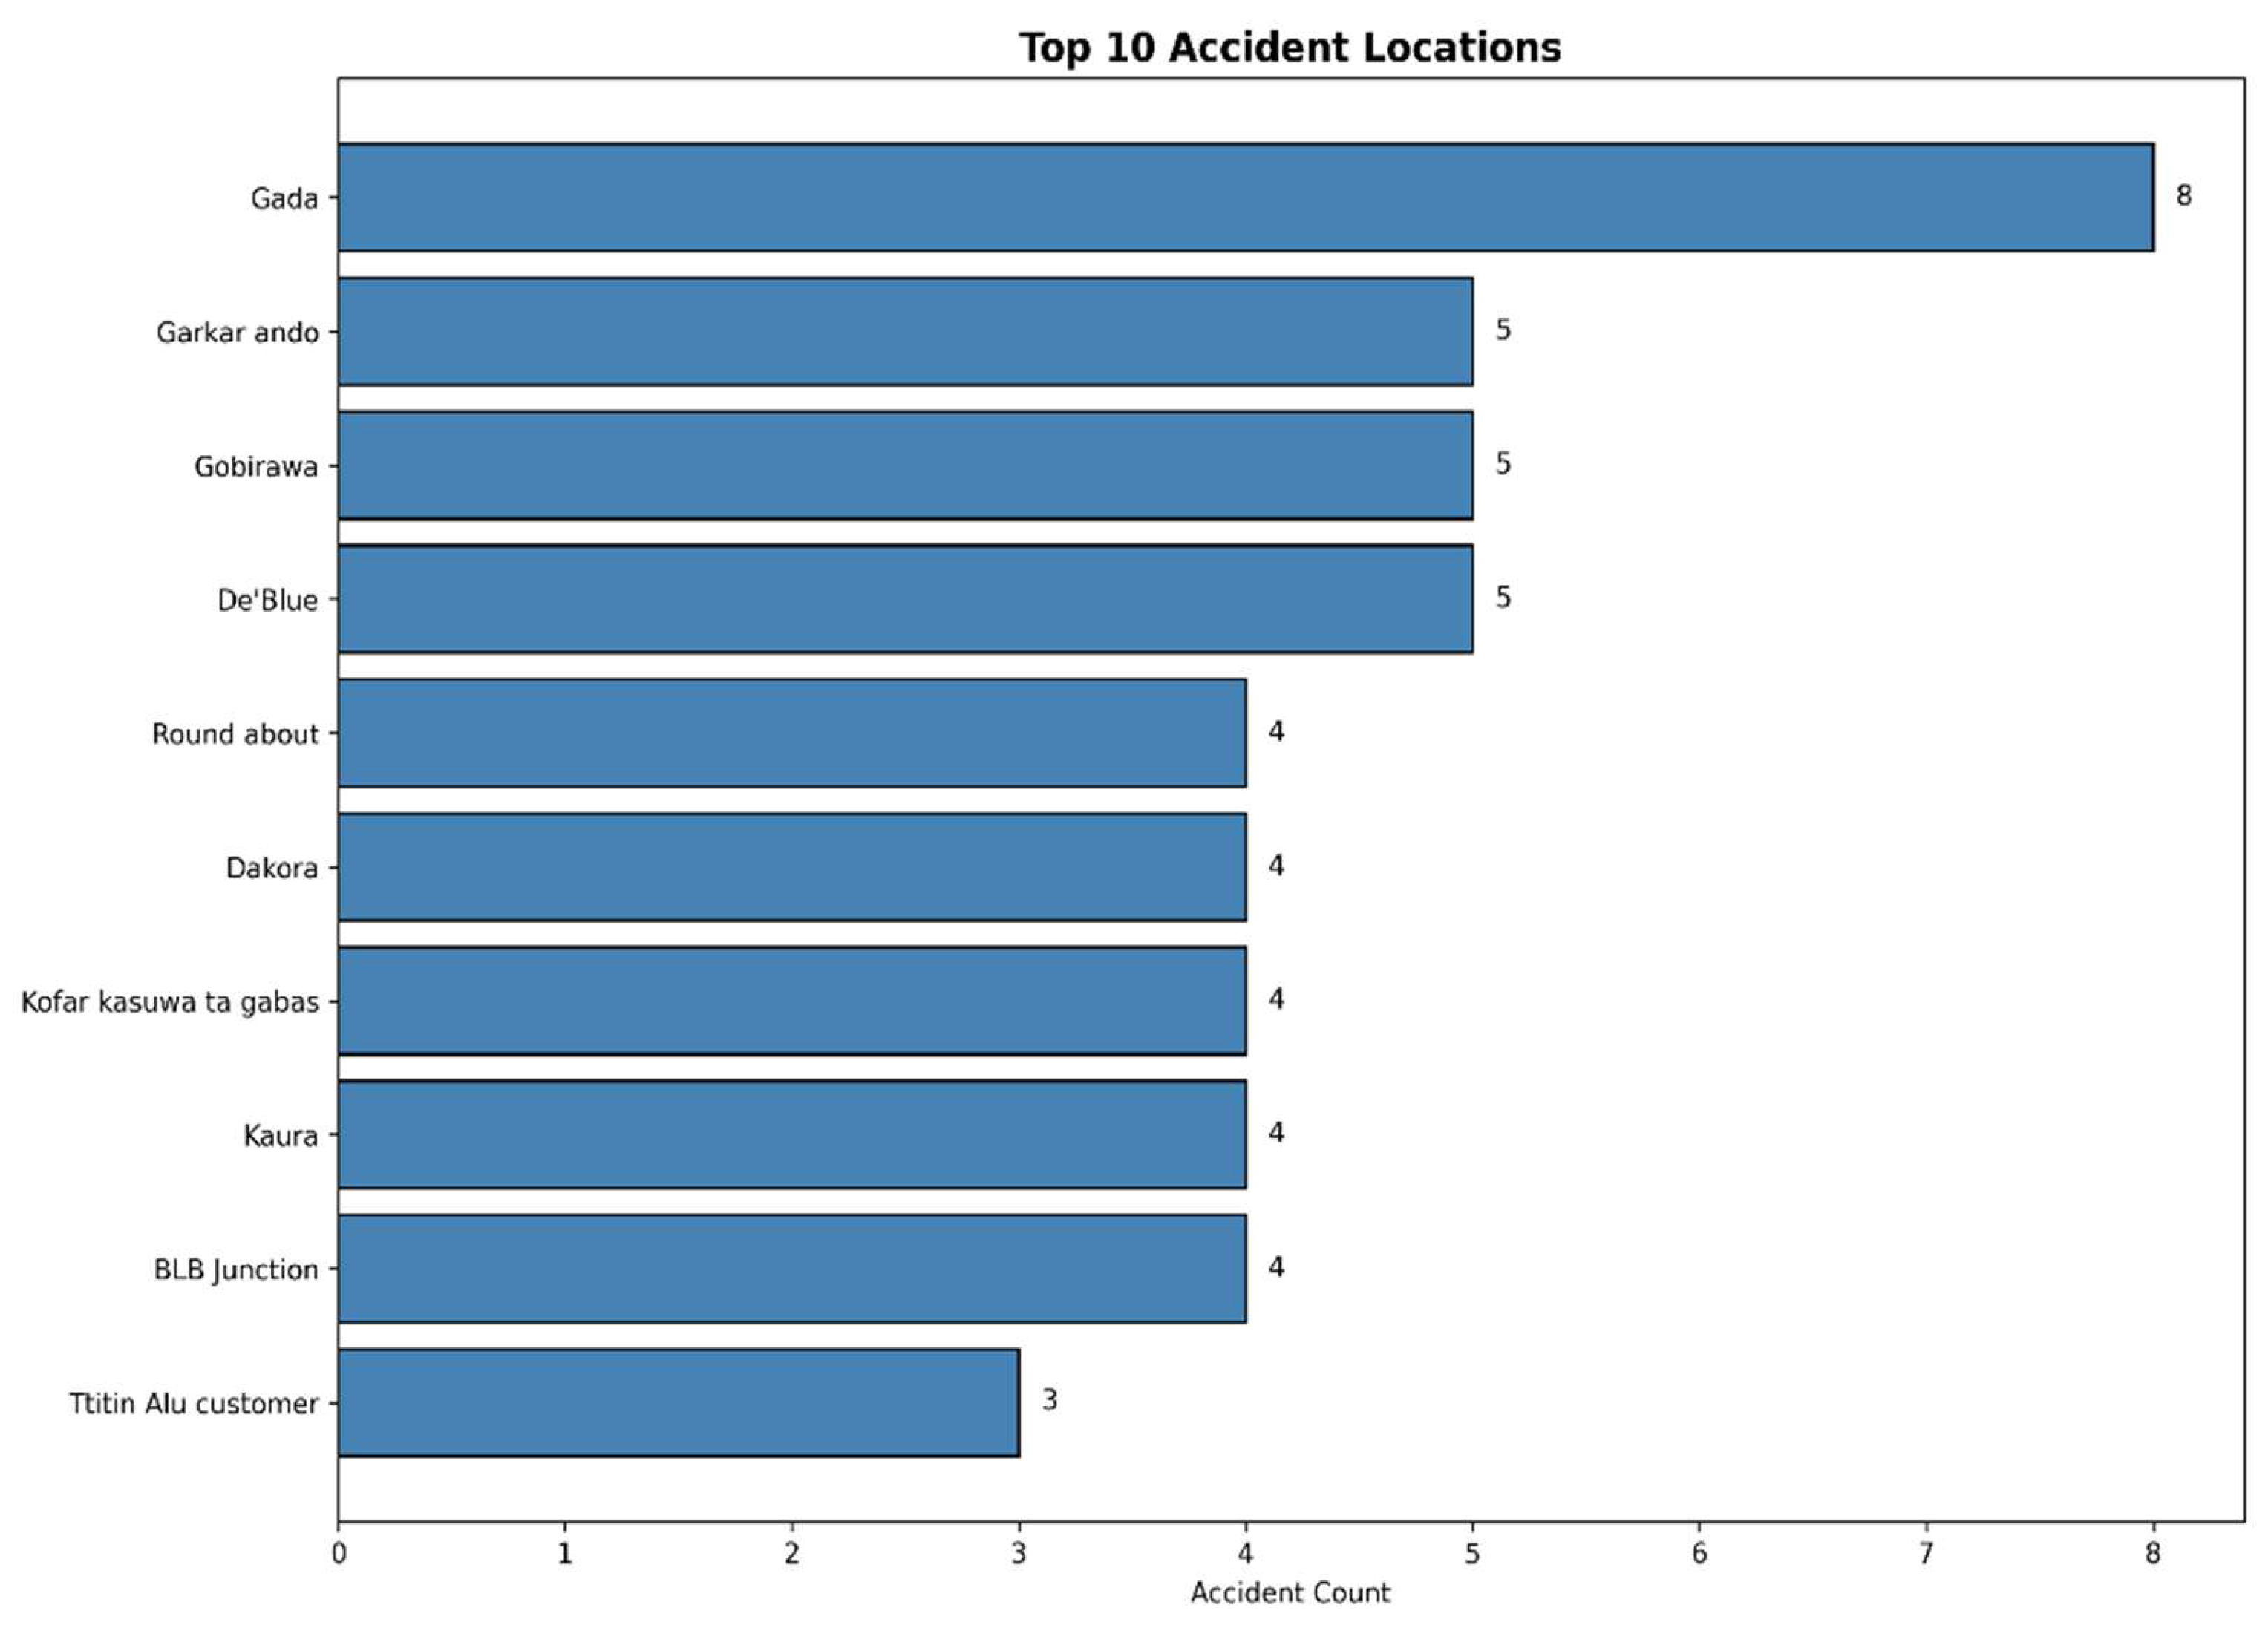
The highest-ranked locations coincide spatially with IDW-derived hotspot zones, confirming the consistency and reliability of the interpolation-based hotspot detection.
Table 5.
Top accident-prone locations.
| Rank | Location ID | Accident count | Severity |
| 1 | L-01 | 7 | Very High |
| 2 | L-02 | 6 | Very High |
| 3 | L-03 | 5 | High |
| 4 | L-04 | 5 | High |
| 5 | L-05 | 4 | High |
Figure 13.
Top 10 accident-prone locations bar chart.
4.9. Spatial Distribution of Road Traffic Accident Hotspots
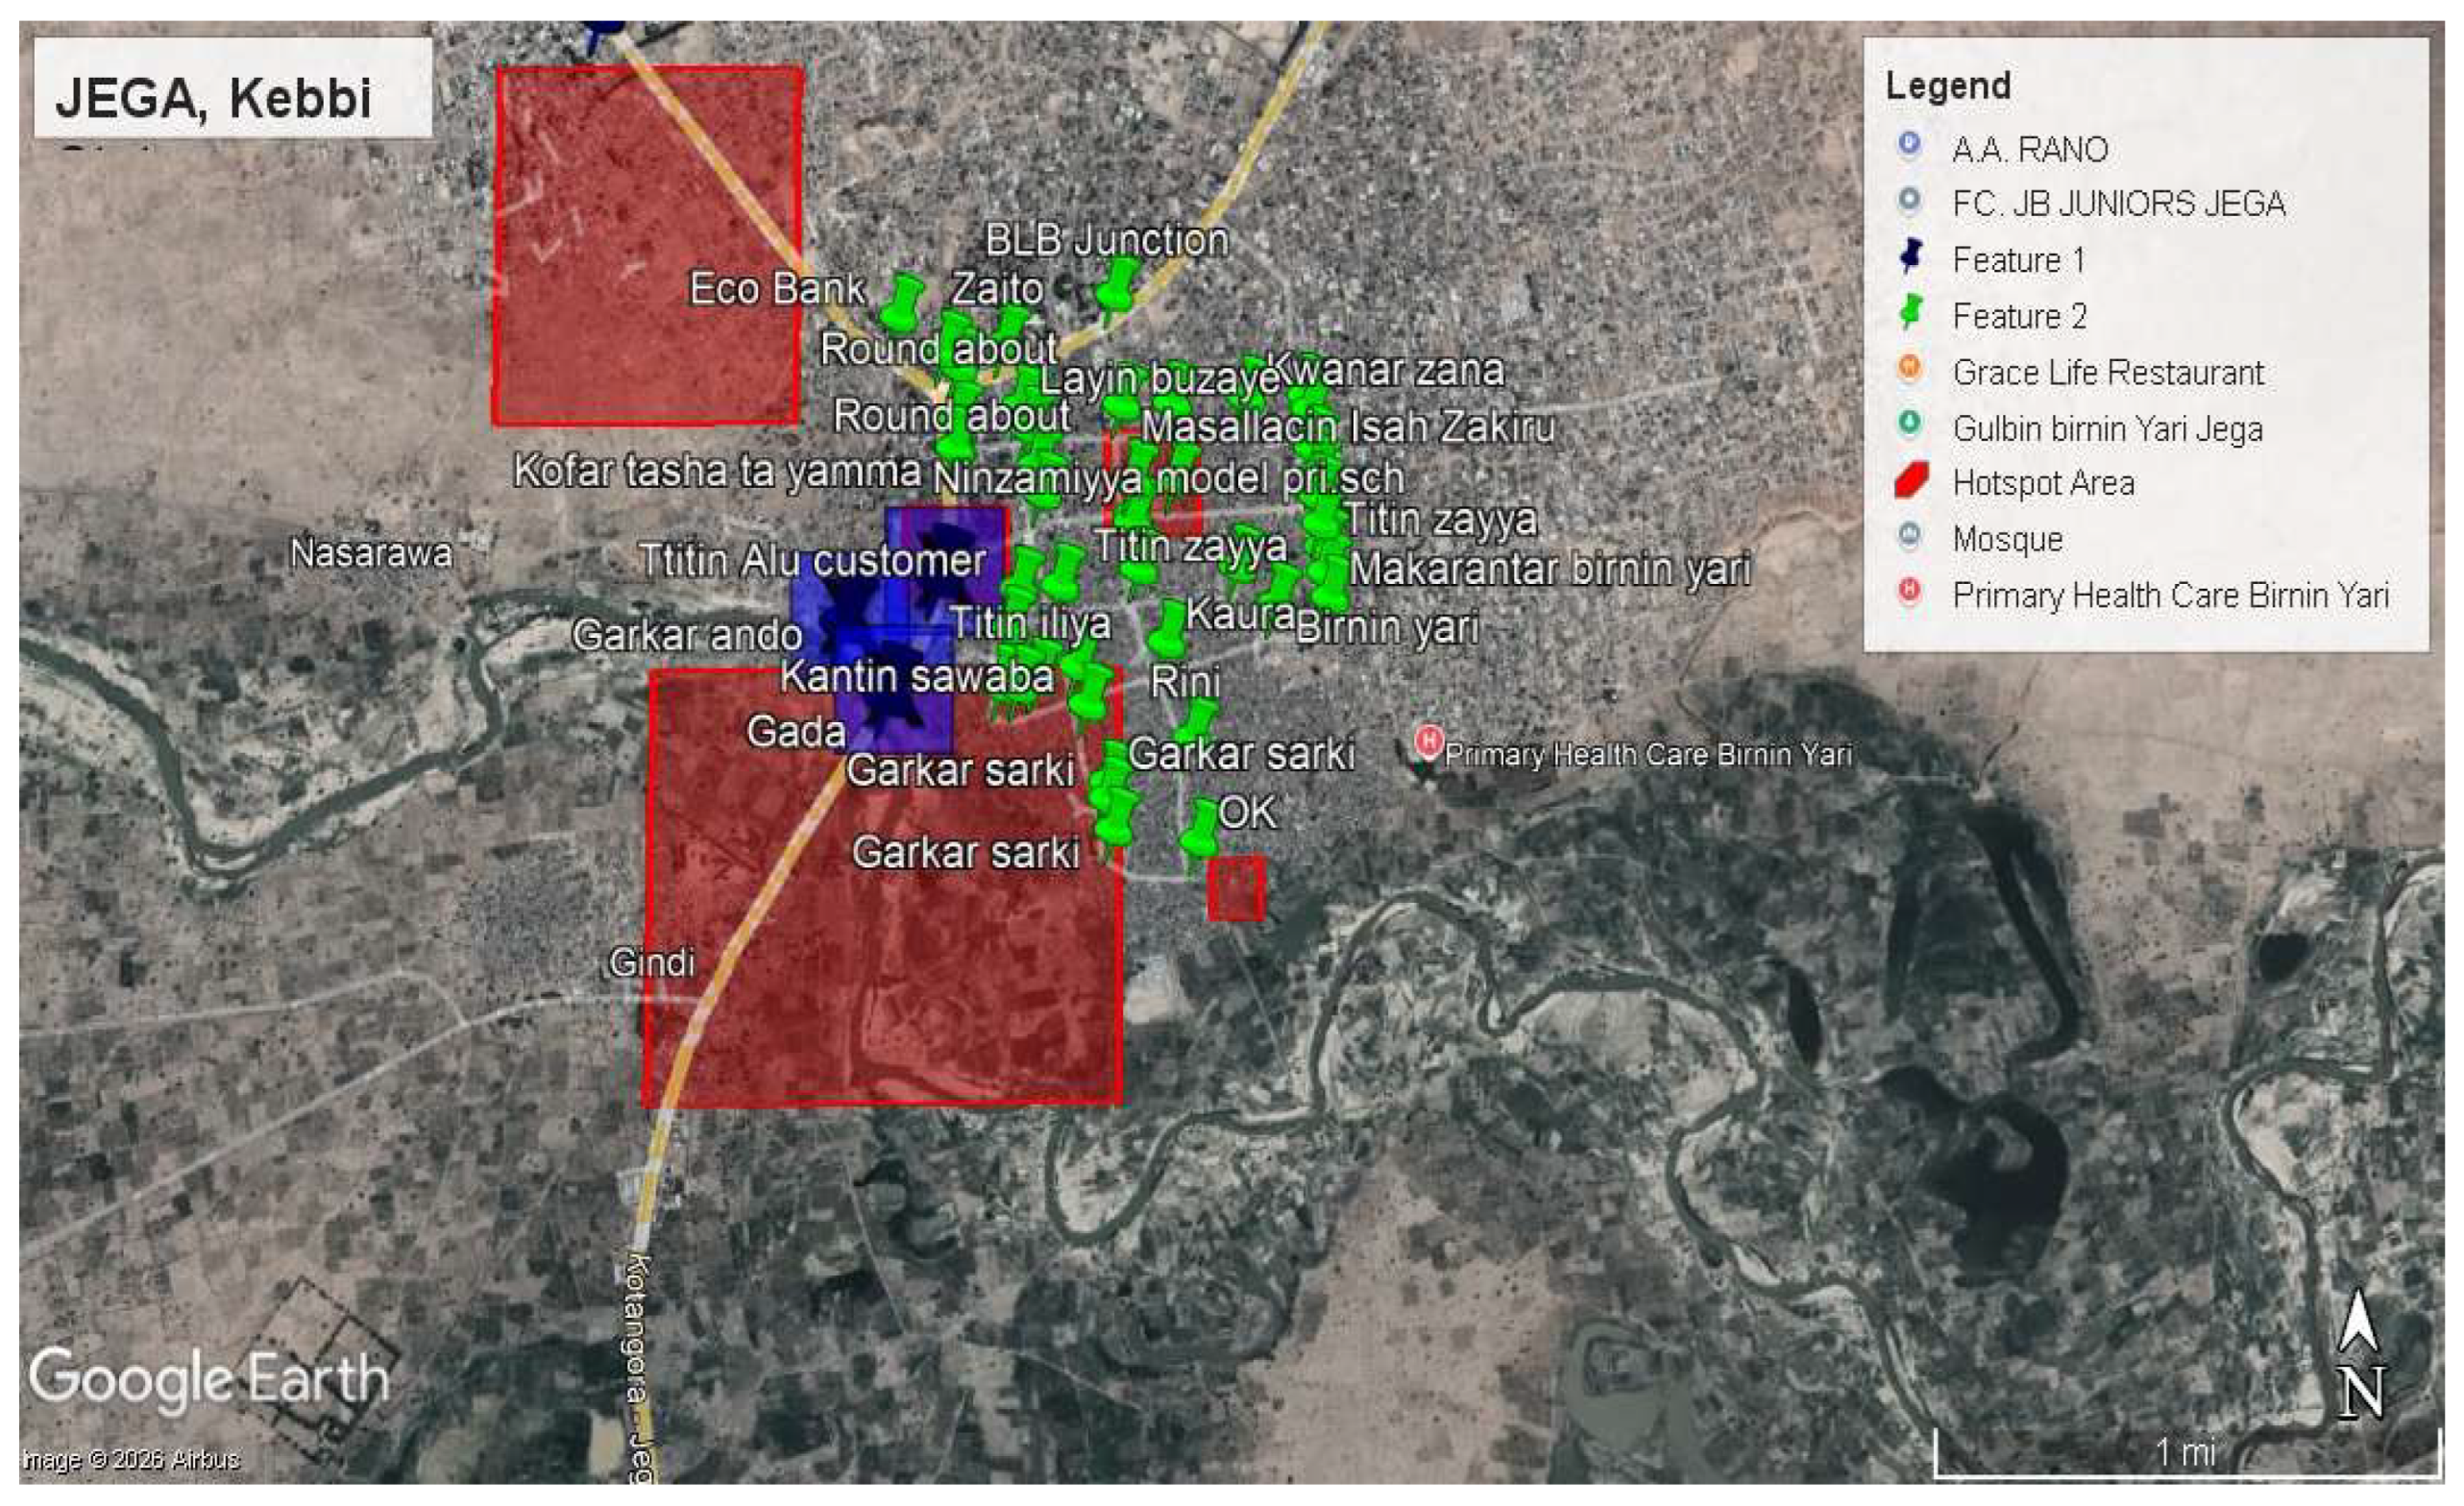
The map in Figure 14 depicts the spatial distribution of road traffic accident locations and identified hotspot zones in Jega, Kebbi State, overlaid on Google Earth imagery. Accident occurrences are highly clustered within the urban core, particularly around major road corridors, junctions, and roundabouts, indicating non-random spatial patterns. Three dominant hotspot zones are evident: a northern zone along the Eco Bank–BLB Junction axis associated with heavy traffic inflow and commercial activities, a central zone around Kantin Sawaba–Gada–Garkar Sarki which represents the highest accident concentration due to dense land use and multiple road intersections, and a southern zone along the Garkar Sarki–Gindi corridor linked to higher travel speeds on an exit route. Peripheral areas exhibit relatively low accident density, confirming that road traffic accidents in Jega are spatially concentrated within limited high-risk zones. Overall, the map highlights pronounced spatial inequality in accident occurrence and underscores the need for targeted, location-specific road safety interventions rather than uniform measures across the town.
Figure 14.
Spatial distribution of road traffic accident locations and identified hotspot zones in Jega, Kebbi State.
Figure 14.
Spatial distribution of road traffic accident locations and identified hotspot zones in Jega, Kebbi State.
5. Discussion
This study provides clear evidence that road traffic accidents in Jega Local Government Area exhibit strong spatial concentration rather than random occurrence. The descriptive statistics reveal pronounced positive skewness and leptokurtosis, indicating that accident events are dominated by a limited number of high-frequency locations. Such statistical characteristics are consistent with accident concentration theory, which posits that a small proportion of sites typically accounts for a large share of crashes (Lord and Mannering, 2010). This confirms the relevance of spatially explicit analytical approaches for effective road safety assessment in the study area.
The application of Inverse Distance Weighting interpolation further elucidates the localized nature of accident risk in Jega. The interpolated accident intensity surfaces reveal distinct spatial gradients, with pronounced peaks around major junctions, commercial corridors, and traffic convergence zones. These patterns suggest that accident occurrence is closely linked to localized traffic dynamics, land-use intensity, and road network configuration. Similar spatial clustering patterns have been reported in previous accident studies conducted in Nigeria and other developing urban contexts, where mixed traffic conditions and limited traffic control infrastructure prevail (Anderson, 2009; Abubakar and Umar, 2020).
The percentile-based hotspot identification approach adopted in this study proved effective in isolating high-risk zones while maintaining methodological transparency. By classifying the upper 20% of interpolated intensity values as hotspots, the analysis avoids arbitrary threshold selection and allows for consistent comparison across space. The strong spatial correspondence between identified hotspot zones and independently ranked high-accident locations provides empirical validation of the robustness and internal consistency of the approach.
Inequality analysis using cumulative distribution and kernel density estimation further reinforces the presence of disproportionate accident concentration. The results indicate that a relatively small subset of locations contributes a substantial share of total recorded accidents, reflecting a Pareto-type distribution of accident risk. This finding underscores the inefficiency of uniform safety interventions and highlights the potential effectiveness of targeted, location-specific strategies.
Overall, the findings demonstrate that IDW interpolation offers a practical and computationally efficient framework for accident hotspot analysis in data-constrained environments. While more complex techniques such as kernel density estimation or spatial regression models may capture additional dimensions of accident risk, the simplicity, interpretability, and minimal data requirements of IDW make it particularly suitable for routine safety monitoring at the local government level. The study therefore contributes empirical support for the use of interpolation-based spatial analysis as a decision-support tool for urban road safety planning in developing regions.
References
- Abubakar, M., & Umar, M. (2020). Spatial analysis on road traffic accidents in Kebbi State using universal kriging. Unpublished manuscript, Department of Mathematics, Federal University Birnin Kebbi, Kebbi, Nigeria.
- Abubakar, M., & Salmanu, A. (2025). Mapping high-risk traffic zones in Jega, Nigeria: An integrated geospatial framework for road safety planning. Journal of Basics and Applied Sciences Research, 3(6), 252–261. [CrossRef]
- Abubakar, M., Salmanu, A., Umar, M., & Usman, A.G. (2025). Analyzing spatial heterogeneity in road traffic accidents using geographically weighted regression: A localized approach for targeted safety interventions. International Journal of Applied Science and Mathematics, 11(9), 126–138. [CrossRef]
- Anderson, T.K. (2009). Kernel density estimation and K-means clustering to profile road accident hotspots. Accident Analysis & Prevention, 41(3), 359–364. [CrossRef]
- Anselin, L. (1988). Spatial econometrics: Methods and models. Kluwer Academic.
- Brunsdon, C., Fotheringham, A.S., & Charlton, M. (1996). Geographically weighted regression: A method for exploring spatial non-stationarity. Geographical Analysis, 28(4), 281–298. [CrossRef]
- Fotheringham, A.S., Brunsdon, C., & Charlton, M. (2002). Geographically weighted regression: The analysis of spatially varying relationships. Wiley.
- Goovaerts, P. (1997). Geostatistics for natural resources evaluation. Oxford University Press.
- Hengl, T., Heuvelink, G.B.M., & Stein, A. (2004). Geostatistical mapping of spatial variation in soil properties using regression-kriging. Geoderma, 120(1–2), 75–93. [CrossRef]
- Li, J., & Heap, A.D. (2014). Spatial interpolation methods applied in the environmental sciences: A review. Environmental Modelling & Software, 53, 173–189.
- Lord, D., & Mannering, F. (2010). The statistical analysis of crash-frequency data: A review and assessment of methodological alternatives. Transportation Research Part A: Policy and Practice, 44(5), 291–305. [CrossRef]
- Odeh, I.O.A., McBratney, A.B., & Chittleborough, D.J. (1995). Further results on prediction of soil properties from terrain attributes: Heterotopic cokriging and regression-kriging. Geoderma, 67(3–4), 215–226. [CrossRef]
- World Health Organization. (2023). Global status report on road safety 2023. World Health Organization. https://www.who.int/teams/social-determinants-of-health/safety-and-mobility/global-status-report-on-road-safety-2023.
Disclaimer/Publisher’s Note: The statements, opinions and data contained in all publications are solely those of the individual author(s) and contributor(s) and not of MDPI and/or the editor(s). MDPI and/or the editor(s) disclaim responsibility for any injury to people or property resulting from any ideas, methods, instructions or products referred to in the content. |
© 2026 by the authors. Licensee MDPI, Basel, Switzerland. This article is an open access article distributed under the terms and conditions of the Creative Commons Attribution (CC BY) license (http://creativecommons.org/licenses/by/4.0/).
Copyright: This open access article is published under a Creative Commons CC BY 4.0 license, which permit the free download, distribution, and reuse, provided that the author and preprint are cited in any reuse.


