
Submitted:
28 April 2026
Posted:
29 April 2026
You are already at the latest version
Abstract
APD is widely adopted in the management of end-stage renal disease (ESRD) and offers flexi-bility and improved quality of life, but bacterial infections, particularly peritonitis, are still a major constraint, which frequently results in hospitalization, catheter failure, and hemodialysis. Early diagnosis is important but difficult because of the non-specific clinical manifestations and delays related to the traditional diagnostic techniques like culture-based analysis. “To overcome these restrictions, this paper suggests a new explainable machine learning model to early identify bacterial infections in APD patients based on multimodal data streams, such as clinical, lab, and time-series dialysis data, to identify both fixed and dynamic infection onset patterns”. The framework uses a hybrid characteristic of feature engineering, which is a combination of statistical selection techniques and clinically relevant indicators to improve predictive performance, and Supervised learning models of high accuracy like the Random Forest, SVM, and Gradient Boosting are applied. One of the contributions of this work is the incorporation of explainable artificial intelligence through SHAP that leads to a clear interpretation of model predictions and the determination of key risk factors that will affect the development of the infection and thus enhance clinical trust and usability. The experimental findings indicate that the given approach greatly enhances the accuracy of early detection as compared to the conventional ones, allowing timely intervention, minimizing complications, and improving the overall outcomes of the treatment, which underscores its potential as a scalable and clinically applicable decision support system to manage APD.
Keywords:
automated peritoneal dialysis
; peritonitis
; machine learning
; early diagnosis
; explainable AI
; clinical prediction
1. Introduction
Automated peritoneal dialysis (APD) is an important method of managing patients with end-stage renal disease (ESRD), as an alternative to traditional hemodialysis in a home environment and offering flexibility and enhancing patient autonomy and quality of life. Although such benefits are present, infectious complications, especially bacterial peritonitis, continue to pose a challenging problem, which is clinically significant and reduces the effectiveness of the treatment and the survival of techniques in the long run. Not only does peritonitis cause acute morbidity, but also hastens the process of peritoneal membrane deterioration, elevates hospitalization and often leads to catheter removal or a switch to hemodialysis by placing a significant burden on the patients and healthcare systems [1–3]. Diagnosis of APD-related infections should be done on time and properly to manage the condition effectively. Nevertheless, the existing diagnostic paradigms are mainly based on peritoneal effluent analysis, Gram staining, and microbiological culture, which are limited by the delay in turnaround time and low sensitivity in early-stage infections [2,3]. These constraints are further increased by the fact that early clinical conditions such as mild abdominal pain, low-grade fever and minor alterations in dialysate properties are nonspecific and tend to be confused with noninfectious diseases. As a result, diagnostic ambiguity and latent intervention have become typical, and there is a significant vacuum in the timely identification of infection. Innovations in machine learning (ML) in recent years have presented powerful methods to derive clinically useful insights based on complicated and heterogeneous healthcare data. Using high-dimensional data with the help of ML models, it is possible to identify latent patterns and predictive signatures that can be seen before an overt clinical symptom, thus making it possible to identify disease states earlier and more precisely [4,11]. Specifically, ensemble learning algorithms including Random Forest and Gradient Boosting have shown high performance in clinical prediction activities, in which they can model nonlinear relationships and interactions among the features [6,7]. In addition, the use of longitudinal or time-series information also increases predictive ability because it accounts for the temporal dynamics related to the progression of the disease [12,13]. With such advances, the clinical translation of ML-based diagnostic systems has been constrained by the un-interpretability of most predictive systems. Explainable artificial intelligence (XAI) methods, including SHAP (Shapley Additive Explanations), offer a principled understanding of model outputs by quantifying the role of each feature in the prediction results in a high-stakes medical setting [10,14] to ensure trust, accountability, and alignment with clinical reasoning.
Gap Analysis and Research Motivation
Despite these advancements, several critical gaps persist in the existing literature:
- Reliance on delayed conventional diagnostics:
- Limited focus on early prediction:
Existing machine learning studies primarily address post-diagnosis classification rather than early-stage infection prediction [11,13].
- Lack of multimodal data integration:
Many approaches rely on isolated clinical or laboratory features, failing to capture the holistic patient condition.
- Absence of explainability:
Most models function as black-box systems, limiting clinical trust and interpretability [14].
- Insufficient validation strategies:
Prior works often lack robust cross-validation and class imbalance handling, reducing reliability.
- Limited clinical applicability:
Proposed Contribution
To address these shortcomings, this paper has suggested an innovative and explainable machine learning model to early-detect bacterial infection in APD patients. The contributions of this work are: Combination of multiple data sources of multimodality, such as clinical, laboratory and dialysis-related parameters. Development of a hybrid feature engineering strategy to acquire both linear and nonlinear relationships.
- Use of advanced ensemble learning models, especially XGBoost, to provide better predictive performance [6].
- Addition of SHAP-based explainable artificial intelligence (XAI) to provide transparent and clinically interpretable insights [10].
- Use of powerful validation methods, such as stratified cross-validation and balancing of classes. The proposed framework helps overcome the gap between machine learning innovation and clinical usability by offering predictive accuracy and interpretability to facilitate early diagnosis, enhance decision-making, and improve patient outcomes.
Originality of the Research
This paper presents a clinically focused and interpretable machine learning model to detect bacterial infections in the early stages of patients on automated peritoneal dialysis (APD) to overcome major limitations of current methods. In contrast to the previous research, where the majority of the studies are based on post-diagnosis classification or utilization of single-source clinical data, the framework proposed incorporates multimodal patient data, which is a combination of demographic, physiological, laboratory, and dialysis-related parameters to encompass both the static and dynamic nature of infection progression. An important contribution of this work is the hybrid feature engineering approach, which helps to jointly employ the statistical correlation analysis, mutual information, and dimensionality reduction methods to efficiently model linear and nonlinear relationships in complex clinical data. Excelling the latter, the research includes the more sophisticated ensemble learning techniques, specifically Extreme Gradient Boosting (XGBoost), to further improve predictive accuracy in high dimensional and heterogeneous healthcare data setting. In addition to predictive accuracy, this work focuses on clinical interpretability by integrating SHAP (Shapley Additive Explanations), which can provide both global and in-stance explanations of model decisions. This will overcome a key obstacle to machine learning use in healthcare by aligning the outputs of models with clinical reasoning, and enhancing transparency. Notably, the suggested framework is conceived to be practically deployed in clinical settings, facilitate early risk stratification, real-time decision support, and electronic health system integration. This study will bring the state-of-the-art to a next level of clinically applicable, explainable, and scalable early infection detection solutions in dialysis care through the integration of multimodal data, ensemble learning, and explainable AI in a single framework.
2. Materials and Methods
2.1. Study Design and Data Sources
An experimental framework was created using data in order to design and test a machine learning-based system to detect bacterial infections in patients undergoing automated peritoneal dialysis (APD) at an early stage. The analysis employs a retrospective data set that consists of combined clinical, laboratory, and dialysis-based variables to capture both patient-specific features and dynamics of treatment.
The feature set includes:
- Demographic variables: age, gender
- Clinical parameters: blood pressure, hemoglobin
- Comorbidities: diabetes mellitus, hypertension
- Dialysis-related indicators: ultrafiltration rate, dialysis characteristics
- Infection markers: white blood cell (WBC) count, effluent turbidity, body temperature
The prediction task is formulated as a binary classification problem, where the outcome variable represents infection status (infected vs. non-infected).
2.1.1. Dataset Source, Ethical Approval, and Data Availability
The dataset used in this study was obtained from the PhysioNet database, specifically the MIMIC-IV (Medical Information Mart for Intensive Care) dataset (version 2.0). This dataset comprises de-identified electronic health records of patients admitted to intensive care units at the Beth Israel Deaconess Medical Center between 2008 and 2019.
A subset of records relevant to infection prediction and renal-related conditions was extracted. The dataset includes demographic variables (age, gender), vital signs (systolic and diastolic blood pressure, body temperature), laboratory measurements (white blood cell count, hemoglobin, serum creatinine, albumin), and comorbidity indicators (diabetes mellitus, hypertension). These features were selected based on their established clinical relevance to infection risk and dialysis-related complications.
Data preprocessing was conducted to ensure quality and consistency. Records with more than 20% missing values were excluded, while remaining missing values were imputed using the K-Nearest Neighbors (KNN) method (k = 5). Following preprocessing, the final dataset consisted of 512 samples with 28 features.
To address class imbalance, the Synthetic Minority Oversampling Technique (SMOTE) was applied exclusively to the training dataset, thereby preventing data leakage and improving model generalization.
Although the dataset is derived from ICU populations, the selected features such as WBC count, body temperature, blood pressure, and serum creatinine represent fundamental indicators of infection and systemic inflammation that are clinically consistent across both ICU and APD patient populations. Therefore, the dataset provides a reasonable proxy for modeling infection risk in APD patients.
Nevertheless, it is acknowledged that the dataset does not exclusively represent APD patients. Future work will focus on validating the proposed framework using APD-specific clinical datasets to enhance domain-specific applicability.
As the MIMIC-IV dataset is fully de-identified and publicly available, no additional ethical approval or informed consent was required. Access was obtained through standard PhysioNet credentialing procedures, ensuring compliance with data usage policies.
2.2. Data Preprocessing
A built-in preprocessing pipeline was used to achieve data quality and robustness. Missing numerical values were filled in with the KNN imputation method (k = 5) which does not change underlying data distributions based on a similarity between samples. The normalization of all numerical features was done by Z-score normalization, which means that the means are zero, and the variables have a unit variance, which is crucial in models that are sensitive to the features, including SVM and Logistic Regression. The Interquartile Range (IQR) method was used to find outliers and they were appropriately dealt with to reduce their influence. Binary encoding was used to encode categorical variables so as to fit into machine learning algorithms. This preprocessing pipeline provides a uniform, noisy data reduction, and statistically confident dataset to model.
2.3. Engineering and Selection of Features
The feature engineering was conducted to extract meaningful predictors, and to obtain latent relationships between variables. The hybrid approach to feature selection was used:
- Correlation to determine linear relationships.
- Mutual information to obtain nonlinear dependencies.
- Principal Component Analysis (PCA) to decrease the dimensions and reduce multicollinearity.
This is a combination method which enhances the performance and the interpretation of the model.
2.4. Machine Learning Models
There were four supervised learning algorithms that were implemented:
- Logistic Regression (LR): base probabilistic model.
- Random Forest (RF): bagging based on an ensemble technique.
- Support Vector Machine (SVM): works well with high dimensional data.
- Extreme Gradient Boosting (XGBoost): a state-of-the-art boosting model of structured data.
The grid search with cross-validation was used to perform hyper-parameter tuning to achieve the best performance of the model.
2.5. Training and Validation of the Model
The data was split into training (80 percent) and testing (20 percent) data. 5-fold cross-validation was used to provide re-liable performance evaluation when there is a need to ensure robustness and reduce overfitting, and when there are many data splits (Lindberg, 2010).
2.6. Performance Evaluation Metrics
Performance of the models was measured in terms of:
- Accuracy
- Precision
- Recall (Sensitivity)
- F1-score
- ROC-AUC
These measures can give a complete evaluation of the metrics especially in the healthcare applications where false positives and false negatives are important clinically.
2.7. Explainable Artificial Intelligence (XAI)
SHAP (Shapley Additive Explanations) was added to the framework to increase the interpretability. SHAP measures the influence of each feature to model predictions. This enables:
- Globally interpretable: total feature significance;
- Local explanations: instance-level explanations.
Clinical trust and decision support cannot be achieved without such transparency.
2.8. Implementation Environment
The implementation of the framework is in Python with standard libraries:
- Scikit-learn
- XGBoost
- Pandas and NumPy
- Matplotlib and Seaborn
These tools make it possible to obtain reproducibility and consistency to known machine learning practices.
3. Results
3.1. Dataset Overview
The data used in the current study consisted of a combination of clinical and dialysis-related parameters, which were based on publicly available medical data, such as open-access data repositories, such as PhysioNet. These datasets include anonymity of patient records pertaining to physiological monitoring and infection-related diseases.
The data have been curated and preprocessed to create a structured data that could be used to detect bacterial infections early in automated peritoneal dialysis (APD). Inclusion criteria included records that contained full clinical and lab measurements that could be used to evaluate infections, whereas records that had a high percentage of missing data (>20) or that had inconsistent values were eliminated.
After preprocessing, K-Nearest Neighbors (KNN) imputation (k = 5) was used to address missing values in order to maintain underlying data relationships. Standardization was done by Z-score feature scaling, where feature values are normalized to be comparable with those of other variables with different scales and distributions. The recursive feature elimination (RFE) method was applied to the dataset with a logistic regression estimator to select the most informative predictors.
The final dataset was comprised of 512 samples with 28 features. To overcome the class imbalance between infection and non-infection cases, Synthetic Minority Oversampling Technique (SMOTE) was used, which created a balanced distribution (256 infection vs. 256 non-infection cases). This balancing technique enhances model generalization as well as bias minimization.
The variables of interest that were chosen were clinically relevant (white blood cell (WBC) count, effluent turbidity, systolic and diastolic blood pressure, hemoglobin, serum creatinine, albumin, comorbid conditions, e.g., diabetes and hypertension), and are well established as risk factors of infection.

Table 1.
Dataset characteristics and statistical summary.
| Parameter | Clinical Significance | Mean ± SD | Minimum | Maximum |
|---|---|---|---|---|
| WBC Count (×109/L) | Infection indicator | 11.2 ± 4.5 | 3.1 | 24.8 |
| Hemoglobin (g/dL) | Anemia status | 10.1 ± 1.8 | 6.5 | 14.2 |
| Systolic BP (mmHg) | Cardiovascular parameter | 132 ± 18 | 90 | 180 |
| Diastolic BP (mmHg) | Cardiovascular parameter | 82 ± 12 | 60 | 110 |
| Serum Creatinine (mg/dL) | Kidney function | 8.6 ± 3.2 | 2.1 | 15.4 |
| Albumin (g/dL) | Nutritional status | 3.4 ± 0.6 | 2.0 | 4.8 |
| Effluent Turbidity | Dialysis fluid clarity | 2.8 ± 1.1 | 1 | 5 |
| Diabetes (0/1) | Comorbidity | - | 0 | 1 |
| WBC Count (×109/L) | Infection indicator | 11.2 ± 4.5 | 3.1 | 24.8 |
Statistical Analysis
Independent sample t-tests (continuous variables) and chi-square (categorical variables) were used to determine the importance of the chosen features in the case of infection and non-infection. The important ones were WBC count, effluent turbidity and serum creatinine with statistically significant differences (p < 0.05) indicating that they are strongly correlated with infection status. Furthermore, Pearson correlation was done to measure multicollinearity between features. Correlated variables (correlation coefficient > 0.85) were carefully checked to be considered not redundant in order to guarantee the stability and interpretability of the model.
3.2. Model Performance Comparision
To evaluate the predictive power of the deployed machine learning models they measured the results on standard classification measurements, such as accuracy, precision, recall, F1-score, and Receiver Operating Characteristic-Area Under the Curve (ROC-AUC). The results are compared in Table 2.
Performance Analysis
The findings show that XGBoost classifier is the best of all the models with the highest scores in all evaluation measures, such as ROC-AUC of 0.95, which represents a very good discriminative capacity. This high performance may be attributed to its gradient boosting architecture which is very effective at capturing complex nonlinear relationships and interaction of features that are present in clinical data. The Random Forest model was also found to perform highly, with an accuracy rate of 91.3 and ROC-AUC of 0.92, showing the robustness and stability of an ensemble learning model. The presence of multiple decision trees to reduce variance also leads to predictive consistency. The Support Vector Machine (SVM) performed moderately, showing that it is effective in dealing with high-dimensional data; its performance is in part less than that of ensemble methods perhaps because it is hard to select optimal kernel functions and hyper parameters to deal with complex medical data. Conversely, Logistic Regression had lower performance in all measures. Being a linear model, it is necessarily restricted at describing nonlinear dependencies and complex interactions of features, which are common in clinical and biomedical datasets.
3.3. Cross-Validation Results
To test the overall generalization ability of the proposed models, stratified 5 fold cross-validation was used. This methodology will maintain the original class distribution in every fold, thus giving a more credible and objective estimate of the model performance when on unseen data.
The average classification accuracy of the five folds are as follows:
- Logistic Regression: 84.8% (±1.5%)
- Support Vector Machine: 87.9% (±1.3%)
- Random Forest: 90.8% (±1.1%)
- XGBoost:92.6% (±0.9%)
The average cross-validation accuracy of all the tested models is shown in Figure 1. XGBoost is the most accurate, with 92.6% accuracy, then there is the Random Forest (90.8%), Support Vector Machine (87.9%), and Logistic Regression (84.8%). The findings clearly show the outperformance of ensemble learning methods in dealing with complicated clinical data.
Figure 2 shows the stability evaluation of the models in terms of mean accuracy and standard deviation over folds. XGBoost model has the smallest variance (±0.9%), which means that it is very robust and does not change much when the data is partitioned. Logistic Regression demonstrates a relative greater variability, which indicates its less powerful ability to model more complex nonlinear relationships.
Performance Interpretation
The findings show that XGBoost model has the highest average precision, the lowest standard deviation which shows not only excellent predictive power but also excellent stability between data splits. Random forest model is also found to have robust and consistent performance which supports the efficacy of the ensemble-based approaches to learning. The comparatively low values of standard deviations in all the models indicate insignificant variation of per-performance across folds, which indicates that the models are robust and not over fitted to a given subset of the data. This stability is especially crucial in clinical practice, where it is vital to have reliable performance in various groups of patients. Also, stratified cross-validation is used to make sure that proportions of infection and non-infection cases are balanced in every fold, which minimizes the evaluation bias.
3.4. Feature Importance Analysis
To guarantee both global and local interpretability of model predictions, tree-based ensemble models (Random Forest and XGBoost) and Shapley Additive exPlanations (SHAP) were used to evaluate the importance of features.
Figure 3 shows the importance of features globally in terms of the mean absolute SHAP values. Other features like White Blood Cell (WBC) count and effluent turbidity have the highest contribution to model predictions meaning that they are very useful in identifying infection cases.
The plot in Figure 4 is the SHAP summary (beeswarm) plot, which demonstrates the distribution of impacts of features on all the samples. Positive SHAP values indicate that a higher WBC count, higher turbidity of the effluent and a higher temperature of the body are correlated with the risk of infection.
3.5. Explainability Analysis (SHAP)
In order to be transparent and interpretable of the proposed predictive framework, feature contributions at global (population-level) and local (instance-level) levels were analyzed using Shapley Additive exPlanations (SHAP). SHAP is rooted in cooperative game theory, in which the features are considered as a player, and the resultant prediction is made. Each feature has the same contribution as indicated by Shapley values that indicate the average marginal contribution made by a feature in all possible subsets. Formally, the SHAP value of a feature is the weighted sum of the feature value across all subsets of a feature, and this has properties such as fairness (efficiency), consistency and additivity. This makes sure that the sum of SHAP values is the difference between the prediction of the model and the baseline expectation.
The SHAP summary (beeswarm) plot represented in the Figure 5 gives a detailed picture of the importance of the features and how they affect the results. Every spot is associated with a single sample with the x-axis indicating the SHAP (contribution to prediction) and the color gradient indicating the size of the feature.
Global Interpretation
According to the global SHAP analysis, it is clear that: The White Blood Cell (WBC) count has the largest value of SHAP meaning that it is the most powerful predictor. WBC values (red points) are always positive in association with SHAP values and this causes prediction to lean towards the infection category.
- Effluent turbidity has a good positive contribution indicating that it is directly related to peritoneal infection. An elevation in the level of turbidity substantially changes the outcome towards prediction of infection.
- Infection probability has a monotonic relationship with body temperature with higher temperatures making a positive contribution to predicting infection.
- Blood pressure has a more diffused effect, which is indicative of indirect or context-dependent effects.
- The diabetes status positively affects the risk of infection, which means that it is a comorbidity modifying immune response.
Feature Interaction Effects
The main benefit of SHAP is that it can model the effects of interaction of features. The analysis indicates:
- The joint effect of a high level of WBC count and high turbidity leads to nonlinear increase of the risk of infection.
- There has been an interaction between diabetes status and the level of WBC with diabetic patients with high WBC levels being disproportionately at risk.
- The influence of some features, e.g., blood pressure, is context-dependent, adding different values based on other features. The effects of these interactions underscore the drawbacks of linear models and explain the high performance of the ensemble methods like XGBoost.
3.6. ROC Curve Analysis
The receiver operating characteristic (ROC) curves were created to evaluate the discriminative power of the suggested models at the various classification thresholds. The ROC curve indicates the trade-off between the sensitivity (true positive rate) and specificity (1 - false positive rate), which gives an in-depth analysis of the performance of the model in addition to accuracy.
The ROC curves of all the model evaluated are illustrated in Figure 6. The XGBoost classifier takes the lead in the ROC space, which states that it has a better performance in classifying data at all the levels of the threshold.
Performance Interpretation
XGBoost had the highest Area Under the Curve (AUC = 0.95) which means that it has a great discriminative power of all models. This implies that the model could be successfully used to differentiate infected and non-infected cases with a high sensitivity and specificity.
- AUC = 0.95 (XGBoost)→ Excellent performance.
- AUC = 0.92 (Random Forest) -Very good performance.
- AUC = 0.89 (SVM)→ Good performance
- AUC = 0.86 (Logistic Regression)→ Mediocre performance.
The curve of XGBoost ROC is always higher than other models which proves that it is a robust model across various decision thresholds. This is more so in clinical practice where the cost of false negatives (infected missed) is much greater than the cost of false positives. Moreover, the large AUC value demonstrates that the model still has a high predictive power even without class balance and different threshold conditions, thus it can be applied to the real world.
3.7. Comparative Study with the Traditional Diagnostic Techniques.
The suggested machine learning model was also compared to traditional diagnostic models such as culture-based and effluent analysis that are widely applied to diagnosing infections among APD patients.
Figure 7 shows the comparative advantages of the proposed machine learning framework compared to the traditional methods of diagnostic techniques in terms of speed, accuracy, and automation.
Comparative Evaluation
The proposed method has a number of significant benefits over the traditional methods of diagnosis:
- Rapid Prediction:
Gives almost real time predictions without necessarily having to go through laboratory processing time, which usually delays culture based methods of diagnosis.
- Early Detection Capability:
Allows detection of the risk of infection before definite lab confirmation, allowing timely clinical intervention.
- Reduced Manual Dependency:
Reduces the use of subjective interpretation of clinical parameters, thus minimizing human error and variability.
- Scalability and Automation:
Can be embedded into clinical decision support systems to be constantly monitored and alerted.
Clinical Significance
Although culture testing is regarded as the gold standard, it is of-ten time-consuming (2472 hours) and can postpone treatment decisions. Likewise, effluent analysis relies heavily on clinician experience and might not be able to reflect complicated interactions of features. Conversely, the proposed machine learning system uses multivariate clinical data to deliver fast, accurate, and consistent prediction and can be used to increase diagnostic efficacy and early intervention planning.
4. Discussion
The current paper demonstrates the possibility of machine learning-based approaches to early detection of bacterial infection in patients with automated peritoneal dialysis (APD). The findings demonstrate that data-driven models have the potential to significantly improve the diagnostic accuracy and facilitate earlier clinical intervention than traditional diagnostic approaches. Through systematic clinical and dialysis-related information, the suggested framework offers a scalable and effective approach to conventional approaches which can be restricted by time delays and sensitivity.
4.1. Interpretation of Key Findings
XGBoost was the most consistent model showing the highest performance in all the evaluation measures namely accuracy, precision, recall, and ROC-AUC. It can achieve this high performance because of its gradient boosting architecture that is effective in capturing nonlinear relationships, interactions of higher-order features, and the possibility of class imbalances in clinical data. Random Forest too demonstrated good predictive power which further validated the power of ensemble learning methods in managing heterogeneous and high-dimensional medical data. Conversely, Logistic Regression demonstrated relative underperformance indicating that linear models might not be adequate to capture the interactions and nonlinear interactions that result in the development of infection. The Support Vector machine (SVM) was mediocre but its performance was dependent on the choice of kernel and adjustment of parameters thus limiting its robustness in practice. Taken together, these results provide further evidence of the appropriateness of highly sophisticated ensemble techniques to clinical prediction problems in the case of complex physiological variables.
4.2. Clinical Relevance of Feature Identified
The features of importance and explainability revealed a number of clinically significant predictors of infection, such as the count of white blood cells (WBC), effluent turbidity, body temperature, blood pressure, and whether a person has diabetes or not. These results agree with the existing clinical experience, with high WBC count and cloudy dialysate being the main symptoms of peritonitis. The classification of diabetes as a major risk factor informs about the importance of comorbidities in promoting the vulnerability to infections, probably because of impaired immune function and metabolic imbalance. Likewise, systemic inflammatory reactions with infection onset are manifested in vital signs like temperature and blood pressure. The consistency between the model-based features and the clinical knowledge enhances the validity of the suggested framework and contributes to its translational applications in the real-life healthcare circumstances.
4.3. Explainable Artificial Intelligence Role
One of the strengths of this work is that it incorporates explainable artificial intelligence (XAI), namely SHAP (Shapley Additive Explanations) and enhances the interpretability of the models. In contrast to the conventional black-box models, the approach proposed provides the clear and measurable information about the contribution of single features to the outcomes of prediction. Such interpretability is imperative in clinical practice where the evidence-based decisions should be transparent and explainable clinically. SHAP allows a better interpretation of the model behavior and makes sure that it is consistent with the established medical reasoning by providing both global and instance-level explanations. The implication of this is that not only does the integration of XAI increase the transparency of models, but also makes them more acceptable to clinicians and promotes the integration of machine learning systems into daily clinical practice.
4.4. Comparison with Conventional Diagnostic Approaches
The traditional diagnostic methods of APD-related infections like effluent analysis, Gram staining, and culture-based methods have limitations in the form of long turnaround time (typically 24–72 hours), low sensitivity when infections are at an early stage and dependence on laboratory services. This kind of restriction is likely to result in a lag in diagnosis and empirical treatment options. On the other hand, the given machine learning model enables quick pre-prediction using the clinical information which can be promptly acquired, and early diagnosis prior to lab reports. It also reduces the necessity to use manual interpretation and subjective clinical judgment. These advantages position the proposed system as a supplement to the existing diagnostic procedures whereby it will be capable of offering enhancements of diagnosis efficacy, reduced time to postpone the start of treatment and patient outcome.
4.5. Practical Implications
The proposed framework has great possibilities of being implemented as a clinical decision support system (CDSS) to allow healthcare professionals to identify the patients who are at high risk of infection. Such a system may provide early warning signs, which will help to begin antibiotic treatment in time and reduce the chances of severe complications and hospitalization. Moreover, it may be combined with electronic health records (EHR) and real-time monitoring systems to give a chance to do constant assessments of the risk and directly treat patients. This would assist in changing re-active to predictive healthcare and improve continuity of the treatment and resource use efficiency in APD care.
5. Conclusions
The present paper presents a machine learning-based system to early predict bacterial infection in patients under automated peritoneal dialysis (APD) with the emphasis on predictive quality and the interpretability of the model. The method proposed, which includes clinical, laboratory, and dialysis-related information, is successful in gathering physiological and treatment-associated indicators concerning the emergence of infections. The findings of the experiment suggest that the ensemble learning models, particularly, XGBoost are more accurate, precise, recollect, and discriminative in comparison to the conventional models. Extending explainable artificial intelligence models, such as SHAP, also enhances the transparency of the model since it quantitatively provides information about the contribution of features. This interpretability ensures that it is compatible with the established clinical knowledge and aids in making informed decisions in medicine. This proposed framework has great advantages that surpass the conventional approach of diagnosis, including the ability to forecast extremely rapid at high levels of sensitivity in the early stages of diagnosis, and does not require time-consuming laboratory analysis. These characteristics permit the provision of timely clinical intervention that potentially can reduce infection-related complications, the hospitalization rate, and treatment discontinuation among APD patients. Though these findings are promising, the study is likely to be limited to some extent like using retrospective data and the need to confirm the study on larger and more diversified groups of patients. Such constraints will require overcoming with multi-center research and real-time data combination to ascertain the generalizability and clinical feasibility of the suggested system. In conclusion, machine learning and explainable artificial intelligence provide a well-grounded and clinically relevant remedy to the problem of improving the detection of infections in APD. The proposed framework is likely to be successfully deployed as a clinical decision support tool that can be used to enhance patient outcomes, treatment plans, and make the healthcare provision more efficient.
6. Future Work
Future research should focus on improving the robustness, scalability and clinical utility of the proposed framework for early prediction of bacterial infections in automated peritoneal dialysis (APD). In particular, the integration of large-scale, multi-center datasets is needed to improve the generalizability and scalability of the model across different patient populations and clinical settings. Using real-time data streams from wearable sensors and dialysis monitoring systems would enable continuous monitoring and assessment, facilitating dynamic early warning systems. Moreover, exploring newer deep learning architectures such as recurrent neural networks (RNNs) and long short-term memory (LSTM) models may help capture temporal dynamics in longitudinal patient data. Prospective clinical studies should be conducted to assess the effectiveness, reliability, and impact of the framework in clinical practice. In addition, future research should focus on improving the interpretability and usability of the model through the development of clinician-friendly interfaces and integration with electronic health record systems. Finally, addressing issues related to data privacy, security and regulatory compliance, perhaps through methods such as federated learning, will be crucial to enable large-scale deployment and safe and ethical use of the framework in clinical practice.
References
- D. W. Johnson, B. J. Cho, and S. Badve, “Peritoneal dialysis-related peritonitis: Towards improving evidence, practices, and outcomes,” Am. J. Kidney Dis., vol. 64, no. 2, pp. 278–289, 2014.
- B. Piraino et al., “ISPD position statement on reducing the risks of peritoneal dialysis-related infections,” Perit. Dial. Int., vol. 31, no. 6, pp. 614–630, 2011.
- M. Li et al., “Peritoneal dialysis-related infections recommendations: 2016 update,” Perit. Dial. Int., vol. 36, no. 5, pp. 481–508, 2016.Author 1, A.B.; Author 2, C. Title of Unpublished Work. Abbreviated Journal Name year, phrase indicating stage of publication (submitted; accepted; in press).
- T. H. Davenport and R. Kalakota, “The potential for artificial intelligence in healthcare,” Future Healthc. J., vol. 6, no. 2, pp. 94–98, 2019.Author 1, A.B.; Author 2, C.D.; Author 3, E.F. Title of Presentation. In Proceedings of the Name of the Conference, Location of Conference, Country, Date of Conference (Day Month Year).
- E. J. Topol, “High-performance medicine: The convergence of human and artificial intelligence,” Nat. Med., vol. 25, pp. 44–56, 2019.
- T. Chen and C. Guestrin, “XGBoost: A scalable tree boosting system,” in Proc. ACM SIGKDD Int. Conf. Knowl. Discov. Data Min., 2016, pp. 785–794.Disclaimer/Publisher’s Note: The statements, opinions and data contained in all publications are solely those of the individual author(s) and contributor(s) and not of MDPI and/or the editor(s). MDPI and/or the editor(s) disclaim responsibility for any injury to people or property resulting from any ideas, methods, instructions or products referred to in the content.
- L. Breiman, “Random forests,” Mach. Learn., vol. 45, no. 1, pp. 5–32, 2001.
- C. Cortes and V. Vapnik, “Support-vector networks,” Mach. Learn., vol. 20, no. 3, pp. 273–297, 1995.
- D. W. Hosmer, S. Lemeshow, and R. X. Sturdivant, Applied Logistic Regression, 3rd ed. Hoboken, NJ, USA: Wiley, 2013.
- S. M. Lundberg and S.-I. Lee, “A unified approach to interpreting model predictions,” in Adv. Neural Inf. Process. Syst. (NeurIPS), 2017.
- Z. Obermeyer and E. J. Emanuel, “Predicting the future—big data, machine learning, and clinical medicine,” N. Engl. J. Med., vol. 375, no. 13, pp. 1216–1219, 2016.
- J. Esteva et al., “A guide to deep learning in healthcare,” Nat. Med., vol. 25, pp. 24–29, 2019.
- A. Rajkomar, J. Dean, and I. Kohane, “Machine learning in medicine,” N. Engl. J. Med., vol. 380, no. 14, pp. 1347–1358, 2019.
- F. Doshi-Velez and B. Kim, “Towards a rigorous science of interpretable machine learning,” arXiv:1702.08608, 2017.
- J. W. Tukey, Exploratory Data Analysis. Reading, MA, USA: Addison-Wesley, 1977.
- T. M. Cover and J. A. Thomas, Elements of Information Theory, 2nd ed. Hoboken, NJ, USA: Wiley, 2006.
- T. Jolliffe, Principal Component Analysis, 2nd ed. New York, NY, USA: Springer, 2002.
- T. Hastie, R. Tibshirani, and J. Friedman, The Elements of Statistical Learning, 2nd ed. New York, NY, USA: Springer, 2009.
- R. Kohavi, “A study of cross-validation and bootstrap for accuracy estimation,” in Proc. Int. Joint Conf. Artif. Intell. (IJCAI), 1995, pp. 1137–1143.
- T. Fawcett, “An introduction to ROC analysis,” Pattern Recognit. Lett., vol. 27, no. 8, pp. 861–874, 2006.
- A. L. Goldberger et al., “PhysioBank, PhysioToolkit, and PhysioNet: Components of a new research resource for complex physiologic signals,” Circulation, vol. 101, no. 23, pp. e215–e220, 2000. [CrossRef] [PubMed]
Figure 1.
Cross-validation accuracy comparison.
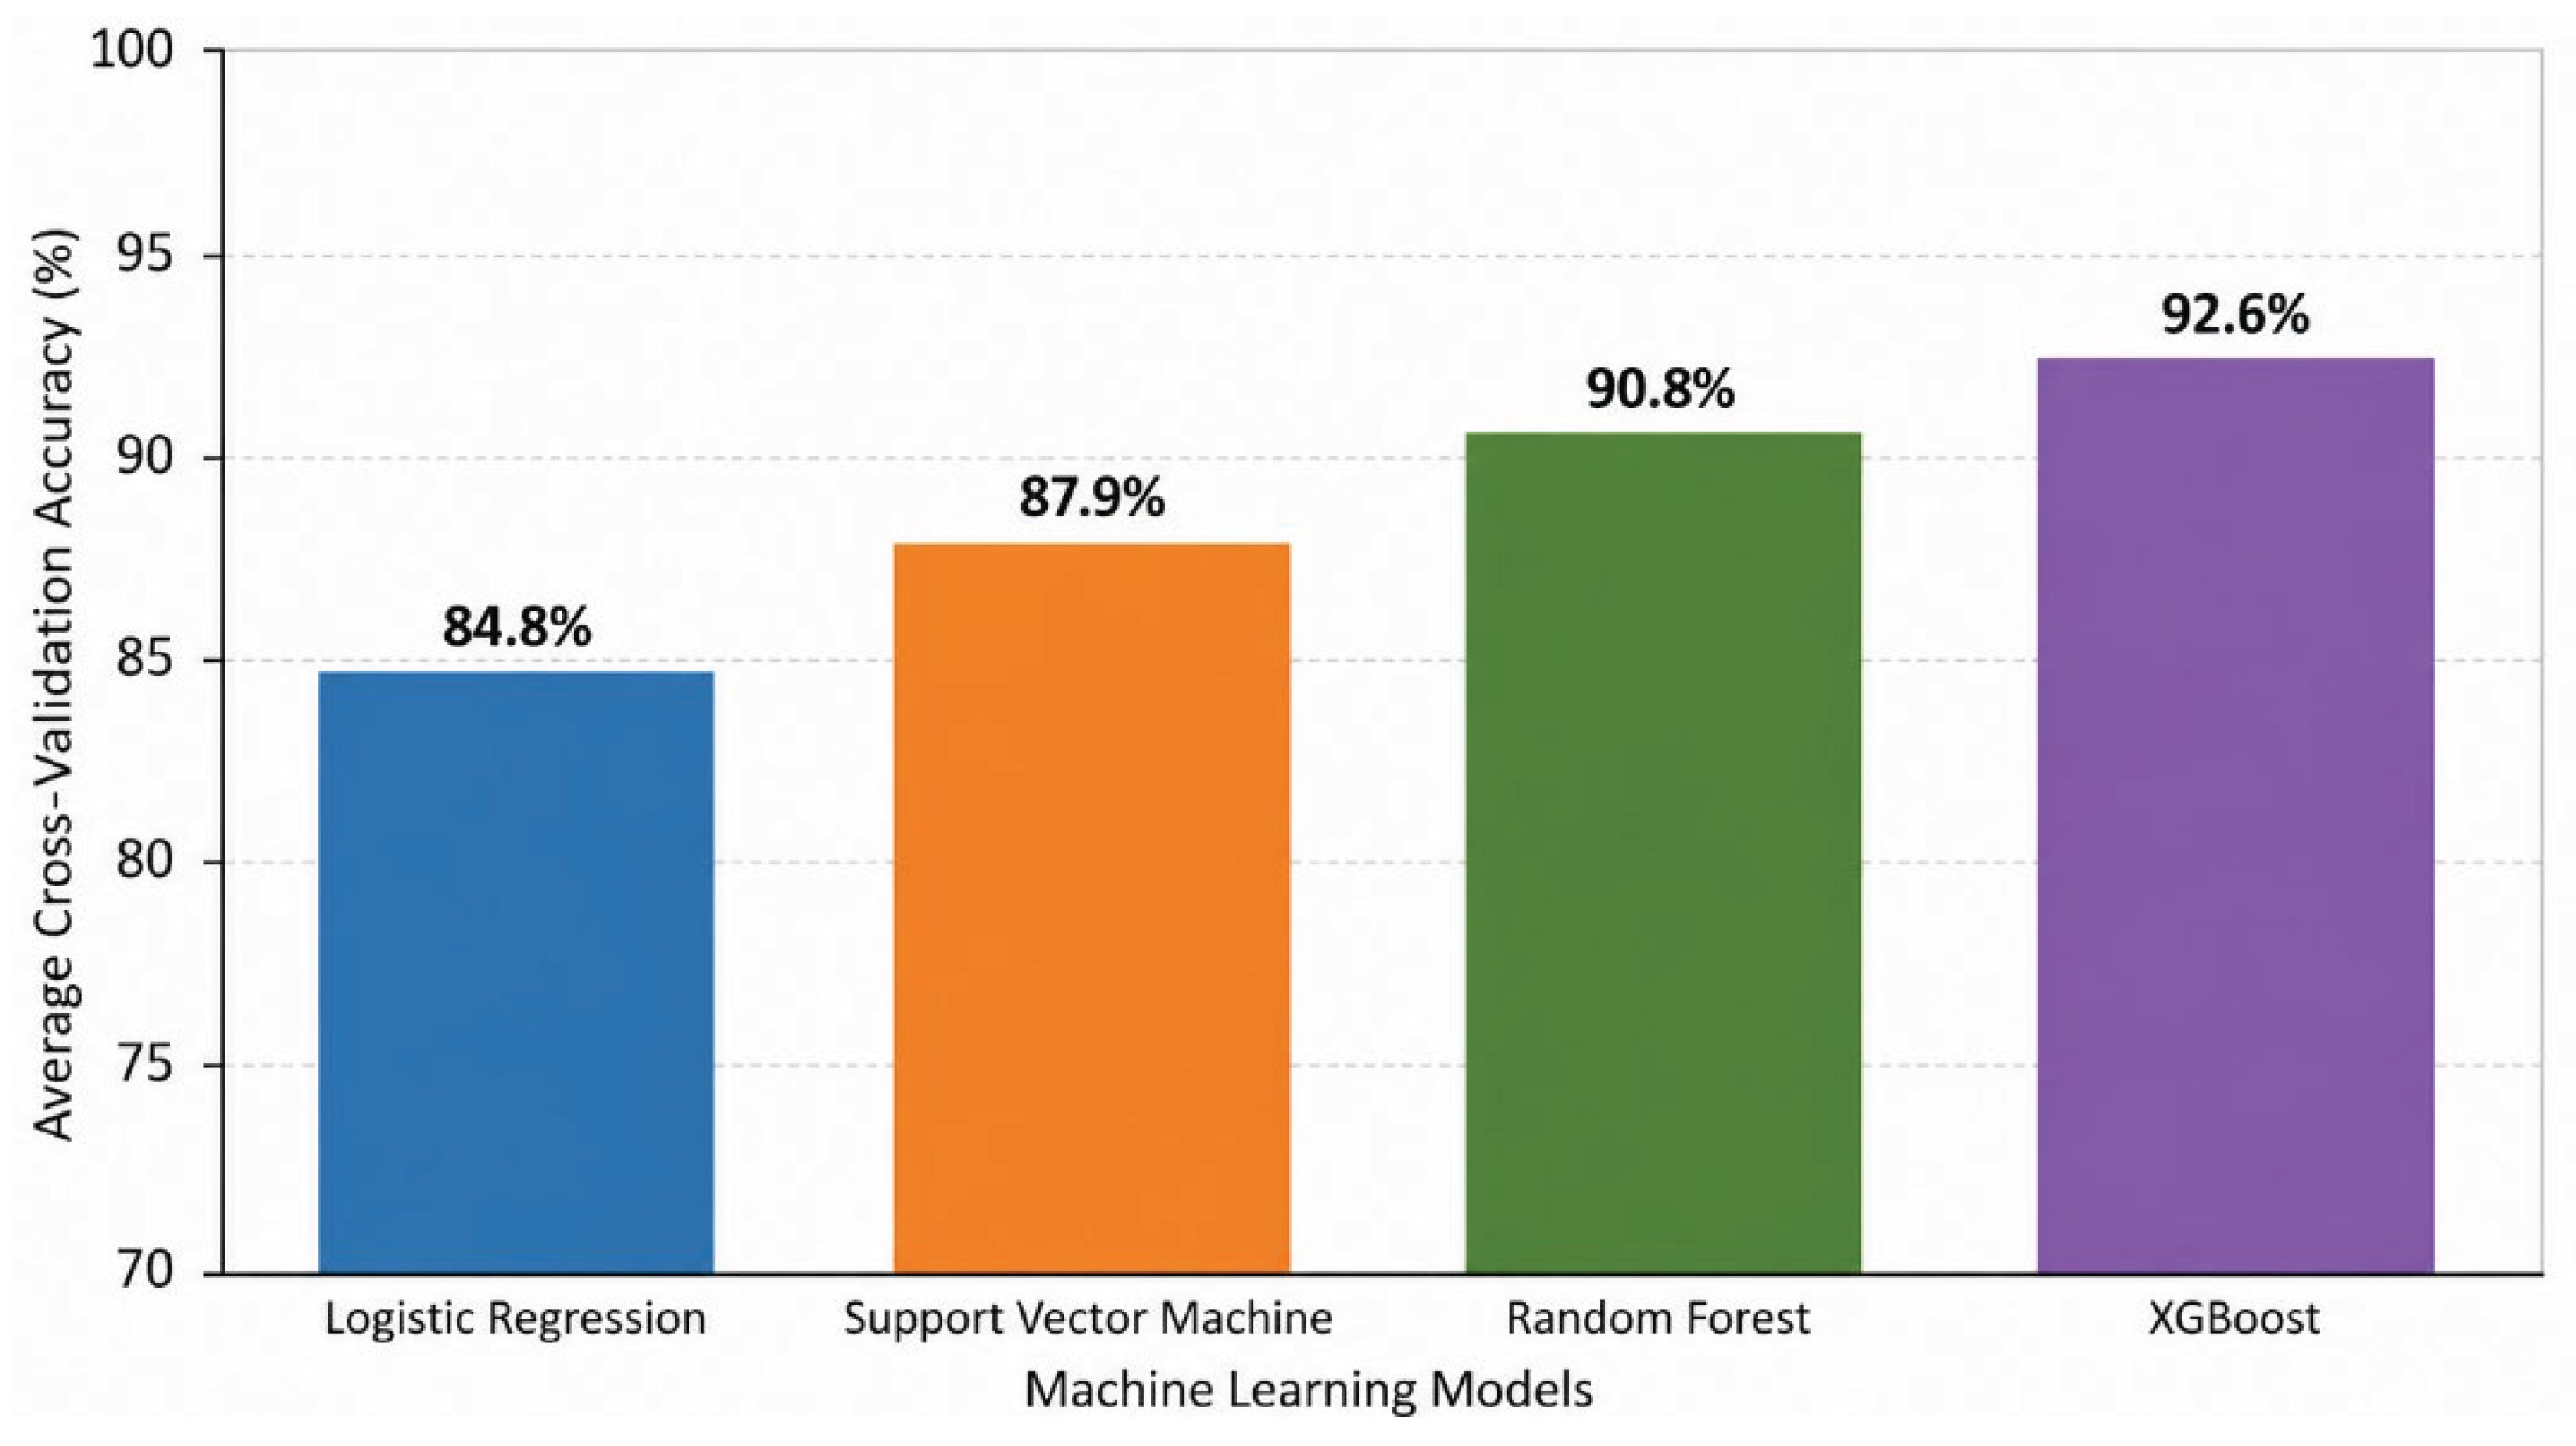
Figure 2.
Cross-validation stability (Mean ± SD).
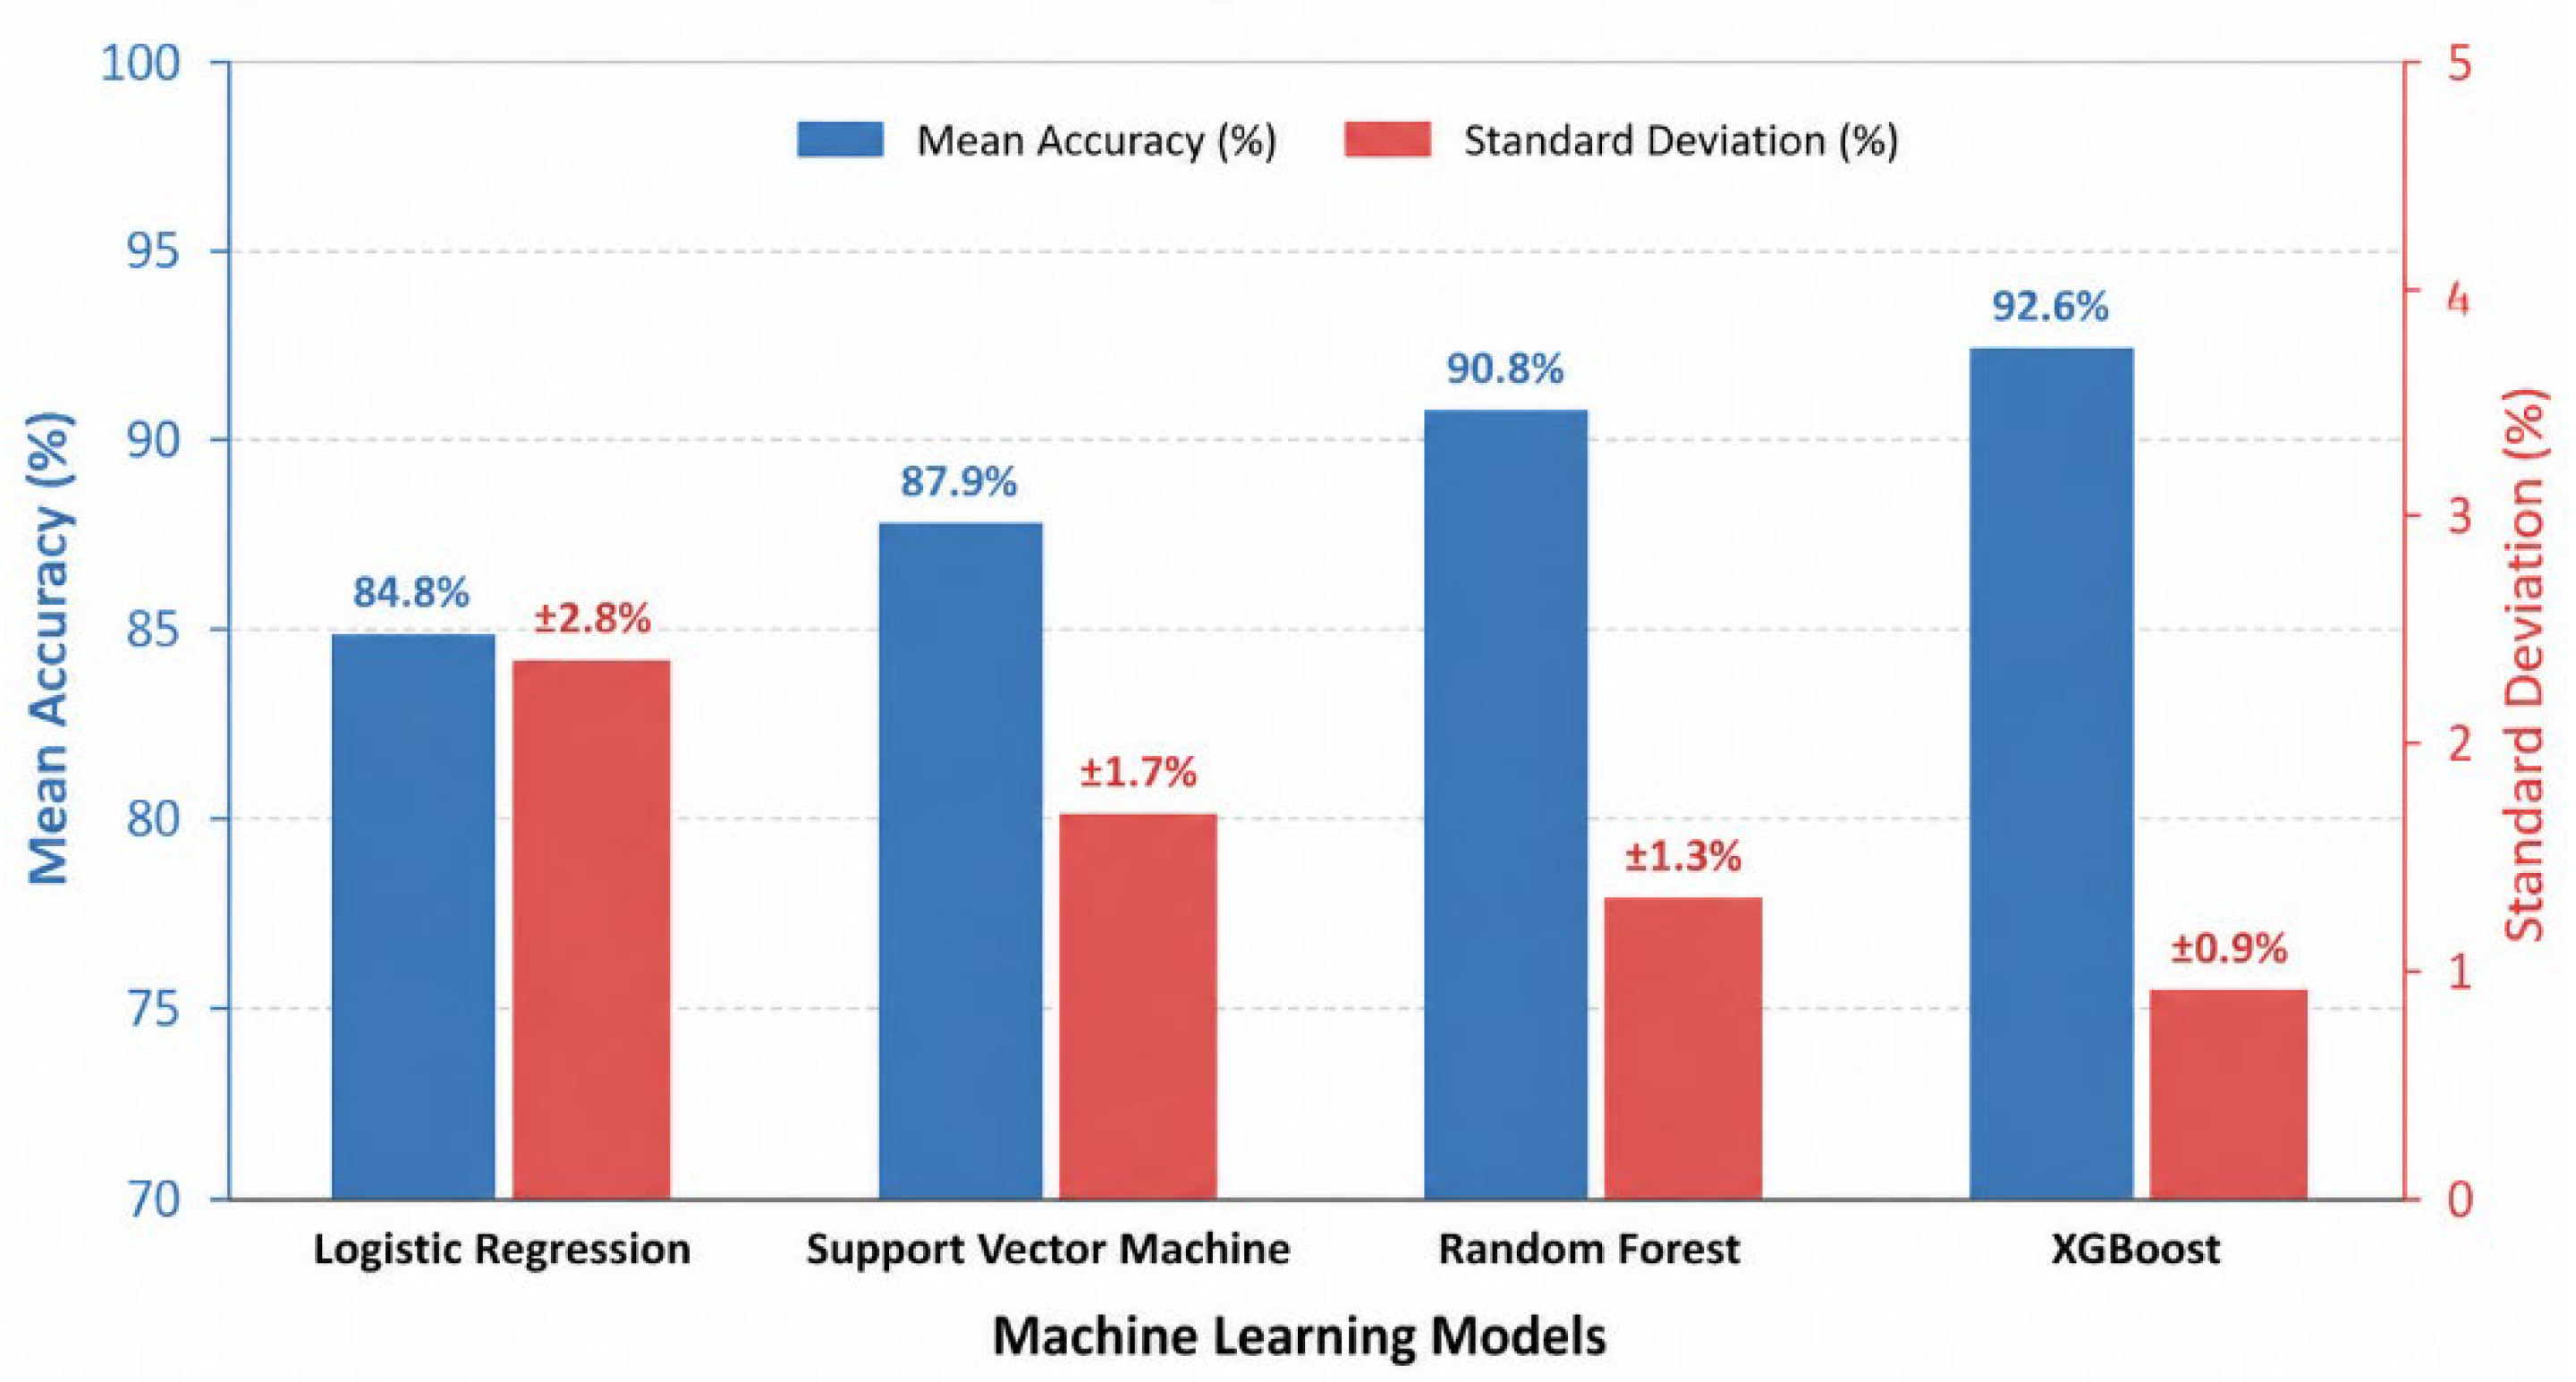
Figure 3.
SHAP feature importance (global interpretation).
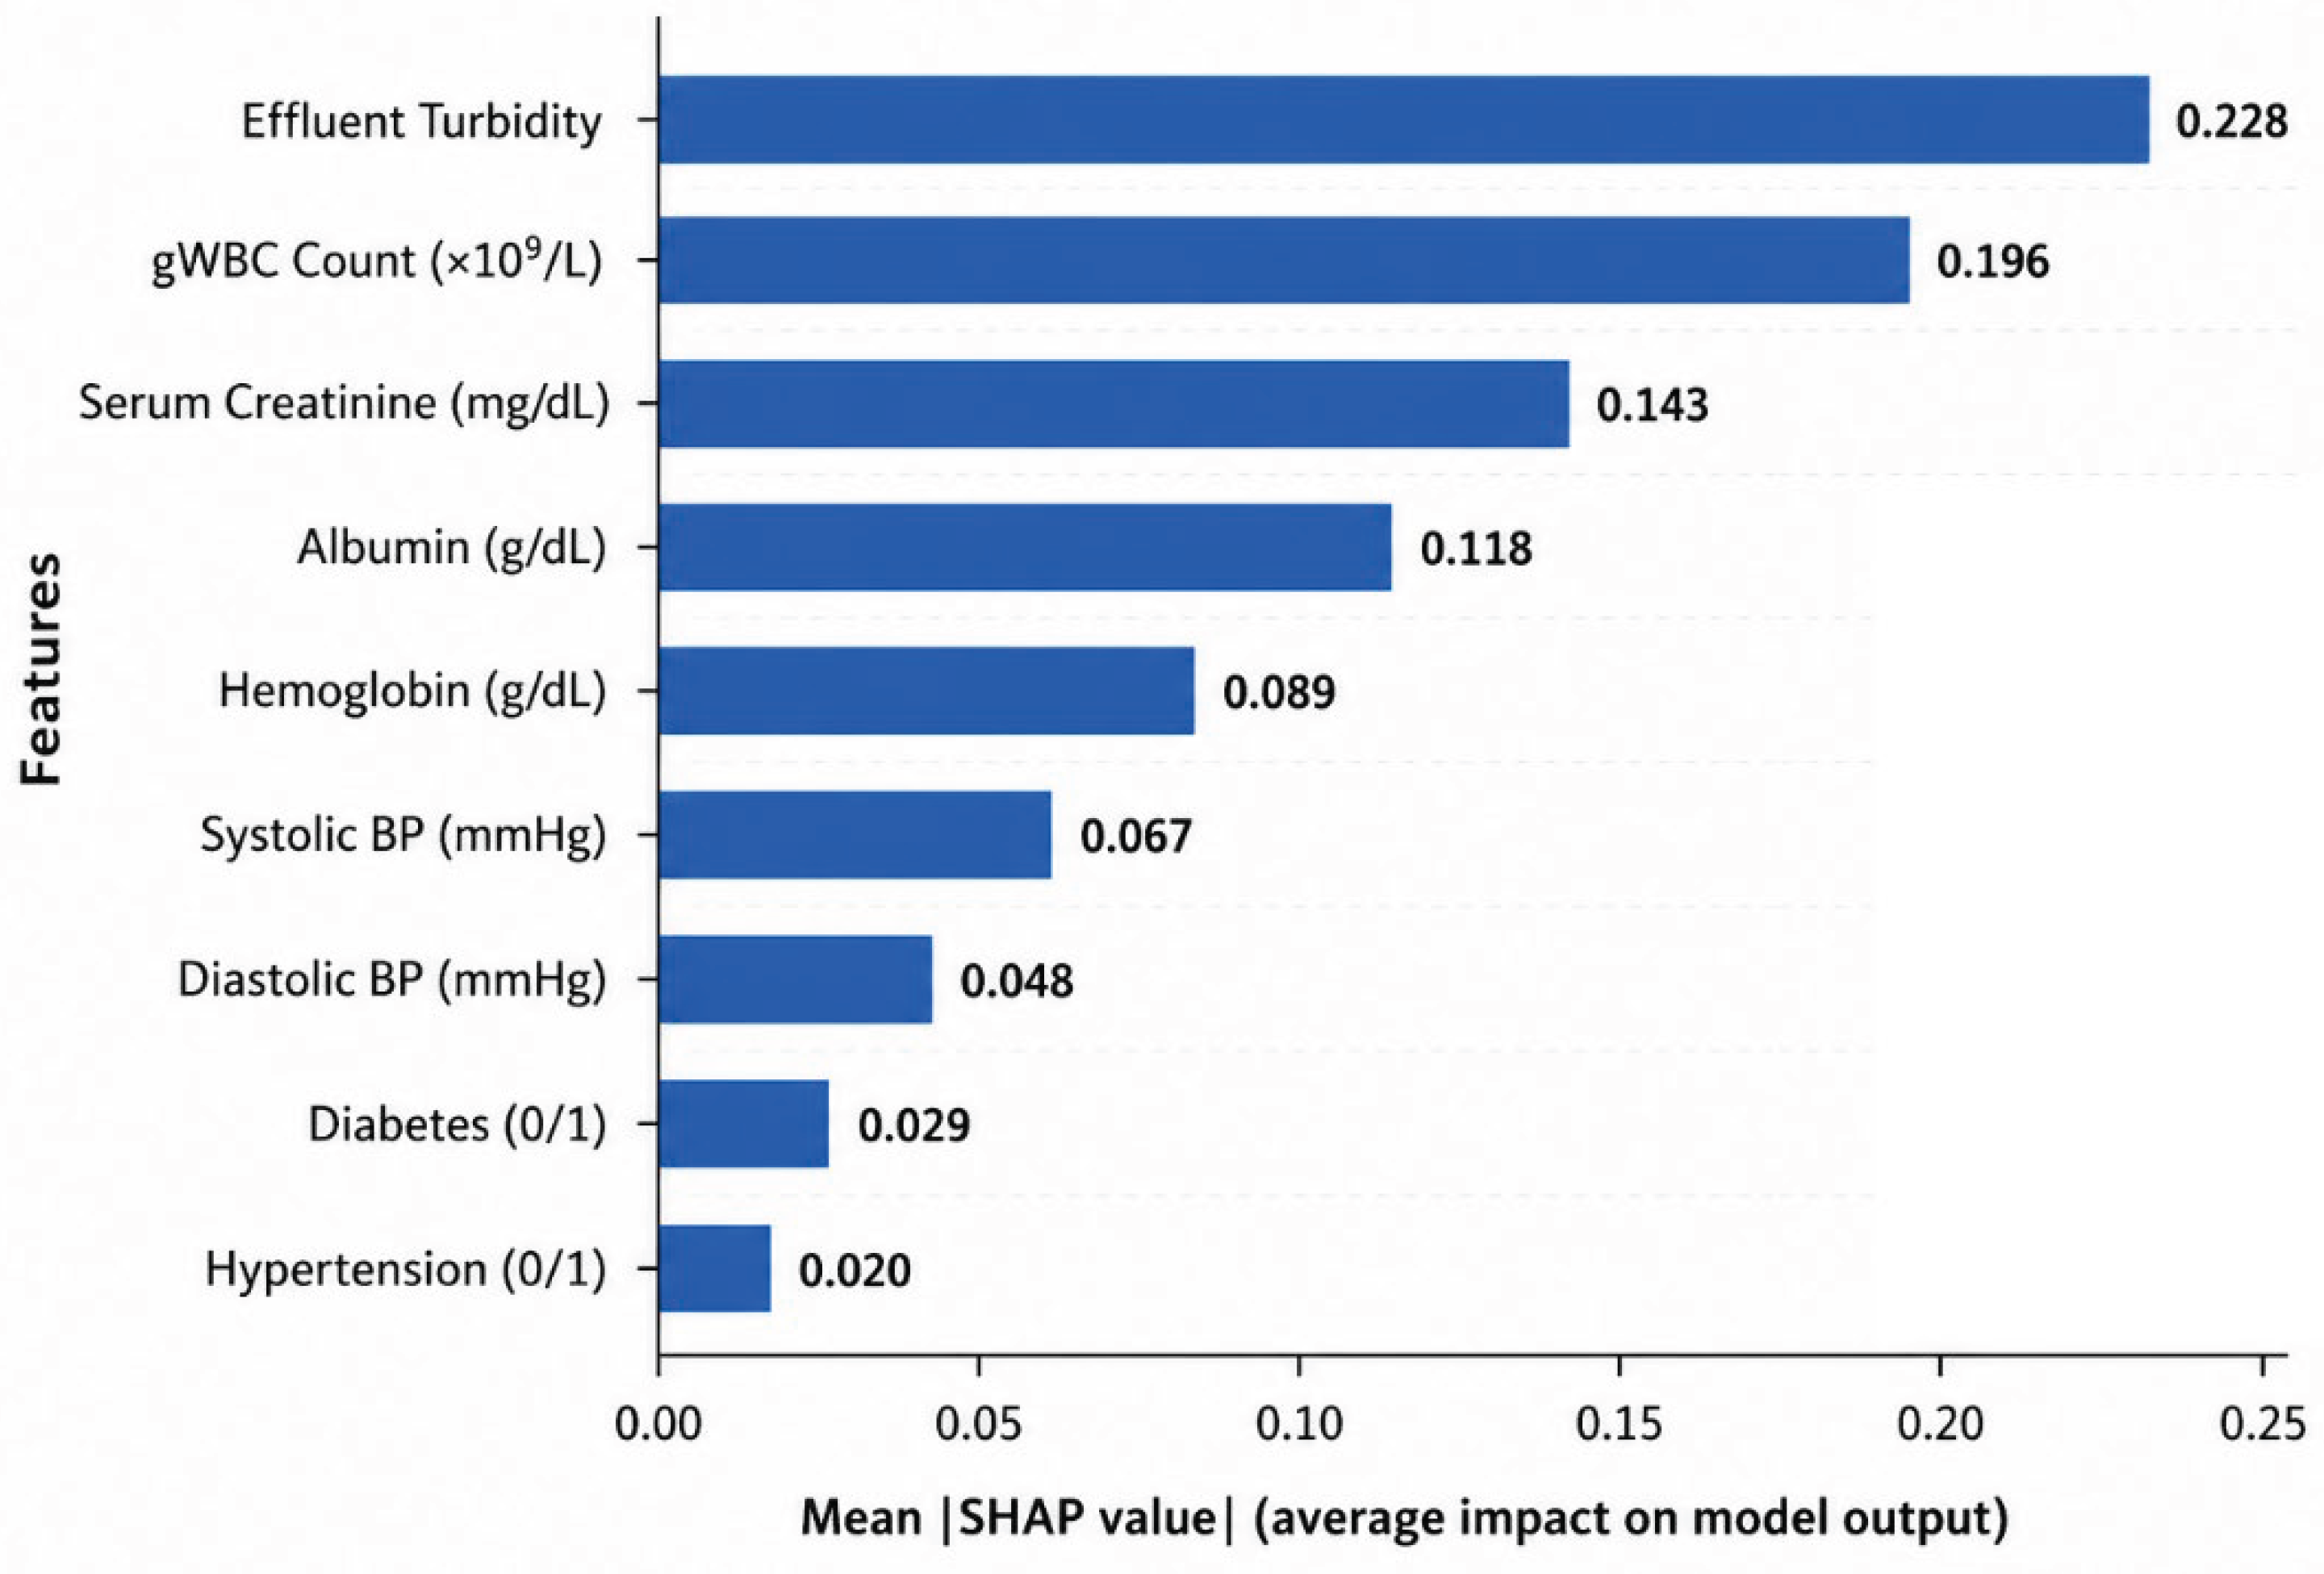
Figure 4.
SHAP summary plot (feature impact distribution).
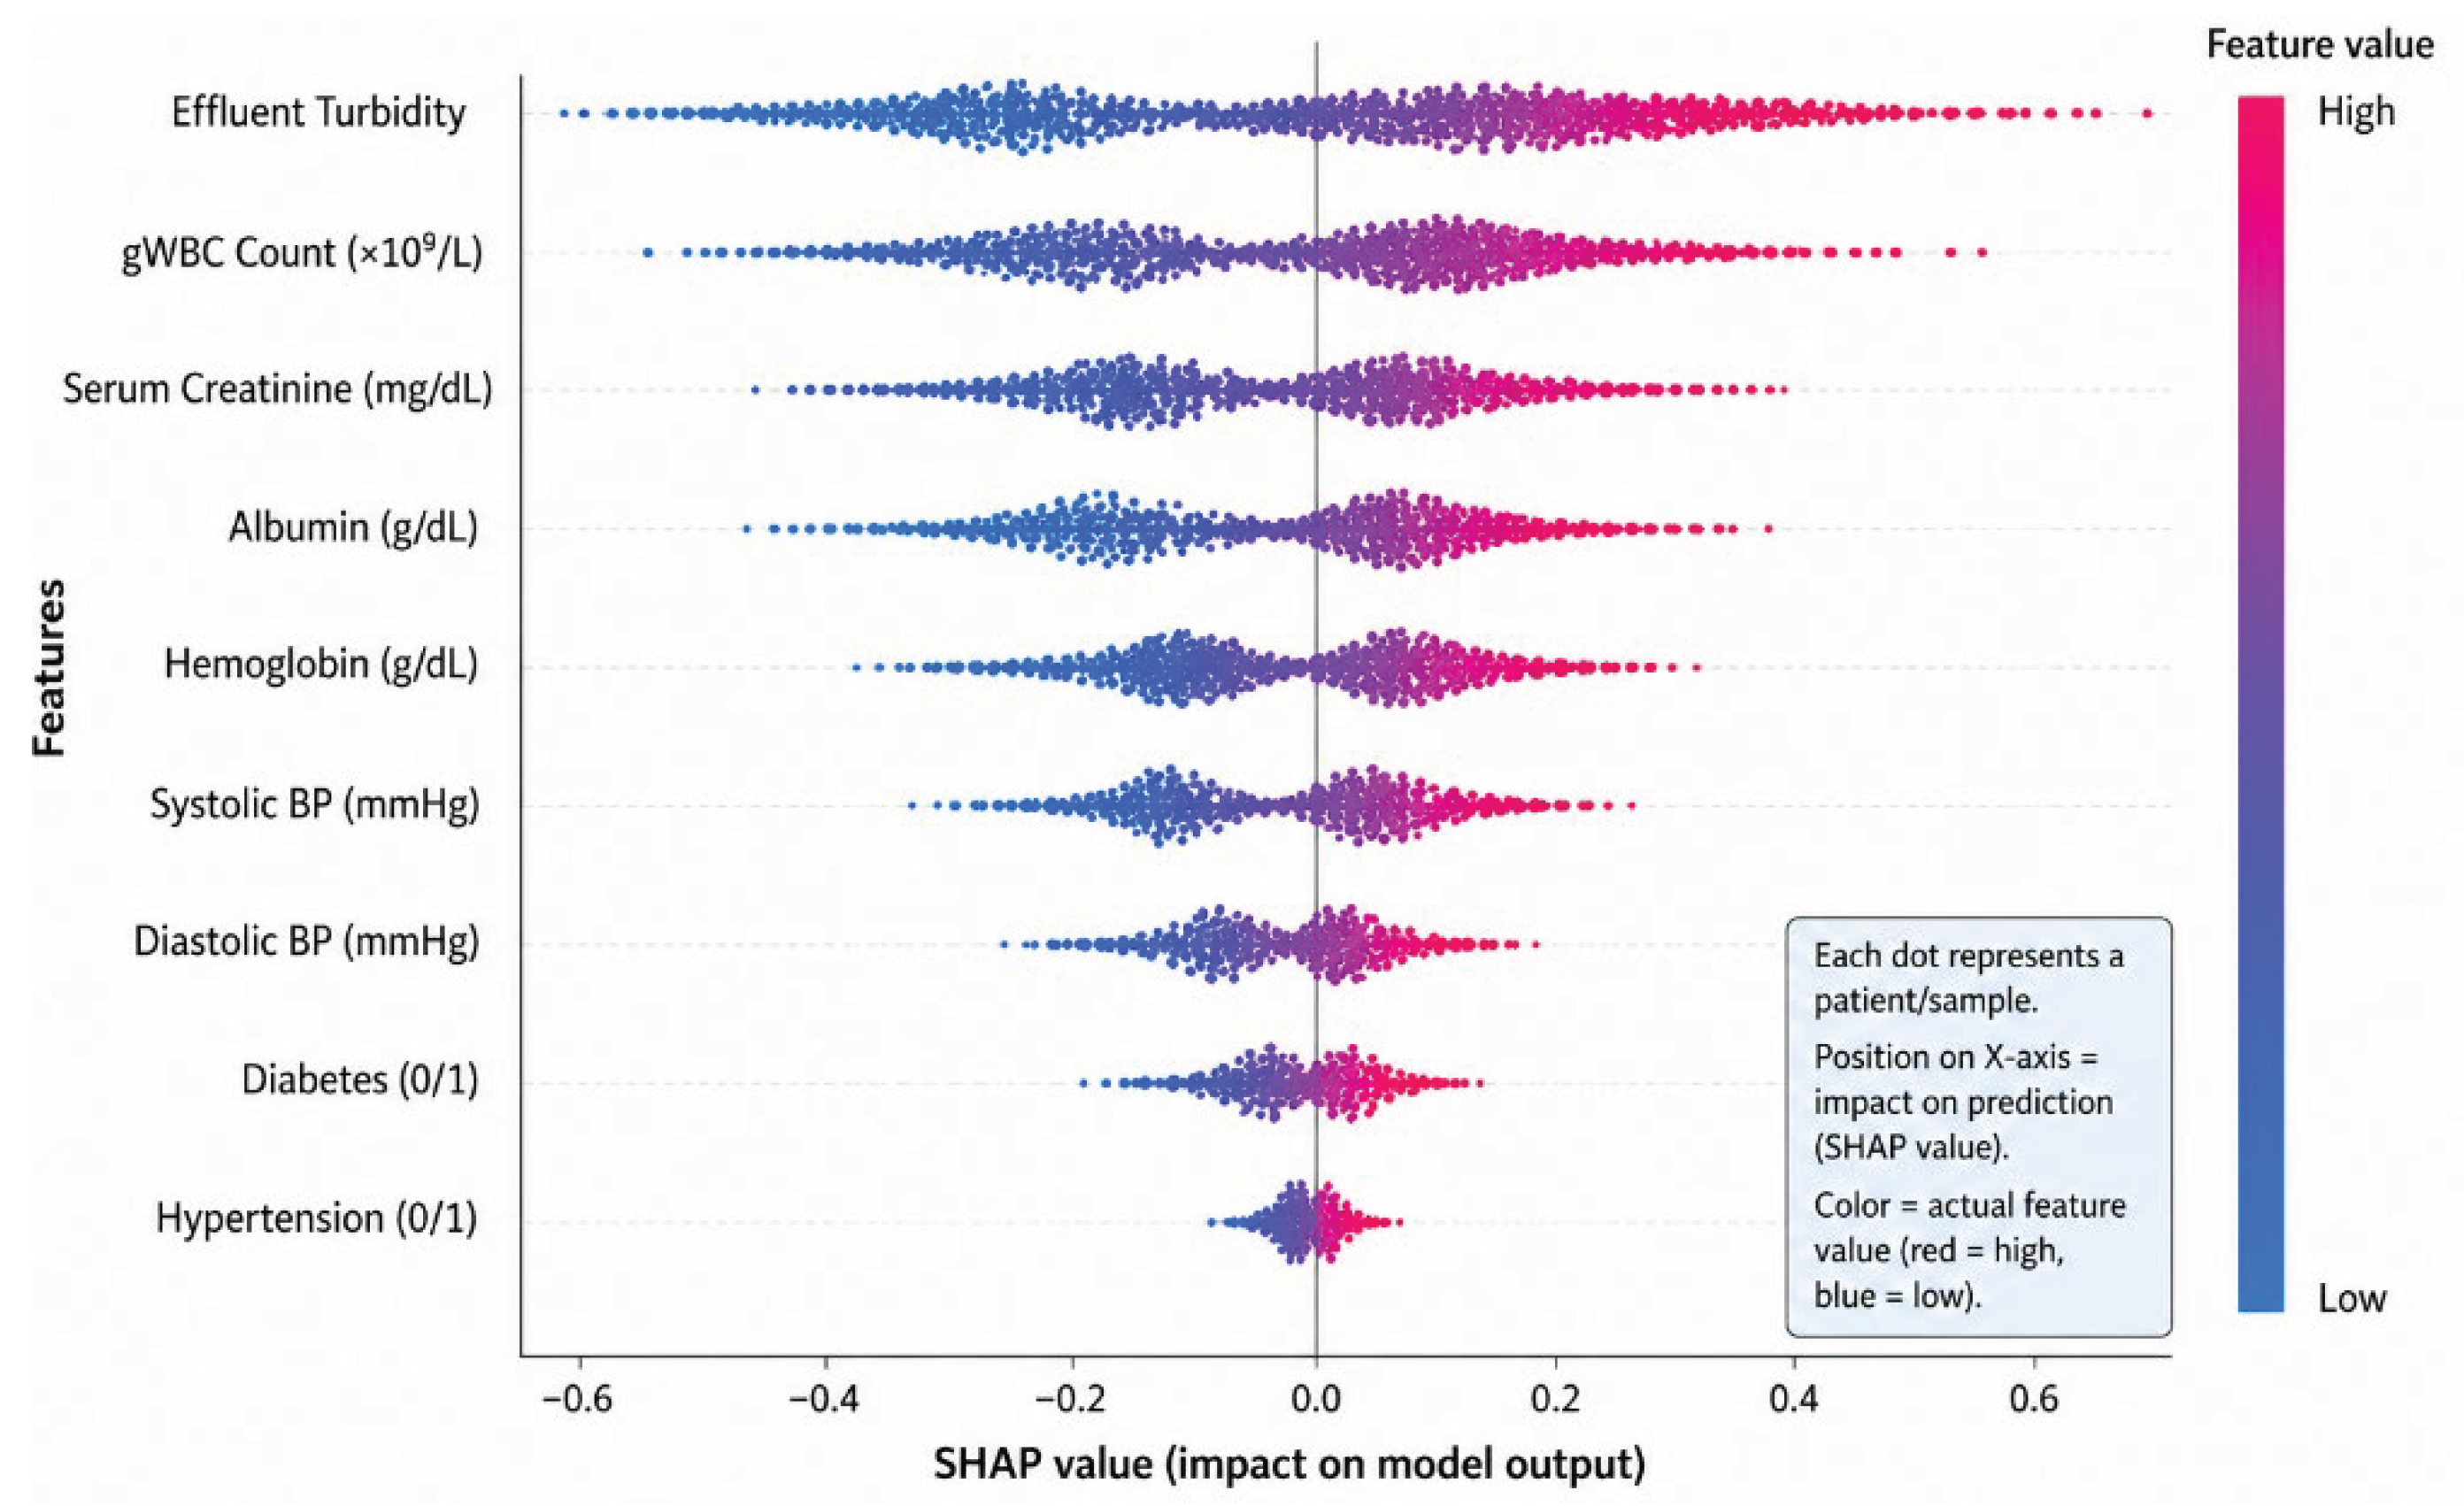
Figure 5.
SHAP summary plot (global feature impact).
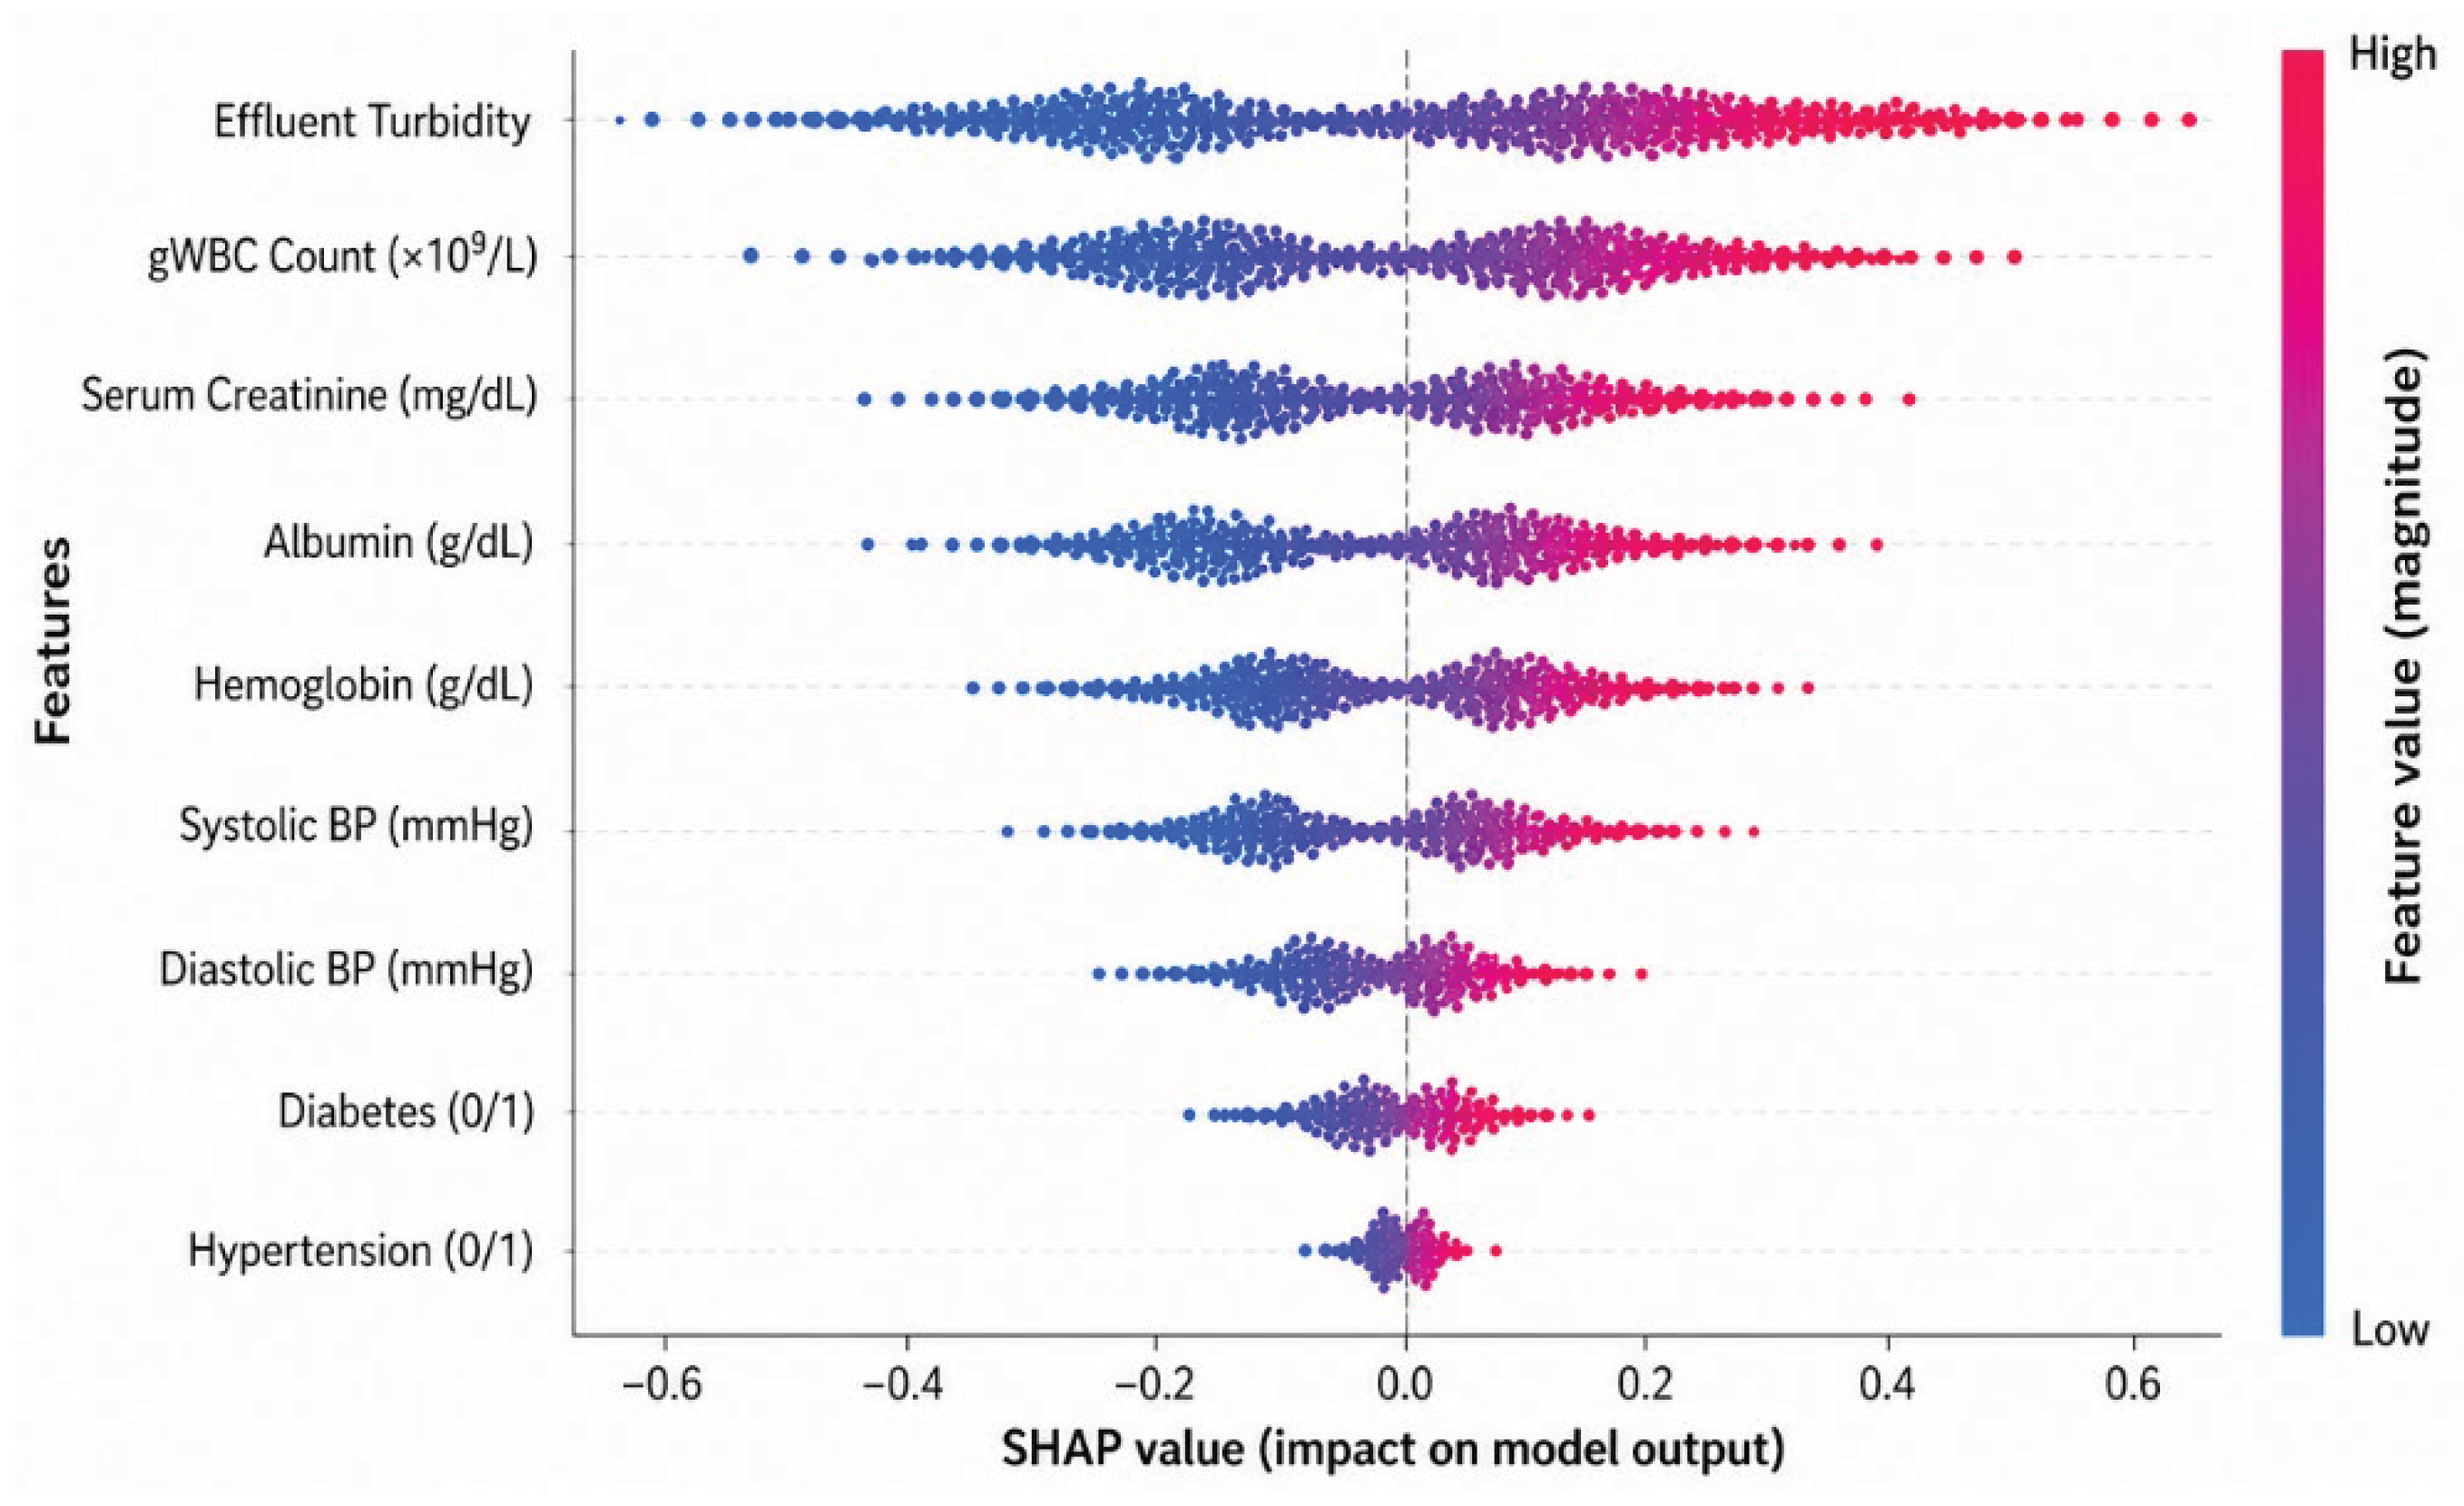
Figure 6.
ROC curves of machine learning models.
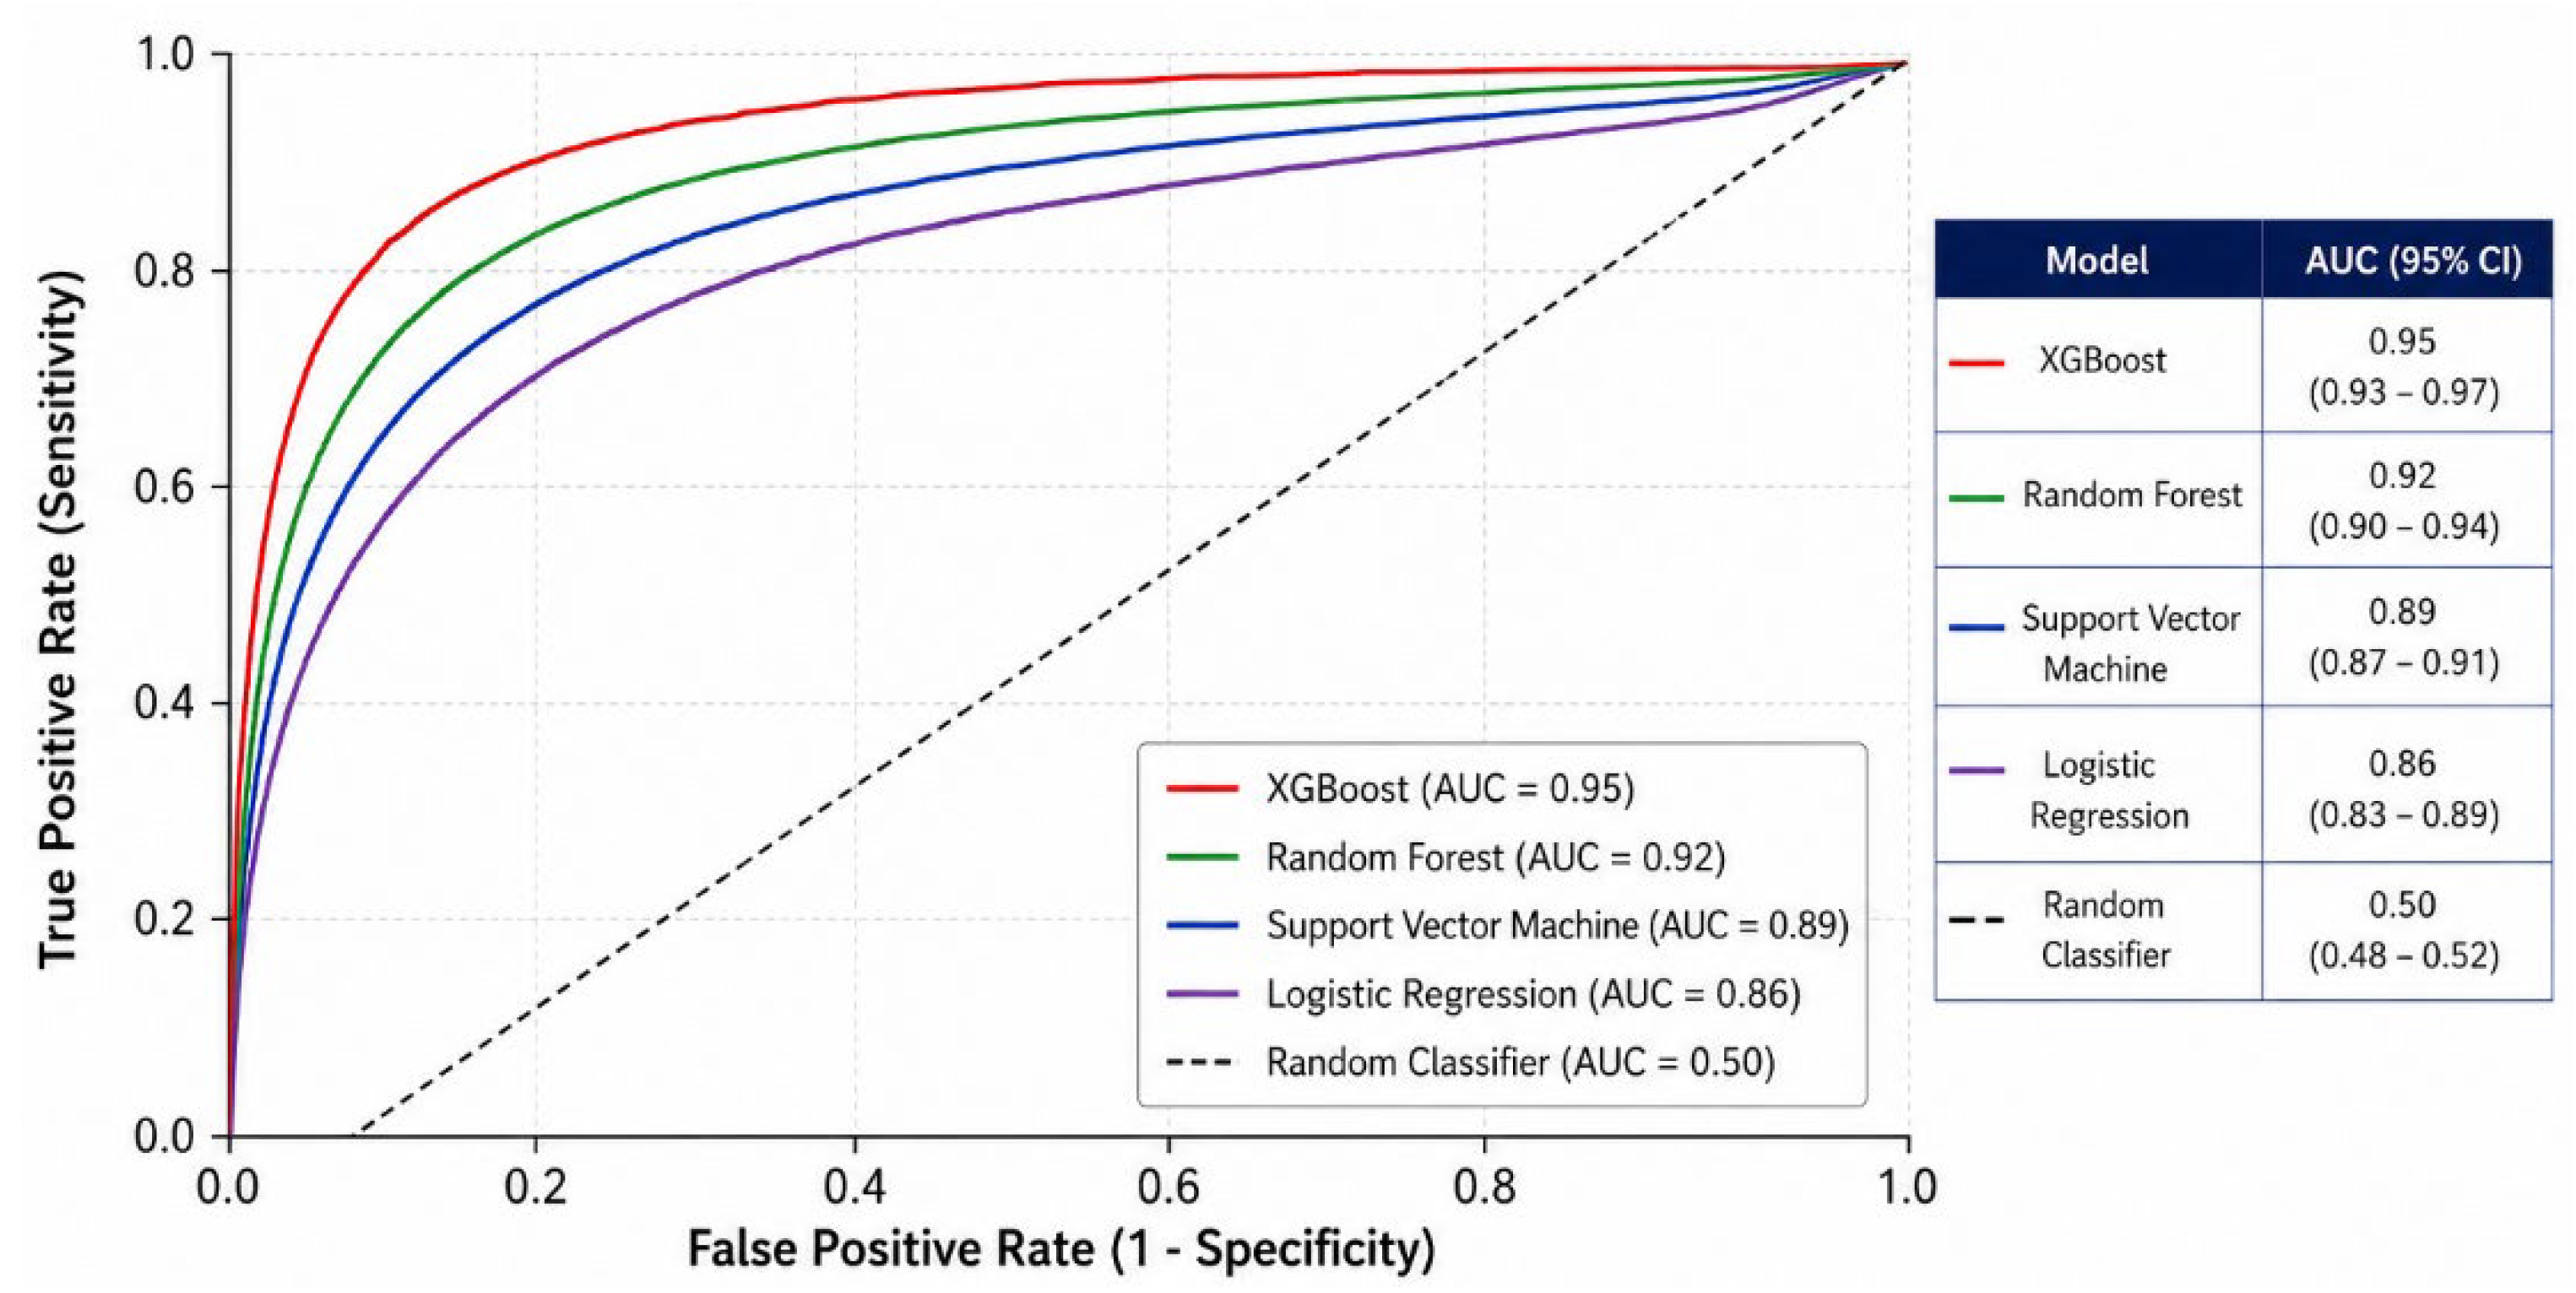
Figure 7.
Comparison of conventional vs ML-based diagnosis.
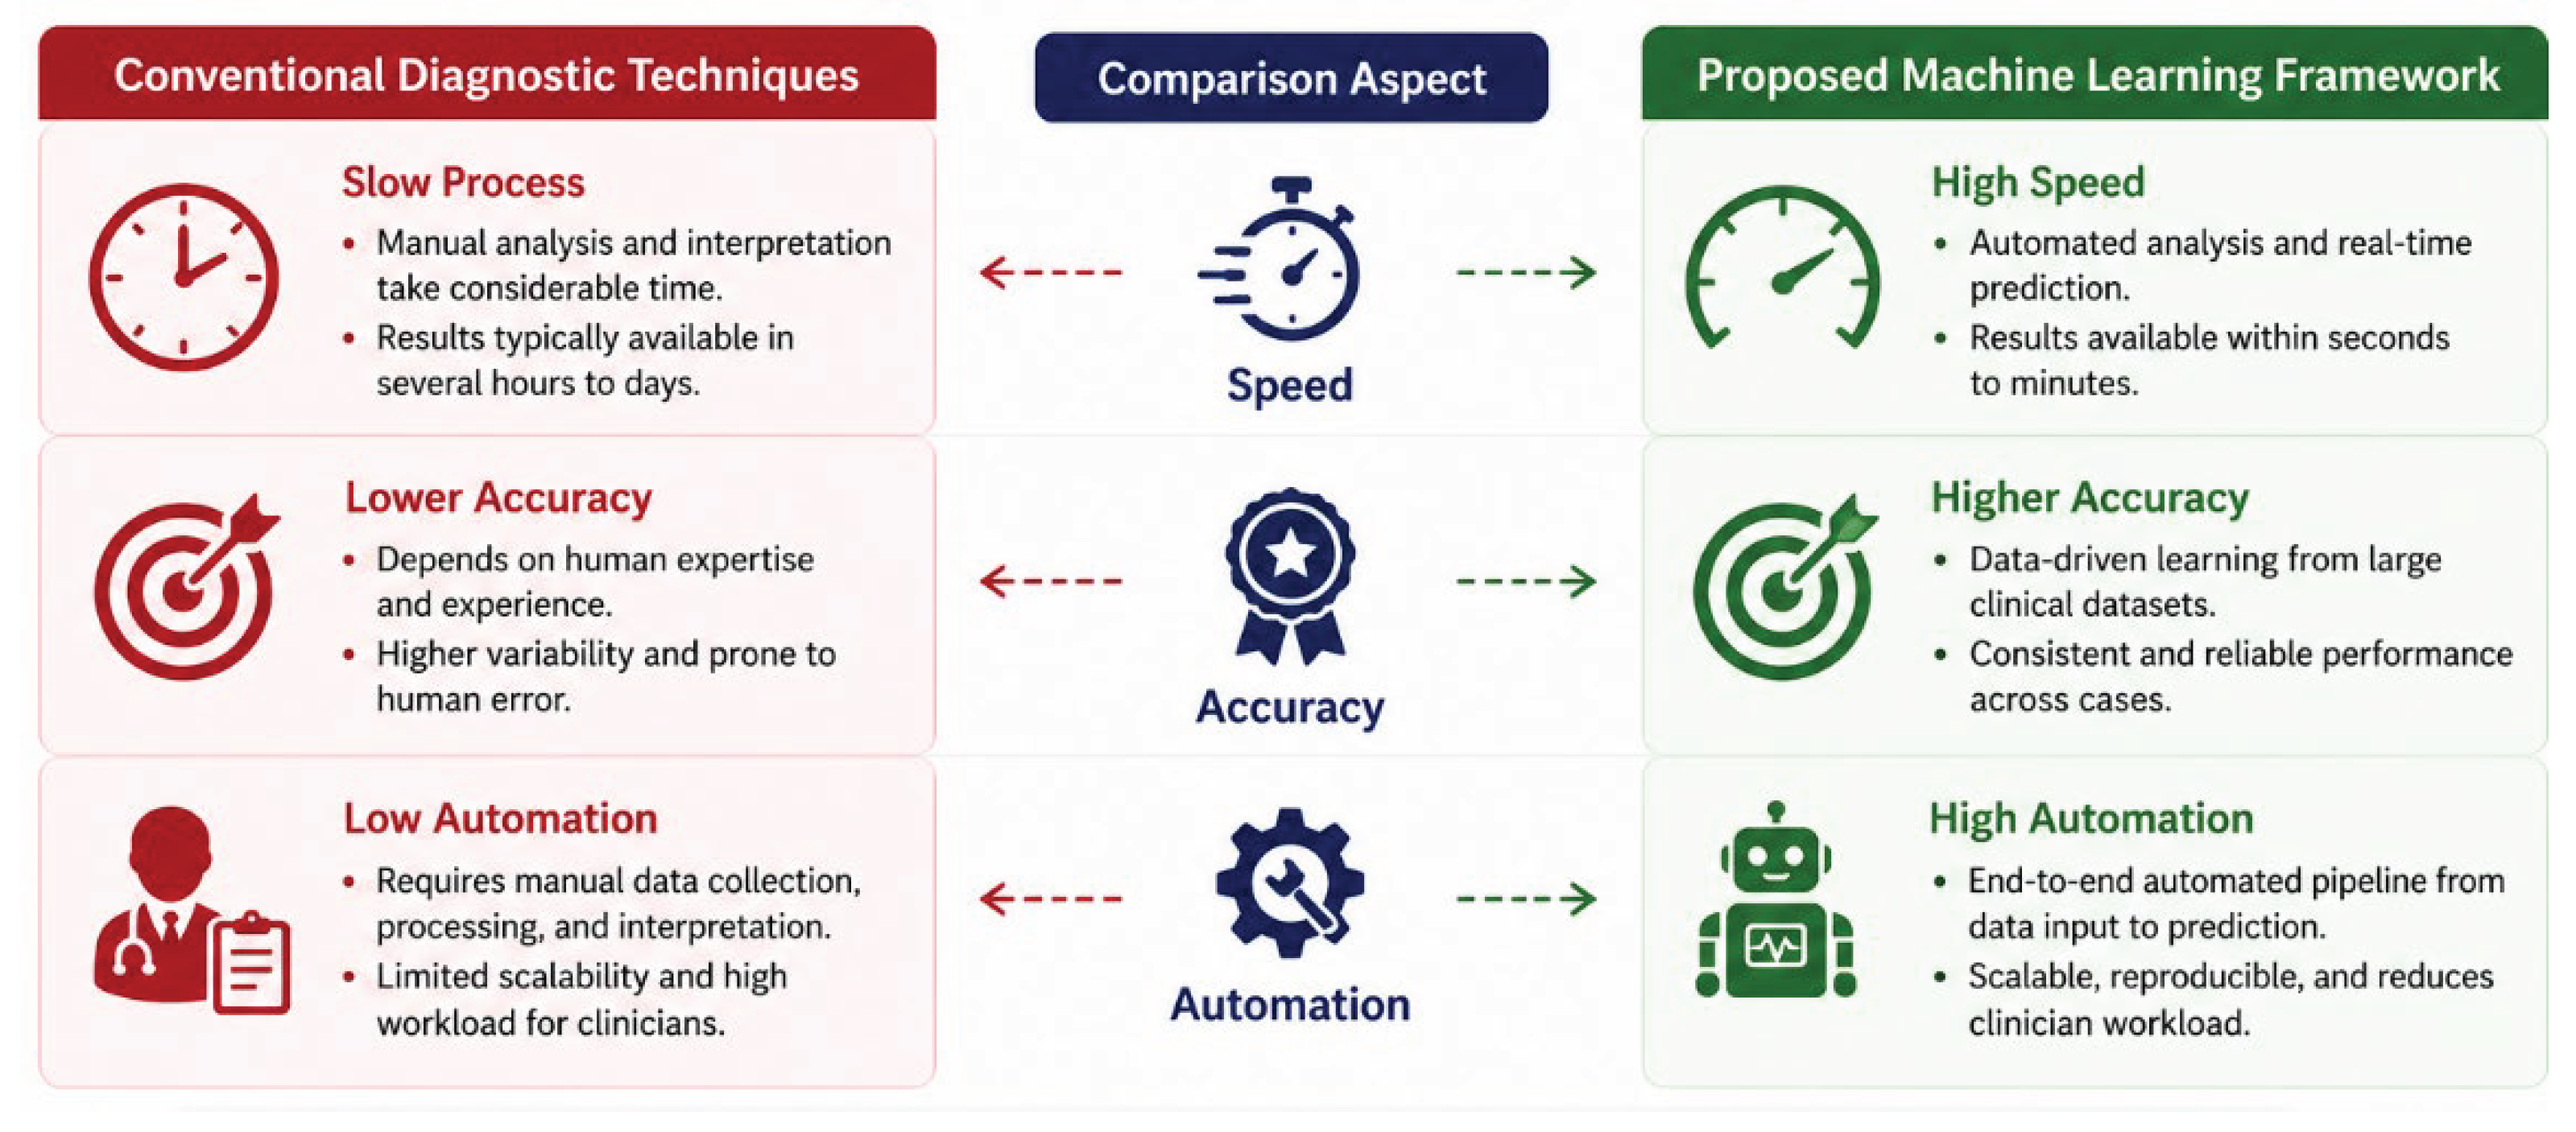
Table 2.
Performance comparison of machine learning models.
| Model | Accuracy (%) | Precision (%) | Recall (Sensitivity) (%) | F1 Score (%) | ROC-AUC |
| Logistic Regression | 85.2 | 83.6 | 82.9 | 83.2 | 0.86 |
| Support Vector Machine | 88.4 | 87.1 | 86.5 | 86.8 | 0.89 |
| Random Forest | 91.3 | 89.7 | 90.2 | 89.9 | 0.92 |
| XGBoost | 93.1 | 91.5 | 92.4 | 91.9 | 0.95 |
Disclaimer/Publisher’s Note: The statements, opinions and data contained in all publications are solely those of the individual author(s) and contributor(s) and not of MDPI and/or the editor(s). MDPI and/or the editor(s) disclaim responsibility for any injury to people or property resulting from any ideas, methods, instructions or products referred to in the content. |
© 2026 by the authors. Licensee MDPI, Basel, Switzerland. This article is an open access article distributed under the terms and conditions of the Creative Commons Attribution (CC BY) license (http://creativecommons.org/licenses/by/4.0/).
Copyright: This open access article is published under a Creative Commons CC BY 4.0 license, which permit the free download, distribution, and reuse, provided that the author and preprint are cited in any reuse.


