

Submitted:
16 April 2026
Posted:
21 April 2026
You are already at the latest version
Abstract
In the present study, data were compiled to compare trunk extension strength between healthy female and male participants. Participants (124 females, 115 males) performed isometric maximal voluntary contraction (MVC) tests in an upright standing position. In addition, upper body weight was determined. Outcome parameters included maximal force values, expressed as torque, as well as upper body weight (also in torque values). Furthermore, the ratio between MVC and upper body weight was calculated. Highly significant differences were observed for MVC (men: 241 Nm, women: 162 Nm, p< 0.0001) and for upper body torque (men: 115 Nm, women: 80 Nm, p< 0.0001). After normalization to upper body torque, no relevant differences between sexes were detectable (men: 2.16, women: 2.00, p=0.0055, Effect size: 0.364). Despite substantial sex-related differences in absolute force capacity, relative strength—when adjusted for upper body weight—does not differ meaningfully between men and women. Both sexes are characterized by a physiological strength reserve of approximately 100% of their upper body weight.
Keywords:
healthy volunteers
; female
; male
; maximum trunk extension force
; upper body weight
1. Introduction
For a long time, diagnostic data, therapeutic recommendations, and, for example, reference values for laboratory parameters were applied uniformly to all patients, regardless of sex. The recognition that such generalizations are not appropriate first emerged in the context of laboratory values—sex-specific reference ranges, particularly for hematological parameters, have been established for approximately 100 years. However, other sex-specific laboratory parameters have only become established over the past 30–40 years [1]. In clinical diagnostics, sex-specific symptoms are now also taken into account; a prominent example is the differing presentation of myocardial infarction symptoms between men and women [1].
Today, sex-specific approaches in diagnosis and therapy have become the rule rather than the exception in medicine.
Sex-specific differences are particularly relevant for parameters related to anthropometric characteristics [2] as well as physical performance [3]. Interestingly, according to the literature on this topic, no systematic sex differences can be identified in the fiber type composition of skeletal muscle [4,5]. Instead, individual factors—primarily genetic and psychosocial—play a decisive role.
However, within this generally comparable distribution of muscle fiber types, sex differences do exist: men typically exhibit a larger muscle fiber cross-sectional area than women [5]. This is particularly evident in type II fibers, whose diameters are significantly greater than those of type I fibers in men, whereas such differences are not observed in women [4].
A similar pattern is observed in anthropometric data of healthy individuals: women are, on average, shorter and lighter than men [2]; nevertheless—or perhaps precisely for this reason—no systematic sex differences in body mass index (BMI) can be identified [6]. However, sex-specific reference values are increasingly being recommended for this parameter as well, since body composition differs between women and men [7] and is additionally influenced by age [7].
The function of the back muscles, in conjunction with the abdominal musculature, is to provide an adequate balance between stability and mobility of the spine in order to prevent injury. In this context, three functional domains can be identified: maximal strength capacity, endurance capacity, and appropriate coordination with respect to the timing of muscular activation [8,9], as well as the aspect of intermuscular coordination.
Particularly with regard to maximal strength capacity, women appear to be at a disadvantage, as their values are estimated to be approximately 30% lower than those of men [10].
Therefore, the aim of the present study was to investigate the extent to which such differences can be observed when strength values are normalized for anthropometric characteristics. The primary outcome parameter was the maximal strength capacity of the trunk extensors normalized to upper body weight.
2. Methods
The present study includes data from a total of seven prior investigations in which the same parameters were assessed. All studies were conducted on healthy voluntary participants of both sexes and received approval from the respective ethics committee (4348-02/15, 2021-2373-BO, 2021-2373_1-BO, 2024-3462-BO, 2024-3634-BO-A). Participation was based on written informed consent provided by all subjects.
In total, data from 115 women and 124 men aged 18–52 years were included in the present analysis. All participants were healthy, reported no acute back pain or back pain within the previous three months, and were either physically inactive or only moderately active. Individuals engaging in regular physical exercise more than twice per week were excluded, as were individuals with a BMI greater than 32 kg/m². The complete anthropometric characteristics of the cohort are presented in Table 1.
Investigation
All measurements were conducted using a computer-assisted testing and training device (CTT Centaur, BfmC, Germany). In the device participants stood in an upright position, with the lower body fixed while the upper body remained mobile. The system is equipped with a shoulder harness that is lowered onto the participants’ shoulders. Integrated force sensors within this harness are capable of measuring forces in both the sagittal and frontal planes.
Maximal trunk extension force was assessed following a standardized warm-up protocol with submaximal loads. The MVC measurement itself was performed three consecutive times, each lasting five seconds, with rest intervals of five seconds between trials. Participants were instructed to reach maximal force within approximately one second, maintain this level for two to three seconds, and then relax. Verbal encouragement was provided during each trial [11,12,13].
To familiarize participants with the procedure, the first trial was conducted as a practice run at approximately 50% of maximal effort. During the measurements, participants crossed their arms in front of their chest (Figure 1).
Additionally, upper body weight was measured by tilting the CTT Centaur forward by 90° and having participants rest relaxed in the shoulder harness, with arms and head hanging freely. In this relaxed posture, upper body weight was recorded. The procedure was repeated three times, and the highest plausible value was used as the valid upper body weight (UBW) for further analysis. According to the procedure described, the UBW measured here comprises the torso, arms, and head.
The measured force values were converted into torques to account for differences in body size and to provide directly comparable values for analysis.
Analyzed Parameters
The highest force value of the three extension trials was taken as the MVC (maximum voluntary contraction) value. This value was analyzed both as force and as torque. The measured maximal force values were then related to the upper body weight, yielding the upper body torque ratio (UBTR).
Statistics
Sex comparisons were conducted using the independent-samples t-test. In addition, effect sizes (ES) were always calculated [14].
As the aim was to provide an overview of strength performance values based on data from multiple studies, both sex groups featured a large sample size. A post hoc power analysis indicated that for an ES of 0.5, a power of 0.8, and an assumed significance threshold of 0.05, a sample size of 64 per group would have been sufficient. Our group sizes were approximately twice as large.
To avoid Type II errors due to the large sample sizes, the minimal important difference (MID) was additionally calculated as a mathematically defined measure (SD/2) to identify differences considered relevant relative to the difference in means. A detected difference between compared values was only considered relevant if the mean difference exceeded the MID. Furthermore, regarding the ES differences were only considered relevant if the ES was at least 0.5. Accordingly, only results meeting all three criteria: p < 0.05, ES > 0.5, and mean difference > MID were reported as significant.
3. Results
4. Discussion
With respect to the MVC data, the results are not surprising, as men are generally expected to exhibit considerably higher maximal strength than women [15]. This is reflected in the maximal strength data, which in the present analysis were approximately 45% higher in men than in women. Corresponding findings have been consistently reported in the literature [10].
What is rarely measured, however, is the upper body weight of the study population. There is virtually no standardized solution available that is cost-effective, practical, and reliable [16,17]. By implementing specific modifications to the device used, it was possible to capture force measurements in the tilting direction, which in combination with the lower-body-restricted fixation of participants allowed us to determine upper body weight for all subjects. In general, reliable measurements can be expected from the device employed [18].
Using this approach, we were able to determine individual upper body weight directly, not by modelling. To our surprise, relevant sex differences were also observed, with men's upper body weighing approximately 35% more than women. As we found no normative data in the literature, these measurements already represent novel findings.
The findings for the UBTR were somewhat surprising: although the p-value indicated significance, this was ultimately deemed not relevant when considering the effect size (0.421 – low [14]) and the MID (larger than the mean difference). Thus, both sexes exhibit a comparable ratio of maximal trunk extension force to upper body weight. The existing differences in maximal force are compensated by the considerably lighter upper body in women. Consequently, the physiological reserve - that is, the remaining strength surplus - remains at a comparable level for both sexes. Similar observations have been reported in the literature, where values normalized to body weight also eliminated the differences in MVC [19].
The presented data also provide reference values for the UBTR, which equals approximately to 2.0 for women and 2.1 for men. This indicates that a physiological strength reserve of roughly 100% of upper body weight can be assumed in both sexes. The calculated MID of approximately 0.2 further allows to identify deviations from the norm, enabling evidence-based recommendations for intervention if values fall below the UBTR’s margin of variability.
Limitations
The investigations were conducted in a specialized testing environment. The used device (CTT Centaur) is not part of the standard equipment in diagnostic or therapeutic settings. Therefore, the results should be interpreted with caution, as they may be device-specific. On the other hand, all 258 participants were tested using the same device, which supports the robustness of the observed sex differences. The provided approach to assess the results of the statistical analyses may be subject to debate. Further studies are warranted to verify the drawn conclusions.
References
- Mauvais-Jarvis, F.; Bairey Merz, N.; Barnes, P.J.; Brinton, R.D.; Carrero, J.J.; DeMeo, D.L.; De Vries, G.J.; Epperson, C.N.; Govindan, R.; Klein, S.L.; et al. Sex and gender: modifiers of health, disease, and medicine. Lancet 2020, 396, 565–582. [Google Scholar] [CrossRef] [PubMed]
- Greil, H. Körpermaße 2000: aktuelle Perzentilwerte der deutschen Bevölkerung im jungen Erwachsenenalter. Available online: http://opus.kobv.de/ubp/volltexte/2005/388/ (accessed on 18.08.2005).
- Jaafar, M.H.; Ismail, R.; Ismail, N.H.; Md Isa, Z.; Mohd Tamil, A.; Mat Nasir, N.; Ng, K.K.; Ab Razak, N.H.; Zainol Abidin, N.; Yusof, K.H. Normative reference values and predicting factors of handgrip strength for dominant and non-dominant hands among healthy Malay adults in Malaysia. BMC musculoskeletal disorders 2023, 24, 74. [Google Scholar] [CrossRef] [PubMed]
- Rantanen, J.; Rissanen, A.; Kalimo, H. Lumbar muscle fiber size and type distribution in normal subjects. European spine journal: official publication of the European Spine Society, the European Spinal Deformity Society, and the European Section of the Cervical Spine Research Society 1994, 3, 331–335. [Google Scholar] [CrossRef] [PubMed]
- Staron, R.S.; Hagerman, F.C.; Hikida, R.S.; Murray, T.F.; Hostler, D.P.; Crill, M.T.; Ragg, K.E.; Toma, K. Fiber type composition of the vastus lateralis muscle of young men and women. J Histochem Cytochem 2000, 48, 623–629. [Google Scholar] [CrossRef] [PubMed]
- Gadde, K.M.; Martin, C.K.; Berthoud, H.R.; Heymsfield, S.B. Obesity: Pathophysiology and Management. J Am Coll Cardiol 2018, 71, 69–84. [Google Scholar] [CrossRef]
- Feng, Q.; Kim, J.H.; Xie, J.; Bešević, J.; Conroy, M.; Omiyale, W.; Wu, Y.; Woodward, M.; Lacey, B.; Allen, N. Use of Sex-Specific Body Mass Index to Optimize Low Correlation With Height and High Correlation With Fatness: A UK Biobank Study. Am J Epidemiol 2024, 193, 296–307. [Google Scholar] [CrossRef]
- Panjabi, M.M. The stabilizing system of the spine. Part I. Function, dysfunction, adaptation, and enhancement. Journal of spinal disorders 1992, 5, 383–389. [Google Scholar] [CrossRef]
- Panjabi, M.M. A hypothesis of chronic back pain: ligament subfailure injuries lead to muscle control dysfunction. European spine journal: official publication of the European Spine Society, the European Spinal Deformity Society, and the European Section of the Cervical Spine Research Society 2006, 15, 668–676. [Google Scholar] [CrossRef] [PubMed]
- Sinaki, M.; Nwaogwugwu, N.C.; Phillips, B.E.; Mokri, M.P. Effect of gender, age, and anthropometry on axial and appendicular muscle strength. American journal of physical medicine & rehabilitation / Association of Academic Physiatrists 2001, 80, 330–338. [Google Scholar] [CrossRef]
- McNair, P.J.; Depledge, J.; Brettkelly, M.; Stanley, S.N. Verbal encouragement: effects on maximum effort voluntary muscle action. British journal of sports medicine 1996, 30, 243–245. [Google Scholar] [CrossRef] [PubMed]
- Andreacci, J.L.; LeMura, L.M.; Cohen, S.L.; Urbansky, E.A.; Chelland, S.A.; Von Duvillard, S.P. The effects of frequency of encouragement on performance during maximal exercise testing. J Sports Sci 2002, 20, 345–352. [Google Scholar] [CrossRef] [PubMed]
- Argus, C.K.; Gill, N.D.; Keogh, J.W.L.; Hopkins, W.G. Acute Effects of Verbal Feedback on Upper-Body Performance in Elite Athletes. Journal of Strength and Conditioning Research 2011, 25, 3282–3287. [Google Scholar] [CrossRef] [PubMed]
- Cohen, J. Statistical Power for the Behavioural Sciences; Lawrence Erlbaum: Hillsdale, NJ, 1988. [Google Scholar]
- Graves, J.E.; Pollock, M.L.; Carpenter, D.M.; Leggett, S.H.; Jones, A.; MacMillan, M.; Fulton, M. Quantitative assessment of full range-of-motion isometric lumbar extension strength. Spine 1990, 15, 289–294. [Google Scholar] [CrossRef] [PubMed]
- Pataky, T.C.; Zatsiorsky, V.M.; Challis, J.H. A simple method to determine body segment masses in vivo: reliability, accuracy and sensitivity analysis. Clin Biomech (Bristol) 2003, 18, 364–368. [Google Scholar] [CrossRef]
- Damavandi, M.; Farahpour, N.; Allard, P. Determination of body segment masses and centers of mass using a force plate method in individuals of different morphology. Medical engineering & physics 2009, 31, 1187–1194. [Google Scholar] [CrossRef]
- Pfeifle, C.; Edel, M.; Schleifenbaum, S.; Kühnapfel, A.; Heyde, C.-E. The reliability of a restraint sensor system for the computer-supported detection of spinal stabilizing muscle deficiencies. BMC musculoskeletal disorders 2020, 21, 597. [Google Scholar] [CrossRef] [PubMed]
- Pan, F.; Cheng, J.; Kong, C.; Wang, W.; Lu, S. Sex-specific characteristics of the trunk muscle behaviors in an asymptomatic adult cohort. Eur J Med Res 2025, 30, 471. [Google Scholar] [CrossRef] [PubMed]
Figure 1.
Investigation situation. Left: determination of upper body weight, right: subject performing isometric maximum extension force. Note, that during all situations participants remained in upright body position.
Figure 1.
Investigation situation. Left: determination of upper body weight, right: subject performing isometric maximum extension force. Note, that during all situations participants remained in upright body position.
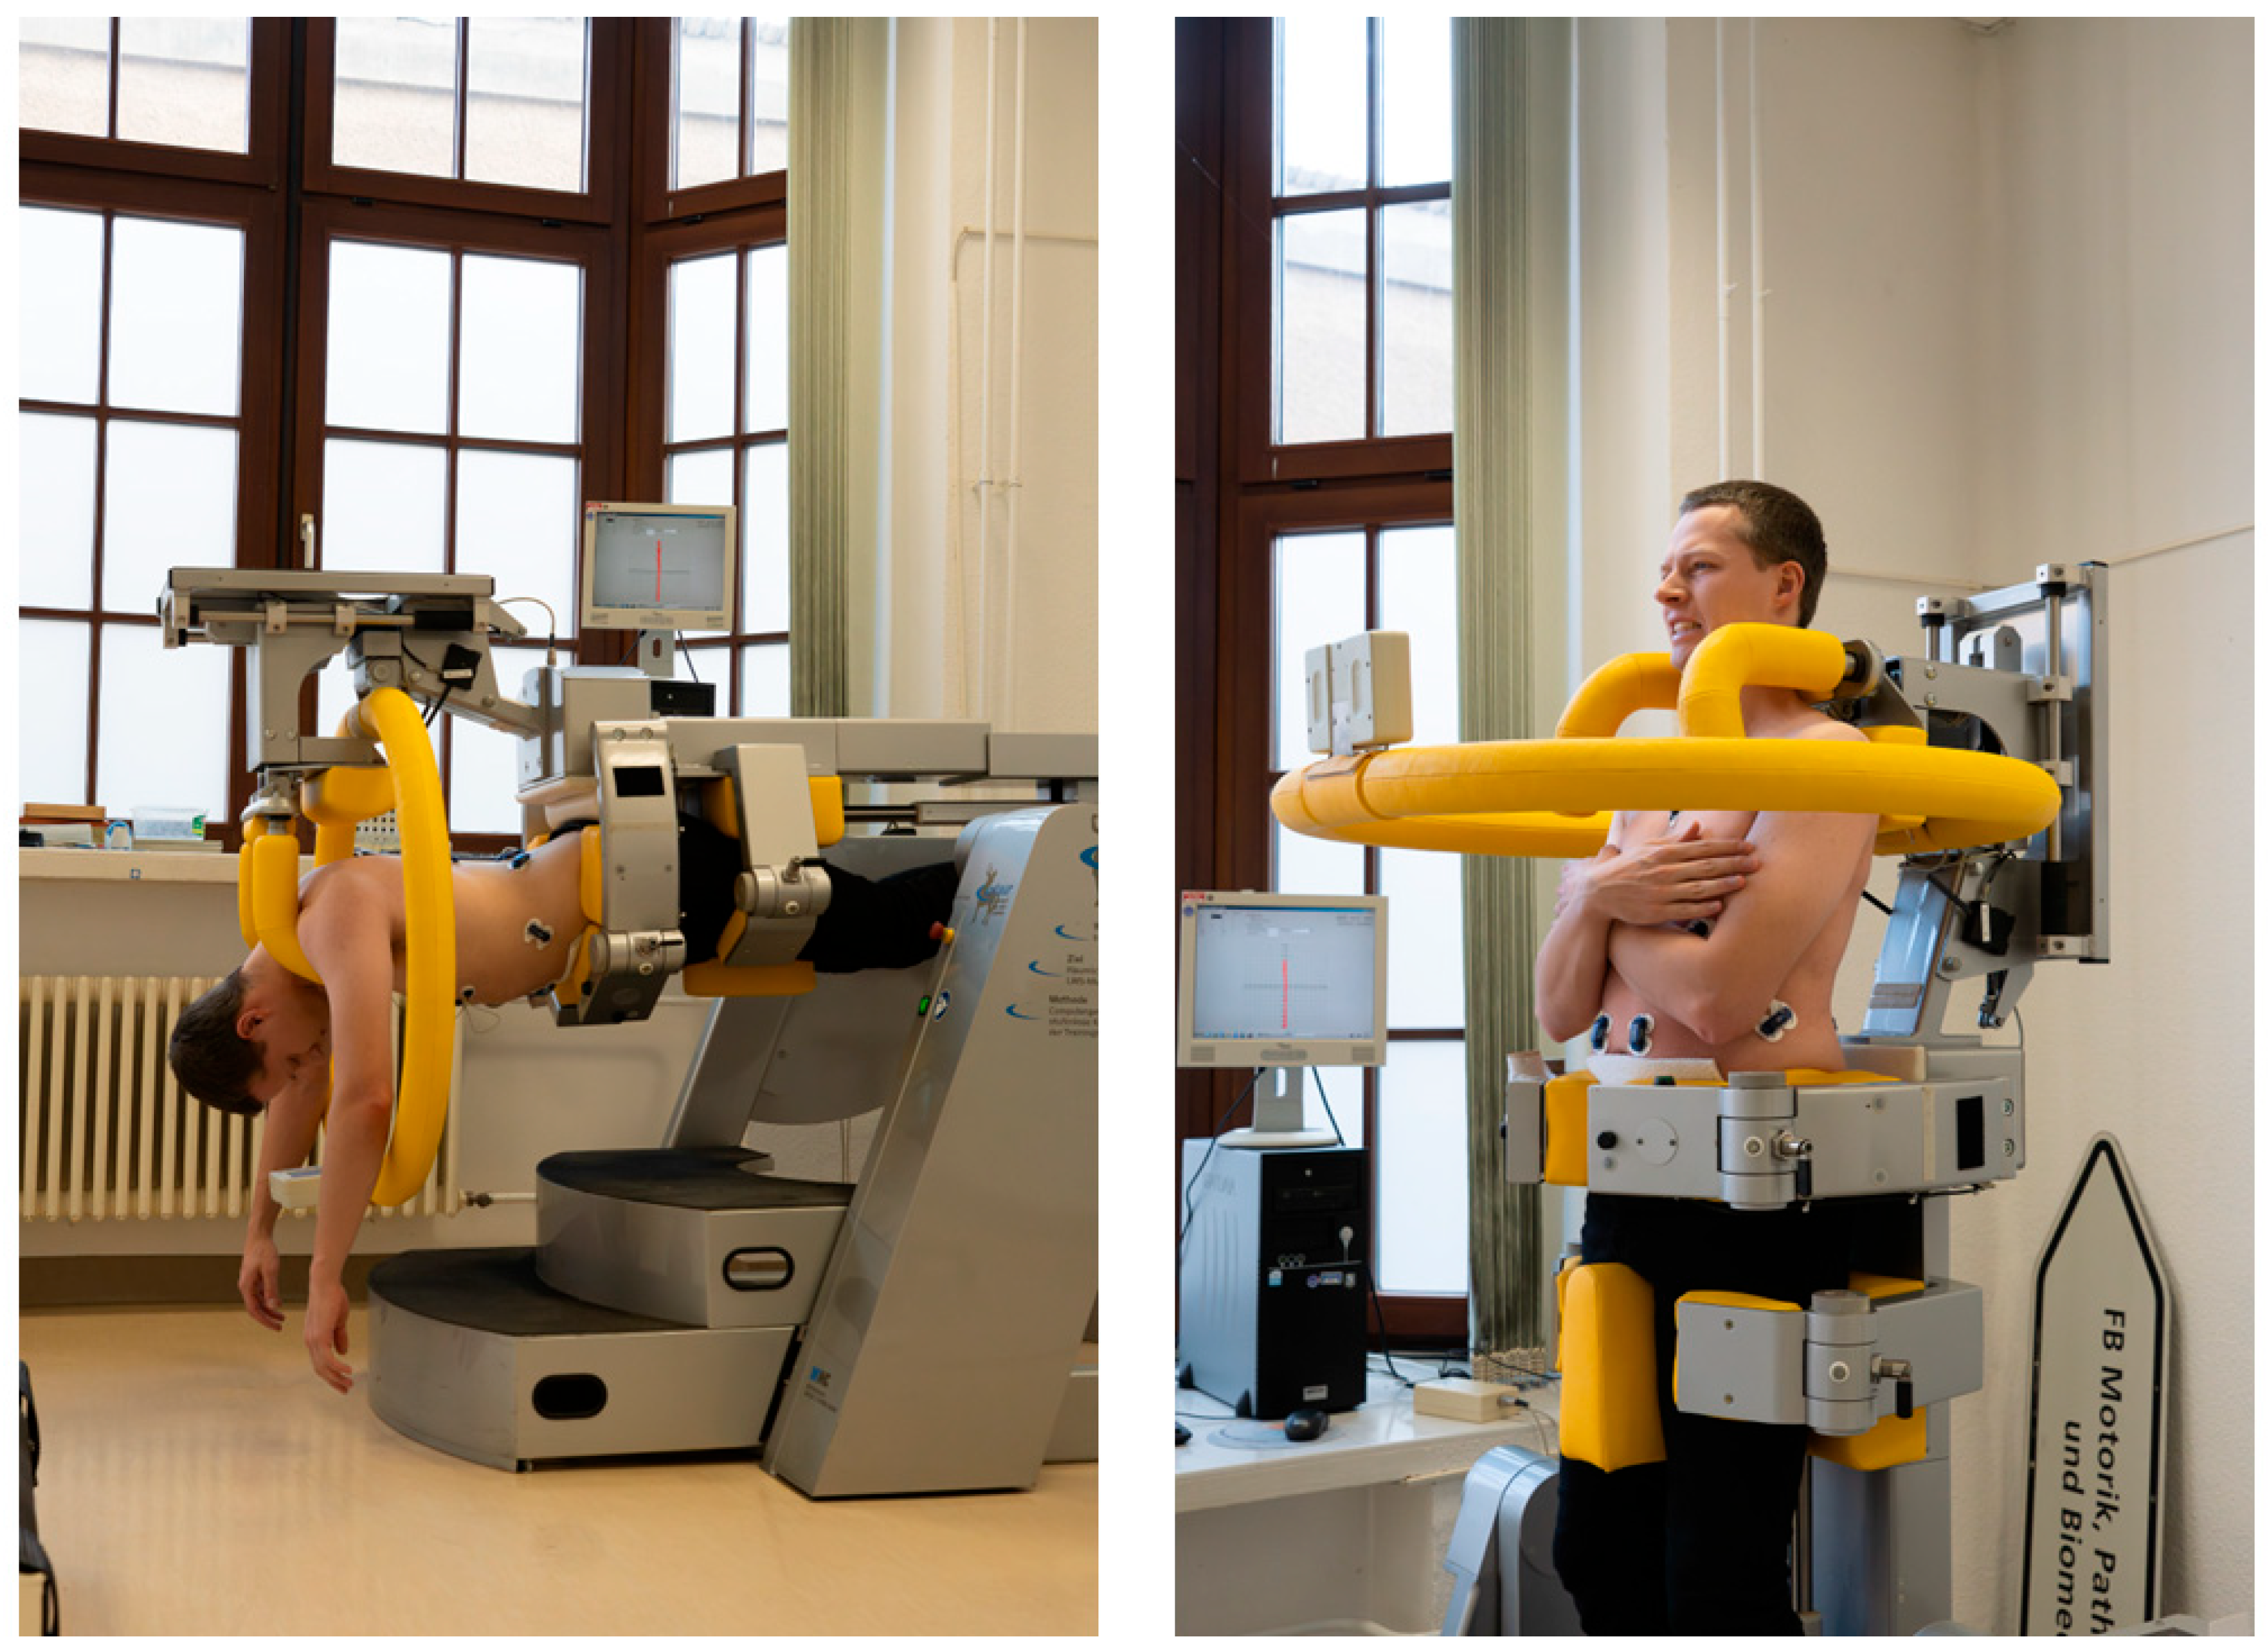
Figure 2.
Measured data for upper body weight and maximum extension force. Upper panel: data provided as force values, lower panel: data provided as torque values.
Figure 2.
Measured data for upper body weight and maximum extension force. Upper panel: data provided as force values, lower panel: data provided as torque values.
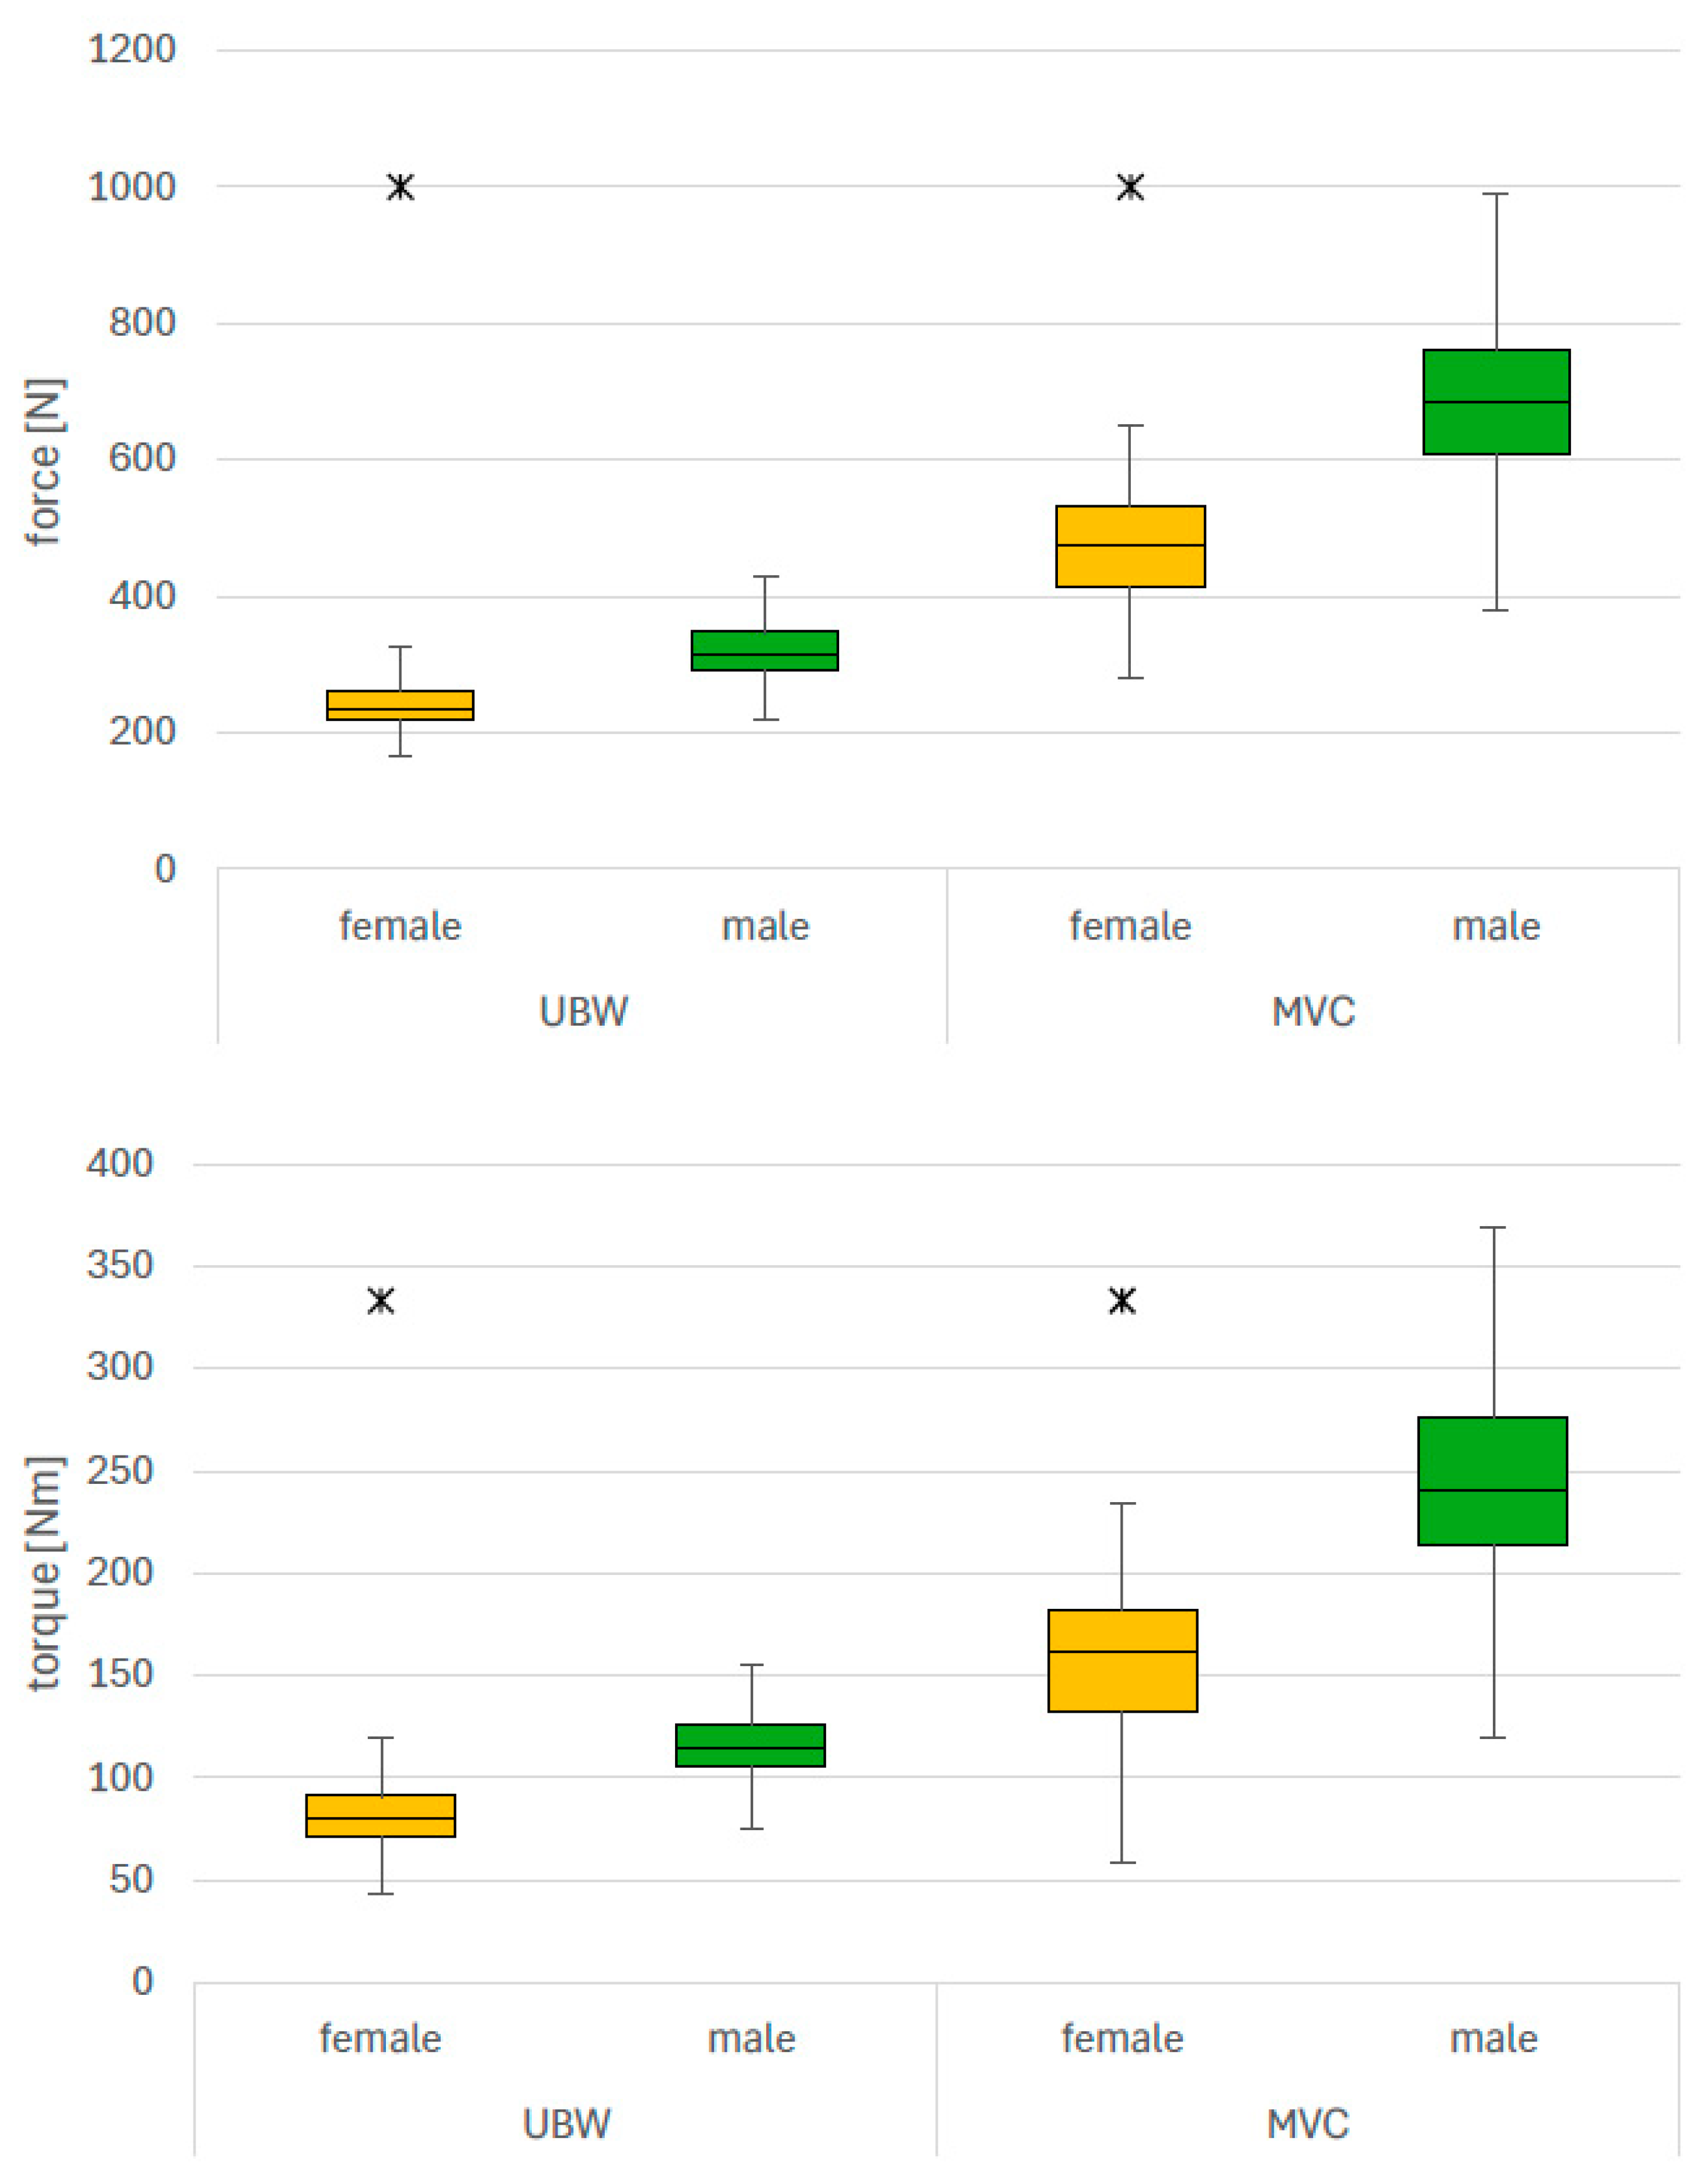
Figure 3.
Upper body torque ratio for female and male subjects.
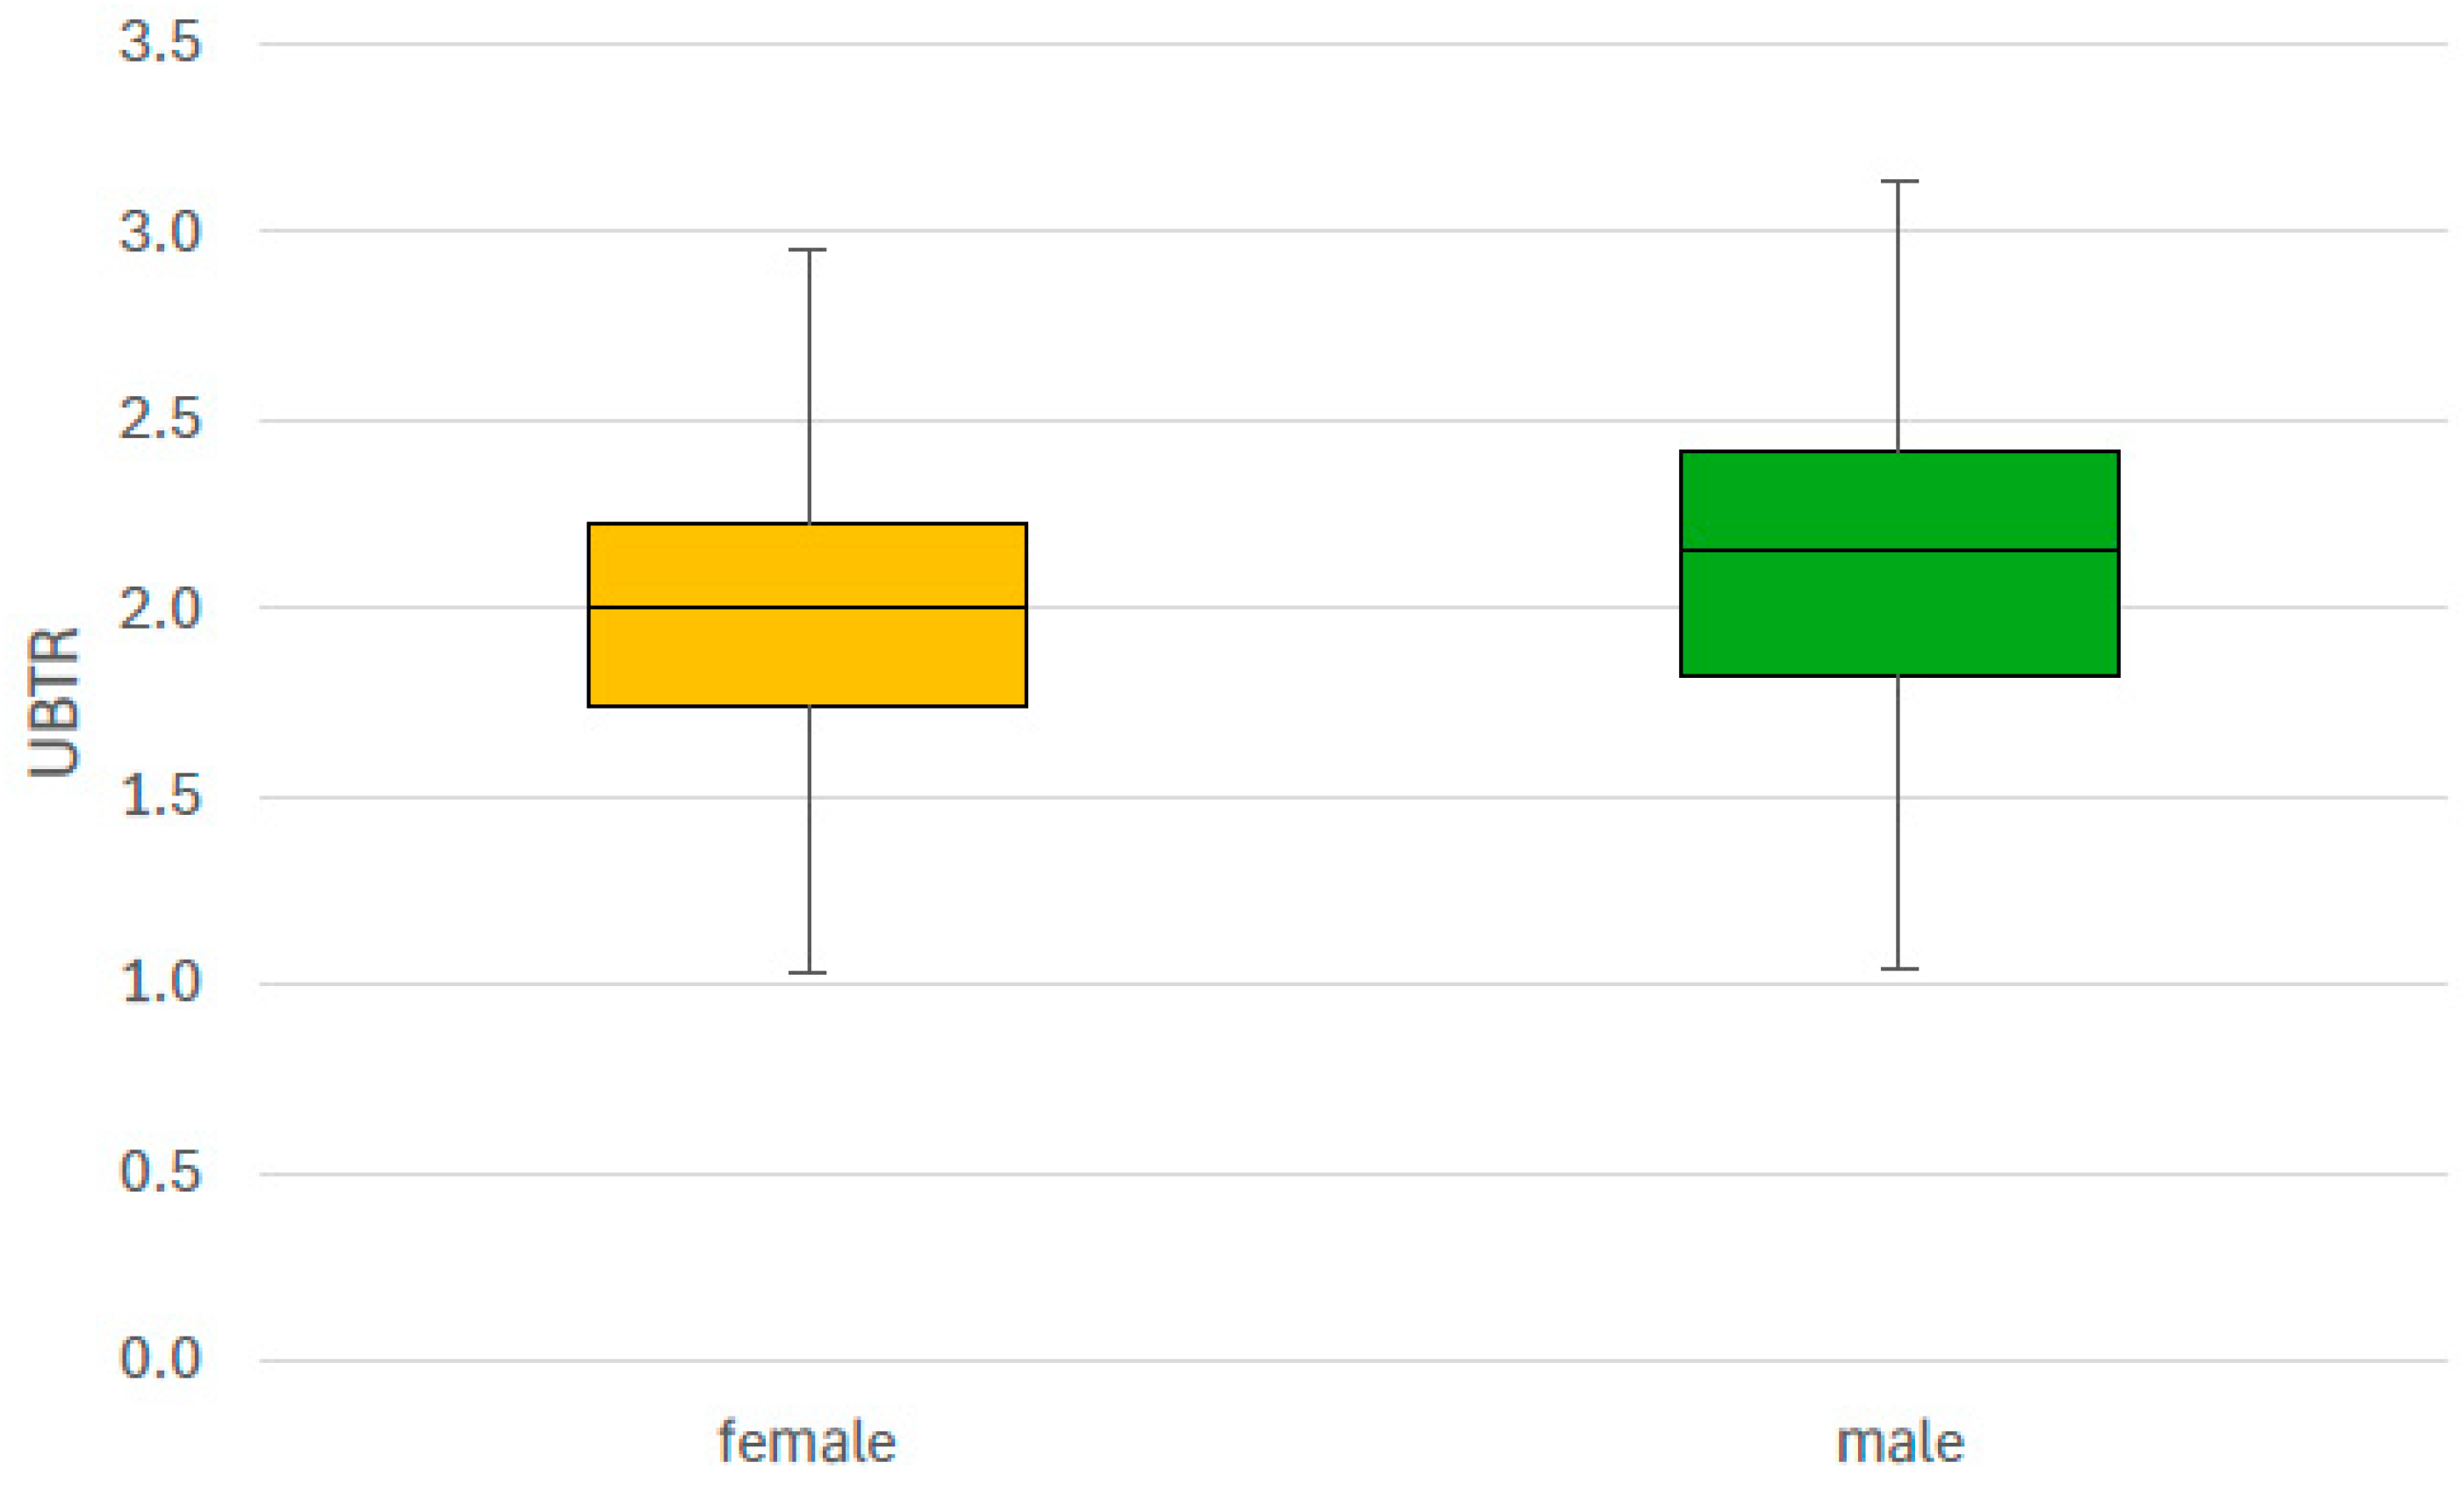

Table 1.
Anthropometric characteristics of the participants.
| Height [cm] | Weight [kg] | Age [y] | BMI [kg/m²] | |
|---|---|---|---|---|
| Females (n=115) | ||||
| MV | 168,9 | 64,6 | 27,6 | 22,6 |
| SD | 6,4 | 9,6 | 8,0 | 3,1 |
| CI | 1,2 | 1,8 | 1,5 | 0,6 |
| Median | 169,0 | 63,0 | 24,0 | 22,1 |
| upp. Q. | 173,5 | 70,4 | 31,0 | 25,2 |
| low. Q. | 164,0 | 57,5 | 22,0 | 20,2 |
| Males (n=124) | ||||
| MV | 180,8 | 78,5 | 30,7 | 24,0 |
| SD | 5,9 | 9,8 | 7,9 | 2,7 |
| CI | 1,0 | 1,7 | 1,4 | 0,5 |
| Median | 180,0 | 78,0 | 29,0 | 23,6 |
| upp. Q. | 185,0 | 84,6 | 37,0 | 25,8 |
| low. Q. | 177,0 | 72,5 | 24,0 | 22,2 |
| Statistics | ||||
| p- value | <0.0001 | <0.0001 | 0.0030 | 0.0003 |
| ES | 1.920 | 1.421 | 0.388 | 0.470 |
| Relevance | relevant | relevant | Not relevant | Not relevant |
| Diff mean values | 11.86 | 13.81 | 3.083 | 1.346 |
| MID | 3.09 | 4.86 | 3.977 | 1.432 |
MV: mean value. SD: standard deviation. CI: 95% confidence interval. upp. Q.: upper Quartile, low. Q.: lower Quartile, ES: effect size, MID: minimal important difference, Relevance: see "Statistics".
Table 2.
Detailed reporting of statistical results.
| UBT | MVC | UBTR | |
| p- value | <0.0001 | <0.0001 | 0.0055 |
| ES | 2.119 | 1.974 | 0.364 |
| MID | 8.19 | 21.48 | 0.195 |
| Diff.MV | 31.72 | 84.81 | 0.142 |
| Rating | Relevant | Relevant | Not relevant |
ES: effect size, MID: minimal important difference, UBW: upper body weight, MVC: maximum voluntary contraction force, UBTR: upper body torque ratio.
Disclaimer/Publisher’s Note: The statements, opinions and data contained in all publications are solely those of the individual author(s) and contributor(s) and not of MDPI and/or the editor(s). MDPI and/or the editor(s) disclaim responsibility for any injury to people or property resulting from any ideas, methods, instructions or products referred to in the content. |
© 2026 by the authors. Licensee MDPI, Basel, Switzerland. This article is an open access article distributed under the terms and conditions of the Creative Commons Attribution (CC BY) license (http://creativecommons.org/licenses/by/4.0/).
Copyright: This open access article is published under a Creative Commons CC BY 4.0 license, which permit the free download, distribution, and reuse, provided that the author and preprint are cited in any reuse.


