
Submitted:
24 September 2026
Posted:
29 September 2026
You are already at the latest version
Abstract
Background: Several research has revealed that dehydration remains a major cause of preventable illnesses, particularly among children and older adults. Existing tools such as the WHO IMCI, Gorelick, and Clinical Dehydration Scale (CDS) are limited by population focus and absence of quantitative weighting or digital integration. This study developed and prototyped an evidence-based dehydration-risk prediction model derived from meta-analytic data to enable more objective and universal risk estimation. Methods: Building on our recent systematic review and meta-analysis, sixteen (16) clinical and demographic predictors were extracted from validated dehydration scales and pooled diagnostic evidence. Heuristic weights (1-4 points) were assigned according to pooled sensitivity and specificity, yielding a total score of 0–42. The total score was transformed to generate continuous probability estimates using logistic regression. The scoring algorithm was embedded within an interactive R Shiny software prototype that supports real-time computation and visualization. Prototype evaluation involved functional verification and usability testing using simulated patient profiles. Results: High-weight predictors, thirst, inability to drink, and lethargy showed the strongest diagnostic value, while modifiers such as age (≥ 65 years) and comorbidity carried lower weights. The cumulative score was transformed into a continuous dehydration-risk probability using a logistic function, reflecting the nonlinear increase in risk with symptom burden. Prototype evaluation of the MetaDehydrate application using simulated profiles demonstrated functionally correct score computation, consistent probability outputs, sub-second computation latency (< 0.2 s per calculation), and favorable usability feedback. Conclusion: This study presents the design and technical feasibility evaluation of an evidence-informed dehydration risk–scoring algorithm and its implementation as a prototype digital decision-support tool. While no clinical effectiveness was assessed, the findings demonstrate the feasibility of translating pooled diagnostic evidence into a functional, user-interactive application. The tool’s simplicity, limited input requirements, and rapid computation suggest potential utility for future evaluation in community and resource-constrained healthcare settings. Further prospective studies are required to assess effectiveness in real-world and low-resource healthcare settings.
Keywords:
dehydration
; clinical decision support
; predictive scoring system
; risk assessment
; MetaDehydrate application
; meta-analysis
; evidence-based tool development
1. Introduction
Dehydration is a significant and yet an under-reported health issue in the world, as it impacts across diverse populations and care environments. It causes significant morbidity and mortality among children under the age of five in low- and middle-income nations, where diarrhea diseases and inaccessibility of clean water are the main issues (Gera et al., 2016; World Health Organization 2014). In elderly people, poor thirst perception, comorbidities, and polypharmacy make them vulnerable to fluid imbalance and unfavorable outcomes, such as cognitive impairment, kidney damage, and readmission to the hospital (Parkinson et al., 2023; Alsanie et al., 2022). Although water balance is a physiologically significant issue, dehydration is often not noticed until it reaches advanced levels since current clinical evaluation methods depend on subjective or intermittently measured symptoms (Falszewska et al., 2018).
In the past twenty years, various clinical scales have been elaborated to assist bedside diagnosis of dehydration - most prominently the Gorelick, Clinical Dehydration Scale (CDS), and WHO Integrated Management of Childhood Illness (IMCI) algorithms (Goldman et al., 2008; World Health Organization, 2014). These instruments are mostly proven in a pediatric sample and have inconsistent diagnostic performance across age groups and conditions (Jauregui et al., 2014; Gravel et al., 2010). It was revealed in both adult and geriatric cohort studies that there are further difficulties: lab confirmation is frequently unattainable, and such clinical signs as thirst, dry mouth, or urine color exhibit heterogeneous performance (Rosi et al., 2022; Stookey et al., 2020). Thus, no single, evidence-based scoring system that is applicable both to hospital and community care exists.
Our last systematic review and meta-analysis will fill this gap by synthesizing quantitative data on ten (10) studies that included pediatric, adult, and elderly groups (Ogbolu et al., 2025). The combined sensitivity and specificity of shared clinical findings like thirst, dry mouth, and dark urine were in the range of 85% and 70% respectively, which validated their applicability as a diagnostic tool within the contexts. This research also determined fatigue, low urine output, and the inability to drink as significant predictors but with underweight in existing scales. Even though the reviews offered a conceptual framework of scoring, it was done in theory and had no outside verification or practical application. Existing objective methods for dehydration assessment, including plasma osmolality, urine osmolarity, and bioelectrical impedance analysis, may provide higher diagnostic precision but are often unavailable in low-resource, emergency, community, or digitally mediated healthcare environments. Furthermore, many existing clinical dehydration scales remain paper-based, population-specific, or categorical in structure, limiting scalability and real-time computational implementation. The present study therefore aimed not to replace gold-standard diagnostics, but to develop a computationally implementable, evidence-informed probabilistic risk-support framework capable of supporting early dehydration risk stratification in resource-constrained settings.
Based on this fact, our current study was based on developing and testing a model that can serve as framework for predicting the risk of dehydration through the combination of known clinical manifestations with demographic and health modifiers. Hence, establishing on the validated scales (WHO IMCI, Gorelick, CDS) and the combination of diagnostic metrics as reported by Ogbolu et al. (2025), we used heuristic weights of sixteen (16) predictor variables, and the algorithm was executed in an easy-to-use R Shiny application. The aim of our study is to show a transparent workflow, which involves evidence synthesis, and digital prototype, which can be further refined with real world clinical data.
Figure 1 below shows the conceptual development of this study, in which meta-analytic findings were used to guide the extraction of variables, weighting, and risk-scoring, logistic probability mapping and implementation in an interactive decision-support system.
2. Materials and Methods
2.1. Study Design
This study was conducted as a model-development and prototype-implementation study, representing the translational phase of a broader research framework that began with a systematic review and meta-analysis of dehydration risk factors (Ogbolu et al., 2025). The objective of the present work was to transform pooled diagnostic evidence into a structured predictive model and implement it as a functional digital decision-support prototype. To enhance methodological clarity and align the manuscript with the reviewer's recommendation, the methodology was organized into two distinct phases: Phase 1 - Model Development and Phase 2 - Prototype Implementation and Technical Validation (Figure 2).
Phase 1: Model Development
2.2. Evidence Base and Variable Selection
Predictor variables were identified through a triangulated evidence-based approach combining international clinical guidelines, validated clinical dehydration scales, and meta-analytic findings. The evidence sources included the World Health Organization Integrated Management of Childhood Illness framework, the Gorelick scale, the Clinical Dehydration Scale, and pooled diagnostic findings from Ogbolu et al. (2025).
Variables were retained if they satisfied at least one of the following criteria: (i) presence in two or more validated clinical tools or guidelines; or (ii) demonstrated diagnostic performance with sensitivity of at least 80% and specificity of at least 65% in pooled or individual studies. This process yielded sixteen clinically relevant predictors, encompassing observable signs, physiological indicators, and demographic or health modifiers.
2.3. Weight Assignment and Scoring Model
A weighting framework was applied to translate qualitative diagnostic evidence into a quantitative scoring system. Each predictor variable was assigned a weight ranging from 1 to 4 points, based on its relative diagnostic strength derived from pooled sensitivity and specificity values and supporting clinical literature.
High-weight predictors (4 points): strong indicators of dehydration, including thirst, inability to drink, and lethargy.
Moderate-weight predictors (2-3 points): consistent but less discriminative signs, including dry mouth, dark urine, vomiting, diarrhea, sunken eyes, reduced urine output, and prolonged capillary refill time.
Low-weight modifiers (1 point): background risk factors, including age 65 years or older, comorbidity, and cognitive impairment.
The cumulative score ranged from 0 to 42 points, allowing continuous representation of dehydration risk severity. The scoring logic was initially explored in a Python/Django prototype and subsequently implemented in the final R Shiny prototype for real-time browser-based use (Table 1).
2.4. Risk Categorization
To facilitate clinical interpretability, total scores were stratified into three categorical risk levels: low risk, moderate risk, and high risk. Low-risk scores represent minimal symptom burden, moderate-risk scores represent early-to-moderate dehydration requiring monitoring or oral rehydration, and high-risk scores indicate probable severe dehydration requiring urgent clinical attention. The thresholds were empirically derived based on established classification approaches in WHO IMCI and the Clinical Dehydration Scale frameworks (Table 2).
2.5. Logistic Probability Mapping
To convert discrete scores into continuous risk estimates, a logistic transformation was applied. This approach enables probabilistic interpretation and reflects the nonlinear accumulation of dehydration risk with increasing symptom burden. The logistic equation was specified as: P = 1 / (1 + exp[-(beta0 + beta1*S)]), where P is the predicted probability of dehydration, S is the total risk score, beta0 is the intercept (-4), and beta1 is the slope (0.25). These parameters were selected to produce probability distributions consistent with meta-analytic prevalence estimates and expected clinical progression. The resulting function produces an S-shaped curve, with gradual increases at low scores and steeper probability escalation beyond moderate-risk thresholds (Figure 3).
Phase 2: Prototype Implementation and Technical Validation
2.6. Prototype Implementation
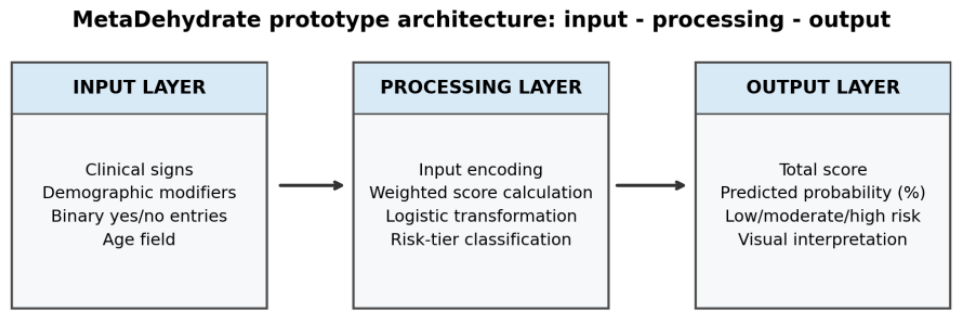
The dehydration-risk model was implemented as an interactive web-based application using R and the Shiny framework. The prototype, referred to as the MetaDehydrate application, was designed to support real-time decision support through a structured and user-friendly interface. The system architecture consisted of three primary components: an input layer, a computation layer, and an output layer. The input layer allows users to enter clinical and demographic data through binary indicators and a numeric age field. The computation layer performs input encoding, weighted score calculation, logistic probability transformation, and risk-tier classification. The output layer displays the total dehydration-risk score, estimated probability, categorical risk level, and visual indicators to enhance interpretability.
Figure 4.
Prototype architecture showing the pathway from input variables to processing functions and final output display.
Figure 4.
Prototype architecture showing the pathway from input variables to processing functions and final output display.
2.7. Prototype Testing and Usability Evaluation
Following implementation, structured testing procedures were conducted to assess the functional correctness, computational performance, and usability of the prototype system. These procedures were designed to evaluate technical feasibility and implementation accuracy only, and do not constitute clinical validation of the predictive model.
2.7.1. Functional Verification Protocol
Simulated patient profiles were generated to span the full range of possible predictor combinations. For each profile, independent manual calculations were performed, and outputs from the application were compared against these reference values to verify correct implementation of scoring, probability transformation, and classification logic.
2.7.2. Performance Testing Protocol
System performance was evaluated by measuring response time between user input submission and output generation. Stability testing involved repeated execution cycles under varying conditions, including concurrent user sessions, to assess robustness and error handling.
2.7.3. Usability Evaluation Protocol
Usability testing was conducted with pilot users, including healthcare professionals and postgraduate researchers. Participants interacted with the system to complete predefined tasks involving data entry and interpretation of results. Feedback was collected on interface clarity, workflow efficiency, and ease of interpretation. However, the present study evaluated computational feasibility, implementation correctness, and usability rather than diagnostic accuracy or clinical effectiveness.”
3. Results
3.1. Model Structure and Scoring Behaviour
The final dehydration-risk prediction model incorporated sixteen predictor variables, including clinical signs, physiological indicators, and demographic modifiers. Each variable was assigned a weight between 1 and 4 points, resulting in a maximum cumulative score of 42 points. High-weight predictors such as thirst, inability to drink, and lethargy contributed most strongly to the total score, reflecting their high diagnostic relevance. Moderate-weight predictors, including dry mouth, dark urine, vomiting, diarrhoea, and reduced urine output, provided consistent but less discriminative contributions. Lower-weight variables, such as fatigue, dizziness, age 65 years or older, comorbidity, and cognitive impairment, functioned as supportive or modifying factors. The scoring system demonstrated a progressive increase in total score with accumulation of symptoms, forming the basis for subsequent probability estimation and categorical risk classification.
3.2. Probability Mapping and Risk Stratification
Application of the logistic transformation produced a continuous relationship between total score and predicted probability of dehydration. The resulting probability curve exhibited a characteristic sigmoidal pattern, with gradual increases at lower scores and a steeper rise beyond the moderate-risk threshold. At low scores, predicted probabilities remained relatively low, corresponding to minimal dehydration risk. As the score increased into the moderate range, probability values rose steadily. At higher scores, the probability approached near-certainty, reflecting the cumulative impact of multiple high-weight predictors. This mapping enabled direct interpretation of risk both as a continuous probability and as a categorical classification (Table 3).
3.3. Illustrative Prediction Scenarios
To demonstrate practical application, representative simulated cases were evaluated using the prototype system. Low-risk profiles with minimal symptoms produced low scores and correspondingly low predicted probabilities. Moderate-risk profiles with combinations of key symptoms resulted in intermediate scores and probabilities. High-risk profiles with multiple high-weight predictors produced high scores and probabilities approaching certainty (Table 3 and Figure 4 and Figure 5).

Table 4.
Illustrative simulated prediction scenarios.
| Case | Key predictors present | Total score | Predicted probability | Risk category |
|---|---|---|---|---|
| Case A | Fatigue only | 4 / 42 | 15% | Low |
| Case B | Thirst + vomiting + dark urine | 10 / 42 | 45% | Moderate |
| Case C | Unable to drink + lethargy + diarrhea + sunken eyes | 25 / 42 | 89% | High |
Figure 5.
Example output probabilities from representative low-, moderate-, and high-risk simulated profiles.
Figure 5.
Example output probabilities from representative low-, moderate-, and high-risk simulated profiles.
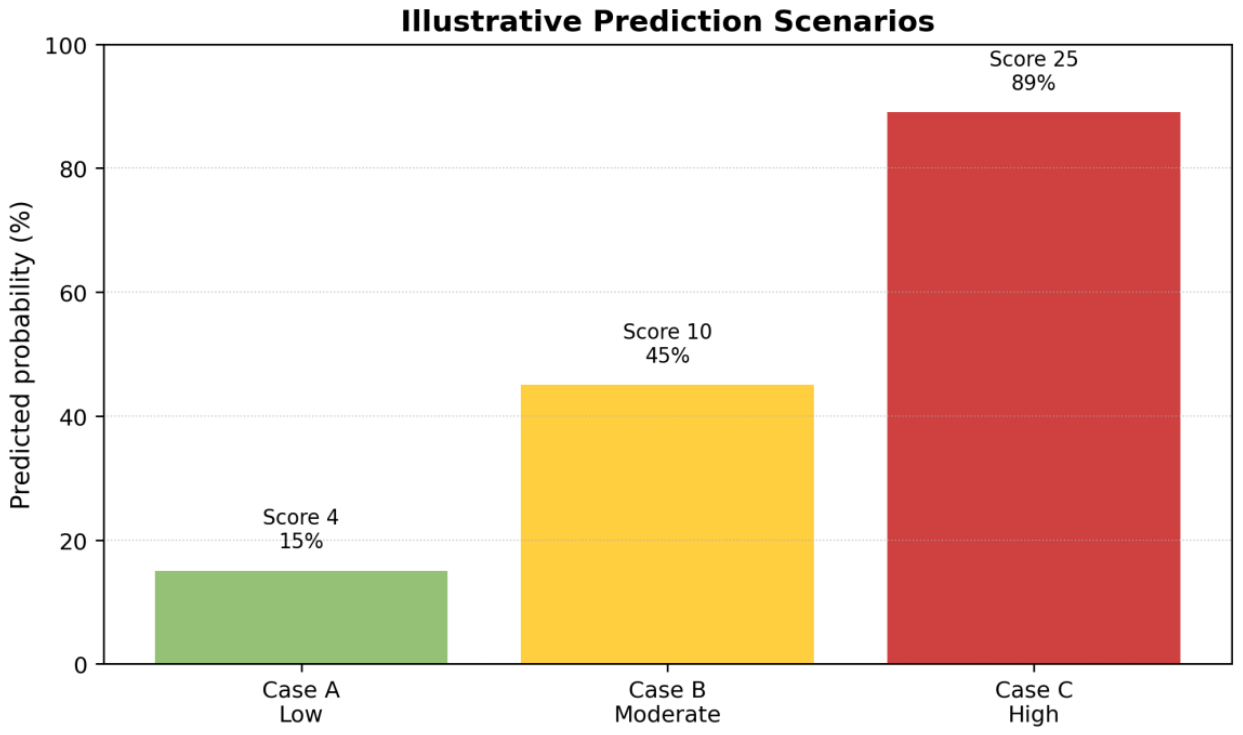
Figure 6.
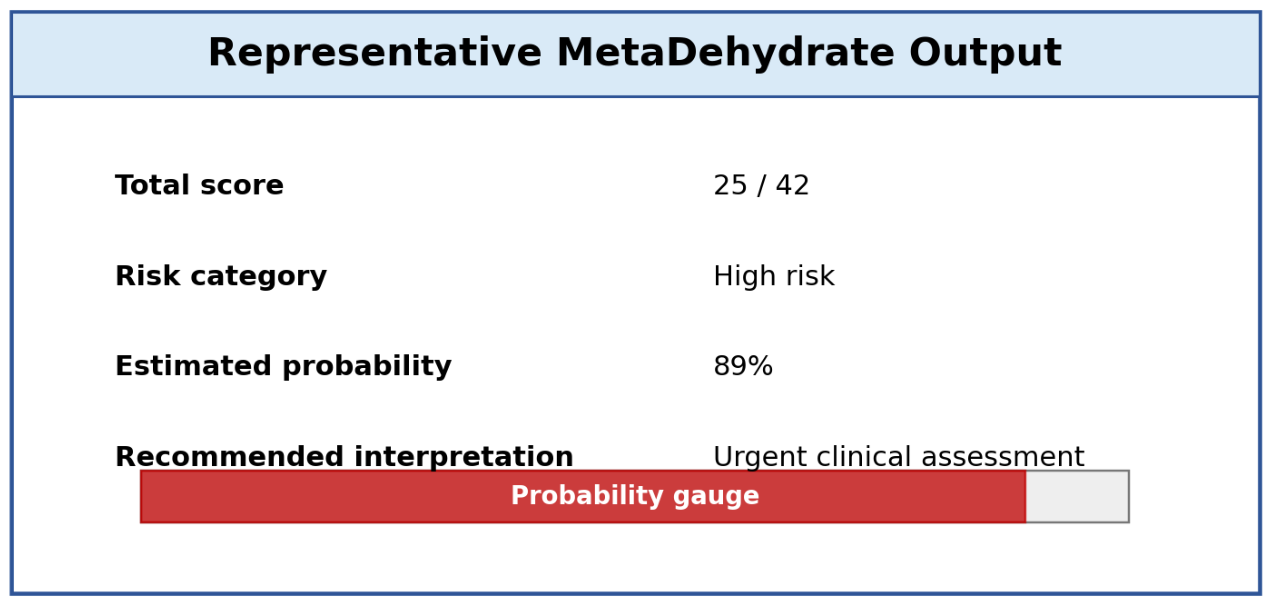
Representative MetaDehydrate output panel showing total score, risk category, estimated probability, and interpretation.
Figure 6.
Representative MetaDehydrate output panel showing total score, risk category, estimated probability, and interpretation.
3.4. Prototype Validation and Technical Performance
The implemented prototype demonstrated high levels of functional accuracy, computational stability, and responsiveness during testing. All simulated test cases showed complete agreement between system-generated outputs and independently calculated reference values, confirming correct implementation of weighted score computation, logistic probability transformation, and risk category classification. The system achieved rapid response times, with output generation occurring in near real time following user input. Performance remained stable across repeated executions and under concurrent usage conditions. No computational or interface errors were observed during testing, and the application maintained consistent behaviour across multiple runs and usage scenarios. User interaction testing indicated that data entry and result interpretation could be completed efficiently. The interface was perceived as clear and intuitive, and visual and textual outputs supported rapid understanding of the dehydration-risk estimate. Minor interface refinements were implemented based on user feedback to improve readability and layout.
3.5. Functional Verification and Software Performance Results
Table 5 summarizes the detailed outcomes of prototype validation, including functional correctness, performance metrics, system stability, and usability evaluation. In response to the reviewer’s recommendation, these findings are reported in the Results section rather than the Methods section (Table 5).
3.6. Internal Model Behaviour and Consistency
Analysis of simulated data demonstrated a strong and consistent relationship between total score and predicted probability. As total scores increased, predicted probabilities rose in a monotonic and stable manner, indicating appropriate internal consistency of the scoring system and probability mapping. These findings confirm coherent prototype behaviour; however, external calibration and clinical validation using patient-level outcome data remain necessary before clinical implementation.
4. Discussion
4.1. Summary of Findings
This study evaluated computational feasibility, implementation correctness, and usability rather than diagnostic accuracy or clinical effectiveness. We described the design and functional feasibility of a prototype dehydration risk–scoring tool derived from pooled diagnostic evidence. Building on the systematic review and meta-analysis by Ogbolu et al. (2025), clinical signs and demographic modifiers reported in the literature were consolidated into a structured, rule-based scoring algorithm. Predictor selection and relative weighting were informed by pooled sensitivity and specificity estimates, providing an evidence-informed foundation for algorithm construction rather than empirical model validation. The scoring algorithm was mapped to a continuous probability scale using a logistic transformation, chosen to constrain outputs between 0 and 1 and to reflect the nonlinear accumulation of risk implied by symptom burden. Importantly, the resulting probability patterns represent mathematical properties of the scoring framework, not observed diagnostic performance in patient populations. As such, no claims regarding sensitivity, specificity, or predictive accuracy are made.
Functional testing using simulated patient profiles was conducted to verify computational correctness, internal consistency, and system stability. These tests confirmed scoring consistency score calculation, predictable probability mapping, and rapid computation within a prototype R Shiny (the MetaDehydrate) application. Usability assessment was limited to basic interface evaluation, indicating that colour-coded outputs and simplified input structure enhanced interpretability; however, no formal usability or effectiveness study was performed.
Collectively, these findings demonstrate the technical feasibility of operationalizing meta-analytic diagnostic evidence into a functional digital prototype, rather than clinical validity or effectiveness. The tool is best understood as a proof-of-concept platform intended to support future empirical validation, prospective testing, and refinement in real-world clinical and community settings.
4.2. Comparison with Existing Tools
The current model is more comprehensive in applicability and more transparent than current instruments of dehydration assessment. The WHO IMCI algorithm is still the basis of pediatric triage, and this is based on a limited number of binary signs, including sunken eyes, inability to drink, and lethargy to classify some or severe dehydration (World Health Organization, 2014; Gera et al., 2016). Nevertheless, the categorical thresholds in IMCI are not quantitatively weighted and applied to children under five years.
Equally applicable, the Gorelick scale and Clinical Dehydration Scale (CDS) presented structured counts of symptoms to be used in pediatrics (Goldman et al., 2008; Jauregui et al., 2014), but both had inconsistent diagnostic reliability among studies (Falszewska et al., 2018; Gravel et al., 2010). They also do not include any demographic or comorbidity modifiers, which play a significant role in determining hydration status among adult and older patients (Alsanie et al., 2022; Parkinson et al., 2023).
The present model advances these frameworks in three keyways:
Evidence integration: It synthesizes pooled sensitivity, and specificity estimates from multi-age studies (Ogbolu et al., 2025) to assign transparent heuristic weights, rather than treating all symptoms equally.
Expanded scope: It also includes adult-related predictors, including dark urine, dizziness, fatigue, and cognitive impairments with geriatric hydration research underpinning the use of the tool (Mentes, 2006; Rosi et al., 2022).
Digital implementation: The R Shiny (the MetaDehydrate) application calculates the total score, estimated probability, and risk tier automatically, unlike paper-based scale, which reduces the inter-observer variation and can be integrated with mobile or clinical information systems.
However, based on classical dehydration-scoring reasoning, this prototype is a next-generation evidence-based device between pediatric, adult, and geriatric care. It conceptually matches the requests of clinical-decision support in the form of systematic-review outcomes that are transformed into deployable and easy-to-use solutions (Bennett et al., 2020).
4.3. Strengths
The main strength of this research is the basis and the transparent process of its development that is evidence-based. All the predictors included in the model were based on standard clinical scales, international guidelines, or integrated diagnostic data based on the previous meta-analysis (Ogbolu et al., 2025). This methodological system was what made sure the final algorithm is based on the real-world diagnostic performance and not theoretical assumptions.
Moreover, the model is designed with simplicity and accessibility in focus. It does not require complicated laboratory tests or other sophisticated tools and only utilizes the visible clinical evidence and readily available demographic data. This also renders it especially appropriately applicable to the low-resource and community-based care practices, in which dehydration has become a widespread issue, yet laboratory assistance is scarce (World Health Organization, 2014; Gera et al., 2016). The future digital implementation of the MetaDehydrate via R Shiny also further advances usability allowing automated calculation, immediate visualization of the results and possible incorporation into mobile or electronic medical record systems. All the features improve the objective of transforming evidence synthesis into a convenient, user-friendly, and scalable application to early detect dehydration and risk-triage.
4.4. Potential Applications in Resource-Constrained Settings
The proposed MetaDehydrate framework may support early dehydration risk stratification in resource-constrained settings where laboratory-based diagnostic methods are limited or unavailable. By integrating readily obtainable clinical indicators into a computational risk-estimation system, the prototype may assist frontline healthcare workers, digital triage systems, and community health programs/events in identifying individuals who may require further clinical assessment or intervention. While not intended to replace formal clinical diagnosis, the framework demonstrates the potential role of predictive modelling and digital health tools in strengthening decision-support systems within low-resource healthcare environments.
4.5. Limitations
This work is limited to the design and functional feasibility of a prototype dehydration risk–scoring tool and does not include empirical validation using patient-level clinical data. Consequently, the prototype should not be used for clinical decision-making or population-level risk stratification at this stage. In its current form, the tool is intended for research, training, and methodological demonstration purposes, including illustrating the translation of pooled diagnostic evidence into a structured scoring framework and interactive digital workflow. It may also support hypothesis generation and serve as a platform for benchmarking alternative weighting or modeling strategies. Formal validation will require evaluation against real-world clinical datasets. This will involve (i) retrospective validation using existing hospital or community health records with dehydration outcomes, assessing discrimination (e.g., AUC), calibration (e.g., calibration plots, Brier score), and decision-analytic performance, followed by (ii) prospective validation in clinical or community screening settings to assess predictive accuracy, usability, and workflow integration. Model recalibration and threshold optimization will be performed based on observed outcome distributions. The current model does not explicitly account for special populations such as patients with severe malnutrition-related muscle wasting or neuro-disability, in whom conventional dehydration signs may demonstrate altered diagnostic performance. Future model refinement and external validation studies should specifically evaluate these subgroups.
Finally, while the R Shiny framework enables rapid prototyping and cross-platform access, performance and accessibility may vary by device and internet connectivity. Future development will therefore explore offline-capable and mobile-native implementations following empirical validation.
4.6. Future Directions
Further studies are required in the future to test the model on various patient groups, improve predictor weights in statistical modelling, and apply real-life clinical data to the MetaDehydrate platform to deploy it to mobile applications. To establish external validity, determine the calibration accuracy and usability in different age groups and in a different healthcare setting, prospective cohort studies and multi-centre trials will be necessary. Future expansion can also consider machine-learning or regression-based optimization of predictor weighting so that the tool can optimize as new evidence is discovered. Finally, the implementation of the algorithm into mobile and clinical decision-support systems would potentially offer healthcare professionals with evidence-based, real-time assistance in screening and early managing dehydration risks and supporting the latter in resource-restricted settings.
5. Conclusions
This study demonstrates the feasibility of converting systematic evidence into a functional dehydration-risk prediction prototype. By integrating clinical signs and demographic modifiers into a transparent, evidence-informed scoring model, the research successfully operationalized meta-analytic findings within a digital decision-support framework. With future external validation and calibration using patient-level data, this approach holds significant potential to enhance early diagnosis, support timely intervention, and improve patient outcomes across a range of clinical and community settings, particularly in low-resource environments where dehydration remains a persistent global health challenge.
Institutional Review Board Statement
This study did not involve real patient data, clinical records, or human participants undergoing clinical procedures. The prototype usability testing was conducted using simulated patient profiles and volunteer pilot testers (healthcare professionals and postgraduate researchers) who evaluated interface clarity and workflow only, with no identifiable personal or health information collected. In accordance with institutional policy, formal ethical approval was therefore not required for this technical feasibility and usability evaluation of our research; all pilot testers participated voluntarily and were informed of the purpose of the evaluation.
References
- Alsanie, S.; Lim, S.; Wootton, S. A. Detecting low-intake dehydration using bioelectrical impedance analysis in older adults in acute care settings: A systematic review. BMC Geriatr. 2022, 22, 954. [Google Scholar] [CrossRef] [PubMed]
- Gravel, J.; Manzano, S.; Guimont, C.; Lacroix, L.; Gervaix, A.; Bailey, B. Multicenter validation of the clinical dehydration scale for children. Archives de pediatrie: organe officiel de la Societe francaise de pediatrie 2010, 17, 1645–1651. [Google Scholar] [CrossRef] [PubMed]
- Elliott, K. B.; Keefe, M. S.; Rolloque, J. J. S.; Jiwan, N. C.; Dunn, R. A.; Luk, H. Y.; Sekiguchi, Y. Relationships between morning thirst and later hydration status and total water intake. Nutrients 2024, 16, 3212. [Google Scholar] [CrossRef] [PubMed]
- Falszewska, A.; Szajewska, H.; Dziechciarz, P. Diagnostic accuracy of three clinical dehydration scales: A systematic review. Arch. Dis. Child. 2018, 103, 383–388. [Google Scholar] [CrossRef] [PubMed]
- Marzuillo, P.; Rivetti, G.; Galeone, A.; Capasso, G.; Tirelli, P.; Di Sessa, A.; del Giudice, E.M.; Guarino, S.; Nunziata, F. Heart rate to identify non-febrile children with dehydration and acute kidney injury in emergency department: a prospective validation study. Eur. J. Pediatr. 2024, 183, 5043–5048. [Google Scholar] [CrossRef] [PubMed]
- Goldman, R. D.; Friedman, J. N.; Parkin, P. C. Validation of the clinical dehydration scale for children with acute gastroenteritis. Pediatrics 2008, 122, 545–549. [Google Scholar] [CrossRef] [PubMed]
- Jauregui, J.; Nelson, D.; Choo, E.; Galicia, M.; Anand, K. J. S. External validation and comparison of three pediatric clinical dehydration scales. PLoS ONE 2014, 9, e95739. [Google Scholar] [CrossRef] [PubMed]
- Bennett, B. L.; Hew-Butler, T.; Rosner, M. H.; Myers, T.; Lipman, G. S. Wilderness medical society clinical practice guidelines for the management of exercise-associated hyponatremia: 2019 update. Wilderness Environ. Med. 2020, 31, 50–62. [Google Scholar] [CrossRef] [PubMed]
- Mentes, J. C. Oral hydration in older adults: Greater awareness is needed. Am. J. Nurs. 2006, 106, 40–49. [Google Scholar] [PubMed]
- Ogbolu, M. O.; Eniade, O. D.; Kozlovszky, M. Systematic review and meta-analysis of risk factors for dehydration and development of a predictive scoring system. Healthcare 2025, 13, 1974. [Google Scholar] [CrossRef] [PubMed]
- Parkinson, E.; Hooper, L.; Fynn, J.; Wilsher, S. H.; Oladosu, T.; Poland, F.; Bunn, D. Low-intake dehydration prevalence in non-hospitalised older adults: Systematic review and meta-analysis. Clin. Nutr. 2023, 42, 1510–1520. [Google Scholar] [CrossRef] [PubMed]
- Rosi, I. M.; Milos, R.; Cortinovis, I.; Laquintana, D.; Bonetti, L. Sensitivity and specificity of the new geriatric dehydration screening tool: An observational diagnostic study. Nutrition 2022, 101, 111695. [Google Scholar] [CrossRef] [PubMed]
- Sekiguchi, Y.; Benjamin, C. L.; Butler, C. R.; Morrissey, M. C.; Filep, E. M.; Stearns, R. L.; Lee, E.C.; Casa, D. J. Relationships between WUT (body weight, urine colour, and thirst level) criteria and urine indices of hydration status. Sports Health 2022, 14, 566–574. [Google Scholar] [CrossRef] [PubMed]
- Keefe, M. S.; Luk, H. Y.; Rolloque, J. J. S.; Jiwan, N. C.; McCollum, T. B.; Sekiguchi, Y. The weight, urine colour and thirst Venn diagram is an accurate tool compared with urinary and blood markers for hydration assessment at morning and afternoon timepoints in euhydrated and free-living individuals. Br. J. Nutr. 2024, 131, 1181–1188. [Google Scholar] [CrossRef] [PubMed]
- Keefe, M. S.; Luk, H. Y.; Rolloque, J. J.; Jiwan, N. C.; Sekiguchi, Y. Hydration assessment in males and females using the WUT (weight, urine color, and thirst) Venn diagram compared to blood and urinary indices. Nutrients 2025, 17, 689. [Google Scholar] [CrossRef] [PubMed]
- Stookey, J. D.; Kavouras, S. A.; Suh, H.; Lang, F. Underhydration is associated with obesity, chronic diseases, and death within 3 to 6 years in U.S. adults aged 51–70 years. Nutrients 2020, 12, 905. [Google Scholar] [CrossRef] [PubMed]
- Gera, T.; Shah, D.; Garner, P.; Richardson, M.; Sachdev, H. S. Integrated management of childhood illness (IMCI) strategy for children under five. Cochrane Database Syst. Rev. 2016. [Google Scholar] [CrossRef] [PubMed]
- World Health Organization. Integrated Management of Childhood Illness: Chart Booklet (In-service training) (WHO Library Cataloguing-in-Publication Data). Geneva, Switzerland: Author. 2014. Available online: https://cdn.who.int/media/docs/default-source/mca-documents/child/imci-integrated-management-of-childhood-illness/imci-in-service-training/imci-chart-booklet.pdf?sfvrsn=f63af425_1.
- Chang, W.; Cheng, J.; Allaire, J.; Sievert, C.; Schloerke, B.; Aden-Buie, G.; Xie, Y.; Allen, J.; McPherson, J.; Dipert, A.; Borges, B. shiny: Web Application Framework for R. R package version 1.12.1.9000. 2026. Available online: https://shiny.posit.co/.
Figure 1.
Conceptual framework showing research progression.

Figure 2.
Methodological workflow showing the two-phase structure of the study.
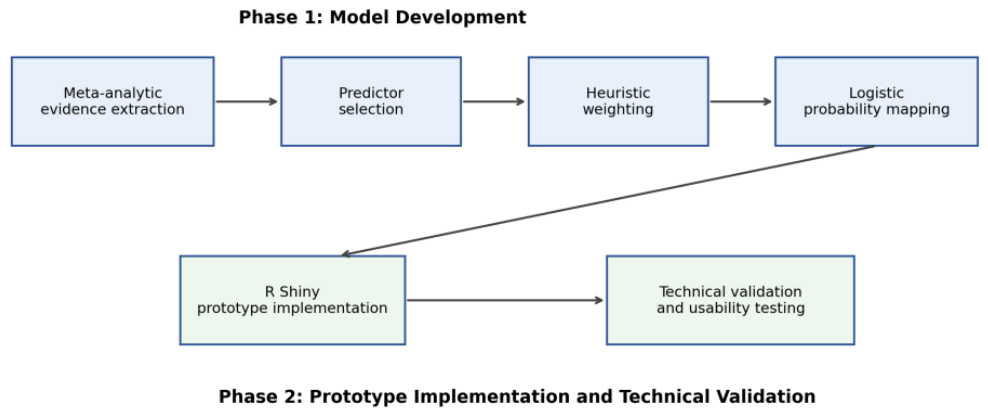
Figure 3.
Logistic probability mapping curve showing the relationship between total dehydration score and predicted probability of dehydration.
Figure 3.
Logistic probability mapping curve showing the relationship between total dehydration score and predicted probability of dehydration.
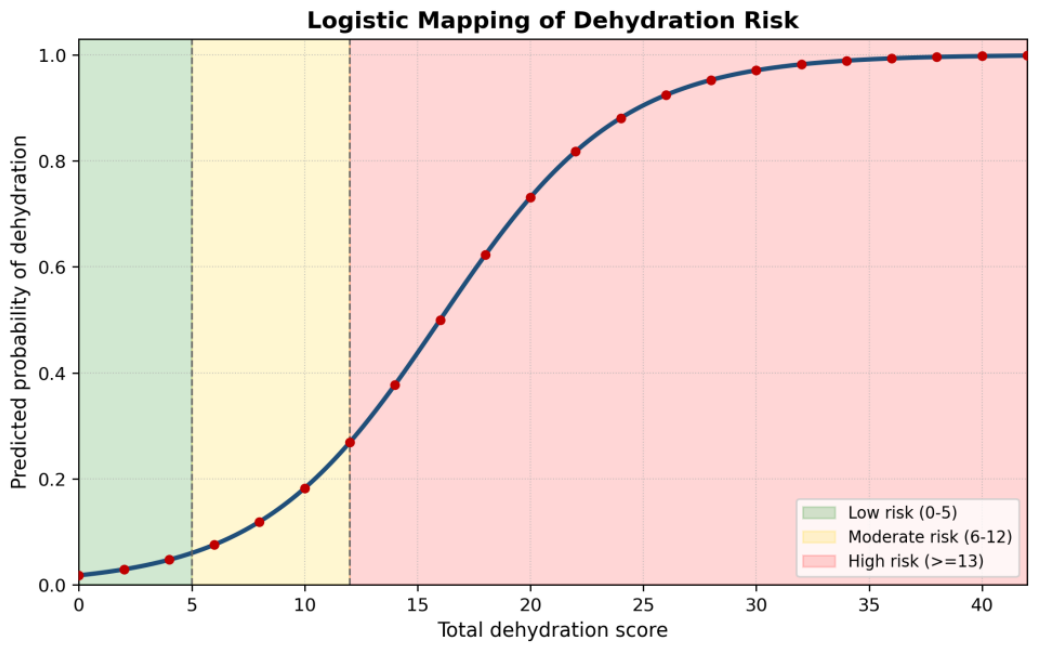
Table 1.
Predictor variables and assigned weights used in the dehydration-risk scoring model.
| Predictor | Assigned weight | Role in model |
|---|---|---|
| Thirst | 4 | High-weight symptom |
| Dry mouth / mucous membranes | 3 | Moderate clinical sign |
| Dark urine | 3 | Moderate clinical sign |
| Fatigue / weakness | 2 | Supportive symptom |
| Vomiting | 3 | Acute fluid-loss indicator |
| Diarrhea | 3 | Acute fluid-loss indicator |
| Sunken eyes | 3 | Clinical dehydration sign |
| Reduced urine output | 3 | Physiological indicator |
| Unable / unwilling to drink | 4 | High-weight danger sign |
| Prolonged capillary refill | 3 | Perfusion-related sign |
| Lethargy / decreased consciousness | 4 | High-weight severity sign |
| Dizziness / light-headedness | 2 | Supportive symptom |
| Fever (>38 degrees C) | 2 | Fluid-loss modifier |
| Age >= 65 years | 1 | Demographic modifier |
| Comorbidity | 1 | Health-status modifier |
| Cognitive impairment | 1 | Self-hydration modifier |
Table 2.
Provisional Dehydration-Risk Score (Variables, Weights, and Diagnostic Basis).
| Predictor | Assigned Weight (points) | Supporting Diagnostic Evidence (approx.) | Evidence Source(s) |
|---|---|---|---|
| Thirst | 4 | Sensitivity ≈ 90%, Specificity ≈ 60% | Ogbolu et al., 2025; Elliott et al., 2024; Keefe et al., 2025 |
| Dry mouth / mucous membranes | 3 | Sens. ≈ 85%, Spec. ≈ 70% | Falszewska et al., 2018; World Health Organization, 2014 |
| Dark urine | 3 | Sens. ≈ 88%, Spec. ≈ 68% | Ogbolu et al., 2025; Keefe et al., 2024 |
| Fatigue / weakness | 2 | Sens. ≈ 82%, Spec. ≈ 72% | Ogbolu et al., 2025; Stookey et al., 2020 |
| Vomiting | 3 | Strong indicator of acute fluid loss | World Health Organization, 2014; Gera et al., 2016 |
| Diarrhea | 3 | Primary cause of volume loss in IMCI criteria | World Health Organization, 2014 |
| Sunken eyes | 3 | Consistent sign in pediatric and elderly assessment | World Health Organization, 2014; Goldman et al., 2008 |
| Reduced urine output (oliguria) | 3 | Sens. ≈ 80%, Spec. ≈ 70% | Ogbolu et al., 2025; Rosi et al., 2022 |
| Unable / unwilling to drink | 4 | Critical IMCI “danger sign” | World Health Organization, 2014; Ogbolu et al., 2025 |
| Prolonged capillary refill time | 3 | Sens. ≈ 75%, Spec. ≈ 70% | Falszewska et al., 2018 |
| Lethargy / decreased consciousness | 4 | Marker of severe volume depletion | World Health Organization, 2014; Ogbolu et al., 2025 |
| Dizziness / light-headedness | 2 | Symptoms of orthostatic hypovolemia | Ogbolu et al., 2025; Mentes, 2006 |
| Fever (>38 °C) | 2 | Contributor to insensible fluid loss | World Health Organization, 2014; Bennett et al., 2020 |
| Age ≥ 65 years | 1 | Risk modifier for reduced thirst drive | Parkinson et al., 2023; Alsanie et al., 2022 |
| Comorbidity (e.g., diabetes, CKD) | 1 | Chronic risk for fluid imbalance | Stookey et al., 2020 |
| Cognitive impairment | 1 | Limits self-hydration ability | Mentes, 2006; Ogbolu et al., 2025 |
| Maximum Total Score | 42 |
Sens. = sensitivity; Spec. = specificity; CKD = chronic kidney disease.
Table 3.
Risk categories used for interpretation of total dehydration score.
| Risk level | Score range | Interpretation |
|---|---|---|
| Low risk | 0-5 | Minimal symptom burden; monitor hydration status. |
| Moderate risk | 6-12 | Early-to-moderate risk; consider oral rehydration and reassessment. |
| High risk | >=13 | Probable severe dehydration; urgent clinical assessment is advised. |
Table 5.
Functional Verification and Software Performance Testing Results.
| Domain | Metric / Test | Result | Interpretation |
|---|---|---|---|
| Functional verification | Score calculation | 100% agreement | Correct implementation of scoring logic |
| Functional verification | Probability transformation | 100% agreement | Correct logistic mapping |
| Functional verification | Risk classification | 100% agreement | Accurate category assignment |
| Computational performance | Response time | ~0.18 s | Real-time system performance |
| System stability | Error incidence | 0 errors | Stable operation |
| Concurrency handling | Multi-user testing | No delays | Robust under concurrent use |
| Cross-platform rendering | Device compatibility | Stable | Works across browsers and devices |
| Usability | Task completion time | < 1 minute | Efficient workflow |
| Usability | User feedback | Positive | Good interpretability |
Disclaimer/Publisher’s Note: The statements, opinions and data contained in all publications are solely those of the individual author(s) and contributor(s) and not of MDPI and/or the editor(s). MDPI and/or the editor(s) disclaim responsibility for any injury to people or property resulting from any ideas, methods, instructions or products referred to in the content. |
© 2026 by the authors. Licensee MDPI, Basel, Switzerland. This article is an open access article distributed under the terms and conditions of the Creative Commons Attribution (CC BY) license (http://creativecommons.org/licenses/by/4.0/).
Copyright: This open access article is published under a Creative Commons CC BY 4.0 license, which permit the free download, distribution, and reuse, provided that the author and preprint are cited in any reuse.