

Submitted:
09 April 2026
Posted:
10 April 2026
You are already at the latest version
Abstract
The input–output model is an important analytical tool in regional economics because it represents economic sectors and their productive interconnections. This study proposes a new analytical framework based on two multipliers—one for production and another for value added—from which a Value Conversion Rate (VCR) is derived. The VCR measures the efficiency with which changes in output are converted into value added. Based on these indicators, a quadrant-based graphical structure is developed that combines the intensity of the production multiplier with the VCR. This structure highlights their possible combinations and indicates whether the propagation of production effectively translates into value-added generation, offering a new perspective for interpreting productive structures. By integrating propagation capacity with the efficiency of value creation, the VCR framework provides analytical support for economic diagnostics and for policies aimed at sustainable economic and social development. The approach is illustrated using the 2019 input–output matrix of the state of Rio Grande do Sul, Brazil.
Keywords:
input–output analysis
; value added
; production multipliers
; value conversion rate (VCR)
; regional economic development
1. Introduction
National and regional economies pursue development through a wide range of public policies, including investments in infrastructure—either directly by governments or through concessions and public–private partnerships (PPPs)—as well as policies related to education, science, research, innovation, and fiscal incentives. In the state of Rio Grande do Sul, Brazil, tax expenditures associated with indirect taxation represent approximately 20% of the revenue collected from the ICMS, a value-added tax. Public investment has also increased since 2021 after several decades in which it remained relatively residual. In addition, the state recently adopted a development strategy and now has an updated input–output matrix, released in 2024 and estimated by the Federal University of Rio de Janeiro (UFRJ) based on 2019 data (UFRJ, 2024a, 2024b).
Input-output analysis is commonly referred to as the Leontief model, and is also known as cross-sector analysis, as this constitutes its fundamental objective – the analysis of the interdependence of industries in an economy. The basic information used in input-output analysis concerns the flows of products from each industrial sector; for each sector, the producer is considered to be the sector itself and others, considered consumers (Miller and Blair, 2009).
Since the introduction of the input-output matrix by Leontief (1936) and its subsequent theoretical and methodological development, several structural analysis studies have investigated the interdependencies between productive sectors (Leontief, 1986; Miller and Blair, 2009). The input-output matrix is considered an impact analysis when changes are on a short-term horizon. For forecasting exercises, i.e., longer timeframes, accuracy tends to decrease, both due to a reduced ability to accurately predict new final demands and because the matrix coefficients may have changed (Miller and Blair, 2009). Input-output analysis remains one of the most widely applied methods in economics, but its use is still restricted within public bodies responsible for designing and implementing public policies, which implies underutilization in development planning.
Chenery and Watanabe (1958) show that patterns of intersectoral interdependence are broadly similar across countries—especially in manufacturing—suggesting that input-output analyses can be compared internationally.
Erik Dietzenbacher (1992) argues that these methods have limitations when considering sectoral interdependencies, especially when isolated technical coefficients generate overestimations in linkage indicators. As an alternative, the author proposed a method based on eigenvectors, in which the elements of the eigenvector associated with the dominant eigenvalue (Perron vector) are used to measure inter-industry linkages. In this context, the eigenvector to the left of the input coefficient matrix represents backward linkages, while the eigenvector to the right of the output distribution matrix represents forward linkages. To evaluate the performance of the approach, the author performs an empirical application to the Netherlands using annual input-output tables from 1948 to 1984, aggregated into thirteen sectors. The results show that the Chenery-Watanabe and Rasmussen methods produce quite similar rankings, while the eigenvector-based method reveals relevant differences in some sectors. In forward linkages, for example, traditional methods tend to overestimate the importance of sector 1 (agriculture, forestry, and fishing) due to the strong dependence on sector 2 (meat and dairy processing), whose production is mainly destined for final demand. A similar situation occurs in sector 5 (chemical industry). On the other hand, the eigenvector method highlights with greater intensity sectors whose production is more widely distributed among other productive sectors, such as sector 8 (other manufacturing industries), sector 9 (public services), and sector 12 (banking and insurance). In backward linkages, the differences between the methods are smaller. Taken together, the results indicate that the proposed method offers an alternative systemic approach to productive interdependencies, being particularly useful for identifying sectoral clusters and structural changes in the economy over time.
Moraes and Oliveira (2025) calculate the Rasmussen indices for the input-output matrix of Rio Grande do Sul to identify forward and backward production linkages between sectors, indicating that higher values reflect greater productive complexity and higher multiplier potential in response to supply and demand shocks. In terms of backward linkages, the activities with the strongest upstream effects were the food industry (meat and dairy, beverages), biofuels, footwear, and metalworking, whose performance stimulates demand for products from the rest of the production matrix, generating significant multiplier effects for economic growth. Regarding forward linkages, industrial process activities such as oil refining and the chemical sector play a relevant role, as they constitute strategic nodes in several value chains because their products are used as inputs by multiple productive activities. The comparison between backward and forward linkages indicates a strong presence of input-producing sectors in the state’s production structure, which play a relevant role in production chains by supplying inputs used by multiple activities in the productive system. Marconi et al. (2016), seeking to analyze the export capacity of commodities in promoting sustainable growth, use the input-output matrix to evaluate upstream and downstream sectoral performance. They conclude that the agricultural and mineral sectors have little capacity to promote growth, as they present low linkage indices. They highlight that sectors related to manufacturing can stimulate other sectors such as sophisticated services.
Jiang et al. (2009) highlight the importance of regional input-output matrices and acknowledge their cost. The authors propose that, in the construction or updating of matrices where information is lacking, coefficients or information from tables of other regional matrices should be used, especially if the regions are economically and technologically similar. Wiebe et al. (2026) using global multiregional input-output data develop a framework that connects the future adoption of offshore wind energy and solar photovoltaic energy technologies, which alter the structure of electricity production, to changes in global value chains. The results point to desirable and undesirable effects, of varying magnitudes, on the Sustainable Development Goals.
Brazilian states, like many developing countries, rely heavily on indirect taxes levied on value added. To make the tax incentives they implement to reduce the gap with more developed economies sustainable, they need solutions that ensure production growth is accompanied by increases in local value added, job creation, and income generation
Tax incentives are only justified if the incentivized activity generates benefits for society, not just private gains for those receiving the incentive. It is important to assess the social costs of the incentive, including the loss of tax revenue (Platform for Collaboration on Tax, 2025). According to Hirschman (1961), economic development faces difficulties not only due to physical limitations or scarcity of resources, but also due to imperfections in the decision-making process. The capacity to decide on and implement economic actions is a scarce resource that hinders the progress of development.
Value added represents the income effectively generated in the economy and is distributed among wages, profits, and taxes. Sectors with higher value-added content therefore tend to generate higher wages, higher average incomes, and greater tax revenues. In this sense, the capacity of production chains to convert production into value added is a central element for economic development and the sustainability of public finances. In Brazil, the recent tax reform adopted exclusive taxation on consumption rather than a hybrid system combining production and consumption. As a result, value added has gained even greater relevance, motivating the framework and indicator proposed in this study.
This paper makes two main contributions. First, it introduces a new analytical framework based on input–output analysis that evaluates how product shocks propagate through the economy through direct and indirect production effects and how they translate into value added. Second, it proposes the Value Conversion Rate (VCR), an indicator that links production propagation to value-added generation, allowing the identification of products whose economic propagation effectively contributes to value creation. The framework provides an intuitive interpretation that allows economic policy makers to identify and evaluate which products are most relevant for value generation in the economy. The framework is illustrated using the 2019 regional input–output matrix of Rio Grande do Sul, Brazil.
The proposed model can also support sustainability-oriented policy analysis by identifying production chains that generate limited value added despite large production propagation effects, which may indicate inefficiencies in resource use. In addition to this introduction, the paper is organized as follows. Section 2 presents the conceptual model, Section 3 illustrates its empirical application, and the final section concludes.
2. Model Concept
The analysis of production chain dynamics is traditionally carried out based on the input-output structure, in which the economic effects of variations in final demand are transmitted along production chains through intersectoral production relationships. In this context, multipliers derived from the inverse Leontief matrix are widely used instruments to measure the systemic impact of demand shocks on the level of production in the economy.
However, production multipliers only capture the magnitude of economic propagation, without distinguishing the quality of this expansion in terms of value-added generation. Long production chains can generate high production multipliers but convert only a limited fraction of this effect into income, wages, and economic surpluses. In contrast, sectors with shorter chains may exhibit less productive propagation, but a greater capacity to transform production into added value. Based on this distinction, the Value Conversion Rate (VCR) is proposed as an indicator that relates the production and value-added effects derived from an economic shock. The VCR measures the proportion of the total productive impact that is effectively converted into added value along the production structure. In this way, the indicator allows for the simultaneous evaluation of two central aspects of economic dynamics: the intensity of production linkages and the efficiency in converting production into added value.
2.1. Input-Output Structure and Multipliers
Consider an economy represented by the matrix of technical coefficients , in which each element indicates the quantity of input from sector required to produce one unit of output in sector . The fundamental input-output relationship of the model can be expressed as:
x represents the total production vector of the sectors;
A is the matrix of technical coefficients;
f is the final demand vector.
Reorganizing the expression, we obtain:
The sum of the columns of the Leontief matrix allows the calculation of production multipliers, which measure the total production impact generated by a unit increase in final demand. Traditionally, these multipliers are interpreted from a sector-based perspective. However, since the input–output table used in this study follows a product–industry structure, the analysis starts from the product that generates the final demand and then traces how this demand propagates across the sectors involved in its production. In this sense, the multiplier captures the total production effects generated by a given product and transmitted through the productive structure of the economy.
2.2. Added Value Multipliers
To assess the generation of added value associated with productive effects, the vector of added value coefficients is defined:
is the Added Value of the sector ;
is the total production of sector .
Applying these coefficients to the linkage structure represented by the Leontief matrix allows us to calculate the total effects on added value resulting from a demand shock:
This multiplier captures the portion of the total productive impact that effectively translates into added value along the production chains.
2.3. Building the Value Conversion Rate (VCR)
Based on the two multipliers previously defined, the Value Conversion Rate (VCR) is defined as the ratio between the value-added multiplier and the production multiplier:
The VCR framework is illustrated in Figure 1. The quadrants are defined using the mean values of the production multiplier and the VCR, allowing sectors to be classified according to different combinations of propagation capacity and value-added conversion. Sectors located in the upper-right quadrant combine high production multipliers and high VCR values, indicating activities that both generate strong propagation effects across sectors and convert production efficiently into value added.
The upper-left quadrant includes sectors with high VCR but lower production multipliers. These activities generate relatively high value added from production but have more limited propagation effects within the production network. In the lower-right quadrant, sectors present high production multipliers but low VCR values. These activities generate stronger propagation effects across sectors but convert a smaller share of production into value added. Finally, sectors located in the lower-left quadrant combine low multipliers and low VCR values, indicating activities with limited propagation effects and lower efficiency in converting production into value added.
The VCR framework provides a simple analytical tool to identify sectors that may play a more strategic role in processes of structural change and industrial policy design. A central feature of the approach adopted in this study is that the analysis is conducted from a product perspective rather than exclusively from the perspective of productive activities. Although input–output matrices are traditionally structured in terms of sectors or activities, the choice to work at the product level reflects both analytical considerations and its relevance for public policy design. Methodologically, a product-based approach allows the analysis of how an increase in demand for specific goods or services propagates throughout the productive structure, activating different economic activities through the intersectoral linkages captured by the Leontief matrix. In this framework, the product constitutes the starting point of the economic shock. An exogenous change in the demand for a specific product is introduced, and the Leontief inverse is used to estimate the total effects on production and value added along the entire production chain.
Moreover, a product-based perspective has strong practical relevance for economic policy makers, who can better develop their regional development strategies from this standpoint. Policies aimed at attracting investment, promoting industrial development, and fostering economic development are rarely formulated on the basis of abstract categories of productive activities. Instead, they are typically associated with specific products, production chains, or industrial segments, often materialized in the form of firms that produce particular goods or services. In other words, territories do not seek to attract an economic activity in the abstract, but rather firms that produce specific products or that integrate into specific production chains.
In this context, a product-based approach makes the analysis closer to the logic of public policy formulation. The establishment of a firm producing a given good may trigger the activation of multiple activities along the production chain, many of which may initially be located outside the region under consideration. However, as demand for inputs and services associated with the product increases, some of these activities tend to seek locations closer to the productive core, generating processes of agglomeration and strengthening of local production chains. Thus, a product-based analysis allows the identification of which goods or services have a greater capacity to generate systemic effects on the regional economy, both in terms of productive propagation and value-added generation. This perspective expands the practical usefulness of the proposed indicator by bringing structural analysis closer to the decision-making logic of economic development policies, investment attraction strategies, and regional production planning.
Although the framework is illustrated using an aggregated 16×16 symmetric input–output matrix for visualization purposes, the indicators are computed at the product level using the original supply–use structure. This enables the framework to be directly applied to product-level impact simulations in more detailed matrices with a much larger number of products, ensuring consistency between an expanded structural interpretation and policy analysis.
3. Results and Policy Implications
The empirical application of the framework using the 2019 input–output matrix of Rio Grande do Sul (16×16 sectors) is presented in Figure 2. The figure positions economic sectors according to two structural indicators: the production multiplier, which captures the intensity of intersectoral production linkages, and the Value Conversion Rate (VCR), which measures the capacity to convert induced production (direct and indirect) into value added. The intersection of the average values of these indicators divides the diagram into four quadrants, allowing the identification of distinct structural roles within the regional economy. In addition, the size of each bubble represents the sector’s share in total value added, introducing a third dimension that highlights the economic relevance of each activity.
In the upper-right quadrant, sectors combine high production multipliers with high VCR levels, representing activities with both strong intersectoral propagation and efficient value-added generation. In the case of Rio Grande do Sul, construction, accommodation and food services, and arts and other services stand out in this group, indicating activities capable of generating broad multiplier effects while maintaining significant value-added creation.
The upper-left quadrant includes sectors with high VCR but relatively weaker production multipliers. These efficient sectors generate substantial value added directly but display weaker intersectoral propagation effects. Examples include public administration and social security, private education and health, real estate activities, and domestic services. These activities tend to be intensive in labor income or institutional transfers and therefore contribute strongly to value-added generation, although their capacity to stimulate broader production chains is comparatively limited.
Manufacturing stands out in the diagram as the largest bubble, indicating its substantial share in total value added within the regional economy. The sector displays a high production multiplier while maintaining an average VCR, suggesting that it combines strong intersectoral propagation with a balanced conversion of induced production into value added. This configuration highlights manufacturing as a structurally important sector in the regional economy, capable of generating significant multiplier effects while still contributing meaningfully to value-added creation. The lower-right quadrant groups sectors with high production multipliers but lower value-added conversion rates. In this category, activities such as transport and storage and electricity, gas, water and waste stand out. These sectors mobilize extensive intermediate inputs and generate significant intersectoral interactions, but a relatively smaller share of the resulting economic activity is converted directly into value added. Extractive industries, in turn, display particularly low VCR values, indicating a weaker capacity to convert induced production into value added within the regional economy.
The lower-left quadrant contains sectors that combine relatively low production multipliers with low VCR levels. In this group, professional and technical services and financial and insurance activities appear clearly positioned within the quadrant, indicating activities that generate limited intersectoral propagation while also displaying comparatively low value-added conversion within the production system. Other sectors occupy positions close to the quadrant boundaries and therefore present intermediate structural characteristics. In particular, trade, agriculture, and information and communication exhibit production multipliers close to the sample average but differ in their value-added conversion rates. Trade shows a VCR above the average, indicating stronger capacity to convert induced production into value added, whereas agriculture and information and communication remain below the average threshold, suggesting more limited value-added conversion despite their moderate production linkages.
The structural patterns may vary across regional economies depending on their productive specialization and industrial structure. Nevertheless, the framework provides useful insights for the design of public policies aimed at strengthening productive linkages and improving value-added generation.
An additional insight emerging from the empirical VCR framework is the presence of a structural trade-off between production linkages and value conversion efficiency, which appears as a diagonal pattern in the sectoral distribution. Products with stronger production multipliers tend to display lower VCR levels, reflecting the fact that long production chains involve extensive intermediate consumption before value added is generated. Conversely, products with high value conversion rates frequently exhibit more limited intersectoral propagation, as a larger share of their output is directly associated with labor income, services, or institutional activities rather than complex supply chains. This pattern highlights an underlying structural tension between propagation capacity and value-added intensity within the economic system. In this sense, products located near the upper-right quadrant become particularly relevant because they partially overcome this trade-off, combining significant production linkages with relatively high value conversion rates. Identifying such products is one of the key analytical contributions of the VCR framework, as it allows distinguishing activities or products that simultaneously enhance economic propagation and the generation of value added within the productive structure. Table 1 reports the ranking of products and their multipliers.
It is important to highlight that this analysis complements several others, such as Moraes and Oliveira (2025), which indicate a trajectory of increasing isolation for Rio Grande do Sul, along with a loss of competitiveness in the production of final goods and a growing concentration in input industries. Marconi et al. (2016) argue that the agricultural and mineral industries have a limited capacity to promote growth due to their low linkage indices. The VCR framework analysis advances these explanations by identifying the very low value added in extractive industries, which is even below the average observed in agriculture.
4. Conclusions
This study introduced the Value Conversion Rate (VCR) as a complementary indicator for interpreting input–output structures by jointly considering two fundamental dimensions of economic propagation. The first is the production multiplier, which measures the intensity of interindustry linkages and the capacity of production shocks to propagate through the economic system. The second is the value-added multiplier, which captures how much value added is generated throughout this process. By defining the VCR as the ratio between these two multipliers, the framework measures how efficiently the total production induced in the economy is converted into value added. In this sense, the indicator adds a conversion perspective to traditional multiplier analysis, allowing the productive structure to be interpreted simultaneously in terms of propagation capacity and value creation.
The framework representation distributes products according to their production multipliers and VCR values, while bubble sizes represent each product’s share in total value added. The intersection of the averages of the two indicators divides the space into four analytical zones, which correspond to different structural configurations combining stronger or weaker propagation effects with higher or lower value conversion efficiency. The empirical distribution reveals clear structural differences in how products contribute to the regional economy. Some products combine strong production linkages with high value conversion. In the case of Rio Grande do Sul, construction, accommodation and food services, and arts and other services stand out in this group. The empirical exercise, however, should be interpreted with caution. One important limitation of the analysis is the use of a 16×16 input–output matrix, which implies a high level of aggregation. Although this aggregation facilitates graphical visualization and the conceptual demonstration of the framework, it inevitably masks heterogeneity across individual products and production technologies. More disaggregated matrices would likely reveal a richer distribution of products across the analytical space and allow a more precise structural interpretation.
The VCR can be used to identify more precisely which products or production chains combine stronger economic propagation effects with greater conversion into value added. This can contribute to the design of productive development strategies, industrial policies, and investment attraction programs. Future research can expand the VCR framework in several directions. The indicator is fully compatible with the standard structure of input–output matrices used internationally, which allows its application across different countries or regions. As a result, the VCR can be employed in comparative analyses between national, regional, or local economies, expanding its potential use as an analytical tool for studies of productive structure and the evaluation of economic policies.
Finally, the VCR framework allows economic policies to be oriented toward strengthening value-added generation based on existing productive structures. Over time, as input–output matrices are updated, comparisons between VCR values can also help analyze the evolution of the economy and structural changes in production systems.
Funding
This research received no external funding.
Data Availability Statement
All data used in this study are publicly available from the sources cited in the article.
Conflicts of Interest
The author declares no conflict of interest.
References
- Chenery, H. B.; Watanabe, T. International Comparisons of the Structure of Production. Econometrica 1958, 26(4), 487–521. [Google Scholar] [CrossRef]
- Dietzenbacher, E. The measurement of interindustry linkages: Key sectors in the Netherlands. Economic Modelling 1992, 9(4), 419–437. [Google Scholar] [CrossRef]
- Hirschman, A. O. Estratégia do desenvolvimento econômico; Editora Fundo de Cultura: Rio de Janeiro, 1961. [Google Scholar]
- Jiang, X.; Dietzenbacher, E.; Los, B. Improved Estimation of Regional Input–Output Tables Using Cross-regional Methods. Regional Studies 2012, 46(5), 621–637. [Google Scholar] [CrossRef]
- Leontief, W. W. Quantitative Input and Output Relations in the Economic Systems of the United States. The Review of Economics and Statistics 1936, 18(3), 105–125. [Google Scholar] [CrossRef]
- Leontief, W. Input-output economics, 2nd ed.; Oxford University Press, 1986. [Google Scholar]
- Marconi, N.; Rocha, I. L.; Magacho, G. R. Sectoral capabilities and productive structure: An input–output analysis of the key sectors of the Brazilian economy. Brazilian Journal of Political Economy 2016, 36(3), 470–492. [Google Scholar] [CrossRef]
- Miller, R. E.; Blair, P. D. Input-output analysis: Foundations and extensions, 2nd ed.; Cambridge University Press, 2009. [Google Scholar]
- Moraes, R. K.; Oliveira, F. M. Fatores do desenvolvimento regional. In Perspectivas para o Desenvolvimento do Rio Grande do Sul: da competitividade às finanças; Tonetto, J. L., Ed.; Pimenta Cultural, 2025. [Google Scholar] [CrossRef]
- Platform for Collaboration on Tax. Tax incentives principles. Washington, DC, 2025. Available online: https://www.tax-platform.org/sites/pct/files/publications/Tax-Incentives-Principles.pdf.
- Universidade Federal do Rio de Janeiro (UFRJ). Matriz insumo-produto do estado do Rio Grande do Sul 2019 (MIP-RS) e tabela de recursos e usos (TRU-RS) [Dataset]. Rio de Janeiro, Brasil, 2024a. Available online: https://tesouro.fazenda.rs.gov.br/upload/arquivos/202505/29150405-20240906162755mip-rs-2019-16-16-v2.xlsx.
- Universidade Federal do Rio de Janeiro (UFRJ); Instituto de Economia. Produto riscos fiscais: desenvolvimento de matriz de avaliação da estrutura produtiva do Rio Grande do Sul – relatório metodológico. Convênio de P,D&I SEFAZ-RS/UFRJ/Fundação Coppetec. 2024b. Available online: https://tesouro.fazenda.rs.gov.br/upload/arquivos/202505/29150404-20240913112712mip-rs-rel-fim.pdf.
- Wiebe, K. S.; Aponte, F. R.; Bly, K.; Luttikhuis, N.; Simas, M. S.; Arega, M. A.; Werner, A. T. Linking the sustainable development goals to input–output analysis: Sensitivity of indicators to global input coefficients for renewable electricity production. Economic Systems Research 2026. [Google Scholar] [CrossRef]
Figure 1.
Value Conversion Rate (VCR) Framework.
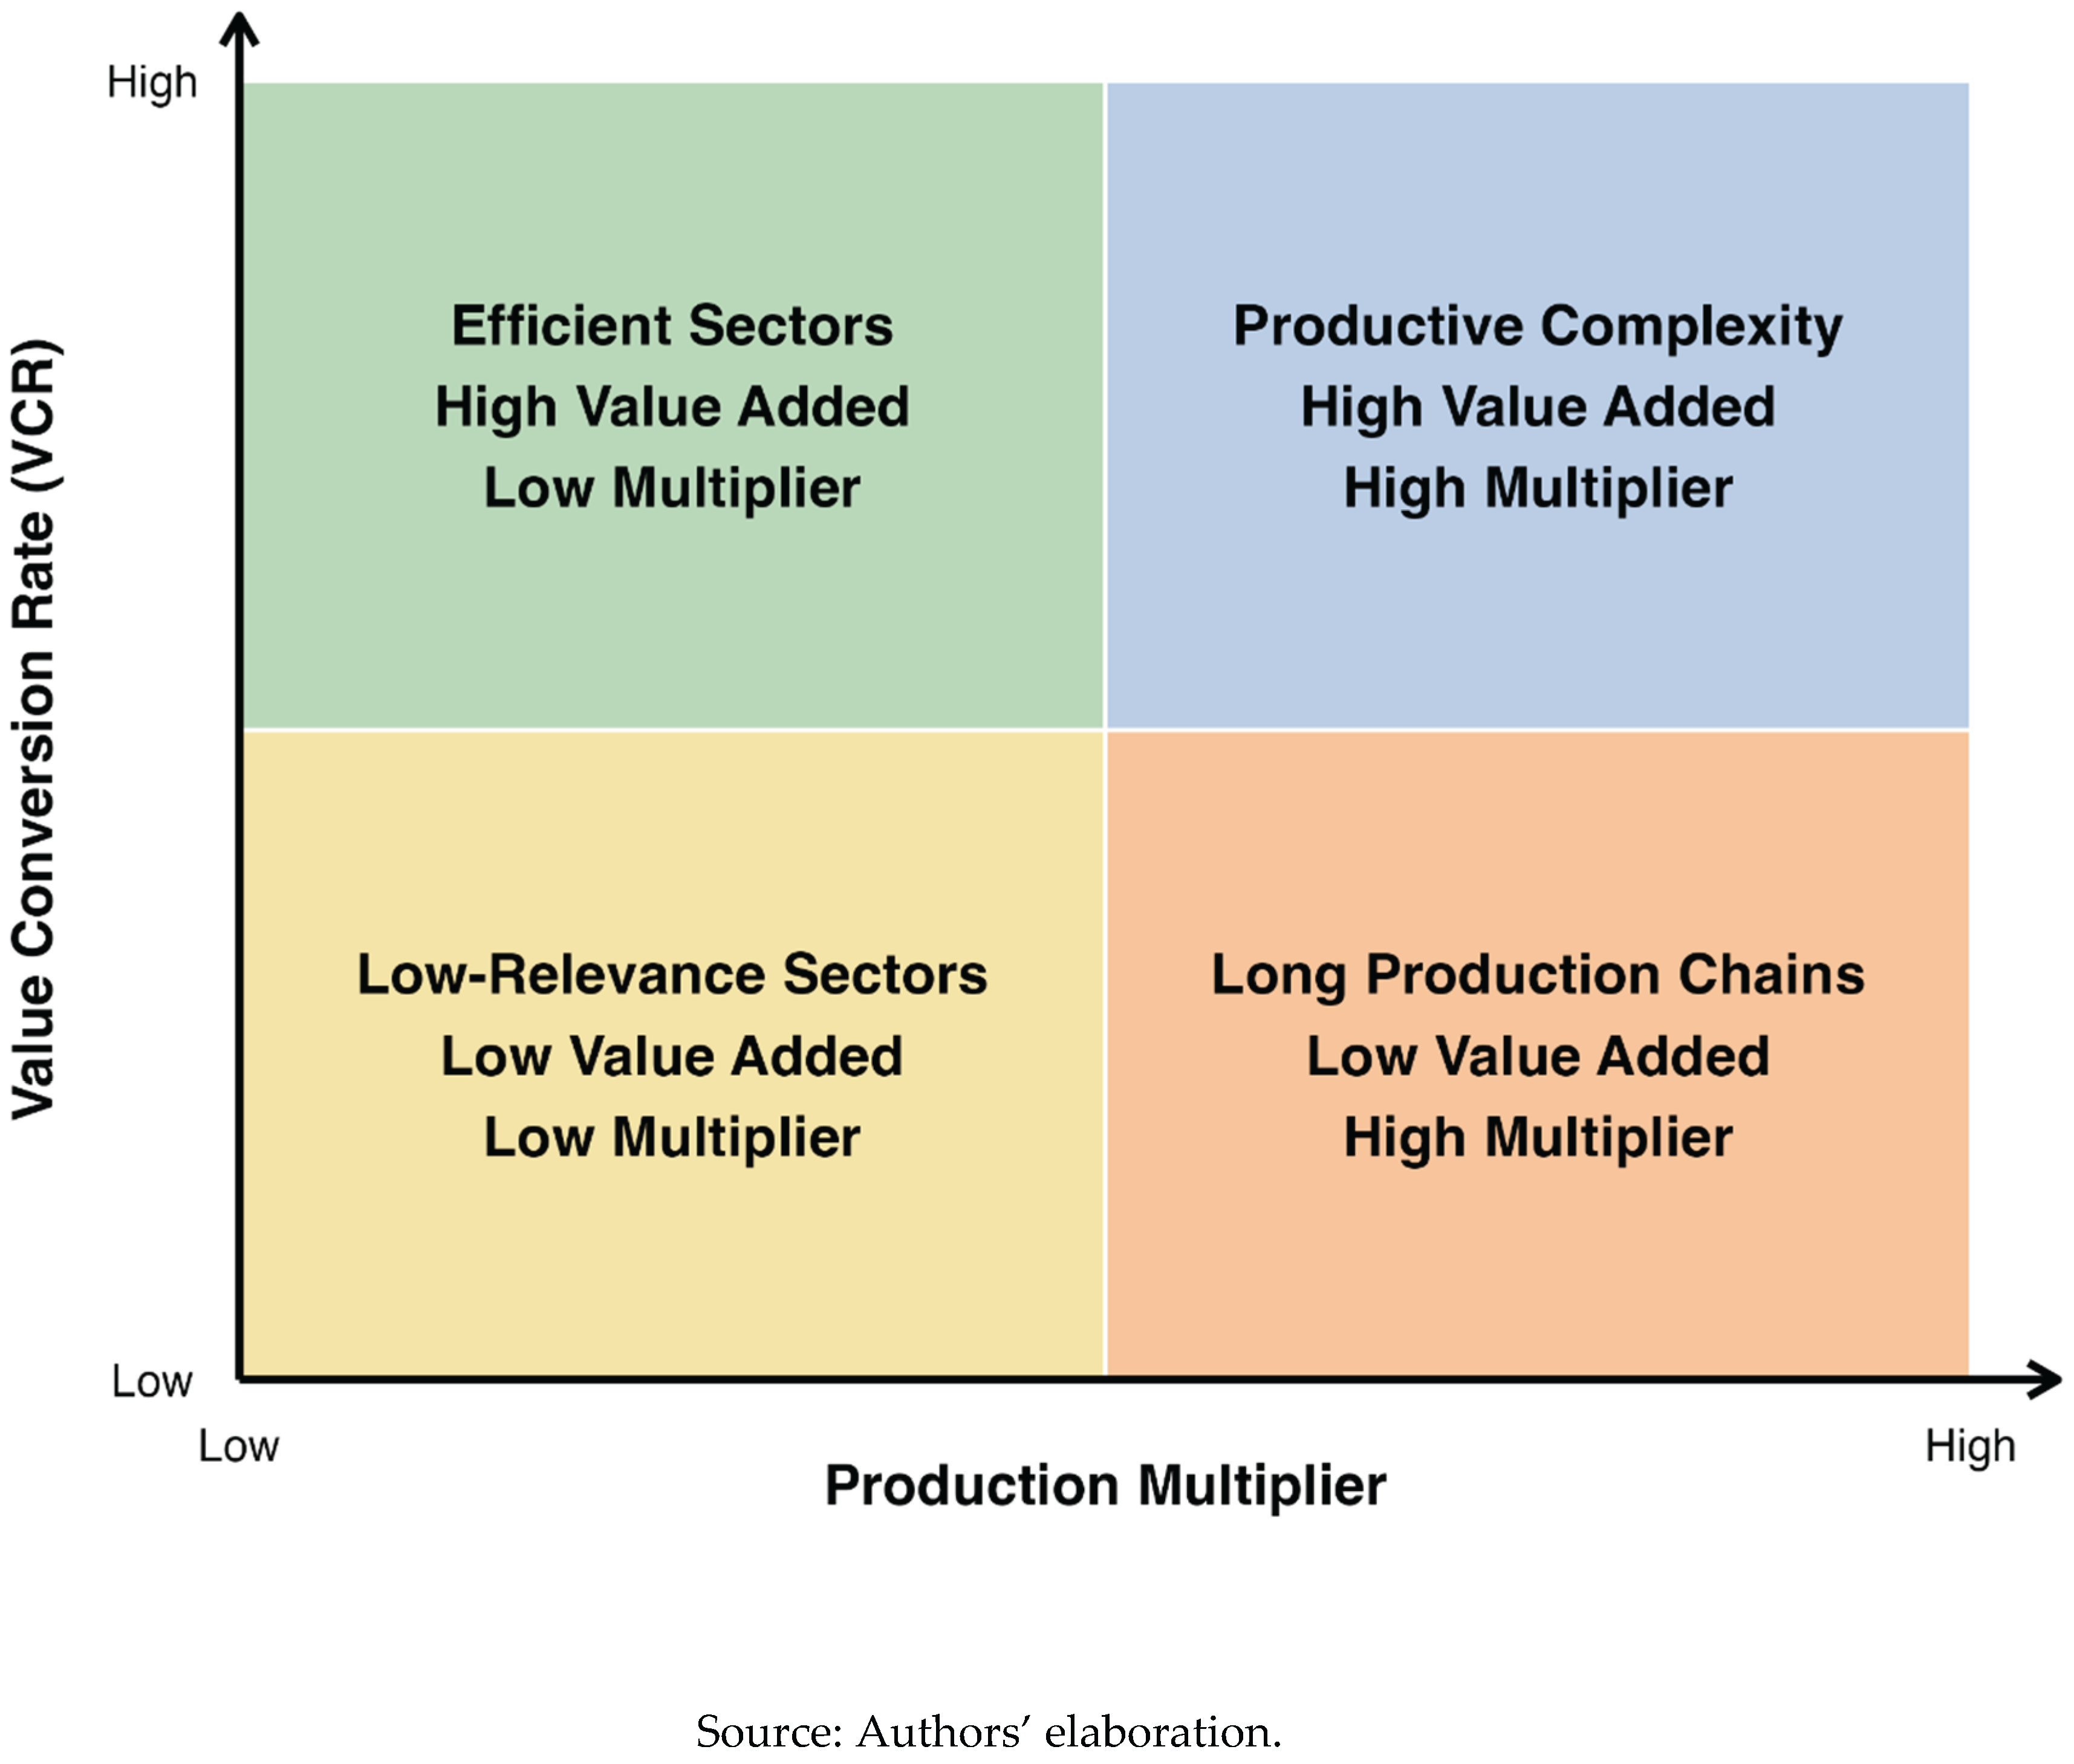
Figure 2.
Production multipliers and value-added intensity: application of the VCR framework using the 2019 input–output matrix of Rio Grande do Sul.
Figure 2.
Production multipliers and value-added intensity: application of the VCR framework using the 2019 input–output matrix of Rio Grande do Sul.
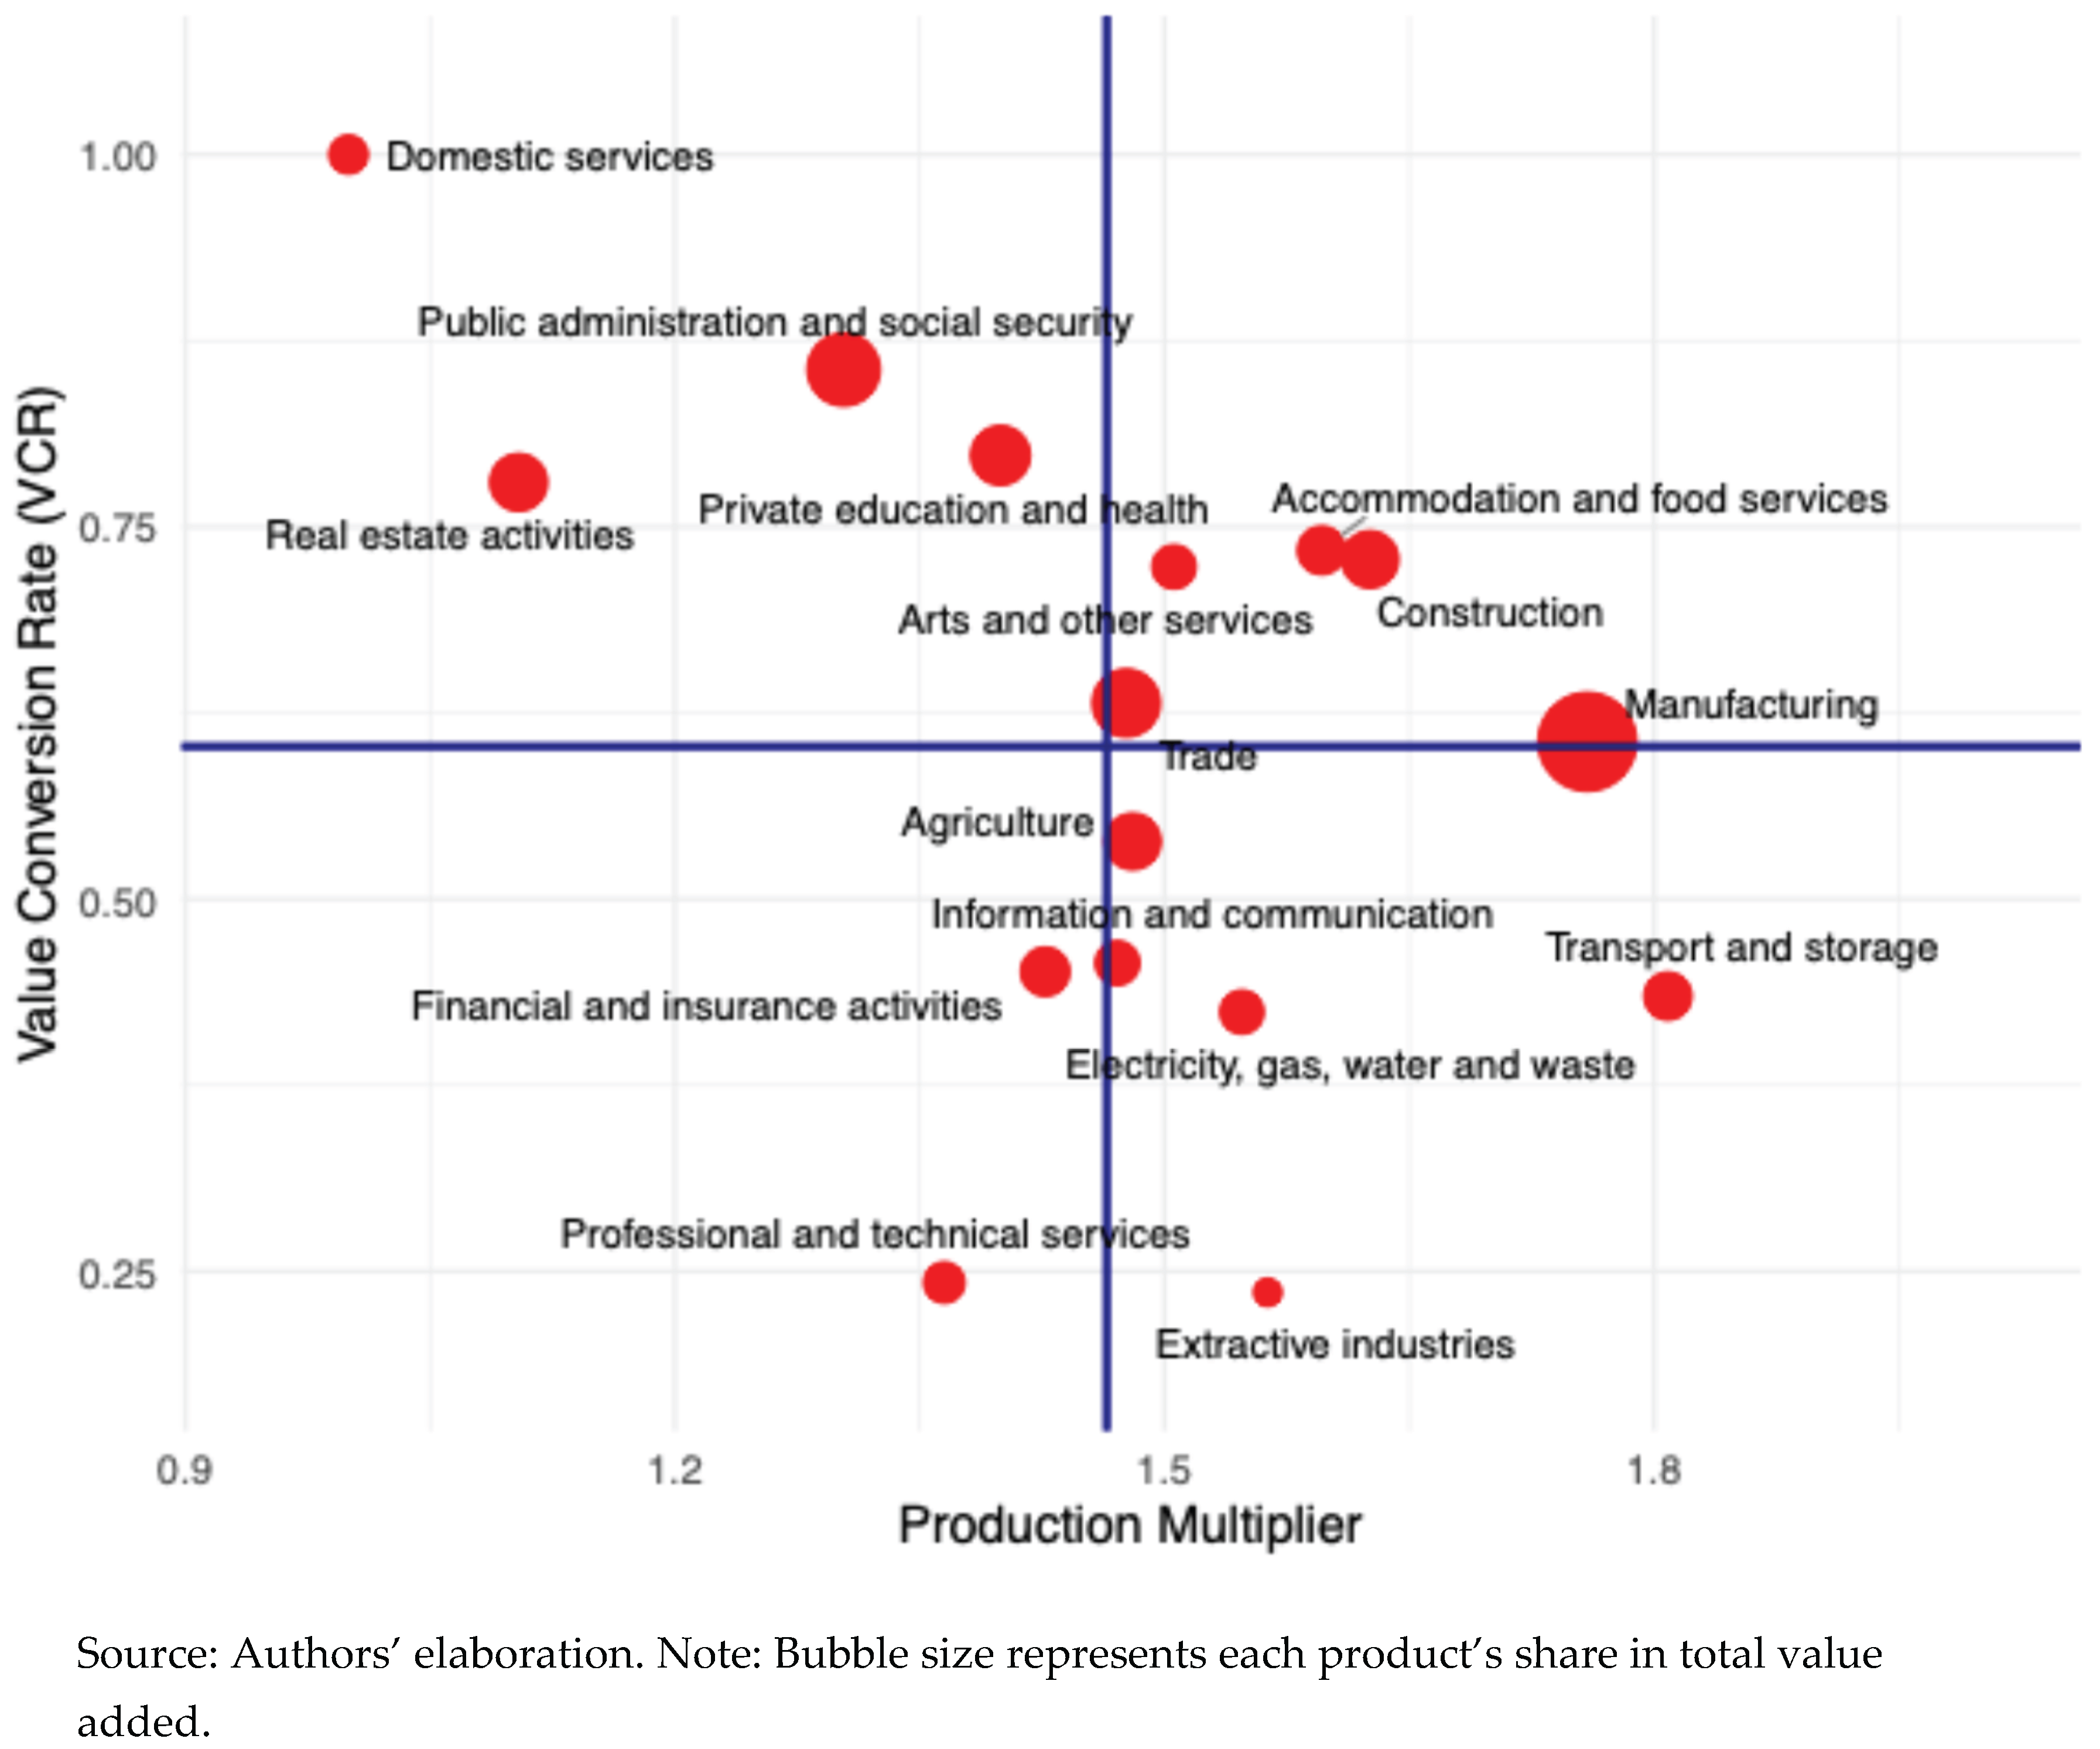

Table 1.
Product Rankings, Multipliers, and VCR.
| Products | Ranking | Value Added Share | ||
| Production Multiplier |
Value Added Multiplier | VCR | ||
| Domestic services | 16 | 7 | 1 | 0.8% |
| Public administration and social security | 14 | 4 | 2 | 13.9% |
| Private education and health | 12 | 3 | 3 | 6.9% |
| Real estate activities | 15 | 9 | 4 | 6.0% |
| Accommodation and food services | 4 | 2 | 5 | 2.9% |
| Construction | 3 | 1 | 6 | 5.9% |
| Arts and other services | 7 | 5 | 7 | 1.8% |
| Trade | 9 | 8 | 8 | 11.1% |
| Manufacturing | 2 | 6 | 9 | 34.5% |
| Agriculture | 8 | 10 | 10 | 5.6% |
| Information and communication | 10 | 12 | 11 | 1.9% |
| Financial and insurance activities | 11 | 14 | 12 | 3.1% |
| Transport and storage | 1 | 11 | 13 | 2.7% |
| Electricity, gas, water and waste | 6 | 13 | 14 | 1.7% |
| Professional and technical services | 13 | 16 | 15 | 1.2% |
| Extractive industries | 5 | 15 | 16 | 0.0% |
Source: Authors’ elaboration.
Disclaimer/Publisher’s Note: The statements, opinions and data contained in all publications are solely those of the individual author(s) and contributor(s) and not of MDPI and/or the editor(s). MDPI and/or the editor(s) disclaim responsibility for any injury to people or property resulting from any ideas, methods, instructions or products referred to in the content. |
© 2026 by the authors. Licensee MDPI, Basel, Switzerland. This article is an open access article distributed under the terms and conditions of the Creative Commons Attribution (CC BY) license (http://creativecommons.org/licenses/by/4.0/).
Copyright: This open access article is published under a Creative Commons CC BY 4.0 license, which permit the free download, distribution, and reuse, provided that the author and preprint are cited in any reuse.